HAL Id: hal-02742497
https://hal.inrae.fr/hal-02742497
Submitted on 3 Jun 2020
HAL is a multi-disciplinary open access
archive for the deposit and dissemination of
sci-entific research documents, whether they are
pub-lished or not. The documents may come from
teaching and research institutions in France or
abroad, or from public or private research centers.
L’archive ouverte pluridisciplinaire HAL, est
destinée au dépôt et à la diffusion de documents
scientifiques de niveau recherche, publiés ou non,
émanant des établissements d’enseignement et de
recherche français ou étrangers, des laboratoires
publics ou privés.
Trade-off between grain weight and grain number and
key traits for increasing potential grain weight in
CIMCOG population
Alejandro Quintero, Gemma Molero, Matthew Reynolds, Jacques Le Gouis,
Daniel F. Calderini
To cite this version:
Alejandro Quintero, Gemma Molero, Matthew Reynolds, Jacques Le Gouis, Daniel F. Calderini.
Trade-off between grain weight and grain number and key traits for increasing potential grain weight
in CIMCOG population. 4. International Workshop of the Wheat Yield Consortium, Mar 2014,
Obregón, Mexico. 205 p. �hal-02742497�
Proceedings of the 4
thInternational Workshop
of the
Wheat Yield Consortium
CENEB, CIMMYT, Cd. Obregón, Sonora, Mexico(24-25th March, 2014)
Matthew Reynolds, Gemma Molero, Emma Quilligan, Mike Listman and Hans Braun (Editors)
Sponsored by
The International Maize and Wheat Improvement Center, known by its Spanish acronym, CIMMYT®
(www.cimmyt.org), is a not-for-profit research and training organization with partners in over 100 countries. The center works to sustainably increase the productivity of maize and wheat systems and thus ensure global food security and reduce poverty. The center’s outputs and services include improved maize and wheat varieties and cropping systems, the conservation of maize and wheat genetic resources, and capacity building.
CIMMYT belongs to and is funded by the Consultative Group on International Agricultural Research (CGIAR) (www.cgiar.org) and also receives support from national governments, foundations, development banks, and other public and private agencies. CIMMYT is particularly grateful for the generous, unrestricted funding that has kept the center strong and effective over many years.
© International Maize and Wheat Improvement Center (CIMMYT) 2014. All rights reserved. The designations employed in the presentation of materials in this publication do not imply the expression of any opinion whatsoever on the part of CIMMYT or its contributory organizations concerning the legal status of any country, territory, city, or area, or of its authorities, or concerning the delimitation of its frontiers or boundaries. CIMMYT encourages fair use of this material. Proper citation is requested.
Correct citation: Reynolds M, et al, (2014). Proceedings of the 4th International Workshop of the Wheat Yield
Consortium. CENEB, CIMMYT, Cd. Obregón, Sonora, Mexico, 24-25 March 2014. Mexico, DF.: CIMMYT.
Abstract: The abstracts herein are of presentations by crop experts for the “4th International Workshop of the
Wheat Yield Consortium”. Sponsored by SAGARPA’s international strategic component for increasing wheat performance, under the Sustainable Modernization of Traditional Agriculture Program (MasAgro); and GRDC, Australia.
The event covers innovative methods to significantly raise wheat yield potential, including making photosynthesis more efficient, improving adaptation of flowering to diverse environments, addressing the physical processes involved in lodging, and physiological and molecular breeding. The workshop represents the current research of the International Wheat Yield Consortium that involves scientists working on all continents to strategically integrate research components in a common breeding platform, thereby speeding the delivery to farmers of new wheat genotypes.
Table of Contents
Program ... ... ... ... ... ... ... ... ... ... ... ... ... ... ... ... ... ... ... ... ... ... ... ... ... ... v List of Participants .. ... ... ... ... ... ... ... ... ... ... ... ... ... ... ... ... ... ... ... ... ... ... ... vii Genetic improvement of wheat yield potential and the Wheat Yield Consortium (WYC) .... ... ... ... ... ... ... ... ix M.P. Reynolds and H.J. Braun
BREEDING AND PHENOTYPING
Evaluation of CIMMYT and INIFAP elite lines in different agroclimatic zones representative of
wheat production in Mexico .... .... .... .... .... .... .... .... .... .... .... .... .... .... .... .... .... .... .... .... .... .... .... 1 Ernesto Solís et al.
Improving Genetic Yield Potential of Wheat in India ... .... .... .... .... .... .... .... .... .... .... .... .... .... .... .... .... .... 13 Indu Sharma et al.
Identification of QTL for improving yield potential in wheat ... .... .... .... .... .... .... .... .... .... .... .... .... .... .... .... 14 Zhonghu He et al.
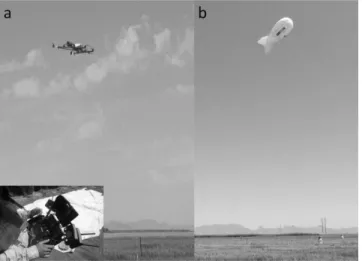
High throughput phenotyping at MEXPLAT: A comparison of proximal and remote sensing approaches .... .... .... .... 16 Maria Tattaris et al.
Update on genetic resource development for the Wheat Yield Network .... .... .... .... .... .... .... .... .... .... .... .... .... 29 Simon Orford et al.
Marker discovery associated with yield potential in a Wheat Association Mapping Initiative (WAMI) population .... .... 35 Sivakumar Sukumaran et al.
Pre-Breeding for Yield Potential: Results of the 1st and 2nd WYCYT . .... .... .... .... .... .... .... .... .... .... .... .... .... 44 M.P. Reynolds et al.
HARVEST INDEX AND LODGING RESISTANCE
Genetic variation in total, soluble and structural DM partitioning among plant organs and association with
harvest index in elite spring wheat lines .... .... .... .... .... .... .... .... .... .... .... .... .... .... .... .... .... .... .... .... 53 Carolina Rivera-Amado et al.
Quantifying source:sink balance and associated traits in a panel of modern spring wheat genotypes .. .... .... .... .... .... 73 Eliseo Trujillo-Negrellos et al.
Dynamics of floret development determining differences in spike fertility in a set of wheat elite lines .... .... .... .... .... 90 Oscar E. González-Navarro et al.
Improving spike fertility and plant development by modifying sensitivity to environmental cues .... .... .... .... .... .... 101 Arnauld Thiry et al.
Phenotypic selection for spike ethylene . .... .... .... .... .... .... .... .... .... .... .... .... .... .... .... .... .... .... .... .... .... 109 Ravi Valluru et al.
Trade-off between grain weight and grain number and key traits for increasing potential grain
weight in CIMCOG population . .... .... .... .... .... .... .... .... .... .... .... .... .... .... .... .... .... .... .... .... .... .... 114 Alejandro Quintero et al.
Methods for rapidly measuring lodging traits in wheat . .... .... .... .... .... .... .... .... .... .... .... .... .... .... .... .... .... 122 S. Kendall et al.
Designing an ideotype for lodging-proof spring wheat . .... .... .... .... .... .... .... .... .... .... .... .... .... .... .... .... .... 127 F. J. Piñera-Chavez et al.
PHOTOSYNTHESIS
Determining Rubisco kinetic data from diverse Triticeae species ... .... .... .... .... .... .... .... .... .... .... .... .... .... .... 133 Anneke Prins et al.
Optimizing RuBP regeneration to increase photosynthetic capacity .... .... .... .... .... .... .... .... .... .... .... .... .... .... 138 Martin Parry et al.
Improving the thermal stability of Rubisco activase .... .... .... .... .... .... .... .... .... .... .... .... .... .... .... .... .... .... 141 Elizabete Carmo-Silva et al.
Genetic variation in photosynthetic capacity and efficiency of wheat for increased yield potential .... .... .... .... .... .... 145 Viridiana Silva-Pérez et al.
Leaf hyperspectral reflectance spectra as a tool to measure photosynthetic characters in wheat .... .... .... .... .... .... .... 154 Viridiana Silva-Pérez et al.
Screening mesophyll conductance to improve wheat photosynthesis ... .... .... .... .... .... .... .... .... .... .... .... .... .... 159 Luis Robledo-Arratia et al.
Photosynthetic contribution of the ear to grain filling in wheat: A comparison of different
methodologies for evaluation .... .... .... .... .... .... .... .... .... .... .... .... .... .... .... .... .... .... .... .... .... .... .... 163 Rut Sanchez-Bragado et al.
Spike photosynthesis contribution to grain yield and identification of molecular markers:
A potential trait for breeding programs? .... .... .... .... .... .... .... .... .... .... .... .... .... .... .... .... .... .... .... .... 175 Gemma Molero et al.
Genotypic variation in light interception and radiation use efficiency: A comparison of two
different planting systems ... .... .... .... .... .... .... .... .... .... .... .... .... .... .... .... .... .... .... .... .... .... .... .... 187 Cándido López-Castañeda et al.
Monday 24th March, Sala Ruan, La Salle University Speaker Time
Welcome to the 4th WYC Workshop Hans Braun & Victor Kommerell 8:00
BREEDING AND PHENOTYPING (Chair Mohammad Reza Jalal Kamali)
Evaluation of CIMMYT and INIFAP elite lines in different agroclimatic zones in Mexico Pedro Figueroa 8:15
Improving Genetic Yield Potential of Wheat in India Indu Sharma 8:30
Improvement of wheat yield potential in China Zhonghu He 8:45
High Throughput Phenotyping at MEXPLAT: Comparison of proximal & remote sensing Maria Tattaris 9:00 Update on Genetic Resource Development for the Wheat Yield Network Simon Griffiths 9:15 Marker Discovery in the Wheat Association Mapping Initiative (WAMI) panel Sivakumar Sukumaran 9:30 Pre-Breeding for Yield Potential: Results of the 1st and 2nd WYCYT Matthew Reynolds 9:45
Discussion 10:00
COFFEEE BREAK 10:30
HARVEST INDEX AND LODGING RESISTANCE (Chair Alain Murigneux)
Enhancing harvest Index by optimising whole plant partitioning and source:sink John Foulkes 11:00 Dynamics of floret development determining differences in spike fertility Gustavo Slafer 11;15 Improving spike fertility by modifying sensitivity to environmental cues William Davies 11:30 Trade-off between grain weight and number for increasing potential grain weight Jacques le Gouis 11:45
Methods for rapidly measuring lodging traits in wheat Sarah Kendall 12:00
Designing an ideotype for lodging-proof spring wheat Pete Berry 12:15
Discussion 12:30
LUNCH BREAK 1:00
PHOTOSYNTHESIS (Chair Raju Datla)
Determining Rubisco kinetic data from diverse Triticeae species Anneke Prins 2:00 Optimizing RuBP regeneration to increase photosynthetic capacity Elizabete Carmo-Silva 2:15 Improving the thermal stability of Rubisco activase Elizabete Carmo-Silva 2:30
Screening wheat genotypes for variation in photosynthesis John Evans 2:45
Screening mesophyl conductance to improve wheat photosynthesis Luis Robledo-Arratia 3:00 Photosynthetic contribution of the ear to grain filling: comparison of methodologies Jose Luis Araus 3:15 Spike photosynthesis contribution to yield and identification of molecular markers Gemma Molero 3:30 Genotypic variation in light interception and radiation use efficiency Gemma Molero 3:45
COFFEEE BREAK 4:00
Facilitated Discussion (Facilitators: Claus Frohberg and Pete Berry) WYC Group 4:30
Close 5:45
Dinner in Los Arbolitos (bus will leave at 6:45) 7:00
Tuesday 25th March, CENEB Station
PRESENTATION of MasAgro PHD Projects (Introducer: John Foulkes)
Mesophyl conductance, a way to increase yield potential Luis Robledo-Arratia 4:00 Enhancing harvest index by optimizing source-sink balance and associated traits Eliseo Trujillo-Negrellos 4:20 Identifying physiological traits to optimize assimilate partitioning among plant
organs and spike fertility in wheat Carolina Rivera-Amado 4:40
Working at the physiology/genetics interface: A route from CIMCOG to cloned genes. Oscar E. González-Navarro 5:00 Improving spike fertility by modifying sensitivity to environmental cues Bill Davies (for A Thiery) 5:20 Designing an ideotype for lodging-proof spring wheat Francisco J. Piñera-Chavez 5:40
Carne Asada at CENEB 6:00
ALDERMAN Phillip CIMMYT México
Email: phillip.d.alderman@gmail.com ARAUS Jose Luis Universitat de Barcelona Spain Email: jaraus@ub.edu BERRY Pete ADAS UK United Kingdom Email: pete.berry@adas.co.uk BONNETT David CIMMYT México Email: d.bonnett@cgiar.org BRAUN Hans CIMMYT México Email: h.j.braun@cgiar.org CARMO-SILVA Elizabeth Rothamsted United Kingdom Email: elizabete.carmo-silva@rothamsted.ac.uk CHAVEZ Perla CIMMYT México Email: p.chavez@cgiar.org COSSANI Mariano Cesar CIMMYT
México
Email: c.cossani@cgiar.org CRAIN Jared
Kansas State University USA Email: jcrain@ksu.edu CURIEL Ricardo CIMMYT México Email: R.Curiel@cgiar.org DATLA Raju NRC Canada Email: raju.datla@nrc-cnrc.gc.ca DAVIES William Lancaster University United Kingdom Email: w.davies@lancaster.ac.uk ESFANDYARIPOUR Esmaeil Ministry of Jihad-e-Agriculture Iran
ESMAEILZADEH MOGHADDAM Mohsen Cereal Research Department, SPII Iran EVANS John ANU Australia Email: john.evans@anu.edu.au FIGUEROA Pedro INIFAP México Email: figueroa.pedro@inifap.gob.mx FOULKES John University of Nottingham United Kingdom Email: john.foulkes@nottingham.ac.uk
List of participants Wheat Yield Consortium Workshop
CIMMYT – Cd. Obregón, Son. March 24-25 2014FROHBERG Claus Bayer Germany
Email: claus.frohberg@bayer.com GIZAW Shiferaw
Washington State University USA
Email: shiferaw.gitaw@wsu.edu GRIFFITHS Simon
John Innes Centre United Kingdom
Email: simon.griffiths@bbsrc.ac.uk GONZALEZ Oscar
University of East Anglia México Email: Oscar.Gonzalez@jic.ac.uk HE Zhonghu CIMMYT China Email: z.he@cgiar.org JACKSON Vicky BBSRC United Kingdom Email: Vicky.Jackson@bbsrc.ac.uk JACOBI Nina CIMMYT Mexico Email: N.Jakobi@cgiar.org JALAL-KAMALI M.R. CIMMYT Iran Email cimmyt-iran@cgiar.org JOSHI, Krishna CIMMYT Pakistan Email: K.D.JOSHI@cgiar.org KENDALL SARAH ADAS UK United Kingdom Email: Sarah.Kendall@adas.co.uk KOMMERELL Victor CIMMYT México Email: v.kommerell@cgiar.org KING Ian University of Nottingham United Kingdom Email: Ian.King@nottingham.ac.uk LE GOUIS Jacques
INRA UMR GDEC France Email: Jacques.legouis@clermont.inra.fr MICHIELS An BAYER Germany Email: an.michiels@bayer.com MOJERLOU Shideh
Tarbiat Modares University, Tehran Iran MOLERO Gemma CIMMYT México Email: g.molero@cgiar.org MORGOUNOV Alexei CIMMYT Turkey Email a.morgounov@CGIAR.ORG MUMFORD Cathy
John Innes Centre United Kingdom Email: Cathy.Mumford@jic.ac.uk MURIGNEUX Alain Limagrain France Email: alain.murigneux@limagrain.com. NAJAFIAN Goodarz
Cereal Research Department, SPII Iran
NELSON Jenny CIMMYT México
Email: j.nelson@cgiar.org PARRY Martin A.J. Rothamsted Research United Kingdom
Email: martin.parry@bbrsc.ac.uk OFORD Simon
John Innes Centre United Kingdom Email: simon.orford@jic.ac.uk PRINS Anneke Rothamsted Research United Kingdom Email: anneke.prins@rothamsted.ac.uk PINTO Susuky University of Adelaide México Email: suzukypinto@acpfg.com.au PIÑERA Francisco University of Nottingham México Email: parraleco@hotmail.com REYNOLDS Matthew CIMMYT México Email: m.reynolds@cgiar.org RIVERA Carolina Alma University of Nottingham México Email: arivera.cimmyt@gmail.com ROBLEDO Luis University of Cambridge México Email: luis.gbp@gmail.com ROOSTAEI Mozaffar
Head of Cereal Research Department, DARI Iran SANCHEZ Ruth Universitat de Barcelona Spain Email: rutsanbr@gmail.com SHARMA Indu
Directorate of Wheat Research India
Email: indu.dwr@icar.org.in
SILVA PEREZ Viridiana Australian National University México Email: viridiana.silva@anu.edu.au SLAFER Gustavo University of Lleida Spain Email: slafer@pvcf.udl.cat SNAPE John
John Innes Centre United Kingdom Email: john.snape@bbrsc.ac.uk SUKUMARAN Sivakumar CIMMYT México Email: s.sukumaran@cgiar.org TABIB GHAFFARY Seyed
Safiabad Agriculture Research Center, Dezfoul Iran TATTARIS Maria CIMMYT México Email: m.tattaris@cgiar.org THIRY Arnauld Lancaster University México Email: a.thiry_cimmyt@yahoo.com TRUJILLO Eliseo
The University of Nottingham México Email: Eliseo.Trujillo@nottingham.ac.uk VALLURU Ravi CIMMYT México Email: r.valluru@cgiar.org VANDERAUWERA Sandy Bayer Germany Email: sandy.vanderauwera@bayer.com VAUGHAN Simon Rothamsted United Kindgom Email: simon.vaughan@rothamsted.ac.uk VISSCHER STEVE BBSRC United Kingdom Email: Steve.Visscher@bbsrc.ac.uk WANG Demei
Chinese Academy of Agricultural Sciences China Email: dmwang312@163.com YAHYAOUI Amor CIMMYT México Email: Ah.Yahyaoui@cgiar.org YING GANG Hu
College of Agronomy Northwest A & F University China
Email: huyingang@126.com ZAND Eskandar
Agricultural Research, Education and Extension Organization (AREEO)
Genetic improvement of wheat yield potential and the
Wheat Yield Consortium (WYC)
M.P. Reynolds and H.J. Braun CIMMYT
CIMMYT’s wheat breeding effort has always emphasized yield potential and stability, and with considerable success to date (Sayre et al. 1997; Sharma et al. 2012). Interest in applying novel techniques in order to accelerate yield potential began with consultation of experts under Sanjay Rajaram’s leadership in 1996 (Reynolds et al. 1996). Then in late 2008, with the reformation of the CGIAR underway, CIMMYT Director General Thomas Lumpkin requested that the Global Wheat Program initiate a major global initiative on raising wheat yield potential in order to address the joint challenges of growing worldwide demand, climate change, and a declining natural resource base.
This resulted in the inaugural meeting of the Wheat Yield Consortium in 2009 (Reynolds and Eaton 2009) to which over 60 international experts were invited to present their ideas. The main output of this consultancy was the development of a preliminary research proposal, presented at the 1st WYC Workshop in 2011. The development of this initiative also considered previous consultation with national wheat programs worldwide (Kosina et al. 2007; Reynolds et al. 2008), and was supported by several research councils including, BBSRC of UK, USAID in US, GRDC of Australia, SAGARPA of Mexico, as well as the CGIAR Research Program WHEAT. The main scientific approaches of the WYC have been (i) increasing photosynthetic capacity, (ii) optimized partitioning to ensure high and stable expression of harvest index and lodging resistance across a range of environments, and (iii) the application of the latest breeding technologies to bring these traits into harmony in acceptable agronomic backgrounds. Full scientific details of the strategy were published in international peer-reviewed journals (Foulkes et al. 2011; Parry et al. 2011; Reynolds et al. 2011, 2012).
Financial contribution from Mexico’s SAGARPA – through the MasAgro initiative – was used among other things to support the establishment in Sonora, Mexico, of a dedicated field phenotyping and breeding platform (MEXPLAT) in 2011 to serve as the central hub for international wheat yield potential research, supported by standardized phenotyping techniques, many of which were developed or refined at this site (Pask et al. 2012; Reynolds et al. 2012). This is in large part because of the strategic relevance of the environment in terms of being representative of spring wheat regions worldwide, as demonstrated by extensive international testing over half a century (Braun et al. 2010). The MEXPLAT has been used for research into wheat yield potential – largely funded by SAGARPA – in a range of areas including novel work on the contribution of spike photosynthesis to yield potential; detailed characterization for the first time of the mechanical lodging characteristics of elite CIMMYT germplasm; work illustrating the evolving pattern of source:sink balance in modern wheat lines; and the testing and establishment of high-throughput phenotyping protols using the latest remote sensing technology. These and other results, including breeding progress in several partner countries such as China, India, and Mexico, are described in the proceedings of the 2nd, 3rd, and 4th WYC Workshops (see citations below and these proceedings).
Support from the Mexican Government through CONACYT and SAGARPA has also enabled the training of eight Mexican scientists at PhD level in universities in Australia, Chile, Spain, UK, and USA, as well as at MEXPLAT. Their research results are presented in these and earlier proceedings.
A pre-breeding program for yield potential was initiated in 2008 that has profited from many of these outputs in terms of parental and progeny selection and resulted in the delivery of the 1st Wheat Yield Consortium Yield Trial (1st WYCYT), consisting of 23 novel genotypes that were grown internationally at 25 sites in 2013. Results of the
WYCYT trials provide a first proof of concept that yield potential can be increased through deterministic crosses based on physiological dissection of yield potential traits. The results were especially promising in terms of increased biomass and radiation use efficiency. Averaging over international trials, the best lines expressed almost 20% more biomass than local checks (see these proceedings).
Such precedents have led to the establishment of the International Wheat Yield Improvement Partnership (IWYP) that will be launched this week at the Borlaug Summit on Wheat for Food Security, thus concluding the WYC, many of whose activities will be incorporated into IWYP.
References
Braun H. J., Atlin G. and Payne T. (2010) Multi-location testing as a tool to identify plant response to global climate change. In M. P. Reynolds (Ed.), Climate Change and Crop Production. UK: CABI Climate Change Series pp. 115-138.
Foulkes MJ, Slafer GA, Davies WJ, Berry PM, Sylvester-Bradley R, Martre P, Calderini DF, Griffiths S, Reynolds MP, 2011. Raising yield potential of wheat. III. Optimizing partitioning tograin while maintaining lodging resistance Journal of Experimental Botany 62:469-486.
Kosina P, M Reynolds, J Dixon, A Joshi, 2007. Stakeholder perception of wheat production constraints, capacity building needs, and research partnerships in developing countries. Euphytica. 157 (3) 475-483.
Parry MAJ, Reynolds MP, Salvucci ME, Raines C, Andralojc PJ, Zhu XG, Price GD, Condon AG, Furbank RT, 2011. Raising yield potential of wheat. II. Increasing photosynthetic capacity and efficiency. J. Experimental Botany 62:453–467.
Pask, AJD., Pietragalla, J., Mullan DM. and Reynolds, MP. (Eds.) (2012) Physiological Breeding II: A Field Guide to Wheat Phenotyping. Mexico, D.F.: CIMMYT
Reynolds, M.P., Rajaram, S., McNab, A. (Eds.) 1996. Raising Yield Potential in Wheat: Breaking the Barriers. CIMMYT, Mexico D.F.
Reynolds MP, Pietraglla J, Braun H, 2008. (Eds) International Symposium on Wheat Yield Potential: Challenges to International Wheat Breeding. CIMMYT, Mexico City
Reynolds M and Eaton D (2009). Complementary Strategies to Raise Wheat Yield Potential. Abstracts of workshop held at CIMMYT, El Batán, Mexico, 10-13 November 2009. Mexico, DF.: CIMMYT
Reynolds MP, Bonnett D, Chapman SC, Furbank RT, Manes Y, Mather DE, Parry MAJ, 2011. Raising yield potential of wheat. I. Overview of a consortium approach and breeding strategies. J. Expt Botany 62: 439–452
Reynolds MP, Mullan D, Braun HJ, 2011. Proceedings of the 1st International Workshop of the Wheat Yield Consortium. CENEB, CIMMYT, Cd. Obregón, Sonora, Mexico, 1-3 March 2011. Mexico, DF.: CIMMYT”.
Reynolds M.P., Foulkes J., Furbank R., Griffiths S., King J., Murchie E., Parry M. and Slafer G. (2012). Achieving yield gains in wheat. Plant Cell and Environment 35: 1799–1823.
Reynolds, MP., Pask, AJD. and Mullan DM. (Eds.) (2012) Physiological Breeding I: Interdisciplinary Approaches to Improve Crop Adaptation. Mexico, D.F.: CIMMYT.
Reynolds MP, Braun HJ, Quilligan E (2012). Proceedings of the 2nd International workshop of the wheat yield consortium II. CENEB, CIMMYT, Cd. Obregon Sonora, Mexico; 12-15 March 2012; 2012. Mexico, DF (Mexico): CIMMYT , 50 p. Reynolds M, Braun H, (2013). Proceedings of the 3rd International Workshop of the Wheat Yield Consortium. CENEB, CIMMYT,
Cd. Obregón, Sonora, Mexico, 5-7 March, 2013. Mexico, DF.: CIMMYT
Sayre K.D., Rajaram S. and Fischer R.A. (1997) Yield potential progress in short bread wheats in northwest Mexico. Crop Science 37: 36–42.
Sharma R.C., Crossa J., Velu G., Huerta-Espino J., Vargas M., Payne T.S. & Singh R.P. Genetic gains for grain yield in CIMMYT spring bread wheat across international environments, 2012. Crop Science 52(4):1522-1533.
Evaluation of CIMMYT and INIFAP elite lines in different agroclimatic zones
representative of wheat production in Mexico
Ernesto Solís1, Pedro Figueroa López2, Gemma Molero3 and Matthew P. Reynolds3
1INIFAP, Guanajuato, Mexico; 2INIFAP, Sonora, Mexico; CIMMYT-Mexico Abstract
In order to identify wheat genotypes with the potential to increase grain yields in representative growing areas of Mexico, different elite material was evaluated under irrigation during the 2011-12 and 2012-13 crop cycles. Thirty lines were evaluated during the two growing seasons, with additional lines incorporated for evaluation during the 2012-13 cycle, including the most recent material from INIFAP breeding programs. The test sites were Guanajuato, Jalisco, Sonora, Sinaloa, Baja California, and Chihuahua (all in Mexico). Agronomic management was that recommended by INIFAP for each location. Plant height, phenology, and yield and its components were measured. The analysis of variance detected highly significant differences between genotypes and locations for all agronomical traits. Baja California was the site with higher yields and cycle length, as well as a higher number of grains per square meter. The genotype with the highest average yield was entry 53 (COLIBRI / MONARCH F2007), with 5966
kg ha-1; the lowest performing line was entry 11, with 4134 kg ha-1. AMMI analysis showed that the most stable
genotypes had intermediate yields. Based on the generally good performance achieved with different strategies in terms of yield components, specific genotypes were identified as candidates for complementary crossing programs to further increase yield potential for Mexican environments.
Introduction
Grain crops are the staple foods worldwide, especially in developing countries (Fischer and Edmeades 2010). Increasing populations and the negative effects of climate change create an unprecedented challenge to food security. Wheat scientists and agricultural experts from various private and public institutions are coming together in a collaborative network to increase wheat yield potential, originally named the Wheat Yield Consortium (WYC). The challenge will be to improve genetic wheat yield potential by an average of 1.6 % per year, to meet a projected demand of 760 million tons worldwide by 2020.
The WYC is coordinated by the International Maize and Wheat Improvement Center (CIMMYT) and has been sponsored by the Mexican Secretary of Agriculture (SAGARPA) through the MasAgro project. One of the main focuses of the project has been increasing wheat production in Mexico. Wheat accounts for 40% of total cereal expenditure for Mexican households, providing 10% of total dietary calories. The domestic consumption of wheat reached 6.1 million tons (MT) in 2012; 58% of which was imported (4.6 MT) while national production stood at 3.2 MT (SIAP 2013). This places Mexico among the 10 largest importers of wheat worldwide, representing a cost of 20 billion pesos per year (CANIMOLT 2013). The projected demand for wheat in Mexico estimates an increase in total wheat consumption of 21% by 2015, 31% by 2020 and 55% by 2030 (CANIMOLT 2013). Under this scenario, it is important to unite international and national efforts to raise yield potential in order to contribute to further increasing Mexico’s wheat production.
To do so, the National Institute of Forestry, Agriculture and Livestock (INIFAP) collaborates with CIMMYT in evaluating elite genotypes in different agro-climatic zones representative of wheat production in Mexico. The aim is to identify outstanding lines in yield and biomass with the objective to further incorporate these lines into national breeding programs to potentially contribute to increase wheat production in Mexico. During the 2011-12 and 2012-13 growing cycles, CIMMYT and INIFAP elite lines were evaluated in six Mexican (INIFAP) experimental sites.
Materials and Methods
Plant material and experimental conditions
Two different experiments were conducted during the 2011-12 and 2012-13 growing cycles in six different experimental sites in the states of Guanajuato, Jalisco, Sonora, Sinaloa, Baja California, and Chihuahua (Table 1). The CIMMYT Core Germplasm (CIMCOG) panel, comprising 60 lines, was evaluated during the 2011-12 growing season; details of the experiment and main results were presented in Chavez et al.(2013). During 2012-13 an additional panel (CIMCOG-INIFAP) was studied, including 30 lines selected from the main CIMCOG panel, additional lines from the 1st WYCYT (Wheat Yield Consortium Yield Trial), and 9 lines from INIFAP breeding programs (Table 2). Researchers participating in this initiative are presented in Table 1. Locations and agronomic management of each site are presented also in Tables 1 and 3. In all experiments, appropriate fertilization, weed disease and pest control were implemented to avoid yield limitations.
Table 1. Site and details of the experimental sites where genotypes were evaluated during 2011-13 autumn-winter
cycles. Researchers in charge of the experiments at each INIFAP experimental station are shown in the table.
Site Coord. masl (m) Researcher Location
Baja
California 32o18’N 115o4W 8.6
M.C. Jorge Iván Alvarado Padilla
Campo Experimental Valle De Mexicali. Carretera a San Felipe Km. 7.5. Mexicali, Baja California Chihuahua 28105o10’N o29W 1178 Dr. Víctor Manuel Hernández Muela
Campo Experimental Delicias. Km. 2. Carretera Delicias-Rosales, Cd. Delicias, Chihuahua
Guanajuato 20o32’N
100o49W 1752
Dr. Ernesto Solís Moya
Campo Experimental Bajío Km 6.5 Carr. Celaya-San Miguel de Allende, Celaya, Guanajuato
Jalisco 21o18’N
102o30W 1541
M.C. Javier Ireta Moreno
Campo Experimental Centro-Altos de Jalisco. Km 8 carretera Tepatitlán-Lagos de Moreno,
Tepatitlán, Jalisco
Sinaloa 25o45’N
108o48W 14 M.C. Alberto Borbón Gracia Campo Experimental Valle del Fuerte. Carretera México – Nogales, Km 1609. Los Mochis, Sinaloa
Sonora 32o18’N115o4W 37 Dr. Pedro
Figueroa López
Campo Experimental N.E. Borlaug. Km 12 Carretera Dr. Norman Borlaug. Ciudad Obregón, Sonora
Table 2. Name of genotypes evaluated in the CIMCOG-INIFAP trial during the 2012-13 autumn-winter
season, at six locations in Mexico. Details of the origin of the genotypes (CIMCOG, 1st WYCYT, or INIFAP) are shown in brackets
Entry Num. Cross Name
1 BABAX/LR42//BABAX/3/VORB (CIMCOG) 2 BACANORA T 88 (CIMCOG) 3 BCN/RIALTO (CIMCOG) 4 BECARD (CIMCOG) 5 BECARD/KACHU (CIMCOG) 6 BRBT1*2/KIRITATI (CIMCOG)
8 SAUAL/WHEAR//SAUAL (CIMCOG)
9 CMH79A.955/4/AGA/3/4*SN64/CNO67//INIA66/5/NAC/6/RIALTO (CIMCOG) 10 CIRNO C 2008 (CIMCOG)
11 CNO79//PF70354/MUS/3/PASTOR/4/BAV92*2/5/FH6-1-7 (CIMCOG)
12 CROC_1/AE.SQUARROSA (205)//BORL95/3/PRL/SARA//TSI/VEE#5/4/FRET2 (CIMCOG) 13 KINGBIRD #1//INQALAB 91*2/TUKURU (CIMCOG)
14 KFA/3/PFAU/WEAVER//BRAMBLING/4/PFAU/WEAVER*2//BRAMBLING (CIMCOG) 15 MILAN/KAUZ//PRINIA/3/BAV92 (CIMCOG) 16 PAVON F 76 (CIMCOG) 17 PBW343*2/KUKUNA*2//FRTL/PIFED (CIMCOG) 18 PFAU/SERI.1B//AMAD/3/WAXWING (CIMCOG) 19 SERI M 82 (CIMCOG)
20 SIETE CERROS T66 (CIMCOG)
21 SOKOLL//PBW343*2/KUKUNA/3/ATTILA/PASTOR (CIMCOG)
22 TACUPETO F2001/SAUAL/4/BABAX/LR42//BABAX*2/3/KURUKU (CIMCOG) 23 TACUPETO F2001/BRAMBLING*2//KACHU (CIMCOG)
24 TC870344/GUI//TEMPORALERA M 87/AGR/3/2*WBLL1 (CIMCOG) 25 TRAP#1/BOW/3/VEE/PJN//2*TUI/4/BAV92/RAYON/5/KACHU #1 (CIMCOG)
26 UP2338*2/3/SNI/TRAP#1//KAUZ*3/TRAP/4/MILAN/KAUZ//CHIL/CHUM18/5/UP2338*2/3/SNI/TRAP#1//KAUZ*3/TRAP (CIMCOG) 27 BECARD (CIMCOG)
28 WBLL1*2/4/BABAX/LR42//BABAX/3/BABAX/LR42//BABAX (CIMCOG) 29 WBLL1*2/KURUKU*2/5/REH/HARE//2*BCN/3/CROC_1/AE.SQUARROSA (213)//PGO/4/HUITES (CIMCOG)
30 YAV_3/SCO//JO69/CRA/3/YAV79/4/AE.SQUARROSA (498)/5/LINE 1073/6/KAUZ*3/4/CAR//KAL/BB/3/NAC/7/KRONSTAD F2004/8/KAUZ/PASTOR//PBW343 (CIMCOG) 31 SAUAL #1 (1st WYCYT) 32 WHEAR/KUKUNA/3/C80.1/3*BATAVIA//2*WBLL1 (1st WYCYT) 33 BCN/WBLL1//ROLF07 (1st WYCYT)
34 WBLL1//YANGLING SHAANXI/ESDA/3/ROLF07 (1st WYCYT) 35 BCN/RIALTO//ROLF07 (1st WYCYT) 36 CMH79A.955/4/AGA/3/4*SN64/CNO67//INIA66/5/NAC/6/RIALTO/7/ROLF07 (1st WYCYT) 37 CMH79A.955/4/AGA/3/4*SN64/CNO67//INIA66/5/NAC/6/RIALTO/7/ROLF07 (1st WYCYT) 38 BCN/RIALTO//ROLF07 (1st WYCYT) 39 TACUPETO F2001 (1st WYCYT) 40 SAUAL #1 (1st WYCYT) 41 WBLL1*2/KUKUNA (1st WYCYT) 42 WHEAR/KUKUNA/3/C80.1/3*BATAVIA//2*WBLL1 (1st WYCYT) 43 QUAIU (1st WYCYT)
44 CMH79A.955/4/AGA/3/4*SN64/CNO67//INIA66/5/NAC/6/RIALTO/7/BCN/WBLL1/8/C80.1/3*QT4118//KAUZ/RAYON/3/2*TRCH (1st WYCYT)
45 CMH79A.955/4/AGA/3/4*SN64/CNO67//INIA66/5/NAC/6/RIALTO/7/BCN/WBLL1/8/C80.1/3*QT4118//KAUZ/RAYON/3/2*TRCH
46 D67.2/PARANA 66.270//AE.SQUARROSA (1st WYCYT) (320)/3/CUNNINGHAM/7/CMH79A.955/4/AGA/3/4*SN64/CNO67//INIA66/5/NAC/6/RIALTO/ 8/WBLL1*2/KURUKU (1st WYCYT)
6/5/NAC/6/RIALTO/8/WBLL1*2/KURUKU (1st WYCYT)
48 C80.1/3*QT4118//KAUZ/RAYON/3/2*TRCH/7/CMH79A.955/4/AGA/3/4*SN64/CNO67//INIA66/5/NAC/6/RIALTO/8/WBLL1*2/KURUKU (1st WYCYT)
49 SERI/BAV92/7/CMH79A.955/4/AGA/3/4*SN64/CNO67//INIA66/5/NAC/6/RIALTO (1st WYCYT)
50 UP2338*2/3/SNI/TRAP#1//KAUZ*3/TRAP/4/MILAN/KAUZ//CHIL/CHUM18/5/UP2338*2/3/SNI/TRAP#1//KAUZ*3/TRAP (1st WYCYT) 51 SOKOLL (1st WYCYT)
52 COLIBRI/FINSI (INIFAP)
53 COLIBRI/MONARCA F2007 (INIFAP) 54 COLIBRI/KRONSTAD F2004 (INIFAP) 55 ICA 30.05/MONARCA F2007 (INIFAP)
56 ROMO96//BUC/GJO/4/AZ/3/MRNG/BUS//BLO/PSN (INIFAP) 57 GEMA C2004*2/ACO89 (INIFAP)
58 COLIBRI/TRAGOPAN (INIFAP) 59 NANA F2007 (INIFAP)
60 DON CARLOS (INIFAP)
Table 3. Site, sowing and harvest date, agronomical management, and environmental conditions at six locations
in Mexico where the 60 genotypes were evaluated under irrigation during the 2012-13 autumn-winter crop cycle.
Site Sowing date Fert. (N-P-K) Irrigations Rain Mean Temp Max. Temp Min. Temp Harvest date Baja California 29/12/2012 185-52-00 0-23-55-87-104 0.04 21.5 30.8 12.5 07/06/2013 Chihuahua 20/01/2013 160-60-00 0-11 33-54-73-89-101 34.03 17.74 18.37 17.11 29/05/2013 Guanajuato 27/12/2012 240-60-00 0-35-65-85-105 0.07 17.2 27.1 7.4 15/05/2013 Jalisco 19/01/2013 180-60-00 0-29-56-82 0.04 20 29.2 10.1 15/05/2013 Sinaloa 15/01/2013 103-52-00 0-51-68-87 0 18.2 28.8 9.9 15/05/2013 Sonora 26/12/2012 207-52-00 0-41-75-96-110 0.02 16.8 27.1 7.9 16/05/2013 Agronomical measurements
The following agronomic traits were measured: 1) Plant height (PH), measured in centimeters from the soil surface to the tip of the terminal spikelet; 2) days to flowering; (DF), number of days from sowing until 50% of spikes are at anthesis; 3) days to maturity (DM), from sowing to the stage when 50% of the stems of the plants became yellowish; 4) harvest index (HI), equal to SYG/SYB, where SYG = yield in grams of 100 stems of the plot and SYB = biological yield of 100 stems of the plot; 5) grain yield (GY) in grams per plot expressed as kg ha-1; 6) biomass (BM)
in tons per hectare, calculated as (GY/1000)/HI; 7) spikes per square meter (SSM), equal to (BM*100)/(SYG/100); 8) thousand kernel weight (TKW) in grams; 9) grains per square meter (GPSM), equal to (GY/10)/(TKW/1000).
Statistical analyses
Analysis of variance and mean comparisons tests using Tukey’s test (0.05) were performed for the information obtained from the six locations. Principal component analysis was made. Analysis of genotype by environment interaction was performed using the AMMI (Additive Main effect Multiplicative Interaction) analysis (Zobel et al.
1988). The SAS statistical software, version 9.2, was applied to all of these analyses. The adjusted means across the two years for the 30 common CIMCOG lines were obtained using the PROC MIXED procedure of the SAS statistical package (SAS Institute 2004). All the effects, years, replications within years, and genotype by year interaction (GxE) were considered as random effects and only the genotypes were considered as fixed effects.
Results
The main effect of environment (site) on agronomic traits was evaluated in the 60 lines from CIMCOG-INIFAP trial grown under irrigated conditions (Table 4). Significant differences among environments were observed for all agronomic variables (Height, DF, DM, YLD, TKW, HI, BM, GPSM, SPSM). Baja California had the highest yield, grain weight, and grains per square meter, and presented one of the highest values for biomass (Table 4). This site also had the one of the longest cycles: 35 days of grain filling, together with Guanajuato (44 days). Jalisco and Guanajuato had the lowest TKW and HI values and, together with Chihuahua, they had the lowest yield and grains per square meter among environments. In the specific case of Guanajuato, a frost damage event was reported in early March, when the crop was at the stage of grain filling.
Table 4. Main effect of environment on agronomic traits of the 60 wheat genotypes from CIMCOG-INIFAP trial
evaluated under irrigated conditions at six locations in the 2012-13 autumn-winter cycle.
Site (ENV) Height
(cm) DF DM Yield (Kg*Ha) TKW HI BM GPSM SPSM Baja California 89 a 96 a 131 a 7310 a 49 a 0.48 b 15.17 a 15162 a 306 c Sinaloa 87.5 ab 72 e 100 e 5943 b 45 b 0.36 c 16.77 a 13536 ab 448 a Sonora 89 a 80 d 116 c 5172 c 45 b 0.51 ab 10.13 c 11774 bc 315 c Chihuahua 77 c 85 c 119 b 4304 d 44 b 0.54 a 7.92 d 9981 c 204 d Jalisco 84 b 70 f 109 d 4142 d 38 c 0.32 c 13.12 b 11093 c 408 b Guanajuato 88 a 87 b 131 a 3301 e 32 d 0.21 d 15.63 a 10530 c 414 b Mean 85.8 81.8 117.7 5029 41.7 0.40 13.1 12013 349 C.V. 5.6 2.5 1.8 13.5 6.8 10.0 19.5 15.4 19.9 P (ENV) ** ** ** ** ** ** ** ** ** LSD 1.8 0.75 0.8 252 1.05 0.02 0.95 685 25.6
Significant differences among genotypes were observed for all agronomic variables (Supplemental Table 1). The table shows that PH was between 68 and 95 cm; DF between 74 and 86 days; DM between 113 and 124 days; GY
between 4134 and 5966 kg ha-1; TGW between 31 and 51 g; HI from 0.35 to 0.47; BM between 10.84 and 15.09 t ha
-1; GPSM between 9549 and 16069; and SSM between 257 and 444 . The best genotype (number 53) for GY was also
the best for HI. The genotype with the lowest yield presented low values for GPSM and low TKW. In general, the highest yielding genotypes were 52, 53, and 56 (originally from INIFAP breeding programs) and also genotype 46
from the 1st WYCYT.
Correlation coefficients among traits are presented in Table 5. Yield had a positive and highly significant correlation with HI, BM, SPSM, and GPSM. Conversely, a negative correlation was observed with DF. BM was negatively correlated with HI (P ≤ 0.01) and positively with SPSM and GPSM. GPSM correlated positively with yield, HI, and SPSM, and negatively with TKW and PH. TKW was negatively correlated with GPSM and SPSM, and positively with PH. SPSM correlated significantly with several characters, highlighting its positive association with BM and GPSM.
Table 5. Correlation coefficients between agronomical traits measured in CIMCOG-INIFAP evaluated at six
experimental sites during the 2012-13 autumn-winter cycle.
Height (cm) DF DM YLD (kg*ha-1) TKW (g) HI BM GPSM SPSM Height 1 DF -0.215 1 DM -0.365** 0.819*** 1 YLD -0.0903 -0.2929* -0.1341 1 TKW 0.528*** -0.16782 -0.2498ms 0.1973 1 HI -0.373** -0.3295* -0.2478 0.5893*** 0.0636 1 BM 0.2437 -0.14088 0.001 0.5495*** 0.1378 -0.282* 1 GPSM -0.516*** -0.13771 0.0679 0.5967*** -0.654*** 0.437*** 0.2840* 1 SPSM 0.1141 -0.354** -0.317* 0.4218*** -0.2814* -0.0401 0.597*** 0.551*** 1
*, **, *** Refer to level of significance, P ≤ 0.05, 0.01 and 0.001, respectively. ms, marginal significance (P<0.06)
Principal component analysis
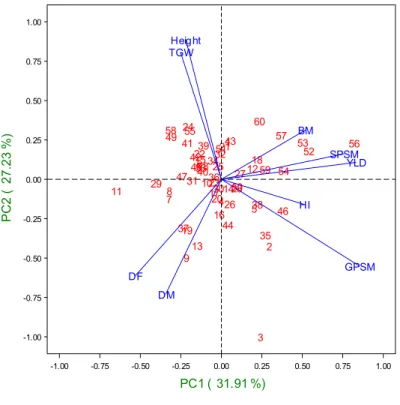
Principal component analysis (PCA) was performed using adjusted means from the 2012-2013 cycle for each genotype across environments using the PRINCOMP (SAS, 2004) procedure (Figure 1). PCA shows that the first two principal components account for 59.14% of the total variance (PCA1 31.91% and PCA2 27.23%), which meets one of the principal component analysis standards, stating that the variance of the first component must be greater than the second; the second greater than the third; and so on. Since these two components account for most of the variation, genotypes were classified only with respect to the variables associated with these components (Figure 1). PCA1 showed the greatest association with the original variables GPSM, BM, SPSM, and YLD. PC2, located on the y-axis, showed a greater association with the variables PH and TKW.
Figure 1. Principal component analysis
(PCA) of agronomic traits yield under irrigated conditions of CIMCOG-INIFAP trial evaluated across six INIFAP
experimental stations during 2012-13. The first two PCA axes explained 59% of the total variation. 1 2 3 4 5 6 78 9 10 11 12 13 14 15 16 17 18 19 20 21 22 23 24 25 26 27 28 29 31 30 32 3334 35 36 37 38 39 40 41 42 43 44 45 46 47 48 49 50 51 5352 54 55 56 57 58 59 60 Height DF DM TGW HI BM GPSM SPSM YLD PC2 ( 2 7.2 3 %) -1.00 -0.75 -0.50 -0.25 0.00 0.25 0.50 0.75 1.00 PC1 ( 31.91 %) -1.00 -0.75 -0.50 -0.25 0.00 0.25 0.50 0.75 1.00
The original variables related to the first principal component, GPSM, GY, and SPSM showed a positive association, indicating that the value of the principal component is increased as the values of these variables increase. In the case of principal component two, there is a positive correlation between PH and TKW that indicates that the genotypes with the highest values in the component have greater magnitude in these variables (Fig. 1). The phenological traits (DF and DM) presented a negative association with PCA1, which means that increasing the value of the principal component decreases the value of the original variable. Considering all of the above, when Figure 1 is analyzed it is assumed that genotypes located in the two quadrants on the right obtained higher GPSM, GY, and SPSM values than genotypes located in quadrants on the left. Likewise, genotypes in the upper quadrants have greater PH and TKW than those located in the lower quadrants, and genotypes located in the upper quadrants have shorter cycles than those in the lower quadrants.
With this analysis we can clearly see how BM and SPSM were the traits that most determined yield in genotypes 52, 53, and 56, while in genotype 46 it was HI and GPSM (Figure 1, Supplemental Table 1). All four high yielding genotypes presented short to intermediate cycle relative to the rest of evaluated genotypes.
Analysis of genotype x environment interaction
The AMMI analysis explained 71.84% of the sum of squares of the model; environments (E), genotypes (G), and GxE interaction contributed 66.7%, 5.6%, and 18.5% , respectively (Table 6). The AMMI showed the first three axes of the PCA as significant (P < 0.01), explaining 47%, 25%, and 12% of the sum of squares, respectively.
Table 6. AMMI analysis of variance of 60 wheat genotypes in six environments.
df Sums of Squares (SS) %SS Environment (E) 5 1242451007** 66.7 Genotype (G) 59 105354409** 5.6 G x E 295 345594793** 18.5 PC1 63 163.311** 47.25 PC2 61 85.010** 24.59 PC3 59 40.111** 11.63 Residue 112 57.1 16.5
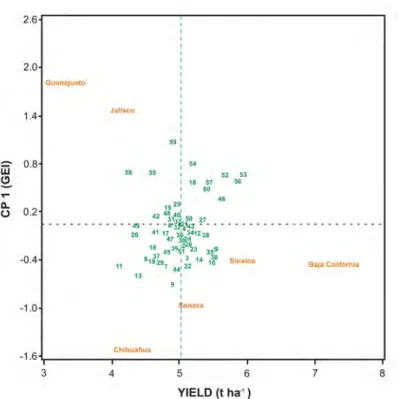
The interpretation of the AMMI analysis result is facilitated by the graphical representation with genotypes and environments in the same space (Figure 2). The results show that the AMMI model allowed a reliable differentiation between additive (E and G in the X -axis) and non-additive effects (GxE on the Y-axis). The correlation coefficient between genotypes and environments is given approximately as the cosine of the angle between the vectors, in such a way that if the angle between the vectors is 180° the correlation coefficient is -1 and if the angle is 0°, the ratio is +1, to 90° is 0. On Figure 2, the x-axis (x) corresponds to yield of genotypes and environments. The dotted line perpendicular to this axis indicates the average yield. Inputs with lower performance are found to the left of the x-axis, whereas genotypes and environments with higher performance are plotted on the right. The y-axis (y) measures the stability of genotypes and environments: those with values close to zero are stable while those with higher values of the principal component are unstable.
Figure 2. AMMI analysis for principal
component and yield (t ha-1) of sixty wheat genotypes and six environments on fall winter cycle 2012-2013.
According to this, entry 53 was the genotype with the highest YLD, followed by entry 56, 52, 46, 1 and 5. Entries 32, 33, and 21, among others, had medium values for YLD, while entries 11 y 58 showed the lowest yields. The environment of Baja California was the best for high yield being Guanajuato the environment with the worst (Figure 2). Only three environments, Baja California, Sinaloa y Sonora had average yields equal or superior to the general mean. The Sinaloa environment, whose PC1 values are the ones closest to 0, is the location where there was the lowest resolution to discriminate among genotypes, this is, most of the genotypes performed similarly. However, the Chihuahua environment, whose PC1 values were the highest, it was the best environment to differentiate genotypes.
Combined analysis of the 30 CIMCOG genotypes for two years
The 30 common genotypes from the evaluations during the 2011-12 and 2012-13 growing cycles were analyzed as randomized complete blocks and adjusted means, broad-sense heritability (h2), least significant difference (LSD),
and coefficient of variation (CV) were obtained (Table 7). The broad-sense heritability for each year, between years, and the overall mean values for GY and yield components varied from low, moderate to high. For the first year of evaluation, h2 was 0 for yield and low for biomass and days to maturity. Heritability for the second year of evaluation was low and moderate for BM and GY, respectively, and moderate to high for the rest of the yield components. The mean heritability for GY and BM over the two seasons in the 30 genotypes was 0.47 and 0.40, respectively, while the heritability of the rest of yield components was moderate to high (0.59–0.98).
Table 7. Broad sense heritability (h2) values for grain yield, harvest index (HI), height, days to flowering, days to maturity, thousand kernel weight (TKW), biomass, grain number per square meter and spike number per square meter of the 30 CIMCOG genotypes in common for the two years of evaluation during 2011-12 and 2012-13 under irrigated conditions at six INIFAP experimental stations
Heritability (h2)
Year 2011-2012 Year 2012-2013 Across years Mean LSD CV
Grain Yield (kg h-1) 0.00 0.46 0.47 5338 459 4.4 HI 0.39 0.63 0.70 0.46 0.02 2.7 Height (cm) 0.73 0.88 0.91 86.7 3.2 1.9 Days to Flowering 0.79 0.66 0.87 84 1.0 0.6 Days to Maturity 0.20 0.85 0.59 123 2.6 1.1 TKW (g) 0.96 0.95 0.98 42.9 1.5 1.7 Biomass (t h-1) 0.12 0.24 0.40 12.2 1.3 5.5 Grain number (m-2) 0.78 0.71 0.89 12487 1132 4.6 Spike number (m-2) 0.74 0.66 0.84 332.3 34.4 5.3
Discussion and Conclusions
The CIMCOG-INIFAP panel evaluated during 2012-13 presented the highest yields in Baja California and the lowest yields in Guanajuato (Table 4). Both evaluation sites are considered high yielding environments; even for the 2011-12 cycle, Guanajuato presented the highest values for GY and BM (Chavez et al. 2013). These low yields can be explained due to frost events occurring at the beginning of March coinciding with the grain filling period, which affected the final yield. This is supported by the high values of BM observed in Guanajuato but low HI values (Table 4). In this sense, due to the frost event, the plants were not able to partition the DM to the grain. This concurs with previous reports about the reduction in HI and quality when frost occurs after anthesis (Allen et al. 2001). Jalisco was also affected by low temperatures, but the previous year was also characterized by low yields (Chavez et al. 2013). However, wheat yields in Jalisco were above the global world average in 2012, at 3 t/ha (Hawkesford et al. 2013). From all the yield components studied, HI, BM, GPSM, and SPSM were the ones that determined most yield of the six environments (Table 5). However, it seems that two different strategies were observed between some INIFAP- and CIMMYT-derived lines (Table 1; Fig. 1). While the INIFAP lines invested in BM and high SPSM, some of the CIMMYT lines presented higher HI and GPSM (Fig. 1).
AMMI analysis allows the detection of specific adaptation and to discriminate genotypes and environments in stability analysis that are positively or negatively correlated (Perez et al. 2005). The stability of genotypes and environments was variable, showing the instability of Guanajuato explained by the frost event (Fig. 2). In general, a large number of genotypes were stable across different sites of evaluation (Fig. 2) with intermediate yields. The AMMI model allowed a reliable differentiation between additive (E and G in the X -axis) and non-additive (GxE on the Y-axis) effects. Gauch and Zobel (1996) noted that in multi-environment tests, environment usually captures 80% of the total variation for yield, while genotypes and GxE interactions contribute about 10% each. Previous research has found significant differences (P < 0.01) among environments, genotypes, in the GxE, and the PC1, the latter contributing 54 to 63% to GxE, concluding that this methodology was efficient to explain the additive and non-additive effects associated with the structure represented in the BIPLOT treatments, when yield is assigned to the X axis and PC1 to the Y axis (Crossa et al. 1990; Castanon et al. 2000; De Leon et al. 2005). Genotypes with PC1 > 0 interact positively with environments whose values are also PC1 > 0, but respond negatively to environments with
PC1 < 0. The opposite is the case for genotypes with PC1 < 0 (Samonte et al. 2005). In this sense, genotypes with PC1 > 0 have high yields in environments with positive values in PC1; for example, genotypes 59, 58, 54, and 55 (among others) had high yields in Jalisco and Guanajuato and 9, 13, 11 and others had lower yield values in these sites (Fig. 2).
In general, according to the results obtained, four genotypes are proposed to be of great interest from the 2012-13 evaluation in the six environments, i.e. 52, 53, 56, and 46 (Table 2); and another four for the two years of evaluation (2011-12 and 2012-13), i.e. 1, 5, 21, and 23 (Table 2). These genotypes come originally from CIMCOG, INIFAP, and 1st WYCYT panels and all presented good BM, GY, and high values of GY and BM per day. According to AMMI analysis, genotypes 1, 5, 21, 23, and 46 are more stable (Fig. 2), but complementary analysis should be performed in order to select genotypes with higher yield potential for release to national breeding programs.
Broad-sense heritability (h2) indicates the proportion of phenotypic variance attributable to genotypic differences. In
most cases, h2 for all yield components was higher than GY. The relatively high heritability of HI, GPSM, and SPSM
(Table 7), and its positive correlation with GY (Table 5), indicate that sustainable genetic gains can be achieved by including HI, GPSM, and SPMS as a selection criterion in the breeding process. Based on this study, gains in yield are expected to be greater when selecting in favor of HI, GPSM, and SPMS. In this sense, genotypes 53 and 56 proposed above presented the highest values for HI and SPSM, respectively (Supp. Table 1). An additional line (3) could also be considered for presenting the highest values of GPSM (Supp. Table 1). From the CIMCOG lines across two years of evaluation, line 21 presented high values of SPSM while the others did not present especially high values for HI, GPSM, and SPSM. In the combined analyses, line 3 also showed high values of GPSM. The different adaptive strategies of these lines (in terms of yield components) can be used in strategic crosses to breed for yield potential in Mexican national programs.
References
Allen, H. M., Pumpa, J. K., and Batten, G. D. (2001). Effect of frost on the quality of samples of Janz wheat. Aust. J. Exp. Agric. 41, 641–647.
CANIMOLT 2013. Cámara Nacional de la Industria Molinera de Trigo, accessed 24 Feb 2014,
<https://docs.google.com/file/d/0B7aliWpRu8y3eWthcXFySFBOVjg/edit>.
Castañón, N. G., Zetina, R., Arano, R. y Raygoza, B. 2000. El AMMI y el cluster en la selección de los mejores híbridos experimentales de maíz. Agron. Mesoamer.11(1):71–76.
Chavez P, Solis Moya E, Molero G, Reynolds M.P. 2013. In: Reynolds, M. et al. (Eds.) Proceedings of the 3rd International Workshop of the Wheat Yield Consortium. CENEB, CIMMYT, Cd. Obregón, Sonora, Mexico. 5-7 March 2013.
Crossa, J., Fox, P.N., Pfeiffer, W.H., Rajaram, S., and Gauch, H.G., (1991). AMMI adjustment for statistical analysis of international wheat yield trial. Theor. Appl. Genet., 81: 27-37.
De León, C. H., Rincón, S. F., Reyes, V. M. H., Sámano, G. D., Martínez, Z. G., Cavazos, C. R. y Figueroa, C. J. D. 2005. Potencial de rendimiento y estabilidad de combinaciones germoplásmicas formadas entre grupos de maíz. Rev. Fitotec. Mex. 28(2):135–143.
Fischer RA, Edmeades G. 2010. Breeding and cereal yield progress. Crop Science 50, 85–98.
Gauch, H.G., and Zobel, R.W., (1996). AMMI analysis of yield trials. En: Genotype-by Environment Interaction. M.S. Kang, H.G. Gauch (eds.), CRC Press, Boca Raton, pp. 85-122.
Hawkesford MJ, Araus J-L, Park R, Calderini D, Miralles D, Shen T, Zhang J, Parry M A. J. 2013. Prospects of Doubling Global Wheat Yields. Food and Energy Security 2, 34–48.
Pérez, J.C., H. Ceballos, E. Ortega y J. Lenis. 2005. Análisis de la interacción genotipo por ambiente en yuca (Manihot esculenta Crantz) usando el modelo AMMI. Fitotecnia Colombiana. 5(2):11-19.
Samonte. S. O. PB, L. T. Wilson, A. M. McClung, and J. C. Medley. 2005. Targeting Cultivars onto Rice Growing Enviroments Using AMMI And SREG GGE Biplot Analyses. Crop Sci 45:2414-2424.
SIAP 2013, Servicio de Información Agroalimentaria y Pesquera (SIAP), accessed 14 January 2014,
<http://www.siap.gob.mx/cierre-de-la-produccion-agricola-por-cultivo/>
Zobel, R.W., M.J. Wright, and H.G. Gauch, Jr. 1988. Statistical analysis of a yield trial. Agron. J. 80:388-393
Supplemental Material
Supplemental Table 1. Averages for the characters measured in 60 wheat genotypes evaluated in six INIFAP
experimental sites under irrigated conditions during fall Winter 2012-2013 cycle
GEN Height DF DM TKW HI BM GPSM SPSM YLD
53 89 79 115 45 0.47 13.7 13358 384 5966 56 82 74 113 41 0.45 14.6 14440 444 5877 52 85 76 114 41 0.43 13.8 14020 391 5687 46 81 81 117 39 0.45 13.3 14451 340 5644 1 90 83 118 48 0.40 14.0 11408 366 5546 5 82 84 118 41 0.43 13.2 13373 355 5539 38 87 85 121 40 0.39 15.0 13547 401 5500 10 77 82 120 51 0.45 12.7 10636 290 5500 35 80 85 119 38 0.43 13.2 14093 384 5465 57 87 75 115 43 0.42 13.8 12901 373 5449 60 92 80 116 45 0.39 15.1 11862 406 5418 28 85 82 119 43 0.43 13.1 12384 344 5394 27 85 81 117 44 0.44 12.5 12201 349 5351 14 86 82 120 41 0.38 14.7 12664 326 5303 12 89 82 117 40 0.38 14.2 12967 404 5225 23 83 84 120 45 0.39 14.5 11359 350 5222 54 83 77 115 39 0.42 13.4 13512 396 5214 18 85 78 115 42 0.43 12.8 12593 361 5204 34 92 83 118 44 0.41 13.3 11799 335 5191 50 86 83 117 41 0.42 13.0 12685 362 5163 22 89 82 119 46 0.39 13.9 10877 325 5138 43 93 82 117 44 0.39 13.8 11696 399 5135 3 68 86 124 31 0.43 12.4 16069 361 5122 26 85 83 118 39 0.42 12.7 12747 347 5102 24 95 83 117 49 0.42 12.9 10387 318 5090 4 83 82 118 41 0.44 12.2 12164 323 5080 2 78 83 117 34 0.43 12.3 14781 386 5074 21 91 82 117 43 0.37 14.1 11662 391 5073 30 86 83 117 41 0.43 12.6 12070 326 5058 51 91 82 117 43 0.38 14.0 11627 373 5052 36 89 80 119 41 0.40 12.9 12118 327 5022 33 90 83 119 44 0.40 13.0 11273 351 5001 32 91 80 117 42 0.40 13.4 11890 340 4981
25 87 82 116 43 0.42 12.6 11665 348 4976 44 85 85 121 37 0.38 14.2 13360 376 4959 40 86 83 118 43 0.38 14.2 11474 324 4956 39 92 82 117 44 0.39 12.9 10931 368 4949 59 82 76 115 39 0.42 13.2 12873 374 4916 9 76 86 122 39 0.41 12.7 12146 285 4909 31 84 82 119 43 0.38 13.7 11242 307 4896 47 94 85 120 42 0.38 13.2 11507 335 4863 6 87 82 116 43 0.42 12.4 11105 314 4859 15 88 83 119 44 0.37 14.9 10908 354 4836 45 88 83 117 42 0.38 13.2 11153 345 4824 48 86 83 117 43 0.38 13.5 11153 361 4821 17 86 81 118 39 0.41 12.4 12107 345 4795 7 83 84 119 43 0.40 12.5 11056 269 4795 29 83 84 118 46 0.42 11.6 9957 272 4722 37 83 84 122 39 0.39 12.3 11700 340 4679 42 87 81 117 43 0.38 13.2 10775 352 4668 41 94 82 116 42 0.38 13.2 10931 331 4663 55 92 79 115 45 0.42 11.8 10461 323 4621 16 83 85 118 37 0.39 12.7 12251 418 4620 19 76 82 117 38 0.43 10.8 11571 283 4597 8 82 83 116 41 0.40 11.7 10722 288 4519 13 80 84 119 34 0.39 11.9 12742 347 4400 49 89 81 116 45 0.38 12.4 9549 361 4371 20 84 82 118 35 0.35 14.3 12179 405 4341 58 93 78 115 43 0.40 11.3 10001 329 4243 11 88 84 119 42 0.39 10.9 9638 257 4134 Mean 85.8 81.8 117.7 41.7 0.41 13.1 12013 349 5029 P(GEN) ** ** ** ** ** ** ** ** ** CV 5.56 2.47 1.81 6.77 9.83 19.33 15.18 19.97 13.38 LSD 8.03 3.4 3.5 4.74 0.06 4.2 3066 117 1131
Improving Genetic Yield Potential of Wheat in India
Indu Sharma, Bhudeva Singh Tyagi, Ravish Chatrath, and Vinod Tiwari Directorate of Wheat Research, Karnal, India
Abstract
Wheat is one of the most important widely grown and consumed food grains all over the world and is the
staple food and main source of energy in the Indian diet. The diverse environmental conditions and food
habits support the cultivation of three species of wheat viz; T. aestivum, T. durum and T. dicoccum. India
has seen a steady improvement in wheat production from 11.4 million tons in 1966 to a record production
of 94.88 million tons in 2012 with a productivity of 3.20 t/ha. It is estimated that India will need around
120 mt of wheat by 2030, while the resources available for wheat production are expected to be
significantly less. India is a very diverse country with regards to temperatures regimes, soil type,
differential abiotic and biotic stresses. To cope with the climate vulnerability and changing pest dynamics,
the Indian wheat program encompasses all possible efforts for creating and harnessing the genetic
diversity and trait specific variability for economic traits particularly yield attributes. The emphasis is
being laid to utilize unexploited germplasm like long spiked buitre plant types, synthetic hexaploids,
Aegilops species, land races, traits specific genetic stocks etc. A large number of genotypes are evaluated
under the Yield Component Screening Nursery (YCSN), Short Duration Nursery (SDN), and Quality
Component Screening Nursery (QCSN) wherein the selected stocks are involved in crossing programs and
the segregating populations are shared with wheat breeding centers so that they can apply need based in
situ selection. More than 151 genetic stocks for various yield components have been registered.
The synthetics are known to be a rich source of genes for various abiotic stress tolerance viz., drought,
heat, frost, salinity and water logging and also a series of biotic factors viz., resistance to leaf, stripe and
stem rusts, leaf blight, glume blotch, head blight, powdery mildew, Karnal bunt, cereal cyst nematodes,
and root lesion nematodes. Effective tillers per unit area directly contribute to the yield potential and in
recent experiments to evaluate synthetics, numbers 88 and 93 recorded up to 222 tillers m
-2while many
lines showed 15 cm spike length as compared to the PBW 343. Some synthetic lines (synthetic no. 31, 33,
and 38) were good for tillering and spike length but flowered 12 days later then the check PBW 343.
Some of the transgressive lines of wheat have been selected to possess 1000-grain weight as high as 55 g
and grain protein content between 12-13.4%. Under the winter x spring program, genotypes like Centurk
90, Zhong 65, & Wugeng 8025 expresss high tillering, bold grains, and strong stems.
Phenotypic diversity was determined in the working germplasm (Shannon-Weaver diversity Index (H'))
revealing that number of kernel/spike (H'=0.84), yield (H'=0.80), plant height (H'=0.80) and thousand
kernel weight (H'=0.86) had the highest diversity index. In an experiment, correlations showed a
significant positive relation between yield and spikeless tillers/plant (0.82), thousand kernel weight (0.39),
plant height (0.35) and flag leaf area (0.36), suggesting the usefulness of these parameter for selecting for
improving grain yield. At DWR, Karnal, improvement in grain size through transgression has been
achieved from a cross involving two small seeded wheat varieties namely, Long 94444 and WH 542.
Some of the transgressive progenies originating from this cross have shown 1000-grain weight as high as
68 grams, and grain protein between 12-13.4%.
Identification of QTL for improving yield potential in wheat
Zhonghu He1,2, Yingjun Zhang1, Awais Rasheed1,2, Xingmao Li1, Xinmin Chen1, and Xianchun Xia1
1Institute of Crop Science, CAAS, China; 2CIMMYT, China
Abstract
The OsGS3 gene plays a principal role in controlling grain weight and grain length in rice. However, the function of an orthologous gene TaGS in wheat has not been analyzed to date. We cloned the gDNA of the TaGS gene, designated TaGS-D1, with four exons and three introns on chromosome 7DS using a comparative genomics approach. The cDNA of TaGS-D1 is 255 bp and encodes 85 amino acids. We also found a plant-specific organ size regulation (OSR) domain in the deduced polypeptide, indicating that TaGS-D1, like OsGS3, does not belong to the PEBP family. DNA sequencing of the TaGS-D1 locus revealed no diversity in the coding sequence of exons, but there was a single nucleotide polymorphism (SNP) in the first intron, and 30 SNPs, a 40-bp InDel, and a 3-bp InDel were found in the second intron between genotypes with higher and lower thousand grain weights (TGW). Based on the 40-bp InDel, a co-dominant STS marker, designated GS7D, was developed to discriminate the two alleles. Linkage mapping indicated that GS7D was located 8.0 cM from Xbarc184 on chromosome 7DS. A QTL for TGW and grain length at GS7D locus explained up to 16.3 and 7.7%, respectively, of the phenotypic variances in a RIL population derived from Doumai/Shi 4185, grown in Shijiazhuang and Beijing. We genotyped 175 Chinese wheat cultivars with GS7D, indicating that TaGS-D1 was significantly associated with grain weight.
A total of 231 synthetic hexaploid wheats (SHWs) were grouped into five different sub-clusters by Bayesian structure analysis using unlinked DArT markers. Linkage disequilibrium (LD) decay was observed among DArT loci > 10 cM distance and approximately 28% marker pairs were in significant LD. In total, 197 loci over 60 chromosomal regions and 79 loci over 31 chromosomal regions were associated with grain morphology by genome wide analysis using the general linear model (GLM) and mixed linear model (MLM) approaches, respectively. They were mainly distributed on homoeologous group 2, 3, 6, and 7 chromosomes. Twenty eight marker-trait associations (MTAs) on the D genome chromosomes 2D, 3D, and 6D may carry novel alleles with the potential to enhance grain weight due to the use of untapped wild accessions of Aegilops tauschii. Statistical simulations showed that favorable alleles for TKW, grain length, width, and thickness have additive genetic effects. Allelic variations for known genes controlling grain size and weight, viz. TaCwi-2A, TaSus-2B, TaCKX6-3D and TaGw2-6A, were also associated with TKW, grain width and thickness. In silico functional analysis predicted a range of biological functions for 32 DArT loci, which showed significant similarity to the sequence of model species in public databases and draft genome sequence of Aegilops tauschii. Receptor-like kinase, known to affect plant development, appeared to be a common protein family encoded by several loci responsible for grain size and shape. Conclusively, we demonstrated the application and integration of multiple approaches including high-throughput phenotyping using DI, genome wide association studies (GWAS), and in silico functional analysis of candidate loci to analyze target traits, and identify candidate genomic regions underlying these traits. These approaches provided a great opportunity to understand the breeding value of SHWs for improving grain weight and enhanced our deep understanding on molecular genetics of grain weight in wheat.
Plant height (PH) and yield components are important traits for yield improvement in wheat breeding. In this study,
207 F2:4 random inbred lines (RILs) derived from the cross Jingdong 8/Aikang 58 were investigated under limited
and full irrigation environments at Beijing and Gaoyi, Hebei province, during the 2011-12 and 2012-13 cropping seasons. The RILs were genotyped with 149 SSR markers and QTLs for PH and yield components were analyzed by inclusive composite interval mapping (ICIM). PH QTLs on chromosomes 4D and 6A, explaining 61.3-80.2% of the phenotypic variation, were stably expressed in all environments. QPH.caas-4D is assumed to be the Rht-D1b locus whereas QPH.caas-6A is likely to be a new gene. The allele from Aikang 58 at QPH.caas-4D reduced PH by 11.1-16.6% and TKW by 2.6-3.7%; however, kernel number per spike (KNS) increased by 3.7-3.8%, as did spike number