HAL Id: hal-03207084
https://hal.archives-ouvertes.fr/hal-03207084
Submitted on 23 Apr 2021HAL is a multi-disciplinary open access
archive for the deposit and dissemination of sci-entific research documents, whether they are pub-lished or not. The documents may come from teaching and research institutions in France or
L’archive ouverte pluridisciplinaire HAL, est destinée au dépôt et à la diffusion de documents scientifiques de niveau recherche, publiés ou non, émanant des établissements d’enseignement et de recherche français ou étrangers, des laboratoires
Particle behavior close to the lower wall of a tokamak
type geometry during a loss of vacuum accident
François Feuillebois, Francois Gensdarmes, Thomas Gelain
To cite this version:
François Feuillebois, Francois Gensdarmes, Thomas Gelain. Particle behavior close to the lower wall of a tokamak type geometry during a loss of vacuum accident. Fusion Engineering and Design, Elsevier, 2020, 153, pp.111500. �10.1016/j.fusengdes.2020.111500�. �hal-03207084�
*Manuscript
Click here to view linked References
Particle behavior close to the lower wall of a tokamak
type geometry during a loss of vacuum accident
F. Feuilleboisa, F. Gensdarmesb, T. Gelainb
a2 allée des Mouilleboeufs, 92350 Le Plessis Robinson, France 1.
bInstitut de Radioprotection et de Sûreté Nucléaire (IRSN), Gif-sur-Yvette, 91192, France.
Abstract
The behavior of tungsten and beryllium particles close to the wall of a tokamak type geometry (i.e. a toroidal vacuum vessel) during a loss of vacuum accident (LOVA) is explored in this paper.
Values of the flow field and temperature of the air surging into the torus were calculated by Computational Fluid Dynamics (CFD) simulations from an initial low pressure of 1000 Pa by Gelain
et al, Fusion Engineering and Design,
100:87- 99, 2015. A new CFD calculation is performed here for an initial low pressure of 500 Pa. The aerodynamic forces on particles in rarefied flow are derived from the calculated friction velocity and temperature in the lowest wall region. The focus is on spherical particles, but these values of forces are complemented for com- parison with an estimate of the force on an elongated particle following Sentman (1961). Typical particles with diameters of 1, 2, 5, 10, 20 ^m are considered. The possibility for particles which are detached from the lower wall to be entrained away the wall is explored. A particle may be detached by the flow field provided it escapes the adhesion force with the wall, which occurs only for a rough wall and large particles. It is then entrained away from the lower part of the wall provided its weight is smaller than the aerodynamic force, which occurs even at low pressure for all sizes of studied beryllium particles and only for specific sizes and a pressure above 1500 Pa for tungsten particles. This key influence of particle weight on the particle dynamics in rarefied gas flow is the focus of the paper. As a result, only particles of intermediate diameters may be resuspended and transfered away from the wall during the whole pressurisation sequence of the vessel. Using the data for the initial low pressure of 500 Pa, these particle diameters are 5, 10 ^m for tungsten and 5, 10, 20 ^m for beryllium.Keywords:
LOVA, airflow, aerosol, dust, resuspension, tokamak.1. Introduction
The gas flow and température évolution during an hypothetic loss of vacuum accident (LOVA) in a toroidal vacuum vessel have been modeled numerically by Computational Fluid Dynamics (CFD) simulations in [1] for a low initial pressure of 1000 Pa and the ambient atmospheric pressure applying upstream of the breach.
Recent studies [2] [3] (not quoting [1]) consider a similar LOVA problem in the ITER Tokamak. The comparison of [1] with [2] appears difficult since those authors (i) do not consider the heated gas in the tokamak, but only air at the ambient temperature of 20°C; (ii) consider an exponentially decaying pres sure upstream of the breach; this relationship is adjusted from studies on the STARDUST-Upgrade facility and has a low characteristic time of one second, so that their estimated total duration of the LOVA in [2] is around 2 seconds, far be- low the result of around 300 seconds found in [1] for a constant upstream ambient pressure. In [3], simulations at ambient temperature in the STARDUST-Upgrade and ITER geometries show the time variation of pressure with the diameter of the breach responsible for air inlet. For the largest breach diameter expected in ITER, that is 0.16 m as considered also in [1], the pressurisation time is about 500 s that is of the same order of magnitude as in [1]. It is also emphasized in [3] that in real experiments the friction forces may still increase the pressuri sation time, thus providing more opportunities to circumvent the dispersion of dangerous aerosols. A recent paper [4] compares a numerical simulation with an experiment of LOVA in the STARDUST-Upgrade facility, considering the flow field and the particle entrainment. Apart from the geometry that is different from the one in [1], the authors neither account for the high initial temperature nor for the variation with pressure of the drag coefficient on particles and the adhesion force between particles and the wall.
Another recent study [5] also conducts a numerical analysis of LOVA, consid ering the geometry of the China Fusion Engineering Test Reactor (CFCTR). In the presented discussion about possible dust resuspension, the authors take into account the adhesion force using the Biasi correlation [6]. They also consider the aerodynamic torques due to the aerodynamic drag and lift force on a particle, using available formulae for laminar and turbulent flow respectively, not taking into account rarefied gas effects. They consider the possibility of a breach in the upper, middle and lower parts of the reactor, as well as different breach sizes. They show that the upper breach appears to be the most dangerous, since the incoming jet impinges directly on the particle layer which is then more easily resuspended.
The focus of the present paper is on the influence of the concurrent effects of the particle weight and aerodynamic force on the particle in a rarefied gas envi ronment. The influence of wall roughness on the particle-wall adhesion force is also accounted for and discussed. First, the calculations of [1] are complemented
here by a new CFD calculation, still for an ambient atmospheric pressure ap- plying upstream of the breach, but for a lower initial pressure of 500 Pa. This initial pressure was retained according to the robustness of the calculation while respecting the conditions of validity of Navier-Stokes equations. Relevant quanti- ties for particle entrainment, extracted here from the CFD results, are the friction velocity and the temperature in the lowest part of the torus. Then, on the basis of these results together with those of [1], we explore the possibility of entrainment of particles deposited in the lowest part of the vacuum vessel, that is the place where the largest amount of particles eroded from walls is expected to accumulate during standard plasma operation.
Section 2 presents the flow field data which were calculated for a typical LOVA. Section 3 is concerned with the particles. In subsection 3.1, we present the expected types of particles. Here, particles are assumed to be spherical, for simplicity. In subsection 3.2, we select the formulae for the aerodynamic drag force on particles which should be applied, depending on gas rarefaction. The focus is on spherical particles, yet estimates of the force on elongated particles are also provided. Adhesion forces of the particles on the wall are estimated from earlier works and discussed, subsection 3.3. In section 4, the various forces acting on a particle are compared. It is emphasized that the influence of particle weight is of primary importance, even though particles are in the micrometer size range. We then discuss the range of pressure and particle diameters for which particles may be entrained by the intruding air flow during the LOVA, depending on the constraints of the adhesion force and the weight. Finally, the conclusion is in section 5.
2. Intruding air flow during a typical LOVA
The geometry and dimensions of the considered toroidal vacuum vessel are sketched in Fig. 1. It is composed of a toroidal part and a duct part. The toroidal part presented in Fig. 1 has a height of 9.62 m; its minor radius is 3.99 m and its major radius is 8.53 m. The torus volume is 1300 m3. The onset of the LOVA is due to a breach in the torus, which is modelled by an ingress airflow through a circular duct with a diameter of 0.16 m (that is a surface area of 0.02 m2) and a length of 2 m, located halfway up the torus as presented on the right-hand-side in Fig. 1.
For the model calculation of [1], the temperature of the outside air which is surging into the torus is 298 K, the imposed torus wall temperature is 673 K and the initial gas temperature in the torus is 493 K (their Tab. 3). Details of the CFD calculation and results for the flow field and temperature during the LOVA are given in that paper. In real conditions, pressure would rise from a low 10-7 Pa up to the ambient pressure of 105 Pa. However, due to limitations of the numerical technique in [1], the lowest initial pressure that could be considered there is 1000 Pa. In this paper, new results are presented for a lower initial
Figure 1: Schematic view of the toroidal vacuum vessel and of the breach initiating the LOVA (from [1]).
pressure of 500 Pa. It will be shown below in section 4 that the range of pressures above 500 Pa is sufficient for the purpose of evaluating the behavior of particles in the air flow close to the wall.
Here, we are interested in prevailing conditions in the lowest part of the torus, where particles are expected to accumulate during normal operation. A relevant quantity for particle resuspension is the friction velocity at the wall. The results of [1] for the initial pressure pi = 1000 Pa provide the evolution with time of the mean friction velocity v* on the lowest wall (their Fig. 13) and the evolution with time of pressure p (their Fig. 4). The more comprehensive results presented in this paper provide the variation of v* with p starting from the lower initial pressure
pi =
500 Pa. Both sets of results for v* versus p are plotted in Fig. 2. Note that there are systematic small fluctuations, the reason of which is unknown, but they are unimportant for the problem considered here.The peak and sharp decay of the mean friction velocity v* are by its definition (5) related to those of the shear stress on the lower wall. That physical quantity is a result of an unsteady boundary layer on the wall near the beginning of air invasion, which depends on the initial pressure condition. One can notice that maximum values of v* are of the same order for both initial pressures considered in the calculations. Since the simulation is realized for a transient airflow, it is not relevant to look for a more advanced comparison about the evolution of the friction velocity. Indeed the same pressure reached in both simulations does not correspond to the same time from the beginning of air ingress.
The evolution of the mean value of the temperature in the lowest part of the volume, say T, was obtained in [1] (their Fig. 14). Their results for the variation of T versus pressure p together with the results of this paper for a lower initial pressure of 500 Pa are plotted in Fig. 3. Small oscillations likewise appear but will be ignored here. As explained in [1], with increasing pressure during LOVA,
Figure 2: Evolution during LOVA of the average friction velocity v* on the lowest wall of the torus with pressure p there, from CFD calculations: [1], dashed line with initial pressure
Pi = 1000 Pa; this paper, solid line with initial pressure pi = 500 Pa.
air is first cooled down by adiabatic expansion then heated up by transfer with walls.
Interesting results with a different trend are obtained for the temperature variation during a LOVA in a cryostat environment, calculated with ANSYS CFX by [7]. Their study shows a complex heat exchange depending on the initial gas temperatures inside and outside the cryostat and on the wall temperature. Yet, their temperature conditions being different from the present ones, a comparison is not appropriate.
We will now derive some relevant physical quantities from the above data. Since air is rarefied when starting from the chosen initial pressure condition that is either 1000 Pa or 500 Pa, the mean free path À is relevant. It may be evaluated with Willeke’s formula [8]:
À
à
-' a tj
1 + S/T0 1 +
S/T
with the reference value À0 = 67.3 nm at T0 = 296.15 K and p0 Sutherland’s constant S = 110.4 K. The evolution of À with LOVA is displayed in Fig. 4.
For low pressure air, the ideal gas law holds:
(1) = 101325 Pa and pressure p during
p =
pRT
(2)where p is the air mass density and R = 287 J/kg/K is the gas constant for air. From kinetic theory for a gas where molecules are modelled as hard spheres, the
640
5
Figure 3: Evolution during LOVA of the mean température T in the lowest part of the torus versus pressure p there, from CFD calculations: [1], dashed line with initial pressure pi = 1000 Pa; this paper, solid line with initial pressure pi = 500 Pa.
relationship between the gas viscosity h and the mean free path À is (see e.g. the review [9], eqs. (2.41)(2.42)):
h
PÀ
,2 RT
n
(3) Note that this expression of h together with (1) gives the same variation with temperature as the classical Sutherland formula:
T 3/2 To + S
T0 T+S (4)
For air in the considered range of temperatures (see figure 3), with h0 = 1-85 x 10-5 Pa.s at T0 = 300 K, it can be checked that (4) gives the same results as (3) with a relative error of 3.4 %o.
From the definition of the friction velocity
v*
in terms of the shear rate k atthe lowest wall,
v* (5)
and from the expressions (2) of p and (3) of h, the evolution of the mean friction velocity v* plotted in Fig. 2 then gives the evolution of the mean shear rate k, which is plotted in Fig. 5. From the initial pressure of pi
=
500 Pa (solid line) the shear rate increases sharply up to 3.2 x 10⁴ s-1: a zoom of the solid line in figure 5p
(Pa)
Figure 4: Evolution during LOVA of the mean free path A versus pressure p. For the solid and dashed line notation, see the caption of Fig. 3.
is shown in figure 6. From the initial pressure of p = 1000 Pa (dashed line), there is a larger sharp increase up to 5.5 x 10⁴ s-1, since the value of the peak of
v*
(see Fig. 2) is about the same but the density p is increased. The decay of kwith the gas density p at constant v* suggests that values of k would be smaller
and probably even negligible for a lower initial pressure. In these circumstances, particles could not be lifted at such low pressures (actually, lifting depends also on particle size, but this point will be confirmed later on in section 4). This is why we only consider the regime of pressures above 500 Pa.
3. Particles, aerodynamic forces and adhesion forces
3.1. Types and sizes of partiales
In order to choose a realistic particle size range for our analysis, we consider sizes of dust particles eroded from Tore-Supra and ASDEX-Upgrade plasma fac- ing components 2. In Tore-Supra [10], the range of particle sizes was between 5 and 30 ^m with a volume median diameter of 10 ^m. Particles had various shapes, including a spherical one. They were made of carbon and various other elements. In ASDEX-Upgrade with a tungsten coating on some wall components, particles were either spherical or flakes [11]. Spherical particles had an average size of 2 ^m with a standard deviation of 1.5 ^m and flakes were smaller, of the
2 There has been various experiments for collecting particles in those tokamaks, but only a short account is given here with the goal to provide some orders of magnitude.
x104
Figure 5: Evolution during LOVA of the mean shear rate kat the lowest wall versus pressure p.
x104
P (Pa)
Figure 6: Evolution during LOVA of the mean shear rate kat the lowest wall versus pressure p.
order of 0.7with a standard déviation of 2.5 ^m. Multi-layers of particles were often encountered. Based on these data, we consider here for simplifica tion spherical particles made of tungsten (of density 19350 kg/m3) with a wide range of diameters
d =
1, 2, 5,10, 20 ^m. Considering also the beryllium walls currently used in JET and planned for ITER, the case of beryllium particles (with density 1850 kg/m3) is also studied here. We consider for simplification that particles made of beryllium are spherical with the same range of diameters, d = 1,2, 5,10, 20 ^m [12, 13]. Particles are considered in the non oxydized form (density of pure tungsten and beryllium are used in the later calculations).3.2. Aerodynamic forces
In rarefied gas, the flow field around a particle is characterized by the Knudsen number, that is the ratio of the gas mean free path À to a characteristic particle length (taken here for a spherical particle as the particle radius
a = d/2):
Kn = — (6)
a
The aerodynamic drag force on a small spherical particle of radius a moving with velocity
v
in a rarefied gas may be written as the classical Stokes drag force divided by Cunningham's slip factor:6nadv
F =
C(Kn) (7)For the expression of the slip factor in term of the Knudsen number,
C
(Kn), we use here the correlation based on experiments using spherical particles moving in rarefied air, as provided in the review work of Rader [14]:C (Kn) = 1 + Kn 1.207 + 0.440exp 0.78
Kn (8)
This formula is valid for values of Kn up to 100. Note that experiments reported by Rader used oil droplets, but it has been shown [15] that small droplets behave as solid spherical particles because impurities at their surface increase the surface tension.
Note that for Kn ^ 1, the asymptotic value of (8) is:
C (Kn) ~ 1.647 Kn (9)
For a rarefied gas, a useful quantity is the molecular velocity ratio v
/2RT
’
(10)that is the ratio of the average mass velocity v of the gas to the most proba ble thermal motion velocity following Maxwell’s equilibrium distribution, V
2RT
.Note that a/7
RT
(where 7 is the ratio of spécifie heats at constant pressure andconstant volume, 7 =1.4 for air) being the celerity of sound in the gas, the quan- tity s may also be considered as being the Mach number Ma within a constant: that is, s
= \J
y/2 Ma.A theoretical expression for the drag force on a spherical particle in free molec- ular flow (Kn ^ 1) was derived by Epstein [16]:
F 16
3
-, n 2
1 + 8
a ps
(11)Formula (7) with (9) and formula (11) will be used below for the cases of large Kn.
The previous formulae concern spherical particles, which are the main focus of the article. Now, in order to estimate the influence of particle shape for an elongated particle, the example of the drag force on a cylindrical particle when in free molecular flow is calculated in Appendix A. It is shown that the order of magnitude of the force is of the same order as that for a sphere.
To our knowledge, there is no formula for the drag force on a spherical particle in a flow field of a very rarefied gas near a wall. Consider here the influence on air viscosity of the rarefaction of air in the gap between the particle and wall. In classical formulae like (3) (4), the viscosity of a rarefied gas only depends on temperature. It does not depend on pressure, which may look surprising. Recent numerical simulations using Monte-Carlo’s technique [17] show that the viscosity of a rarefied gas indeed depends on pressure when in a narrow channel. A simple formula for a “corrected” viscosity
pc
fits well their numerical results:pc P
1 + 2 Knc (12)
where here the Knudsen number Knc is based on a characteristic dimension of the channel, t: that is, Knc = À/fi. As a rough estimate, assuming that the gap between the sphere and the wall is of width t ~ a, so that Knc ~ Kn, it is found from (12) that the viscosity in the gap decays when the Knudsen number Kn increases.
The viscosity appears in the expression (7) for the force. Remark that F ~
pv
~pna
~ p(v*)2. Here, we use the numerical values of v* (obtained from CFD) to calculate the force. Thus taking into account a smaller viscosity in the gap would amount to taking a friction velocity smaller than the numerical one. We leave here this topic for future research.For simplification, we will use here the formula (7) for the drag force near the wall ; and for Kn ^ 1 either (7) together with (9) or formula (11).
3.3. Adhesion forces
The Derjaguin-Müller-Toporov (DMT) theory [18] provides the adhesion force for a sphere (of diameter
d)
and a smooth wall of the same material:where EA,W denotes here the adhesion energy of tungsten. We give in Tab. 1 values of the DMT adhesion force of tungsten particles with diameters of 1, 2, 5,10, 20 on a smooth tungsten substrate, using the adhesion energy of EA,W = 4.4 J/m2 for tungsten.
The DMT is appropriate to smooth surfaces, but it is known that adhesion forces depend widely on surface roughness, see e.g.: (i) in [19] the variation of their "effective surface energy" in their figure 3; (ii) in [20] the reduction rate of the pull-off force in their figure 17; (iii) in [21] the experimental results for the adhesion pull-off force or newest results on surface roughness effect in tunsgten particle adhesion by [22]. The theory of the variation of adhesion with surface roughness is still a topic of active research [23, 24, 22] which is outside of the scope of the present paper.
As for measurements involving tungsten, the adhesion force between non- spherical tungsten particles and a rough tungsten wall was measured by [25] who found the following correlation:
F
a = 3.1542d0'8558 , (14)where d is the particle diameter (surface projected equivalent diameter) in ^m and the adhesion force is in nN. Particles used in that experiment were non-spherical but did not exhibit any elongated shape. The ratio of the experimental adhesion force Fa of tungsten particles on a rough tungsten surface, equation (14), to the theoretical adhesion force Fdmt according to the DMT theory, equation (13), is represented in figure 7 for the particles of Tab. 1. This ratio is quite small and shows that, for non-spherical particles deposited on a rough surface, the mean adhesion force could be four orders of magnitude less that the one calculated by the DMT theory. For tungsten spherical particles on a rough surface, results from [26], [27] and [22] also reveal that adhesion is approximately two orders of magnitude less than the predictions of classical contact mechanics approaches for smooth surfaces. Values of the adhesion force which are one to three orders of magnitude smaller than those from JKR-DMT theory are common to fit particle resuspension data [6, 28, 29].
The radius of contact of a particle on a smooth wall according to DMT theory is, when at separation (Cf. [30], Eq (17)):
rc
aFDMT \ 1/3
Kw
, (15)where Fdmt is given in (13) and Kw is the composite Young modulus for tungsten
KW 2
E
w3(1 — vw2) (16)
with for tungsten the Young modulus Ew = 4.06 x 10¹¹ Pa and the Poisson ratio vw = 0.28. Values of the radius of contact are given in Tab. 1. For a rough
Figure 7: Ratio of the experimental adhesion force [25] of tungsten partiales on a rough tung- sten surface, equation (14), to the theoretical adhesion force according to the DMT theory, equation (13), for particles with diameter d = 1, 2, 5,10, 20 ym.
wall, we assume that (15) holds in which FDMT is replaced by the experimental value Fa.
As for beryllium, which is a dangerous material to manipulate, we have no data for the experimental adhesion force. Moreover, there are no obvious results for the beryllium surface energy. Recently, the Hamaker constant for Be-Be system was calculated by [31], who gave a recommended value equal to A = 3.48 x 10⁻¹⁹ J. He also calculated the value for the W-W system, A = 4.98 x 10⁻¹⁹ J and for W-Be system, A = 4.13 x 10⁻¹⁹ J. Following [32], we take here as an estimate the value EA,Be = 2.2 J/m2 which is the energy to initiate cleavage fracture in the basal (0001) plane of beryllium. This surface energy value is consistent, considering the known value of EA,W for the tungsten-tungsten system and the available data on Hamaker constants for these systems. Based on this energy, values of the theoretical DMT force and contact radius for beryllium are given in Tab. 1. As for the Young’s modulus of beryllium, it is EBe = 2.87 x 10¹¹ Pa, that is not far from that of Tungsten E = 4.06 x 10¹¹ Pa. In view of the similarities of these physical data for tungsten and beryllium and in lack of experimental data for the adhesion of beryllium particles on a rough beryllium surface, we assume that the ratio of the force on a rough substrate to the theoretical DMT force, Fa/FDmt, is the same for both materials, figure 7. For the contact radius on a
beryllium rough wall, we also assume, like for tungsten, that (15) holds in which FDMT is replaced by the experimental value Fa.
4. Comparison of forces on particles and conditions for particle de-tachment and entrainment
We consider here isolated particles, which are initially sitting on the wall. In other words, we consider neither aerodynamic interactions forces between close particles nor adhesion forces between touching particles. Those problems are left for future studies.
4.1.
Particle detachment from the wall
If a particle is attached to the wall by adhesion, it is clear from Tab. 1 and figures 10 and 11 that the adhesion force is much higher than the aerodynamic drag force. In this circumstance, a possibility of detaching and moving the particle is by the Rock n’ Roll mechanism [33]. That is, the moment of the drag force should be higher than the moment of the adhesion force for the particle to start moving:
aF > rc F
a (17)For simplification, we use here the formulae recalled at the end of §3.2 for the calculation of the drag force F due to the shear flow along the wall. The ratio
aF/(r c
Fa) is represented for tungsten and beryllium in figure 8 and 9, respec-tively. For a smooth wall and the DMT adhesion force (see the dashed lines in these figures), it appears that the inequality (17) can never be satisfied. Only for a rough wall (see the solid lines in these figures) and the highest values of the particle diameter can it be satisfied. That is, for tungsten (Fig. 8) like for beryl lium (Fig. 9), particles with diameters 10 and 20 ^m can be moved, even starting at very low pressures. The behaviour of particles with intermediate values of di ameters is sensitive to the initial pressure in the calculation, either pi = 500 Pa or pi
=
1000 Pa. That is, for pi = 500 Pa, particles with diameter 5 ^m can hardly be moved for pressures above 104 Pa, whereas for pi = 1000 Pa, particles with diameter 5 ^m can never be moved. Smaller particles with diameters 2, 1 ^m and below can never be moved by considering a simple moment forces balance equation.4.2. Importance of the weight in detached particle entrainment
Consider a particle detached from the wall, i.e. free from adhesion force. It is then only submitted to the aerodynamic drag force of the ambient flow and its weight. Such a particle might be lifted from the wall in a turbulent flow if a vortex penetrating the laminar sublayer gives an upward velocity normal to the wall. In such a vortex, the component of the air flow velocity normal to the wall would be of the same order as the component tangent to the wall, that is
Ka
near the wall. We again use for simplification the formulae recalled at the end of §3.2 for the calculation of the aerodynamic force F, in which the particle/gas relative velocity is of orderKa.
We then proceed to compare this force F to the particle weight.Figure 8: Ratio of the aerodynamic torque to the adhesion torque for tungsten (see Eq. (17)) versus pressure, for the calculations starting at a pressure of 500 Pa and 1000 Pa. Dashed lines: using the DMT adhesion force (13). Solid lines: using the experimental adhesion force on a rough surface (14). Particles with diameter d = 1, 2, 5,10, 20 ^m are represented with color blue, red, green, magenta, black, respectively (color online).
Figure 9: Ratio like in figure 8, but for beryllium. In this case, the values of the force and radius of adhesion are estimates as explained at the end of §3.3.
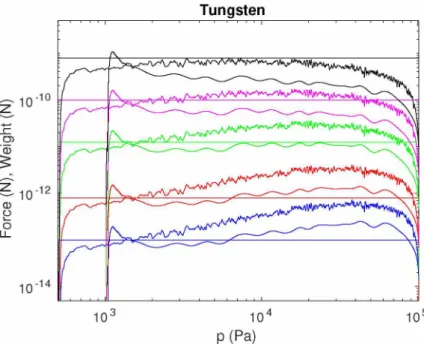
Figure 10 for tungsten and figure 11 for béryllium represent the variations of the aerodynamic drag force F on the particle with pressure during LOVA. The weight of each particle is shown (as a horizontal line) for comparison. Particles with diameter d
=
1, 2, 5,10, 20 ^m are represented by a color code in the figures (color online). We used Cunningham’s expression (7) for the calculation of the drag force. For large Kn, i.e. for a very rarefied gas, we used the asymptotic value (9) of Rader’s formula based on experiments (8) and Epstein’s theoretical expression (11). We checked that, with the numerical values of our problem, both formulae give the same results with a relative error of 3.4 %o. Both curves appear superimposed in the figure.Consider now the results for particle behaviour during the LOVA process. Note that all results presented below take into account the temperature variation of the invading air close to the wall during the LOVA.
Let us detail first the results for tungsten, Fig. 10. From calculations starting at pi
=
500 Pa, results obtained for the aerodynamic drag force F compared to the weight W show that:• F > W for particles with diameters 1,2, 5 ^m when p > 1500 Pa; • F > W for particles with diameters 10 ^m when p > 2000 Pa; • F < W for particles with diameters 20 ^m for all pressure values.
(Values of p given here are estimates). From calculations starting at pi = 1000 Pa, there is an overshoot of F for all particles at pressure ~ 1120 Pa, suggesting that all particles might move away from the wall around that pressure. This overshoot is related to the expression (7) of the drag force, with v = Ka. Recall that, for pi = 1000 Pa, the shear rate k has a large overshoot in Fig. 5, which is peculiar to
this initial condition. If we omit the overshoot, then F > W only for p > 7000 Pa and for the smallest particles, of diameter d =1,2 ^m.
Consider then the results for beryllium, Fig. 11. Values of the aerodynamic force F are of course the same as for tungsten, Fig. 10, since they do not depend on particle density. The comparison of the aerodynamic force F with the weight W show that F > W for all particles starting at very low pressures for both calculations. This is because of the quite low density of beryllium.
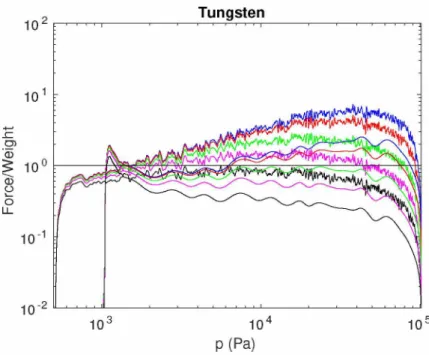
The different regimes for the different particle diameters appear more clearly in figures 12 and 13 which represent the same results, plotted as the ratio of the aerodynamic force F to the weight W (solid lines).
Interestingly, for low pressure (high Knudsen number), the F/W curves ap pear to be superimposed in figures 12 and 13. This may be understood since Epstein’s force (11) is proportional to a2s in which s, Eq. (A.2), is proportional to the lifting flow velocity v which is assumed to be of the order of Ka near the wall. Thus, F is proportional to a3 like the weight W so that F/W is independent
Tungsten
5
Figure 10: Aerodynamic drag force F versus pressure p during LOVA, for the calculations starting at a pressure of 500 Pa and 1000 Pa. Horizontal lines represent the weight W of tungsten particles. Particles with diameter d =1,2, 5,10, 20 ^m are represented with color blue, red, green, magenta, black, respectively (color online). The force F increases with increasing particle diameter.
Béryllium
r
r
103 104 105P (Pa)
P (Pa)
Figure 12: Ratio of the aerodynamic force F to the weight W of the particle versus pressure
p during LOVA, for the calculations starting at a pressure of 500 Pa and 1000 Pa. Particles
with diameter d = 1,2, 5,10, 20 ym are represented with color blue, red, green, magenta, black, respectively (color online). The ratio F/W decreases for increasing particle diameter.
of the particle size 3.
4.3. Sequential particle detachment and entrainment by the air flow
To summarize, we considered: (i) particles which, thanks to the ambient flow, may escape the adhesion force keeping them on the wall; (ii) particles which, once detached from the wall, may be moved away by the ambient flow. Table 2 summa- rizes these results (here, we used the calculations starting at the initial pressure
Pi =
500Pa). If we consider both adhesion constraint and weight constraint in sequence, we may deduce the diameters of particles which may eventually be entrained from the wall. It should be noticed that calculations on particles es- caping the adhesion constraint are based on a single adhesion force value which does not reflect the spread reality of the distribution of adhesion forces. It is observed that for tungsten only particles of intermediate sizes of 5 and 10 ^m are both detached and entrained, whereas for beryllium which has a similar adhesion energy and a much lower density, much larger particles (here, 20 ^m) may also be both detached and entrained.3 Note that this scaling would be different away from the wall where the flow velocity v is independent of a: then the drag force in free molecular flow would be proportional to a2.
P (Pa)
Figure 13: Like in figure 12, but for béryllium partiales.
4-4-
Discussion
The results presented in table 2 highlight that, as opposed to the béryllium particles, none of the tungsten particles is entrained away from the wall for a pressure lower than 1500 Pa. This observation can be compared with the calcu lation results presented in the recent paper [34] relative to the resuspension and transport of tungsten particles during an air ingress in a toroidal geometry. In that paper, the CFD calculation (see their Fig. 21 at t=1 s) reveals that a frac tion of roughly 10-4 of the initially deposited 10 ^m particles is in suspension at a pressure of 1500 Pa. This simple comparison of results of the CFD calculation with the present analytical calculations gives opposite findings, showing that the CFD simulations in [34] could overestimate the particle entrainment. The expla- nation is in the consideration of the near wall velocity. The present analytical calculation considers a scale which is as close as possible to the particle. That is, the wall distance is considered to be of the order of the particle radius a, and the near wall velocity is defined by the expression
Ka,
equal to 0.16 m.s-1. Due to this low velocity, the drag force is also low and equal to 6 x 10-11N, lower than the weight force of around 10-10N. In the CFD simulations, the mesh refinement close to the wall is designed to take into account the log region of the velocity profile, with a non-dimensional distance to the wall y*>
12 (value defined in ANSYS CFX as being the intersection with the linear area of the velocity profile in the viscous sublayer), corresponding to a wall distance of around 1 mm. Hence, in this log region, the near wall velocity v is calculated by using the known loglaw
v
1
u*
= —
= — ln y* + CV*
Kp
with
Kp =
0.41 and C =5. Thus, for a pressure lower than 1500 Pa, where the friction velocity reaches its maximum, the near wall velocity v used by ANSYS CFX for entraining the resuspended particle and corresponding to the one en- countered in the middle of the first mesh close to the wall is around 32 m.s-1. Hence, the drag force is much higher than the weight force and the particles are entrained. In conclusion, the present study may highlight a certain limita tion of the CFD simulations when coupling a particle source term at the wall due to resuspension with particle transport in low pressure condition. The drag force is very low due to the low pressure and moreover the entrainment may be even lower than predicted by CFD calculation; indeed, particle weight is not ac- counted for in the particle transport away from the wall within the first mesh of the fluid-particle calculation.5. Conclusion
This paper estimates the possibility of entrainment of deposited particles dur- ing a LOVA in a common simplified torus geometry. Data for the flow field and temperature of the air surging into the torus are taken from the numerical calcu lation of [1] for an initial pressure of pi
=
1000 Pa, revisited in this paper for an initial pressure of pi = 500 Pa.Isolated particles are considered here. In other words, this paper deals nei- ther with aerodynamic or ballistic interactions nor with adhesion forces between several particles that may exist in multi-layers deposits on a wall. The focus is on spherical particles, but for comparison an estimate of the aerodynamic force on an elongated particle following Sentman (1961) is provided in Appendix A.
A particle might be separated from the wall by the Rock’n’Roll mechanism, that applies when the aerodynamic torque is larger than the adhesion torque. The aerodynamic torque is due essentially to the drag force induced by a shear flow along the wall. In absence of data for rarefied gas, we omit here aerodynamic interactions with the wall. The Rock’n’Roll mechanism works here only if the wall is rough, so that the adhesion force is small compared with that on a smooth wall.
We next consider the possibility of a detached particle to be lifted away from the wall by an aerodynamic force. This aerodynamic force on a spherical particle is estimated by using the drag force due to an ambient air flow, the value of which is that due to a shear flow at a distance of one radius from the wall. Again, aerodynamic interactions with the wall are omitted here. This aerodynamic force is then compared to the particle weight.
The key influence of particle weight is the focus of the paper. At a very low pressure, the aerodynamic force on tungsten particles due to the ambient air
velocity is always smaller than the particle weight in the considered size range, due to the low air density. As a consequence, detached tungsten particles would not move away from the lowest part of the wall in this low pressure regime. Considering this lack of particle entrainment, the lack of data about the flow field at very low pressures below 500 Pa appears of secondary importance. For the beryllium particles results are totally different and show that, at all pressures, detached particles can move away from the lowest part of the torus wall.
Results are provided for particles on which the aerodynamic entrainment force is (i) larger than the adhesion force which keeps them on the wall, and (ii) larger than their weight. These two conditions give opposite orderings in particle diame- ter: large particles may more easily escape the adhesion force and small particles may more easily move away once they are detached. As a result, particles of intermediate sizes may finally escape both their adhesion force and their weight. The range of intermediate diameters for particles which are both detached and entrained is larger for beryllium which has a lower density than tungsten, while both have a similar surface energy.
It may also happen that, when an accident occurs during a normal operation, some particles are in free flight. Then our results for the ratio of the aerodynamic force to the weight for all particle sizes are relevant, see figures 12 and 13.
We assumed in the calculations that viscosity is independent of pressure. Yet, it was shown above using results from [17] that at high Knudsen number the viscosity may decay with pressure in the gap between the particle and the wall. Since the aerodynamic force is small at high Knudsen number when assuming a constant viscosity, it would be even smaller with a decaying viscosity. The constant viscosity assumption thus appears to be unimportant and provide a conservative case of study.
Yet, recall that we used in the whole range of Knudsen number the stronger assumption that the expression for the drag force on a sphere near a wall and submitted to an ambient flow velocity that is either parallel or perpendicular to this wall, is the same as if it were far away from the wall. A proper account of wall effects on a particle in a rarefied gas is needed at intermediate and small Knudsen numbers, in order to improve the above estimate of the aerodynamic force. Such data are still missing, to our knowledge.
Acknowledgements
Appendix A. Drag force of a free molecular flow onto a cylindrical particle
In the paper of Sentman [35], équation (21) section II, the force per unit area of body surface,
dF/dA,
is normalized by 1piU2Aref
, wherepi
and U are the mass density and velocity of gas incoming onto the surface andAref
is a reference surface area. The result, denoted asdC/dA,
is:dC dA
Aref
(ek + 7/ +nt) Y
(1+erf js)+
--- eAs2
/ /T
+2S2 i1 +erf(js)]+
2]/T
Sy/iï
n (1 + erf js) + -1 e (A.1) 1s
Here, s is the molecular velocity ratio, defined asU
yj2RTi
(A.2)where R is the gas constant for air and Ti is the temperature of the incoming gas molecules. In (A.1), Tr is the temperature of gas molecules reflected by the surface. The local elementary surface area has a reference frame
(x,y,z
), withy
normal to the surface and pointing into it. Then (k,/,t) are the direction cosines of the force being calculated and (e, j, n) are the direction cosines of the incoming air velocity U, these quantities being relative to the local (x, y, z) axes. Consider now (figure A.14) a circular cylinder with radius r and lengthL,
theL
Figure A.14: Sketch of a cylindrical particle.
incoming ambient gas velocity being at an angle
a
to the cylinder axis. This is the model for an elongated particle with aspect ratio L =L/r.
We neglect here end effects for simplification (provided L is high enough). Integrating the normalized stress (A.1) over the lateral wall of the cylinder, Sentman (1961) obtained thenormalized force normal to the cylinder axis, CN:
C,
NrL
f . 2 1 _s n
sina
2 sina
+ e 2 Aref o . o s2 sina
+ ii o . 2 s2 sin a , 2v/n • -+ sin ae 2 io 22 s2 sin a 2 n3/2 +V T 17sinaand the normalized force along the cylinder axis,
C
a: rL(A.3)
C
A
aAref 2s n sin a cos a e 2
.
s sin io2 ♦ 2 s2 sin a 2 + ii 22 s2 sin a , 2V/n -+ cos a e 2 io 22 s2 sin a 2 (A.4)
where i0 and I1 are modified Bessel functions of the first kind of degree zero and one, respectively. In (A.3) and (A.4), the quantities between curly brackets are dimensionless and can be denoted as:
o 2 2 s 2 s cN Aref = CN rL (A.5 ca C Aref
rL
(A.6Both components C
N
in the normal direction and CA
in the axial direction con- tribute to the drag force coefficientCx
in the direction of the incoming air velocity U, so that:Cx = CN sin
a
+ CA cosa
(A.7)Then the normalized drag coefficient in the direction of U,
cx = Cx ^ (A.8)
rL satisfies
cx
=cN
sina
+cA
cosa
(A.9)We assume here that the temperatures of the incoming and reflected gas molecules are equal, Tr = T). Values of cN, cA, cx are plotted in figure A.15 versus the angle
a
for three different values of s.S=0.1 S=1 S=10
Figure A.15: Normalized drag coefficients cN, cA, cx versus the angle a for three different values of the molecular velocity ratio s.
Consider now that the cylindrical particle takes all possible orientations in space relative to the incoming velocity with equal probabilities. An average normalized drag coefficient in the direction of this velocity, say (
cx
), is then obtained as1 n
( Cx ) = 2ncx
da
(A.10)4n 0
where in the normalizing factor
-4-
the quantity 4n is the total solid angle. This quantity is plotted in figure A.16 versus the molecular velocity ratio s. Then, by construction, the average force on the cylindrical particle in the direction of U is related to the average normalized drag coefficient cx by(
Fx
) 12
PiU 2
rL (c
x ) (A.11) This may be rewritten using the lateral surface area of the cylinder, Acyl = 2nrL,
the law of ideal gasesp
i =p
i/
(RT
i) wherep
i is the pressure and the definition (A.2) of s:(
F
x ) = Q^PiU2Acyl^ ( Cx ) = 2nA
cylP
iS2 (
Cx ) (A.12)The expression (A.12) for the cylinder can be compared to Epstein’s expres sion (11) for the drag on a sphere in free molecular flow, which can be rewritten here as:
4 n
S
Figure A.16: Average normalized drag coefficient ( cx ) (in the direction of the incoming air velocity) over all possible directions of the cylindrical particle, versus the molecular velocity ratio s.
where Asph is the surface area of the sphere. Considering a cylinder with the same volume as the sphere, the ratio of surface areas is
Ai = 1
(
4Y/3
ki/3
Asph 2
\
3Jwhere R = L/r is the cylinder aspect ratio The ratio of forces (A.12) to (A.13) is then
= kR1/3s ( cx ) (A.14)
where
k
= 31/3/[44/3^n(n/8 + 1)] ~ 0.0920. The quantityk s( cx
)], which is a function of s only, is plotted in figure A.17. It is observed that it is not far from the function 3k(s + 1). To conclude, the ratio of the force on the cylinder to the force on the sphere is a function of s which stays of order unity times a weak variation R1/3 of the cylinder aspect ratio R (R1/3 ~ 2.7 for R = 20). Thus,results obtained for cylindrical particles will not change drastically from results obtained for spheres in free molecular flow.
Figure A.17: Function ks ( cx ) in (A.14) versus the molecular velocity ratio s. The straight line 3k(s + 1) is plotted as a dashed line for comparison.
References
[1] T. Gélain, A. Rondeau, S. Peillon, J.C. Sabroux, and F. Gensdarmes. CFD modelling of the wall friction velocity field in the ITER tokamak resulting from airflow during a loss of vacuum accident - Consequences for particle resuspension.
Fusion Engineering and Design,
100:87-99, 2015. http://dx.doi.org/10.1016/j.fusengdes.2015.04.043.
[2] J.F. Ciparisse, R. Rossi, A. Malizia, and P. Gaudio. 3D simulation of a loss of vacuum accident (LOVA) in ITER (International Thermonuclear Exper imental Reactor): evaluation of static pressure, Mach number, and friction velocity.
Energies,
11(856):1-16, 2018.[3] R. Rossi, J.F. Ciparisse, P. Gaudio, and A. Malizia. A scaling law of pressuri sation time in the case of loss of vacuum accidents (LOVAs): Theoretical and experimental analysis.
Fusion Engineering and Design,
143:16 - 23, 2019. [4] R. Rossi, P. Gaudio, J.F. Ciparisse, and A. Malizia. Experimental mea-surements of pressure, temperature and dust velocities in case of LOVA: Comparisons with a multiphase numerical model.
Fusion Engineering and
Design,
146:845-849, 2019.[5] Y. Xu, S. Liu, X. Cheng, and X. Ma. Numerical analysis of loss of vacuum accident (LOVA) and preliminary discussion about dust resuspension for CFETR.
Fusion Engineering and Design
, 143:82 - 90, 2019.[6] L. Biasi, A. de los Reyes, M.W. Reeks, and G.F. de Santi. Use of a simple model for the interpretation of experimental data on particle resuspension in turbulent flows.
Journal of Aerosol Science,
32(10):1175 - 1200, 2001. [7] Rosa Lo Frano, Donato Aquaro, and Nicola Olivi. Fluid dynamics analysisof loss of vacuum accident of iter cryostat.
Fusion Engineering and Design
, 109-111:1302 - 1307, 2016. Proceedings of the 12th International Symposium on Fusion Nuclear Technology-12 (ISFNT-12).[8] K. Willeke. Temperature dependence of particle slip in a gaseous medium.
J. Aerosol Sci,
7(5):381 - 387, 1976.[9] P Bahukudumbi and Ali Beskok. A phenomenological lubrication model for the entire knudsen regime.
Journal of Micromechanics and Microengineering,
13(6):873, 2003.[10] F. Gensdarmes, C. Grisolia, A. Roynette, S. Peillon, T. Gelain, S. Poli, and L. Gargiulo. Tore supra carbon dust resuspension studies.
Fusion Engi
neering and Design,
88:2684-2687, 2003. http://dx.doi.org/10.1016Zj.[11] A. Rondeau, S. Peillon, A. Roynette, J.-C. Sabroux, T. Gelain, F. Gens- darmes, V. Rohde, C. Grisolia, and E. Chassefière. Étude des poussières pro duites dans les tokamaks et potentiellement mobilisables lors d’un accident de perte de vide. In
29ème Congrès Français sur les Aérosols, Paris,
2014.https://www.asfera.org/medias/files/pdf/2014/Recueil2014.pdf.
[12] E. Fortuna-Zalesna, J. Grzonka, M. Rubel, A. Garcia-Carrasco, A. Wid- dowson, A. Baron-Wiechec, L. Ciupinski, and JET Contributors. Studies of dust from jet with the iter-like wall: Composition and internal structure.
Nuclear Materials and Energy,
12:582 - 587, 2017. Proceedings of the 22nd International Conference on Plasma Surface Interactions 2016, 22nd PSI. [13] M. Rubel, A. Widdowson, J. Grzonka, E. Fortuna-Zalesna, Sunwoo Moon,P. Petersson, N. Ashikawa, N. Asakura, D. Hamaguchi, Y. Hatano, K. Isobe, S. Masuzaki, H. Kurotaki, Y. Oya, M. Oyaidzu, and M. Tokitani. Dust generation in tokamaks: Overview of beryllium and tungsten dust charac- terisation in JET with the ITER-like wall.
Fusion Engineering and Design,
136:579 - 586, 2018. Special Issue: Proceedings of the 13th International Symposium on Fusion Nuclear Technology (ISFNT-13).[14] D.J. Rader. Momentum slip correction factor for small particles in nine common gases.
J. Aerosol Sci.,
21(2):161 - 168, 1990.[15] V. G. Levich.
Physicochemical hydrodynamics.
Prentice Hall, 1962.[16] P. S. Epstein. On the resistance experienced by spheres in their motion through gases.
Phys. Rev.,
23:710-733, Jun 1924.[17] V. Michalis, A. Kalarakis, E. Skouras, and V. Burganos. Rarefaction ef- fects on gas viscosity in the Knudsen transition regime.
Microfluidics and
Nanofluidics,
9(4-5):847-853, 2010.[18] B.V. Derjaguin, V.M. Muller, and Yu.P. Toporov. Effect of contact defor mations on the adhesion of particles.
J. Colloid Interface Sc.,
53:314-326, 1975.[19] A. G. Peressadko, N. Hosoda, and B. N. J. Persson. Influence of surface roughness on adhesion between elastic bodies.
Physical Review Letters,
95(124301):1-4, 2005.[20] W. Cheng, P. F. Dunn, and R. M. Brach. Surface roughness effects on microparticle adhesion.
The Journal of Adhesion,
78:929-965, 2002.[21] F. Feuillebois, F. Gensdarmes, Z. Mana, L. Ricciardi, C. Monier, G. Le Meur, C. Reynaud, and M. Rabaud. Three-dimensional motion of particles in a shear flow near a rough wall.
J. Aerosol Science,
96:69-95, 2016. http:[22] S. Peillon, A. Autricque, M. Redolfi, C. Stancu, F. Gensdarmes, C. Grisolia, and O. Pluchery. Adhesion of tungsten particles on rough tungsten surfaces using atomic force microscopy.
Journal of Aérosol Science,
137(105431), 2019.[23] B. N. J. Persson and M. Scaraggi. Theory of adhesion: Role of surface roughness.
The Journal of Chemical Physics,
141(12):124701, 2014.[24] M. Ciavarella. On the use of DMT approximations in adhesive contacts, with remarks on random rough contacts.
Tribology International,
114:445 - 449, 2017.[25] A. Rondeau. Étude de la mise en suspension aéraulique appliquée à la prob lématique des poussières dans le futur réacteur ITER. Thèse, Université Paris-Saclay, décembre 2015.
[26] G. Riva, P. Tolias, S. Ratynskaia, G. Daminelli, R. Donde, M. De Angeli, E. Vassallo, and M. Pedroni. Adhesion measurements for tungsten dust deposited on tungsten surfaces.
Nuclear Materials and Energy,
12:593 - 598, 2017. Proceedings of the 22nd International Conference on Plasma Surface Interactions 2016, 22nd PSI.[27] A. Autricque, S. Peillon, F. Gensdarmes, M. Sow, N. Fedorczak, H. Roche, O. Pluchery, and C. Grisolia. Dust remobilization from rough planar surfaces in tokamak steady-state plasmas.
Nuclear Materials and Energy,
17:284 - 288, 2018.[28] M.M. Stempniewicz, E.M.J. Komen, and A. de With. Model of particle re suspension in turbulent flows.
Nuclear Engineering and Design,
238(11):2943 - 2959, 2008. HTR-2006: 3rd International Topical Meeting on High Tem- perature Reactor Technology.[29] S. Peillon, A. Roynette, C. Grisolia, and F. Gensdarmes. Resuspension of carbon dust collected in tore supra and exposed to turbulent airflow: Controlled experiments and comparison with model.
Fusion Engineering
and Design
, 89(11):2789 - 2796, 2014.[30] X. Zhang, G. Ahmadi, J. Qian, and A. Ferro. Particle detachment, resuspen sion and transport due to human walking in indoor environments.
Journal
of Adhesion Science and Technology,
22:591-621, 2008.[31] P. Tolias. Lifshitz calculations of Hamaker constants for fusion relevant materials.
Fusion Engineering and Design,
133:110 - 116, 2018.[32] R. K. Govila and M. H. Kamdar. Cleavage in beryllium monocrystals.
Met-
allurgical Transactions,
1(4):1011-1018, 1970.[33] M.W. Reeks and D. Hall. Kinetic models for particle resuspension in turbu lent flows: theory and measurement.
Aérosol Science,
32:1-31, 2001.[34] T. Gelain, F. Gensdarmes, S. Peillon, and L. Ricciardi. CFD modelling of particle resuspension in a toroidal geometry resulting from airflows dur- ing a loss of vacuum accident (LOVA).
Fusion Engineering and Design,
151(111386), 2020.[35] L. H. Sentman. Free molecule flow theory and its application to the de- termination of aerodynamic forces. Technical Report LMSC-449514, DTIC Document, Lockheed Aircraft Co., 1961.
![Figure 1: Schematic view of the toroidal vacuum vessel and of the breach initiating the LOVA (from [1]).](https://thumb-eu.123doks.com/thumbv2/123doknet/14590281.542220/5.892.192.676.164.416/figure-schematic-toroidal-vacuum-vessel-breach-initiating-lova.webp)
![Figure 2: Evolution during LOVA of the average friction velocity v* on the lowest wall of the torus with pressure p there, from CFD calculations: [1], dashed line with initial pressure Pi = 1000 Pa; this paper, solid line with initial pressure pi = 500 P](https://thumb-eu.123doks.com/thumbv2/123doknet/14590281.542220/6.892.222.649.157.501/figure-evolution-friction-velocity-pressure-calculations-pressure-pressure.webp)
![Figure 3: Evolution during LOVA of the mean température T in the lowest part of the torus versus pressure p there, from CFD calculations: [1], dashed line with initial pressure pi = 1000 Pa; this paper, solid line with initial pressure pi = 500 Pa.](https://thumb-eu.123doks.com/thumbv2/123doknet/14590281.542220/7.892.220.649.161.501/figure-evolution-température-pressure-calculations-initial-pressure-pressure.webp)


![Figure 7: Ratio of the experimental adhesion force [25] of tungsten partiales on a rough tung- sten surface, equation (14), to the theoretical adhesion force according to the DMT theory, equation (13), for particles with diameter d = 1, 2, 5,10, 20 ym.](https://thumb-eu.123doks.com/thumbv2/123doknet/14590281.542220/13.892.219.659.162.517/experimental-adhesion-tungsten-partiales-equation-theoretical-according-particles.webp)