Dealing with Distractions: Analyzing and Designing for
Task Switching at Work
Elisabeth Sylvan
B.S. in Psychology, Carnegie Mellon University 1996
Submitted to the Program in Media Arts and Sciences, School of Architecture and Planning,
in partial fulfillment of the requirements for the degree of Master of Science in Media Arts and Sciences
at the Massachusetts Institute of Technology June 2003
© Massachusetts Institute of Technology 2003. All rights reserved.
Author:
Elisabeth Sylvan Program in the Media Arts and Sciences June 2003
Certified by:
Dan Ariely Associate Professor of Behavioral Economics and Media Arts and Sciences MIT Sloan School of Management and the Program in Media Arts and Sciences
Accepted by:
Andrew B. Lippman Chair, Departmental Committee for Graduate Students Program in Media Arts and Sciences
ROTCH
MASSACHUSETTS INSTITUTE OF TECHNOLOGY
JUL 1 4 2003
Dealing with Distractions: Analyzing and Designing for
Task Switching at Work
Elisabeth
Sylvan
Submitted to the Program in Media Arts and Sciences, School of Architecture and Planning, in partial fulfillment of the requirements for the degree of Master of Science in Media Arts.
Abstract
Increasingly, distraction is just a click away: computers offer you the temptation to switch from your primary task. The current work describes four investigations into how well people manage switching between tasks and between multiple computer applications: a controlled experiment on task-switching, a survey on email behavior and efficient, a survey on how different computer applications are used for work and outside of work, and an analysis of computer users' real-world switching behavior. Based on the findings, two outcomes are presented: 1.) a new software tool that visualizes workflow to encourage users to reflect upon their work habits and their task switching and 2.) implications for the design of monitoring software, tools for self-reflection, and push or disruptive technologies such as email systems.
Keywords: HCI, task switching, distractions, interruptions, productivity, work habits, push technology, disruptive technology.
Dealing with Distractions: Analyzing and Designing for
Task Switching at Work
Elisabeth Sylvan
Master of Science Thesis
June 2003
Submitted to the Program in Media Arts and Sciences, School of Architecture and Planning,
in partial fulfillment of the requirements for the degree of Master of Science in Media Arts and Sciences
at the Massachusetts Institute of Technology
Q Massachusetts Institute of Technology 2003. All rights reserved.
The following people served as readers for this thesis:
Advisor:
Dan Ariely Associate Professor of Behavioral Economics and Media Arts and Sciences
MIT Sloan School of Management and the Program in Media Arts and Sciences
Reader:
Rosalind Picard Associate Professor of Media Arts and Sciences Program in Media Arts and Sciences
Reader:
Bakhtiar Mikhak Research Scientist MIT Media Lab
5
CONTENTS
I
INTRODUCTION ... 72 BACKGROUND LITERATURE ... 15
2.1 Attention, cognitive load and task switching ... 15
2.2 Disruptive software applications ... 16
2.3 Time discounting and impatience ... 18
3 TWO STUDIES ON TASK SWITCHING ... 18
3.1 Experiment on Task Switching ... 19
3.1.1 M ethods... 19
3.1.2 Results ... 22
3.1.3 Discussion... . . 25
3.1.4 Conclusion... 26
3.2 How Efficiently Power Users Manage their Email ... 27
3.2.1 M ethods... 28
3.2.2 Results ... 29
3.2.3 Discussion... 40
3.2.4 Conclusions... 41
4 SYSTEM DEVELOPMENT ... 42
4.1.1 Some Existing Work ... 43
4.1.2 Survey on People's Work Habits ... 44
4.1.3 Observing Task Switching in Computer Work ... 51
4.2 Design Outcomes and Implications of These Findings... 59
4.2.1 Monitoring Application Switching... 59
4.2.2 Thoughts on Monitoring Tools Used By Organizations and Individuals ... 62
4.2.3 One Prototype Based on these Findings ... 65
4.2.4 Specific Design Ideas for Systems that Support Self Aware Work Habits... 68
4.2.5 General Implications for User Interface Designers... 71
5 CONCLUSIONS ... 75
6 REFERENCES... 78
7 APPENDIXES ... 82
7.1 Task-switching Study Instructions...82
7.2 Email Survey Questions...86
7.3 Work Habits Survey Questions ... 88
7.4 Excerpt of an Example WorkSniffer Log File...90
7.5 Essay Experiment Instructions ... 91
Work Logging Observation Instructions ... 92 7.6
1 Introduction
"Yet we have all experienced time when, instead of being buffeted by anonymous forces, we do feel in control of our actions, masters of our own fate. On the rare occasions that it
happens, we feel a sense of exhilaration, a deep sense of enjoyment that is long cherished and that becomes a landmark in memory for what life should be like... The best moments usually occur when a person's body or mind is stretched to its limits in a voluntary effort to accomplish something difficult and worthwhile. Optimal experience is thus something we make happen." -Mihaly Csikszentmihalyi
Now imagine how you work when you write with your computer. Perhaps for a while the words flow easily. Then you reach a difficult section. You aren't sure
how to communicate your message so you decide to google it. As you search, you wander farther from your primary goal of writing a paper. Finally you get back to work. You are writing slowly, but writing, nonetheless. Then your computer beeps to tell that you've received new mail. Since you are curious who wrote you, you switch to find you have received a boring memo about an
upcoming meeting. When you return to your paper, you can't remember exactly what idea you were constructing before.
Does this sound familiar?
Computers have radically changed how we can work. We write without pens. We chat without saying a word. Everything is now in one place: our tools, our toys, our communication mechanisms. We write our papers, build our software, do our taxes, play solitaire, write our mothers all with one device. Our tools
have changed so profoundly we may wonder -or perhaps not remember- how we used to get things done.
Our work process has changed with the tools. Email, instant messages, and other communication tools allow us to stay connected with friends, family and associates throughout our day. Calendar systems and project management tools help us to keep our busy lives organized by reminding us what we should be doing when.
But there is a drawback to the flexibility of our preferred tool. We are often interrupted by messages competing for our attention and have ample
opportunity for us to diverge from our primary work with easy access to a variety of engaging activities such as web surfing, reading email, and game
playing. We are interrupted at the wrong time by information of variable importance that is poorly matched to our current task.
What does this profound flexibility mean in term of how we work? What is that work process like? What needs improvement and what doesn't? What can
designers do to help busy people with divided attentions?
I propose that computers may be well suited for goals in which we switch
quickly from one task to another. But they may be poorly suited for tasks that require focusing on one idea. Activities that require deep thought -such as
programming and writing - often require extended periods of uninterrupted focus. Developing our ideas may require keeping track of the big picture while working through the details. We may feel that we need a certain amount of mental, physical, and social space to allow our ideas to coalesce. Maintaining this space can be a battle and deep work requiring intense concentration may be particularly vulnerable to distractions. It is easy to switch to another task when the thinking gets hard. The sound of an email alert may cause us to lose attention. As we continue to work, repressing our thoughts about a new email surprise, our attention may be divided by the temptation of switching. If our thoughts start to stray and we begin thinking about poking around the web for inspiration, we may lose track of the mental structures we meant to build.
I suggest that when distraction is always a click away, we may not switch as
efficiently as we would like. We may move from one task to another, barely noticing how much we switch and how switching impacts our work. We may not consider the cost of switching. If work isn't fun but, say, email is, then we are tempted to read email and may not consider the problems of putting off work, just for a minute. Perhaps the immediate reward of enjoyable activities makes it persuasive. Maybe our attention moves away from our current task when we notice a message is waiting or we see our browser window open behind our programming environment. Or maybe we are just curious.
But switching may not be all bad. Even during the most intense projects, we are likely to have other important tasks that may require attention. When we need to take a break -particularly from work that is tedious or cognitively intense- we can attend to these other items. This break may help us to have a fresh perspective when we return to our work.
Sometimes the information that interrupts us is relevant or important, for instance, when interruptions are about the tasks that one we are currently undertaking. If, while programming, I receive an email from a coworker about fixing the bug that's driving me crazy, I certainly appreciate it. Other times the juxtaposition of different subjects may lead us to invent or create new ideas. If I have writer's block and don't know what to say next and suddenly a consortia talk description arrives in my inbox and sparks my imagination, I am tickled.
Our work habits impact how much and what we accomplish during our days. They also may impact how we feel about our work and how deeply we are able
to work. For a variety of reasons, understanding people's work processes and supporting them through organizational and interface design is tricky. Every person may develop a system of working, particular to herself. People may have a range of personal styles. Similar styles may be more or less successful for different people. (For instance, younger people growing up with computers as tools intrinsic to their environment may thrive on the ease of switching and
have ittle patience for restrictive work environments.) Different types of work may require different work strategies. People may be unaware or unwilling to change their habits so that they may work more effectively and efficiently.
Identifying which aspects of particulars styles are successful may be difficult.
This thesis addresses how people switch tasks. It asks what task switching looks Like, whether and when people switch well, and how productivity is influenced
by task switching. When is switching an effective means of taking a break or
getting relevant information and when is it a distraction? A series of four studies ask these questions in a variety of ways. Based on the results of the investigations, two outcomes are presented: 1.) a software application that supports efficient task-switching through self reflection on one's work habits and 2.) some implications for organizations and user interface designers.
A few comments on the scope and direction of this work seem important to
mention. A world exists beyond a person and her computer. Phones ring. Coworkers stop by. Errands need to be run and families need love and
attention. Many researchers have studies how people manage distractions in their physical environment (cf. Gruen 1996) and this topic deserves revisiting. For simplicity and scale, this thesis focuses upon interruptions and distractions on the screen only.
Also this thesis uses the literature on attention, dual tasks and cognitive load, as a foundation and addresses a different question than these topics of study do. The issue at hand is when people choose to switch tasks and how this decision affects their productivity, not what they can attend to and what is the cost of switching. I am interested in how people distract themselves when faced with a potential interruption and how this work pattern affects their productivity. This is more an issue of decision-making than it is one of information processing.
Finally, I will make a distinction between an interruption and a distraction. For this document an interruption is an incoming bit of information different than the task at hand. A distraction is when a person switches from a primary task to a secondary one.
This thesis comprises four basic sections. This first section introduces the problem and its scope, explains the relevance of this problem, and describes the structure of the remaining document.
Section two describes the relevant background literature on how people work and how their habits, their environment, and their abilities all impact how they accomplish and how they feel. Recent work on how interruptions occur in the modern workplace suggests that some of the choices in workplace design, intentional or not, sometimes come at a cost to individual productivity. The
psychological literature on attention, cognitive load and task switching explains the limits of human attention and explains how these environments challenge our abilities. Work in the economics literature on time discounting and
impatience explains how people may be tempted by short term immediate gratification and may neglect less enjoyable activities that have long term benefits. HCI studies on disruptive software applications provide insight into how our limited patience and attention are challenged by particular push technologies.
Section three describes two studies about how people manage interruptions during work. The first investigation, a four-group between-subject experiment investigates what switching behaviors are like, how much people allow
themselves to be distracted by alternative tasks and the impact the
distractions have on their task performance. Participants answered two sets of questions, the first of which was tedious but paid well and the second of which was more enjoyable but paid little. Depending on condition, the participants either completed all of one category or the other, or else have the option to switch back and forth between types of problems.
The second study examines one particular potential disruption from work, namely, email. This survey describes power users' experience with email, their understanding of the problems associated with it, and whether email is
large quantities of mail switch to and from email throughout the day and demonstrates how fractured their workday becomes. It also demonstrates that people may not have a strong sense of how to be efficient with email tasks.
Section four of this thesis presents how people using modern computers actually switch between tasks and discusses what can be determined about their productivity from watching their switching behavior. A survey of two groups of people's work habits is used to describe how people report their work habits in general. This investigation examines what people do with their
computers when they are working hard, working less hard, and not working. Another study on how people work with their computers in real world settings is then described. In this study, the Worksniffer software -created for this task- records when people switch from one application to another and how
much they type in each application. This software was installed on
participants' computers and participants were asked to describe what they were doing while using the computer. The results suggest that it is possible to identify both general and individual patterns that describe when people are working and not working.
The prototype and implications are then presented. Simply Work, is a visualization of a user's task switching and work process. The application is
built upon the WorkSniffer application used in the real-world study. This tool assists users in self-monitoring their work habits by displaying information
about how much they switch between applications and how much they type. The hope is that this tool will help users to maintain deep focus, reflect upon their work practice, and take breaks in a timely manner. Finally some
principles on how this information can be used to design both push applications and applications that encourage self-reflection upon individuals' own work habits are presented. These ideas include general thoughts on what user
interface designers might consider, what software can tell about people's work habits from their switching behavior, what organizations might tell their
employees, and what other tools might be built for self-reflection.
Ultimately the goal of this thesis is to shed some light upon how people work with their computers, what is successful and what is not, in order to provide some contribution to the understanding of how computers can better be designed for the capabilities of those that use them.
2
Background Literature
2.1 Attention, cognitive load and task switching
Psychologist's work on cognitive load and dual tasks has revealed much about the limits of our attention. The active memory that we use to manipulate information is called "short-term" or "working" memory (Miller 1956.) This type of memory is broken into "chunks," units of information (Hayes 1989). We can only keep 7 plus or minus two chunks active in our working memory at one time (Miller 1956), and always work within these basic limitation of memory.
Cognitive load, from this standpoint, is the amount of activity in working memory at a given time. If we are working on multiple tasks we wilL fill up our working memory quickly, and have to transfer different chunks in and out as we switch tasks. When we are in these high-load situations (for instance when we are switching between tasks or are interrupted), our performance on both tasks may degrade.
All interruptions are not equally disruptive. Interruptions that are similar to the
main task and require immediate attention (as email sometimes may be) seem to be more disruptive (GilLie and Broadbent 1989.) If people can negotiate when an interruption occurs, they perform better on their primary task, but they may not complete the interrupting task in a timely fashion (McFarlane
1999.) This is reassuring since many interruptions during computer work are
negotiable. And the cost of switching increases as the complexity of the rules needed for performing the tasks increases (Rubinstein et al 2001) as is the case with many computer tasks. Thus, the limits of our attention may be ill suited to
the ease of switching and the amount of incoming information characteristic of modern computer use.
2.2 Disruptive software applications
HCI researchers have investigated the cost of interruptions that are specific to
personal computers, such as email, instant messenger and web surfing. Miyata and Norman (1986) first reviewed the work on attention and dual-tasks and
specified three phases of computer tasks -planning, execution, and
evaluation- during which being interrupted would have different effects. Since then several researchers have looked at how the features of the interruption and the primary task impact the time it takes to complete both the
interruption and the task. Consistent with the findings on the traditional attention literature, Cutrell et al (2000) interrupted instant messenger users during these different phases and found that being interrupted during
evaluation resulted in significantly longer completion times than during the other phases and that interruptions with irrelevant information took longer to recover from. Bailey et al (2000) also found that the type of work (such as addition, reading comprehension, image comprehension) impacted the amount of time it took to complete a task after an interruption.
Other researchers have observed real-world switching behavior. Jackson et al (2001) focused on email usage and found that it takes on average one minute and 44 seconds for employees to react to a new email confirmation! In addition, it took an average of 64 seconds for them to recover and return to their work after they finished with the email. Given this number, a person who receives 50 emails a day one at a time and switches to read each one would experience almost an hour in recovery time alone from email. Thus it is just as important to understand how people choose to switch tasks and not just the limits of their attention.
2.3 Time discounting and impatience
Even if we have some understanding of cognitive load and the cost of
switching, we may not adjust our work habits accordingly (as the author can certainly attest to!) The short-term benefits of pleasurable activities are clear: we enjoy them. Activities, such as work, that are not fun but are important, are harder for us to envision while we can see the costs of work today clearly. What is in front of us is immediately salient. What will happen later is not.
Philosophers, psychologists and economists alike have documented this mode of operation throughout the years. (cf. Ainslie and Haslam). Behavioral
economists call this "time discounting." The further from now a reward will be received, the less its perceived value is. This idea, which has been used to explain many behavior sets from addition to procrastination, is useful to
unpack why we may switch tasks even if we know we shouldn't. It may be hard to see the long-term benefit to staying on task, especially if the switches feel short and transient. But from the attention literature, we know that, in fact, these switches do have negative impact upon our work.
3 Two Studies On Task Switching
It is important to understand not only what people can reasonably attend to when faced with dual-tasks but also how they choose to switch. This section
discusses two studies that investigate this issue. The first is an experiment on task-switching in which people can choose whether they should work on a
quick, fun variable but low-paying task or a more tedious, high paying one. The second study looks at how two user groups who rely heavily on email manage and perceive it.
3.1 Experiment on Task Switching
This experiment addresses whether people switch between tasks efficiently and how costly their switching is to their productivity. A four-group, between-subject experiment was run in which the experimental groups were able to switch between two problem solving tasks at will whereas the control groups could not. I hypothesize that time on task, performance, and switching behavior are negatively impacted by the ability to switch between tasks.
3.1.1 Methods
Thirty-two participants were recruited through on-campus flyers at MIT. Participants included undergraduates, graduate students, researchers, administrators, alumni and business people. After reading and signing the consent form and completing a brief demographic questionnaire, participants were told they were going to solve puzzles on a computer and the procedure was explained (Appendix 1).
Figure 1: Seen Control Condition without Problem Being Displayed
This application was built using Macromedia Flash and Visual Basic scripting. ALL participants solved the same set of 5 primary task problems and ten secondary task problems (see Figure 1.) For the primary task problems subjects were asked to add up multiple numbers until they reached the sum of 100, or if that was too challenging, any number between 80 and 120. For each problem there were eight to twelve numbers in a set and finding the total of 100 required between three and five numbers. The numbers were added up for the
participants as they selected boxes next to each number. Still these problems were difficult because the problem space was very large.
The secondary task problems were alphanumerical sequences or sets of items in which the participant had to select which additional item belongs in the set. Payment was depending upon how they solved these questions. Responses were either multiple choice or fill in the blank. Participants in post-experiment
interviews described some of the secondary problems being harder than the primary problems and some easier.
Figure 2: Unseen Control Condition with Add to 100 Problem Displayed
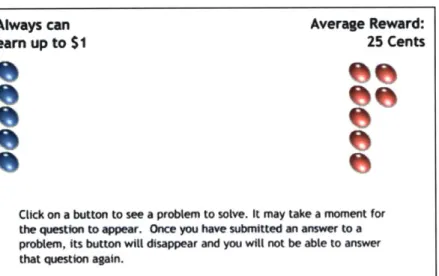
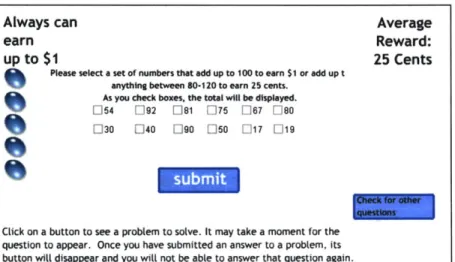
Payment was dependent upon task performance. For each primary task
problem solved correctly a participant earned either one dollar for adding the numbers up to 100 or 25 cents for adding the numbers up to any number between 80 and 120 except for 100 (see Figure 2.) The secondary problems were worth on average 25 cents. Participants were told some would be worth more than 25 cents and some less but they were not told exactly how much the problems were worth before solving them. All the secondary problems were worth five cents except one that was worth $2.05. When they selected the problem, they saw the value of it, along with the problem itself.
Always can Average
earn Reward:
up to $1 25 Cents
Please select a set of numbers that add up to 100 to earn $1 or add up t
anything between 80-120 to earn 25 cents. As you check boxes, the total will be displayed.
[154 [7192 [181 [7175 [67 n-80
[130 [2140 090 [350 [117 E119
Click on a button to see a problem to solve. It may take a moment for the question to appear. Once you have submitted an answer to a problem, its button will disappear and you wilL not be able to answer that question again.
In the two control conditions participants either a.) submitted an answer for each of the primary task problems first and then the secondary task ("the add to 100 first" condition) or b.) submitted an answer for the entire secondary task first and then the primary (the "sequence completion first" condition). In the first experimental condition, the secondary task problems appeared while the participants were working on the primary problems (the "seen"
experimental condition.) In other words, when the participant first started the application, no secondary problems were visible. As they worked, one appeared and then another, etc. In the second experimental condition, the secondary task problems appeared while the participants worked on the primary task problems, but they had to click a button make the problems visible (the
"runseen"p experimental condition.) Participant could switch between problems as they wished, but once they submitted their answer, the associated problem would disappear. Subjects knew that they were limited to 20 minutes to complete as many problems as they could.
A log file recorded every time a participant looked at a problem, and if they
submitted an answer, what they answered. Every action was recorded with a timestamp to the second.
3.1.2 Results
Three sets of variables were analyzed: amount of time on task, number of correct answers, and number of switches. All analyses were unpaired t-test.
3.1.2.1 Time to Complete Tasks
A significant difference in total time on all problems was found between the
experimental seen condition (M=701, SD=1 70) and the add to 100 first control (M=934, SD=152), t(14)=-2.89, p <.01. and also the sequence completion first control (M=926, SD=167), t(14)=-2.67, p<.01. The data is tending towards significance on the total time for all problems between the experimental unseen condition (M=719, SD= 344) and both the add to 100 first (M=934,
SD=152), t(14)=-1.614, p =.13 and sequence completion first (M=926, SD=167), t(14)=-1.528, p=.15) controls. When one outlier that was more than two
standard deviations away was removed from the unseen experimental condition, a significant difference on total time on all problems was found between the experimental unseen condition (M=609, SD=164)and both the add
to 100 first (M=934, SD=1 52), t(13)=-3.981, p<.001 and sequence completion first controls (M=926, SD=167), t(13)=-3.699, p<.002.
A significant difference in time on the "add to 100" problems was found between the experimental seen condition (M=399, SD=1 62) and the sequence completion first control (M=573, SD=1 56), t(14)=-2.184, p< .05, but not the add
to 100 first control. A significant difference in time on the "add to 100" problems was found between the experimental unseen (M=313, SD=1 58)
condition and both the add to 100 first (M=572 SD=1 56), t(14)=-3.314, p<.005. and sequence completion first (M=519, SD=225), t(14)=-2115, p<.05 controls.
There were no significant differences on the time spent on the sequence completion problems.
Note that the direction of all effects was the inverse of what was predicted: those in the experimental conditions took significantly less time than those in the control conditions.
3.1.2.2 Correct Answers
There were no significant differences on total number of correct answers, number of correct sequence completion answers, or number of correct add1O answers, whether including only perfect responses (added up to 100) or both perfect and imperfect responses (added up to any number between 80 and
120).
3.1.2.3 Amount of Switching
When all switches were counted (including switching within one set of
questions for both the control and experimental conditions and across types of questions for the experimental conditions) and also when only switches within types of questions were counted, there were no difference in the total number of switches between any conditions.
3.1.3 Discussion
In this experiment, the ability to switch tasks did impact how quickly people solved problems, but in the opposite of what was predicted. People who could switch between tasks actually solved the problems more quickly without a cost to their overall performance. Why did this occur?
One explanation is that people managed their time better when they could switch. They took timely breaks. Switching then may have reduced
interference between successive iterations of the same task, as well as possibly giving subjects a chance to recover from mental fatigue.
Also there may not have been dual-task interference as expected. Both tasks were easy to understand. Participants may have been able to reestablish
context without increased cognitive load. One would only expect performance differences if the experimental groups were highly cognitively loaded and seeing other problem pop-up or knowing they would pop up or switching out of frustration and losing time in the switch caused their performance to degrade.
A final post-hoc explanation involves the impact of affective state on
performance. Informal discussion with control condition participants revealed that not knowing how difficult the next task was or how much time it would take was stressful and unpleasant. That finding, coupled with the experimental outcome, suggests a similarity between this experiment and many done by
Alice Isen. She and her associates have used methodologies in which
participants in different experimental conditions perform the same tasks as each other, but with slightly different affective states. They have found that time on task degrades when negative affect is induced and improves when positive affect is induced (cf. Estrada, Isen & Young 1998). It is quite possible that control subjects were more frustrated and therefore performed more slowly than those who could switch.
It is worthy of noting that one reason mathematical and logic puzzles were used as a manipulation was because the student population, who comprised a large percentage of the participants, enjoyed them and were very good at solving them. Earlier versions of the study involved easier questions, which were too easily solved. Therefore in this version the problems were more
difficult. It seems that even with the increased difficulty of the problems there may have been a ceiling effect on task performance.
3.1.4 Conclusion
In the future better competition between the two tasks might reveal findings that correspond with the predictions in the current study. This may be due to limited cognitive load between tasks or to an unintended negative affect manipulation in the control conditions.
3.2 How Efficiently Power Users Manage their Email
For many computer workers, email is a critical tool for managing relationships, communicating professional needs and organizing work throughout the
workday. Indeed some individuals manage so much email that recently Deborah FalLows of the Pew Internet and American Life labeled this group, "power users" (2002). Most of her respondents reported that they receive little email and are not disturbed by the amount they receive. However, the power users apply email to the widest range of tasks (such as arranging appointments,
managing documents, asking questions about work) and reported being more accessible than non-power users, that the email load posed more of a problem than non-power users, and that they approach their email as necessary chore. These findings suggest that though power users appreciate email, they
recognize that it comes at a cost. And based on the Jackson et al's findings how long his participants to recover from a switch (2001), this cost may be greater than the respondents believe.
Yet users may be distracted by email may if they switch in a way that is either not efficient or based a real need to read and respond. I propose that when people switch from other applications to email, they underestimate the time it will take to return to their previous task and also that people have a hard time resisting the temptation of reading email.
The current investigation examines power users' experience with email, their understanding of the problems associated with it, and whether email is
disruptive to work. It first discusses how much email the participants receive, how frequently users read and respond, and how much time they spend on it as an attempt to quantify how much of the participants workdays are spent on email and also how fragmented email checking might make it. Then it
investigates what percentage of the email people receive is perceived as urgent. If a lot of email is urgent, it makes sense to check often and, perhaps, spend a lot of time on email. Finally it investigates what the participants feel is an efficient way to check their email and whether they do it.
3.2.1 Methods
Two separate surveys were conducted. For the first survey, 228 MIT undergraduates from computer science and electrical engineering were recruited through a departmental mailing list. Participating students were entered into a lottery to win a gift certificate to the campus store. For the second survey, 43 Media Lab corporate sponsors and 5 lab members were
recruited from a laboratory mailing list. These participants were unpaid.
In both cases participants filled out an online survey that asked them to identify how many emails they received a day, how much time they spent on email, whether their email client checked for email, how often the client or they checked for email, how often they read their email, how often they
responded, the percentage of email that was urgent, what time schedule of checking email was the most efficient and if they didn't check their email in the most efficient way, why not (see Appendix A). In addition, laboratory participants were asked what their affiliation with the lab was (laboratory sponsor versus employee.)
3.2.2 Results
3.2.2.1 Amount of email received
Knowing the amount of email someone receives is one basic measure of how disruptive it may be for them. If they receive very little email, it is likely that they are undisturbed by it. Of course, if they receive many emails, this does not necessarily mean it is a problem. But it would suggest a need for further inquiry.
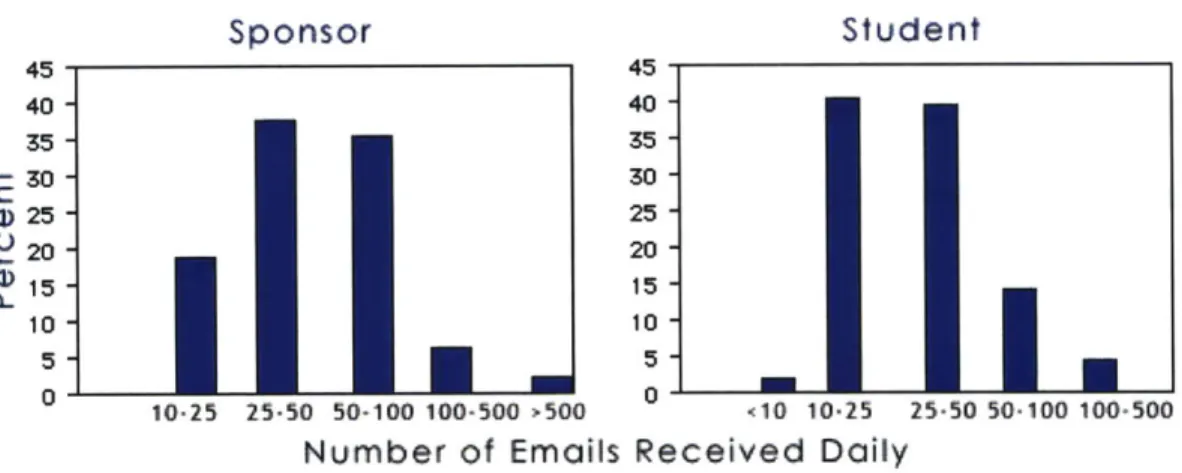
Respondents reported how much email they received using a 6 point scale: less than 10, 10-25, 25-50, 50-100 100-500 and greater than 500.For each category of response on an average value was calculated, e.g., the category "10-25" was scored as 17.5. The score for >500 was counted as 600. (This same method of finding the middle value and using it to find an overall mean is used to
compute means throughout this email section.) Computed in this way the mean number of emails received for sponsors was 51 and for students was 75. Eighty percent of laboratory sponsors reported that they receive between 25 and 100 emails daily. Seventy-three percent of student reported that they receive
between 10-50. Both groups report that they receive a substantial amount of email daily (see Figure 3.)
Sponsor Student 45 45 40- 40 -35 - 35 -30- 30 -) 25 - 25 -% 20 - 20 -15- 15 - 0-10 - 10 -5 5 0 10-25 25-50 50-100 100.500 >-500 <10 10-25 25-50 50-100 100-500 Number of Emails Received Daily
Figure 3
3.2.2.2 How often they check email
These two populations receive a large number of emails a day. But how often do they actually stop what they are doing to check their email? If they do it often, it is more likely that their email is taking them away from other tasks.
Participants were asked whether they had a email client that checked their email and how often it was set to check for email, and if their client didn't check, how frequently they themselves checked. Based on informal feedback from participants, it appears that the phrasing of these questions was
confusing. Also it is possible that some participants were unaware whether and how often their email clients checked for mail. Both of these points should be taken into consideration when reviewing the findings in this section.
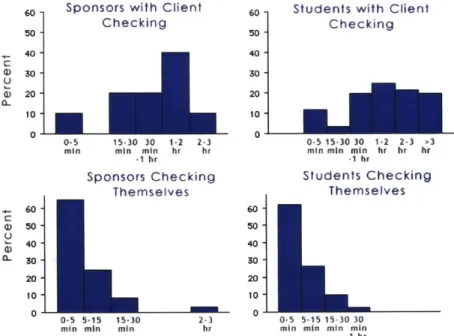
Respondents reported how often they checked their email using a 7 point scale:
0-5 minutes, 5-15 minutes, 15-30 minutes, 30 minutes to 1 hour, 1 to 2 hours, 2
to three hours, and over 3 hours. Twenty-seven percent of sponsors and 39 percent of students reported that their email client checked for mail
automatically (see Figure 4.) For sponsors forty percent of their clients checked between once and twice an hour and for students about 20 percent reported for each of the time intervals over the 15 to 30 minute time interval. For the participants who checked themselves, 53 percent of sponsors and 44 percent of students checked between every 5 and 15 minutes.
6. Sponsors with Client 6o. Students with Client
5o- Checking Checking
40 - 40 -0 30 - 30 U 0) 20 -20-10- 10-0 0 0-5 15-30 30 1-2 2-3 0-5 15-30 30 1-2 2-3 -3
min min min hr hr min min min hr hr hr
-1 hr .1 hr
Sponsors Checking Students Checking
Themselves Themselves 60- 60 -0D 50- 50-U 40- 40-CL 30. 20- 30 - 20-10- 10-0-5 5.15 15-30 2-3 0-5 5-15 15-30 30 min min min hr min min min min
-1 hr
How Often They Check Their Email
Figure 4
3.2.2.3 How often they read email
In the current survey participants were asked separately how often they checked or their software checked for email and also how often they read the body of the email, which is what is reported in this section. Checking email
may distract us only for a moment, but reading email distracts us longer and there is likely a longer switch time cost as well. Respondents reported how often they read their email on a 7 point scale: 0-5 minutes, 5-15 minutes,
15-30 minutes, 15-30 minutes to 1 hour, 1 to 2 hours, 2 to three hours, and over 3 hours. Sponsors read email every 98 minutes and students every 52. 53% of sponsors read their email every 5 minutes and 83 percent read it within every
30 minutes (see Figure 4.) Similarly, 44 percent of students read email within
every 5 minutes and 74 percent read within every 30 minutes. Using the same method of converting the categorical data to average values as before, the mean value of time spent on each email for students was two minutes and for sponsors 4.3 minutes. Sponsor Student 60 60 50 50 40 40 30 30 20 20 10 10 0 0-5 5-15 15-30 30 1-2 2-3 0 -5 5-15 15-30 30 1-2 2-3 >3 min min min min hr hr min min min min hr hr hr
.1 hr -1hr
How Often They Read Email
Figure 4
But reading email, which here seems to happen quite often, is only part of email management. Sometimes you have to respond.
3.2.2.4 How often they respond to email
One could argue that reading email is fun but and writing is tedious and time-consuming. Responding to email likely takes up more time than reading. How often do these two groups respond to email?
Respondents reported how often they responded to their email using a 7 point scale: 0-5 minutes, 5-15 minutes, 15-30 minutes, 30 minutes to 1 hour, 1 to 2 hours, 2 to three hours, and over 3 hours. The sponsors responded to email every 56 minutes and students every 97. Even though they read and receive email a lot, 53 percent of students respond rarely: less than every 3 hours. Sponsors describe their response rate to email quite differently in that there is a greater spread to how often sponsors respond. Twenty-eight percent respond between every 5 minutes to 15 min, 18 percent respond every 30 minutes to one hour, and 22 percent respond every one to two hours (see Figure 5.)
Sponsor Student 60 60 50- 50 40 40 o 30 30 16-0-20 20 10 10 0 0-5 5 15 15-30 30 1-2 2-3 >3 0 0-5 5-15 15-30 301-2 2-3 3
mn min min mi hr H r hr m m mie mni hr hr hr
. rHow Often They Respond -1 hr
3.2.2.5 Amount of time on email
It appears that both populations check their email at astounding rates and sponsors respond often while students do not. But if this checking takes little time, then we need not be concerned that email cuts into their workdays. This next section asks how much time is spent on email.
Respondents reported how much time they spent on email using a 7 point scale: 0-5 minutes, 5-15 minutes, 15-30 minutes, 30 minutes to 1 hour, 1 to 2 hours, 2 to three hours, and over 3 hours. Sponsors spent on email 71 minutes on average while students spent 53. About 45% of sponsors spend 1 to 2 hours on email every day and 28 percent spent greater than 2 hours (see Figure 6.) Students spent a wide range of time but 85% spent 15 minutes to 1 hour. Still some spent very little (10 percent spend less than 15 minutes) and few spend a lot (only 6 percent spend over 2 hours.) Students may spend less time on email than sponsors since they respond so infrequently.
Sponsors spent a mean of 4.2 minutes on each email they receive and a median of 1.6 with a standard deviation of 8.22. For students the mean amount of time per email was 2.0, the median was 1.3 and the standard deviation was 3.4. This seems like a reasonable amount of time to spend on email. However, it is possible that the amount of time on email was under-reported. If people are constantly reading their email, as the previous section suggests, they may be using email as a means of taking a break during intense work. (Informal
35
personal communication with these populations and others support this
speculation.) If email is used as a distraction when work is difficult, users may not be accomplishing as much as they might without email and also they may find it difficult to accurately report this small time intervals.
Sponsor Student 50 -5 40 4 C30 0 30-3 G 20 20 0-to-I I I I . 0 15-30 30 min 1-2 2-3 >3 0-5 5-15 15-30 30 1-2 2-3 >3
min -1 hr hr hr hr min min min min hr hr hr
Time Spent on Email Daily 1 hr
Figure 6
3.2.2.6 Percent of email that is urgent
If people believe that a great deal of their email is urgent, they should read it
and respond often. But if they don't believe much of their email is important, they should read and respond infrequently. Since these two populations do spend a good amount of their days on email, one would hope that a great deal of their email is urgent.
Sponsor Student 90 90 80- 80-70 - 70 -60 - 60 -0 5-0 - 50 -240- 40 -30- 30 -20- 20-10- 10 0 10 20 50 70 0 10 20 50 70
Percent of Email Received That is Urgent
Figure 7
Respondents reported how much of their email was urgent using a 6 point scale: 5%, 10%, 25%, 50%, 75%, and 100%. On average sponsors rate 16 percent of their email as being urgent while students rate 12 percent urgent (see Figure
7.) 70 percent of sponsors and 80 percent of students say that around 10
percent of their email is urgent. Thus they believe very little of their email requires immediate attention. But if so little email is urgent, then it may not make sense to spend so much time on it. It is possible that these respondents do not manage their email efficiently as they might. Still, if these small numbers of email are extremely important, it may be worthwhile for the
respondents to check their email regularly. The next section addresses whether these two groups of email users may answer this open question by addressing what they think is the most efficient way to check email.
3.2.2.7 The most efficient way to read email
These participants spend a lot of time on email though little of this mail is urgent, which seems inefficient. But what do they think? Do they believe that they read email in an efficient manner?
Respondents reported what they thought was the most efficient way to read their email using a 7 point scale: 0-5 minutes, 5-15 minutes, 15-30 minutes, 30 minutes to 1 hour, 1 to 2 hours, 2 to three hours, and over 3 hours. Sponsors reported it was most efficient to read email every 53 minutes on average and students reported 135 minutes on average (see Figure 8). Seventy-three
percent of students believe that email should be read once an hour or less and
32 percent believe that email should be read every three hours or less.
Students firmly believe that email should be read infrequently than they actually do. Sponsor Student 35- 35-30 30-25 25 -20 20 -4) 15 15-4) CL 10 10 -5 5 0 0-5 5-15 15-30 30 1-2 2-3 >3 0-5 5-15 15-30 30 1-2 2-3 >3
min min min min hr hr hr min min min min hr hr hr
-1 hr -1 hr
Most Efficient Way to Read Your Email
For sponsors the spread in responses was greater. Forty-seven percent believe that the most efficient way to read email between every half hour and two hours whereas 36 percent believe it is best to read between every five and thirty minutes.
However, in both cases, some of the respondents who read their email most frequently express a belief that to read far less frequently is preferable and a few seem to think reading much more frequently is most efficient.
3.2.2.8 The Relationship between Perceived Efficiency and Reading and
Receiving of Email
With some exceptions, these two populations overall feel that they check their email in an fairly efficient manner though some believe that checking less often is preferable and a few think more often is better. What do these
populations base their assessment upon?
The data was coded as reading more often than what is perceived as most efficient, reading less often, and reading the same amount. Forty-two percent of sponsors and thirty-nine percent of students believe that they read their email the most efficient way whereas thirty-three percent of sponsors and eighteen percent of students feel they read too often and twenty-five percent
of sponsors and forty-three percent of students feel they read not often enough. This same pattern is seen in the following plot of the difference
between the reported reading rates and the perception of most efficient reading rates of both students and sponsors. Positive numbers indicate the amount they feel they read too much and negative numbers indicate the amount they feel they read too little.
6
0 0
4 00 0 0
0 0
v2 -ca 0 0 o o D 0
£ MC 0OCI 0 (M ODO 0 0 XIO
. 0 0 Student -c 0oo oo o o sponsors Z -2 CDl 00CD C)00 00Z 000 ; oW ODO 0 oCD OC 0m 0 4 co 0 0 0 o0 00 0 0 0 00 -6 00 0 Participants
Difference between Reported Reading Rates and Perception of Most Efficient Reading Rate
Figure 9
Many sponsors and students seem to believe they are reading the right amount. It is possible that these groups read their email in the most efficient way, however, it seems more likely that they base their evaluations of efficiency upon their own behavior. There seems to be a trend that some sponsors feel they should read less often and students feel that they should read more often.
3.2.3 Discussion
Previous work suggested that only the most engaged email users believed that email had serious drawbacks and even they saw great benefit to the medium as well. Still, email users tended to read their email often and switching back from email came at a cost to the first task at hand.
In this study, two groups of computer users who receive a large amount of email daily describe their experiences with the communication medium. Both groups, but the sponsor group, in particular, read their email with amazing frequency, suggesting that email likely distracts them from other tasks at work.
If so few email messages are urgent, as both groups reported, perhaps it is not
in the users interest to read as much as they do and certainly it is not in the sponsors best interests to respond as much as they do. Students may read and respond less often than sponsors simply because email means something very different to them. Email may be work for students rarely and when it is, a response within a day may be fast enough. On the other hand, sponsors may respond quickly because communication is a key part of their work and a fast turn-around is expected. In fact, their image at work may, in part, be based on their responsiveness and how quickly they respond to email may be one facet of this measure. But if this expectation is based on a sense that everything is urgent, even problems that are not important, and it interferes with the sponsors work, the speed of response required in business may actually do a disservice to the productivity (and perhaps, well-being) of its workers.
One could reasonably consider it encouraging that an overall trend was found between how the participants read their email and what they felt was the most efficient way to do so. They may be very efficient at checking email. On the other hand, they may simply be saying that their own way is most efficient without giving it more thought.
Two final caveats: this investigation relies upon participants' self-reporting of their experiences. It is possible that particular features of their email usage may be under or over exaggerated. People may exaggerate to make themselves appear more favorably. They may not remember junk mail or may not count certain messages such as news and mailing lists. Observation of real-life email
behavior would be an excellent complement to the current study. Second, this paper assumes that email takes away from work time. But email may instead replace other means of communicating and taking breaks. Email may even save time if it helps people to maintain relationships and take breaks more
efficiently. Still, this does seem like an unlikely explanation given the amount of task-switching these participants described.
3.2.4 Conclusions
Though previous research is split upon whether email is often a distraction for intense users, this study found that some users spend a good part of their day using it and distract themselves from their current work to manage mail. This
rapid switching likely comes at a great cost to the individual's productivity, if not their satisfaction with their workday.
Since these groups of users switch often do not have a strong sense of how to determine how to make their email usage more efficient, designers of email clients might want to take the cost of switching to and from email into account in their interface designs. The findings of this study also suggest that more research into describing efficient email checking is warranted. Some specific ideas about design of push applications and future research are discussed in the last section of this thesis.
4
System Development
4.1 Investigations into Work Habits
By closely observing how people work with their computers, we may be able to 1.) learn when they are working efficiently and when they are not and 2.)
understand when interfaces support efficient work and when they don't and 3.) how interfaces can be improved. This next section describes work on software that tracks how people work with computers and makes assessments or
recommendations to better support their activities, particularly through self-reflection upon work habits.
4.1.1 Some Existing Work
Researchers have used a variety of techniques to track users work and also to provide feedback about it. Lockerd and Mueller's Cheese project tracked how web users' moved their mouse and then created a model of the user (2001). Microsoft Research is working on several systems that not only track but also
use the information to try to adapt to the user's current and long-term needs. I'll mention here only two from their Adaptive Systems and Interaction Group's suite. Lumiere, a compelling user modeling system project that lead to the
dreaded Microsoft paperclip, used a Bayesian network to decide what a user is doing by looking at how the person was using different software applications currently and through a persistent model of the user's expertise (Horvitz et al
1998). LookOut mixed-initiative system parses text about scheduling
appointments from email messages and automatically opens Outlook's calendar and fills in what it knows about the appointment (Horvitz et al 1990). The user can then accept, modify, or reject the appointment.
This previous work does not focus on how people switch tasks with their computers, which may well be an important problem. The following two investigations consider how people switch tasks, whether they seem to switch well, and whether they appear to have insight into the cost of switching. The first is a survey on how people use different applications when they are working hard versus when they are using their computers, but not for work.
4.1.2 Survey on People's Work Habits
To understand when people switch tasks while working with their computers, one must first identify what is the unit of a task and when a switch occurs. One very basic way to identify switching is to look at switches between computer applications. However, not only must we know that people are switching, we also need to know whether the task being switched to and from are work-related. Is it possible to label certain applications as being used primarily for work or not for work? In this investigation, two groups of computer users were asked about their habits using a computer while working and not working and some interesting patterns were found.
4.1.2.1 Methods
One hundred and seventy one MIT undergraduates from the computer science and electrical engineering department and 83 laboratory sponsors were recruited through mailing lists. Participating students were entered into a lottery to win a gift certificate to the campus store whereas sponsors were unpaid.
Participants filled out an online survey that asked them to identify what application they had open both when they were working hard without
distraction and also when they were using a computer not for work (Appendix 7.4). They were then asked to rank in order how much they used the
4.1.2.2 Results
Some applications were jPercent of Respondents Who Had Application Open in
described by participants as Different Work Conditions
being used primarily for
Work Hard
Not
Work
either work or not for work
(Table 1). For instance, Wo Processing
spreadsheet, programming
. Sreadsheet 5
statistics, and mathematical
. Programmning
programming applications r
Web
were almost never used for
tatistics& Math 1 1
anything but work for these
Games 11
user groups. Word processing
Mutedia diting 3 17
was used for work often and L ELitingJLia
usic Listening 4 103
only a small amount for not
Web EditorA 22
work.
Organizer 6 3
Table 1
Games and multimedia authoring was used by both groups primarily not for working. Though these users report that they listen to music much more often while not working, many listen while working as well. Email, web and
organizers were all used in both categories and cannot be used as a means of distinguishing work from non-work for these users.
It appears even more can be determined about when people are working by looking at which applications were open only for working, only for not work, or for both or neither conditions (Table 2).
Some applications were open predominantly for work only including
programming, spreadsheets, statistics and mathematic applications. Games was the only type of application opened predominantly only when not working. Other applications were used either for work or for both work and not work such as word processing, web and email. Still there were differences between which applications the students had open versus the sponsors.
It is useful to know what application people have open when they are working but it is even more important to know what applications they are actually using. Table 3 presents how many participants ranked particular applications in
both the working and not working conditions and the average difference
between the ranks in the two conditions. (Participants only ranked applications that they used in a given condition so in many cases applications were not ranking both for work and not for work.) A negative score indicates that the particular application was used more for work whereas a positive one indicates it is used more not for work.
Some applications were used more both for working and not for working than others. Web browsers and email were used by both students and sponsors for working and not for working. Many students also listened to music under both conditions. A greater percentage of students used more applications than
sponsors. Students played games, listened to music, edited multimedia and to a lesser extend used email much more when not working. Sponsors also played games, and listened to music but also used their web editors and to a lesser extent the web when not working. It is interesting that students actually rank web usage similar for work and not for work whereas sponsors do the same with email. Students may use the web for research on homework assignments as well as for having fun whereas sponsors may collaborate and organize via email as well as sending personal messages.
Across the two user groups, some applications such as statistics, math and programming were used predominantly for work while others were used
when people are working and not working can be distilled from observing which applications they have open and how much they use those applications. For some critical applications such as web browsers and email clients, it is likely the story cannot be uncovered without knowing something about the content that people are writing or reading.
The two user groups might have very different computer use patterns when working versus not working. It is encouraging that these users' descriptions of their own work habits might help systems that identify which applications are used for work and which are not. One could imagine user groups that would definitely have different patterns for applications being open for work versus not for work. For instance, designers might have multimedia authoring tools open while working. And a businessperson who yearns to be a writer might use a word processing for personal pursuits. Individual users likely have work patterns that systems could likely identify with some ease. The more difficult part would be interpreting when someone is working or not, when their given state of working is consistent with what they wish to be doing, and how to best support the user's desired work habits.
It is interesting to know how people report upon their work, but their reports might be quite different from what they actually do. The next study analyzes how people work on real-world tasks.
51
4.1.3 Observing Task Switching in Computer Work
The previous survey on work habits asked people to report upon what
applications they use and how much when they are working and not working. Still this information needs to be related to how people work in real life in order for its findings to demonstrate that it can be used to help identify real work habits. By looking at what applications people have open, how much they use them and how much they switch between applications while they work, the following study provide insight into how people manage multiple tasks in the
real world. The goal of this section is to use minimally invasive monitoring software to identify particular patterns of when and how people are working. Designers can use this information to build interfaces that support the best of habits and to discourage the worst. For instance, interfaces could know how and when to interrupt or could integrate applications that are often used together.
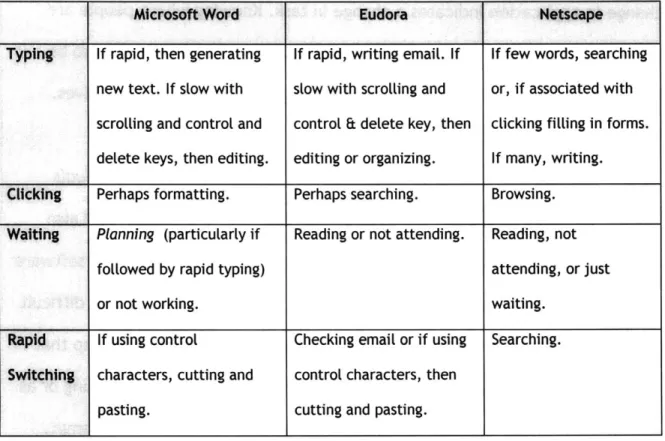
This study uses an application, WorkSniffer, that logs people's work habits. Built using C++ and Windows API calls, this application, which is invisible to the user, logs when people logon to a machine, when they open applications, when they switch between applications, and how much they type alphabet
characters, numeric characters, shift, control, up, down, left, and right (Appendix 7.5).