Collective Cellular Behavior on Curved Surface
by Wenhui Tang
B.Eng., Xi’an Jiaotong University (2018)
Submitted to the Department of Mechanical Engineering in partial fulfillment of the requirements for the degree of
Master of Science
at the
MASSACHUSETTS INSTITUTE OF TECHNOLOGY
May 2020
© 2020 Massachusetts Institute of Technology. All rights reserved.
Signature of Author:
Department of Mechanical Engineering May 15, 2020 Certified by:
Ming Guo Associate Professor of Mechanical Engineering Thesis Supervisor Accepted by:
Nicolas G. Hadjiconstantinou Professor of Mechanical Engineering Graduate Officer
Collective Cellular Behavior on Curved Surface
byWenhui Tang
Submitted to the Department of Mechanical Engineering on May 15, 2020 in partial fulfillment of the
requirements for the degree of
Master of Science in Mechanical Engineering
ABSTRACT
Organ surface is tiled by a confluent monolayer of epithelial or endothelial cells, thus providing a physical barrier to the external environment. Cells on these confluent layers often remain static and non-migratory. However, they can also undergo active structural rearrangements during basic physiological processes such as embryonic development, tissue repair as wells as tumor metastasis. While most of existing research of collective cellular behavior are on flat two-dimensional (2D) space, most native biological systems however are intrinsically curved, including mature respiratory bronchioles, alveoli, and embryonic tissues. There are fundamental reasons to suspect that such curved geometries will alter collective cellular dynamics in a non-trivial manner. In particular, as the radius of curvature decreases, it inevitably affects packing of objects on the surface. Furthermore, cells on curved surfaces can generate significant out-of-plane force while developing anisotropic cytoskeletal organization. Yet the role of curvature to collective cellular behavior is underestimated and relatively unknown.
In this thesis, we aim to answer two questions: (1) How does the substrate curvature affect collective cell migration; (2) the mechanism of cells packing on sphere as a soft, active material. Different from previous studies, we applied a full set of methods to describe collective cellular behavior and interpreted the phenomenon from a statistical physics perspective. First, we analyzed the individual cell migration properties; density, velocity, and mean square displacement (MSD) are discussed. Next, we explored how cells group themselves as they collectively migrate, in particular how these collective behaviors react to the variation of curvature. Briefly, velocity spatial correlation and correlation length are calculated. Then in order to give a complete description of migration, collective migration velocity field is decomposed into divergence, curl and shear. Different magnitude and pattern size were observed on different curvatures. Results suggest that cells are able to ‘sense’ curvature in a collective manner rather than by individual cells. As a further exploration, we tested a more natural system,
‘alveolosphere’, derived from the human induced Pluripotent stem cells (iPSCs) in a three-dimensional (3D) environment. Similar results are observed that confirms our analysis.
We anticipate that these novel findings will offer fundamental insights into the physical basis of embryonic development and tumor invasion, as well as providing insight into how the packing and migration of cells underlie tissue morphogenesis.
Thesis Supervisor: Ming Guo Tile: Associate Professor
Acknowledgement
I would like to first express my greatest appreciation to my advisor Professor Ming Guo. Ming gave me the opportunity to do cutting-edge research at GuoLab, led me into the field of biophysics and guides me with his profound knowledge and insights. I always ask for advice and he never get tired of teaching me the fundamentals from physics perspective. He also teaches me a lot on how to develop a logical thinking when telling research stories. I’m impressed by his enthusiasm and passion to science and he influences me a lot. Besides, Ming has always been considerate and talking to him is very comfortable. I also benefit from Ming’s brilliant way in collaborating with people. I cannot become more proactive in reaching out without his continuous encourage and support. I am really lucky and proud to have Ming as my advisor in the past year and in the future.
I would like to thank my collaborators, Professor Max Bi at Northeastern University, Professor Darrell Kotton at Boston University, Dr. Adrian Pegoraro at University of Ottawa, Dr. Alexander Mietke at MIT math department for collaboration and helpful discussions. Working together with them are fantastic experiences. I really gained a lot of knowledge in physics, math and biology from them, and get inspired by their brilliant ideas.
I would also like to thank my labmates and mentors at GuoLab. Dr. Yulong Han and Dr. Yiwei Li taught me lots of biological experimental skills, such as cell culture, confocal microscopy, immunofluorescence staining and many others. My labmates Satish, Fan, Haiqian and Vira also gave me lots of helpful suggestion. It’s my great honor to work with them at GuoLab.
I would like to thank my amazing friends since undergraduate, Honglin, Kehan and Yanke. Although we are on the opposite ends of the earth, we have been chatting online every day since we graduated and it seems we’ve never been apart. They bring lots of fun to my life and accompanied me during my ups and downs. And thanks to Changyu, too. I would also like to thank all my new friends in the past two years at MIT. Thank you all for spending time doing happy things together.
Finally, I would like to thank my family. I am very lucky to have wonderful parents who give me fully freedom to explore my interest since childhood, who love me and support me without any condition. I am really grateful that they spend lots of time to accompany me and play with me since I was a child. I can still remember how excited I was when my father made me windmill using wood and collected various kinds of leaves and made them into specimen for me, my mom taught me to be independent since I was a child…Words cannot express my deep gratitude and love to them.
Table of Contents
Abstract 3 Acknowledgements 5 Table of Contents 7 List of Figures 8 List of Tables 15 1. Introduction 161.1 Collective cell migration on curved surface 16
1.1.1 Collective cell migration in biological systems 16
1.1.2 Collective cell migration on flat surface 17
1.1.3 Collective cell migration on curved surface 21
1.1.3.1 Fabrication of curved substrates 21
1.1.3.2 Cell velocity on curved substrates 22 1.1.3.3 Cell height and attachment on curved substrates 23 1.1.3.4 Cell organization and orientation on curved substrates 25 1.1.3.5 Statistical physics of cells on curved substrates 26
1.2 Cells packing on sphere 28
1.2.1 Colloidal particles packing on a sphere 28
1.2.2 Active matter packing on sphere 31
1.2.3 Alveolospheres system 32
1.3 Thesis objective and outline 33
2. Material and Method 35
2.1 PDMS wells fabrication and substrate preparation 35
2.2 MDCK cell culture 36
2.3 3D cell imaging 37
2.4 Cell tracking method 38
2.5 Z-stack refraction correction 39
2.6 Velocity and density 39
2.6.2 Spatial and temporal density correlation 40 2.6.3 Spatial velocity correlation and correlation length 40
2.7 MSD and persistence 40
2.7.1 Mean square displacement (MSD) 40
2.7.2 Persistence 41
2.8 Divergence, curl and shear 41
2.8.1 Divergence, curl and shear calculation 41
2.8.2 Spatial divergence, curl and shear correlation 43
3. Collective Cell Migration on Curved Surface 44
3.1 Spherical PDMS substrate and MDCK cell monolayer 44
3.2 Density increases on curved surface 45
3.3 Individual cell characteristics during migration 46
3.3.1 Migration trajectories 46
3.3.2 Velocity 47
3.3.3 Mean square displacement (MSD) 47
3.4 Collective analysis during migration 48
3.4.1 Density 48
3.4.2 Velocity spatial correlation function 49
3.4.3 Divergence, curl and shear 51
3.5 Conclusion 54
4. Cells Packing on Sphere 55
4.1 Alveolospheres with different sizes 55
4.2 Voronoi tessellation and defects fraction 57
5. Summary and Future Directions 60
5.1 Summary 60
5.1.1 Collective cell migration on curved surface 60
5.1.2 Cells packing on sphere 60
5.2 Future directions 61
List of Figures
Figure 1-1: Collective cell migration in biological system. (A) Cell layer mimicking wound healing process1. (B) Zebrafish embryonic morphogenesis2. (C) Human breast tumor metastasis3. Scale bar: 50 µm. 16 Figure 1-2: Dynamic properties during collective cell migration in a confluent cell layer4,5. (A-B) Cells migrate in a spatial heterogeneous manner. (C) The number of cells with a heterogeneous velocity increases as cell density increases. (D) Average cell velocity decreases as cell density increases. (E) Velocity fields of cell motion superimposed on top of divergence fields show coherent patterns of spreading (positive) and contracting (negative) regions spanning hundreds of microns. 18 Figure 1-3: Cell jamming transition occurs as a well-defined index of cell shape approaches a critical value6. (A) Cell perimeter approaches threshold value as cell layer jammed. (B) Simulated confluent cell layer at fluid state (top) and solid state (bottom). 19 Figure 1-4: Correlating cell shape and cellular stress in motile confluent tissues7. (A) In SPV model, cells are represented by polygons obtained via a Voronoi tessellation of initially random cell positions, with a self-propulsion force applied at each cell position. (B) Phase diagram in the cell shape number and velocity plane based on the value of the shape parameter. (C-D) Interaction normal stress calculated from the instantaneous cell shapes at solid state and liquid state, respectively. 20 Figure 1-5: Schematics of isotropic and anisotropic curvatures. (A-B) Concave and convex hemispheres8,9. (C) Concave PDMS microtubes10, diameter ranging from 25 to 250 µm. (D) Convex microtubes made by glass fiber and MDCK cells migration with time11, diameter ranging from less than 1 to 85 µm. 21 Figure 1-6: Collective cell migration speed on isotropic and anisotropic curvatures. (A) Study8,12 observed cells on concave hemisphere have a higher velocity than on flat surface, while on convex hemisphere have a similar velocity as that on flat surface. (B) On cylindrical surface, the average cell velocity increases as tube diameter increases, yet beyond 100 µm, velocity doesn’t increase continuously10. Cell velocity on cylindrical concave surface is slightly larger than cylindrical convex surface and flat surface13. 23 Figure 1-7: Cell monolayer height and cell-substrate attachment on concave, convex and flat surface. (A) Average cell monolayer height of cell sheets confined in concave cylindrical microtubes as a function of tube diameter10. Measured heights of SIMS cell monolayers on craters of various sizes, flat nanofibers, and Matrigel9. (B) Schematic representation of the cytoskeletal forces acting on the nucleus (F-actin in red, lamin-A in green)9. Cytoskeletal tension creates a push force on convex spherical surfaces leading to compression and deformation of the nucleus. A cytoskeletal pull force on concave surfaces leads to a relatively low exposure of the
nucleus to cytoskeletal forces resulting in a rounded nucleus shape and low lamin-A levels. (C) The way a cell reacts to a curved surface depends on two competing factors: contractility and
adhesion strength. 24
Figure 1-8: Cell monolayer morphology on convex, concave and flat substrate. (A) F-actin fiber orientation on cylindrical concave and convex substrate with different diameters13. (B) Representative immunohistochemical images of vinculin (green) identifying focal adhesions, F-actin (red) and nuclei (blue) for hMSCs on concave and convex spherical surfaces (κ = 1/175 μm−1), and a flat surface12. Scale bar 50 μm. (C) Cells morphology on varying curvatures. Green for F-actin, blue for nuclei, red for nanofibers. (D) Basal actin stress fiber organization and orientation in different concave tube dimensions10. (E) Orientation of the actin stress fibers for wires of various radii. On the 85-μm wire, the actin fibers are disordered. Below R = 40 μm, actin fibers take a circumferential orientation. Note the continuity of the actin fibers visible across a cell boundary (B, Inset), demonstrating the mechanical continuity in these pluricellular assemblies. C shows circumferential orientation even though the wire is wrapped up by only one cell.11
25 Figure 1-9: Statistical physics in collective cell migration. (A) Visualization of cells trajectories on concave and convex cylindrical surface, with varies cylinder diameters13. (B) Aspect ratio of cell trajectories, and persistence time for concave cylindrical surface, convex cylindrical surface and flat surface13. (C) Correlation length as a function of microtube diameter, in longitudinal direction and circumferential direction10. 26 Figure 1-10: Figure 1-10. Cell–cell bending regulated collective cell migration on a spherical
surface. Adopted from Lin et al31. 27
Figure 1-11: Colloidal structure and defects on curved surfaces. (A) Fluorescent PMMA particles bound, by image attraction, to oil-glycerol interfaces in the shape of spheres, domes, waists and barrels. Adopted from (B) Topological charge on domes and waists. Isolated seven-fold disclinations can be seen at the neck of the capillary bridge. While on the dome, sphere and barrel, the defects group into grain boundaries each having a single five-fold dislocations depends only on R/a. The defect configurations on both surfaces are similar to the arrangement of defects on the surface of a sphere with no boundary. The black dots represent particles stuck to the glass surface, defects with charge +p/3 are colored brick, defects with charge -p/3 are colored cream. Detached topological charge on domes and waists versus the integrated Gaussian curvature. Detached charge is the sum of the charge isolated disclinations of scars that are not connected to the boundary. On domes (blue symbols), we find the intuitive result that there is approximately one (p/3) topological charge per unit’s p/3 worth of integrated curvature. On negatively curved capillary bridges (red symbols), we find no net disclinations on the surface for an integrated curvature down to -10. For total curvature beyond the threshold of -10, disclinations rapidly fill the surface until 12 (-p/3) disclinations match the -12 curvature. (C) Defects and order in spherical assemblies. The more densely packed particles exhibit the hexagonal order and the lattice lines that are characteristic of flat crystals. More ordered sphere
has less defects and is covered mostly by 6-coordinated particles. Time averaged bond-orientation order parameter of particles on the disordered sphere is much more uniform than those on the ordered sphere. Measurements of defect fraction and bond-orientation order parameter for spheres decorated with N » 1,500 particles and for similar particles on flat surfaces. 29 Figure 1-12: Phase behavior of charged colloids at a fluid interface14. (A) Three samples of hydrophobic PMMA particles electrostatically bound to almost-flat droplets, at areal densities ρ of (a) 0.036 μm−2, (b) 0.043 μm−2, and (c) 0.049 μm−2. (B) Schematic of the experimental geometry. In the side view panel, the height h of the droplet is exaggerated compared to the base diameter
D. In experimental samples, h ≃ 5 μm. Particles sitting on the interface (shown in full color) are
mobile, while the remaining particles (shown as faded) bind randomly and irreversibly to the bare glass surface. The boundary of the droplet is delineated by a row of particles stuck to the glass. The inset shows the origin of the dipolar repulsion between interfacial particles. (C) Absolute value of the average bond-orientational order parameter, plotted as a function of the interaction parameter. The dashed lines indicate the values of at the fluid-hexatic and hexatic-solid transitions, as defined by the behavior of the correlation functions g6(r) and g6(τ). Fraction of particles that do not have six nearest neighbors. 30 Figure 1-13: The fraction and configuration of topological defects on the spherical substrate15. (A) the defect fraction Nd/N versus the packing fraction for various activities, where dashed vertical lines correspond to the packing fraction φ = 0.60, 0.74, and 0.80. (B) the global time-averaged bond-orientational order parameter value |ψ6| versus the packing fraction φ for various activities. (C) The phase diagram of freezing for self-propelled particles on the spherical substrate. (D) snapshots of typical distributions of disclinations for various activities and packing fractions, where packing fractions are φ = 0.60, 0.74, and 0.80, respectively, self-propelled velocities are v = 0, 1, 5, and 10, respectively, most topological defects are 5-coordinated particles (violet) and 7-coordinated particles (green), and there are also a few disclinations of the coordination number less than 5 (blue) and more than 7 (cyan). (E) snapshots of the local bond-orientational order parameter ψ6 on the spherical substrate, where the packing fraction is φ = 0.74, and the self-propelled velocities are v = 0, 2, 4, 6, 8, and 10, respectively. 32 Figure 1-14: Derivation of functional AT2-like cells (iAT2s) from human pluripotent stem cells, using the SFTPCtdTomato reporter system. (A) Directed differentiation timing. (B) Monolayered epithelial spheres (alveolospheres) in 3D Matrigel. (C) Sorting tdTomato (Tom+) cells provides indefinitely self-renewing iAT2s in spheres. (D) Alveolosphere ultrastructure by plastic section (note secreted lamellar bodies in lumen and TEM of 3 typical lamellar bodies. (E) RNA-Seq shows AT2 genes in top 10 in Tom+ cells compared to adult primary AT2s (HTII-280 sorted). (F) Validation of enrichment of SFTPC and ABCA3 in iAT2s (qPCR). See Jacob et al 2017 for details16. 33
Figure 2-1: Soft PDMS spherical surface fabrication and cells seeding. (A) Concave spherical surface fabrication using soft lithography. (B) Convex spherical surface fabricated by dropping glass bead with diameters range 200~300 µm, 420~500 µm and 600~700 µm onto PDMS layer.
36 Figure 2-2: Morphology (bright field) of MDCK cells grown on varies curvatures. Scale bar: 100 µm. Top: convex spherical surface, curvature k = -1/125 µm-1, -1/225 µm-1, -1/325 µm-1. Bottom: concave spherical surface, curvature k = +1/125 µm-1, +1/225 µm-1, +1/325 µm-1.
37 Figure 2-3: Representative collective cell migration images (fluorescent field) on flat and concave spherical surfaces. Well diameter: 100 µm, 250 µm, 450 µm, 650 µm. Z-stack projection was conducted. Scale bar: 100 µm. 38 Figure 2-4: Schematics of 3D imaging and z-stack refraction correction. Comparison of confocal images with refraction (bottom) and without refraction (top), using 25´ water objective. Scale bar: 100 µm. 39 Figure 2-5: Decompose collective motion into divergence, curl, shear and dilation. (A) Schematics of divergence, curl, shear and dilation. (B-C) Divergence theorem relates the total divergence of a velocity field v within area S to the line integral of the components of the velocity vectors normal to the area boundary l. The average divergence at a point (x, y) is approximated as the divergence divided by the area in S, adapted from Zehnder et al5. 42 Figure 3-1: Concave and convex spherical PDMS substrate and cell monolayer on curved surface. (A) Schematics of concave and convex spherical PDMS substrate. (B) Schematics of cell
monolayers cross section grown on concave and convex spherical PDMS substrate. (C) 3D construction confocal images of cell monolayers grown on concave and convex spherical surface, 20x water objective. Scale bar: 100 µm. (D) Bright field confocal images of cells on concave and convex surface, using 10x air objective. Scale bar: 100 µm. 44 Figure 3-2: Representative collective cell migration over time on curved surface as cell density increases. 𝜅 = +1/450 µm. Top line: bright field; bottom line: fluorescent field with local trajectories. The trajectories last for 10 frames (150 min). Each green dot is one GFP-labeled nucleus. Scale bar: 100 µm. As density increases, the velocity slows down and cell shape also changes. 45 Figure 3-3: Representative cells growing on different curvatures and corresponding cell trajectories. (A) MDCK cells on different curvatures, k = 0, +1/325 µm-1, +1/225 µm-1, +1/125 µm -1. (B) Corresponding cell trajectories in a duration of 300 min. (C) Representative instant cell trajectories variation with time taking k = +1/225 µm-1 as an example. 46
Figure 3-4: Collective cell velocity for flat and curved surface (spherical concave and convex surface with diameters 250 µm, 450 µm, 650 µm). (A) Mean velocity decreases as cell density increases, while no clear trend was found between curvature and velocity magnitude. (B) Velocity box plot for concave and convex spherical surface, using the data that has a density range 2000~4000 mm-2. 47 Figure 3-5: Mean square displacement (MSD) for cells on various curvatures. Error bar plot of average MSD of 5 data sets for each curve at same density 𝜌 = 2300 mm-2. k = -1/125 µm-1, -1/225 µm-1, -1/325 µm-1, 0, +1/325 µm-1, +1/225 µm-1, +1/125 µm-1. 48 Figure 3-6: The relationship between velocity divergence and density for flat surface. (A) Divergence pattern and corresponding velocity field. The velocity pattern coincides with the divergence pattern. The unit of x and y axes: µm. Source is noted as yellow and sink is noted as blue. (B) The corresponding fluorescent field of MDCK cells. (C) The relationship of velocity divergence and density fluctuation. Divergence calculated along the red line in (A). Density calculated within the red boxes in (B). (D) Velocity divergence contour and source area (in number of cells) count for divergence larger than 0.004. The cell clusters can range from ~5 cells to ~50 cells. 49 Figure 3-7: Collective cell migration and spatial velocity correlation. (A) Collective cell migration trajectories of representative cell groups on different curvatures. The selected cell group trajectories show that cells group are larger on flat surface and become smaller as curvature increases. (B) Spatial velocity correlation function Cvv at density 2300 mm-2. At small
distance lag, the correlation function decreases and at large distance lag, it oscillates around zero. (C) Spatial velocity correlation length calculated as where ∆𝑟 corresponds to the first minimum, as a function of curvature 𝜅 at density 2300 mm-2. k = -1/125 µm-1, -1/225 µm-1, -1/325 µm-1, 0, +1/325 µm-1, +1/225 µm-1, +1/125 µm-1. 50 Figure 3-8: Velocity divergence for collective cells migration. (A) Velocity divergence pattern, for k = +1/325 µm-1, +1/225 µm-1, +1/125 µm-1. The yellow pattern denotes source and dark blue represents sink. Divergence magnitude increases as curvature increases. (B) Corresponding local divergence fluctuation along the longitudinal lines j = 0°, 2°, 4°, …, 360°. 180 curves in total for each figure. The divergence fluctuation increases as curvature increases. (C) Probability density function (PDF) of divergence. k = -1/125 µm-1, -1/225 µm-1, -1/325 µm-1,0, +1/325 µm-1, +1/225 µm-1, +1/125 µm-1. Divergence PDF spreads widest on largest curvatures. (D) Single-sided magnitude spectrum for k = +1/325 µm-1, +1/225 µm-1, +1/125 µm-1. The peak value increases and the corresponding frequency decreases as curvature increases. 52 Figure 3-9: Flow geometry and corresponding velocity field for cells grow on curved surface. (A) Schematics of one alveolosphere surrounded by ECM. (B) Confocal fluorescent image for representative alveolospheres. Each white dot is a cell nucleus. Scale bar: 50 µm. (C) Divergence probability density function (PDF) of alveolospheres showed in (B). From top to bottom,
curvature decreases. (D) Divergence, curl and shear map for alveolospheres in (B). Divergence scale:-0.07 (blue)~0.07 (yellow). Vorticity scale: -0.07 (red) ~ 0.07 (yellow). Shear map which only takes magnitude of shear into consideration. Shear scale: 0 (dark blue) ~ 0.05 (yellow). Divergence, curl and shear value decreases as alveolosphere grow bigger. (E) Divergence area calculated using 50% of the peak value and corresponding divergence peak value on alveolospheres. As alveolospheres grow bigger, the divergence value becomes smaller while the
characteristic divergence size becomes bigger. 53
Figure 4-1. Alveolospheres with different cluster size. The type II alveolar cells nuclei are marker by GFP and denote as white dots. The images of smallest alveolospheres are taken on the 1st day and the largest ones are taken on 11th day. Scale bar: 50 µm. 56 Figure 4-2. Trajectories of alveolospheres showing continuous 10 frames (150 min).
Different colors represent different cells. 56
Figure 4-3. Density, radius and velocity of cells in alveolospheres. (A) Cell density as a function of alveolosphere radius. (B) Average cell velocity as a function of alveolosphere radius. (C) Average velocity as a function of average density. (D) Mean square displacement as a function
of time lag for small alveolospheres. 57
Figure 4-4. Voronoi tessellation and major polygons (pentagon, hexagon, heptagon) fraction as a function of cells number. (A) Voronoi tessellation of selected alveolospheres, for spots number N = 20, 100, 300, 600, respectively. Red color denotes polygons that have less than 5 vertices. Blue color represents polygons that have more than 7 vertices. White color represents hexagon. (C) Polygon fraction for major polygons (pentagon, hexagon, heptagon) and the ratio of 𝑍 = 5, 6, 7/(1 − 𝑍 = 5, 6, 7). Defects fraction, defined as the number of n-fold polygons over the total number of polygons. For both cells on fabricated wells and alveolospheres, the ratio is higher compared to simulation (randomly generated spots on a sphere). Which indicates that the cells in cellular system interact and coordinate with each other to lower the total energy of the
Chapter 1
1
Introduction
1.1 Collective cell migration on curved surface
1.1.1 Collective cell migration in biological systems
Every organ surface is tiled by a confluent monolayer of epithelial or endothelial cells, thus providing a physical barrier of the organ. Cells on these confluent layers often remain static and non-migratory in mature organs. However, they can also undergo active structural rearrangements during basic physiological processes such as embryonic development1, airway morphogenesis17, tissue repair2 as wells as tumor metastasis3 (Fig. 1). The ability of cells to migrate collectively brings to fore many important issues in biological physics of active systems, moreover, helps realize certain biological functionality. First, cells must organize their structure during collective migration. Cells packing behavior actively changes as cells rearrange their positions. Next, collective cell migration mode is directly affected by local cell-cell interaction and cell-substrate interaction. Cells must withstand certain amount of mechanical stress as cells swell and shrink alternatively. Moreover, the local material properties of cells, in the form of volume, stiffness etc., varies a lot during collective cell migration. In a large scale, cells present fluid-like/solid-like behavior based on their unjamming/jamming status during collective cell migration.
Figure 1-1. Collective cell migration in biological system. (A) Cell layer mimicking wound healing process2. (B) Zebrafish embryonic morphogenesis1. (C) Human breast tumor metastasis3. Scale bar: 50 μm.
1.1.2 Collective cell migration on flat surface
To unravel the fundamentals of collective cell migration, cell monolayers grown on flat surface are often used as model multicellular systems. Different from single cell migration, cells in a confluent layer migrate in a cooperative manner. The motion of one cell can be largely coupled by neighbors through cyclic extension, adhesion, retraction and accompanied by erratic changes4. Two most direct quantitative parameters in collective cell migration are cell density and velocity, both long-range and local ones. First, cell number density, which is roughly as the inverse of a single cell area, often accompanies multicellular motion. As healthy cells divide, they tend to move towards empty space until forming a confluent layer. Then the cell layer becomes denser but within some limit due to the lack of empty space. Although in general average cell density increases during this process, local cell density can fluctuate a lot5, which directly corresponds to expansion and shrink of cell groups5. It is reported that fluid flow exchanging between cell groups is the causation of expansion and shrink and thus facilitates oscillation in cell density5. Second, cell velocity reflects the mobility of cells4. As density increases in the above process, cells don’t have much space to move, thus the average velocity decreases gradually4. There exists a threshold range of cell density value during which a glass transition or jamming transition occurs. Cells are fluid-like below this density range whereas beyond this density range, cells behave fluid-like atoms oscillating on local crystal lattice. On the other hand, although as cell density increases velocity decreases in general, local cell velocity can vary significantly. Within a certain region, cells can have higher velocity than the average velocity. It is reported that cells areas with heterogeneous higher velocities increases as cell density increases and cell pack lifetime become progressively longer4, which indicates a coupling between individual cell migration and collective migration. Except for the dynamic heterogeneity in cell migration, other phenomenon like a non-Arrhenius dependence of relaxation time on cell density, and peaks in the vibrational density of state (DOS)4 which shows an intriguing analogy to supercooled fluid also occur during this process.
Figure 1-2. Dynamic properties during collective cell migration in a confluent cell layer4,5. (A-B) Cells migrate in a spatial heterogeneous manner. (C) The number of cells with a heterogeneous velocity increases as cell density increases. (D) Average cell velocity decreases as cell density increases. (E) Velocity fields of cell motion superimposed on top of divergence fields show coherent patterns of spreading (positive) and contracting (negative) regions spanning hundreds of microns.
Epithelial cells systematically change their shape during various biological processes. The analysis of cell shape during collective cell migration can provide fundamental insights into the mechanical state of tissues in developmental processes. Cell shape and shape variability are mutually constrained through a relationship that is purely geometrical. Vertex model18-20 shows that cell shape provides a rigorous structural signature for jamming transition. Cell shape becomes progressively less elongated and less variable as the layer becomes progressively more jammed21. In unjammed cell layers, cells organize their structure and shape as cells actively change their relative positions with immediate neighbors during collective migration, as a result exhibiting
cooperative packs and swirls. While in jammed ones, each cell becomes frozen in place relative to immediate neighbors, as if caged. Furthermore, cell jamming transition occurs as a well-defined index of cell shape approaches a critical value6 (Fig. 1-3).
Figure 1-3. Cell jamming transition occurs as a well-defined index of cell shape approaches a critical value6. (A) Cell perimeter approaches threshold value as cell layer jammed. (B) Simulated confluent cell layer at fluid state (top) and solid state (bottom).
The material and dynamic properties above are regulated by local mechanical force. Mechanical force includes cell-cell interaction (adhesion force etc.) and cell-substrate interaction (traction force, shear stress etc.), which provides important regulatory mechanism to collective motion. First, mechanical force can strongly affect cell shape, density, mobility, and further comprehensively affect liquid-solid transition. Simulation shows traction-based stress matches instantaneous cell shapes and cell layer state. Solid state has a higher traction-based stress and a lower shape index, while liquid state has a lower traction-based stress and a higher shape index. The liquid-solid transition is tuned by the interplay of cell-cell adhesion and cortex contractility (cell-substrate adhesion), manifested in cellular shape and by cell mobility. Second, mechanical force can even provide information on tissue rheology. By integrating temporal correlation of interaction shear stress over time, an effective viscosity can be extracted. The viscosity diverges at the liquid-solid transition7. Third, mechanical heterogeneity within cell layers tunes stiffness at a single-cell level. The addition of heterogeneity can always enhance the mechanical rigidity of the epithelial layer by increasing its shear modulus, hence making it more rigid.
Figure 1-4. Correlating cell shape and cellular stress in motile confluent tissues7. (A) In SPV model, cells are represented by polygons obtained via a Voronoi tessellation of initially random cell positions, with a self-propulsion force applied at each cell position. (B) Phase diagram in the cell shape number and velocity plane based on the value of the shape parameter. (C-D) Interaction normal stress calculated from the instantaneous cell shapes at solid state and liquid state, respectively.
Detailed analysis of mechanical wave inside the cell layer predicts why mechanical force plays such an important role in material and dynamic properties of cell layer. As to cell-substrate interaction, each cell in the sheet can deform local substrate in a cooperative manner, generate forces on its underlying substrate subsequently, and migrate preferentially along the direction of maximum principal stress. This cell-substrate interaction wave propagates slowly to span the monolayer and builds up differentials of mechanical stress. On the other hand, cell-cell interaction transfer through the cell layers. Cells change volume locally by exchanging fluid with immediate neighbors through gap junctions, expand or shrink as cell groups to transmit extensive or contractile forces through intercellular junctions so as to create long-ranged gradient of tension. Cell-substrate interaction coupled with cell-cell interaction regulates collective cell migration.
1.1.3 Collective cell migration on curved surface
Previous study enables a deep understanding of collective cell migration on flat surface from a wide spectrum. Yet for biological processes in tissue, for example tubular airways, spherical alveoli and ellipsoidal embryo, curvature effect cannot be neglected. There are fundamental reasons to suspect that such curved geometries will alter collective cellular dynamics in a non-trivial manner. In particular, as the radius of curvature decreases, it inevitably affects packing of objects on the surface. Furthermore, cells on curved surfaces can generate significant out-of-plane force while developing anisotropic cytoskeletal organization11. On this topic of curvature on the scale of the cell and the cellular collective there exists only a small literature8,11,12,22,23, which is not to be confused with the well-studied topic of curvature sensing mechanisms that are operative only at length scales that are orders of magnitude smaller, such as occur in microvesicles, cellular membranes, or protein molecules24.
1.1.3.1 Fabrication of curved substrates
Figure 1-5. Schematics of isotropic and anisotropic curvatures. (A-B) Concave and convex hemispheres8,9. (C) Concave PDMS microtubes10, diameter ranging from 25 to 250 µm. (D) Convex microtubes made by glass fiber and MDCK cells migration with time11, diameter ranging from less than 1 to 85 µm.
The importance of substrate effect to morphogenesis has only started to be appreciated in recent years. In addition to largely overlooking or underestimating the curvature effect on cell behavior for a long time, the lack of available methods to engineer the required complex substrate geometries in a controlled way might have contributed to the further delay of corresponding studies. Thanks to the development of micro- and nano-fabrication technology, cell migration on substrate with varies curvatures has gained more and more attention in recent years. Physiologically relevant structures typically contain anisotropic (i.e., direction-dependent) surface curvatures, both convex (e.g., matrix and scaffold fibers/studs) and concave (e.g., channel-like pores), and isotropic surface (e.g., alveoli). Some sample curvatures are shown in Fig. 1-5.
1.1.3.2 Cell velocity on curved substrates
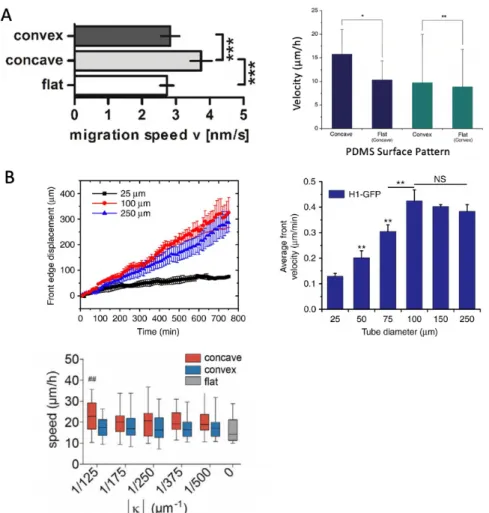
Cell velocity analysis showed very different cells speed on concave, convex and flat surface (Fig. 1-6). The initial study by Park et al.8 and Werner et al.12 reported that cell migration speed on concave spherical surfaces was significantly higher than on convex structures and flat surfaces, while no significant difference was found between different curvature magnitudes. Park et al. also claimed that cells actively migrate out of concave pits but attach and proliferate on concave structures8, implying that the cells avoid the concave shape. On cylindrical microtubes, velocity was also consistently higher on concave cylindrical surfaces than on convex surfaces. In addition, velocity was constant regardless of curvature magnitude on convex surface. Cell sheets confined in smaller concave microtubes demonstrate slower motion than large concave microtubes10. The results above suggest that curved substrates provoke the cells to adopt fundamentally different migration modes.
Figure 1-6. Collective cell migration speed on isotropic and anisotropic curvatures. (A) Study8,12 observed cells on concave hemisphere have a higher velocity than on flat surface, while on convex hemisphere have a similar velocity as that on flat surface. (B) On cylindrical surface, the average cell velocity increases as tube diameter increases, yet beyond 100 µm, velocity doesn’t increase continuously10. Cell velocity on cylindrical concave surface is slightly larger than cylindrical convex surface and flat surface13.
1.1.3.3 Cell height and attachment on curved substrates
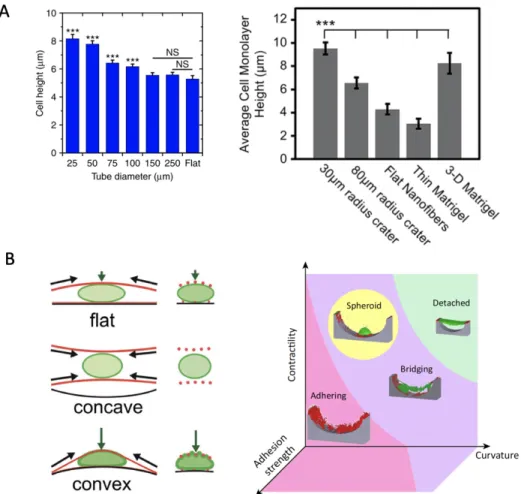
Cell monolayer height and cells attachment were reported to vary a lot as curvature changes. Cell sheets confined in concave diameter 25 µm tube is ~45% taller than that in 250 µm tube (Fig. 1-7 (A))10, which suggests that cells are not willing to spread on more curved surface. Another study by Soscia et al.9 also found that cell sheets have a higher height on concave spherical surface. One possibility is a significant radial force exists pointing towards the center axis of the concave surface that can stretch cell toward the center. Cells also exist different attachment morphology on concave and convex curvatures. Convex spherical substrates force the cells to adopt a bent shape, inducing a compressive pressure by the actin cytoskeleton on the nucleus. On the other hand, cells on concave spherical surfaces lift their bodies upward, minimizing the contact area with the substrate
and nucleus compression. Cytoskeletal tension creates a push force on convex spherical surfaces leading to compression and deformation of the nucleus. A cytoskeletal pull force on concave surfaces leads to a relatively low exposure of the nucleus to cytoskeletal forces resulting in a rounded nucleus shape and low lamin-A levels. Study demonstrated that the way a cell reacts to a curved surface depends on two competing factors: contractility and adhesion strength. Higher contractility and curvature induce cell detachment. An increase in adhesion strength between cell and substrate suppresses detachment. When cellular contractility is high but detaching stress induced by curvature is still low, cells spontaneously form spheroids.
Figure 1-7. Cell monolayer height and cell-substrate attachment on concave, convex and flat surface. (A) Average cell monolayer height of cell sheets confined in concave cylindrical microtubes as a function of tube diameter10. Measured heights of SIMS cell monolayers on craters of various sizes, flat nanofibers, and Matrigel9. (B) Schematic representation of the cytoskeletal forces acting on the nucleus (F-actin in red, lamin-A in green)9. Cytoskeletal tension creates a push force on convex spherical surfaces leading to compression and deformation of the nucleus. A cytoskeletal pull force on concave surfaces leads to a relatively low exposure of the nucleus to cytoskeletal forces resulting in a rounded nucleus shape and low lamin-A levels. (C) The way a cell reacts to a curved surface depends on two competing factors: contractility and adhesion strength.
1.1.3.4 Cell organization and orientation on curved substrates
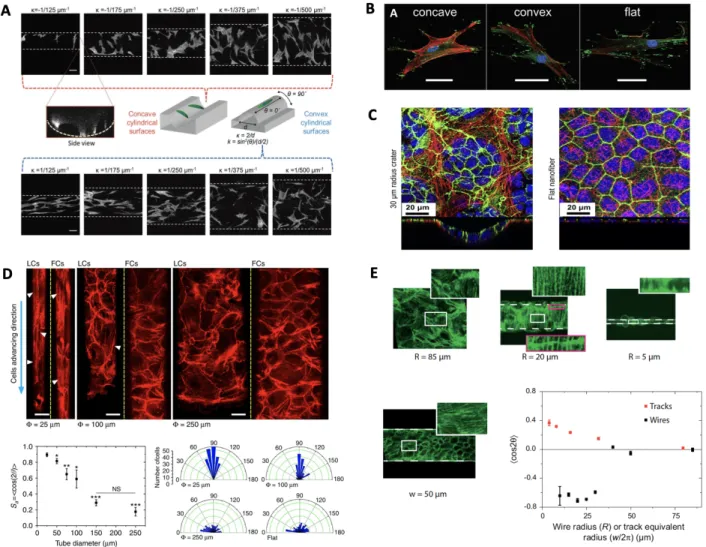
Epithelia probe external physical signals particularly through cell-substrate adhesions and the associated actin cytoskeleton, and thus adjust their organization and distribution according to the geometrical constraint11,25-27. Actin stress fiber organization and cellular diameter can be affected by tubular confinement. In tubular cell sheets (TCSs) smaller than 75 µm, actin stress fibers were aligned longitudinally throughout the entire lumen, while such alignment disappears for TCSs in larger diameters. Moreover, the cell orientation also varies with tube diameter. More cells aligned closer to the tube long axis for diameter smaller than 100 µm, while a global isotropic cell orientation was observed in larger microtubes similar to that seen on flat surface (Fig. 1-7 (D)). Furthermore, in the study that grow MDCK cells on convex glass fiber, they found that F-actins line in the circumferential direction at small tubes11. However, a recent study by Werner et al.13 showed totally different alignment of F-actin fibers in concave and convex cylindrical surface. For concave cylindrical surface at a small tube diameter, F-actin aligns along the circumferential direction while for convex cylindrical surface at a small tube diameter, F-actin aligns along the longitudinal direction. Another evidence showed that F-actin organizes into a round shape at the boundary of crater9, while on flat surface it distributes homogeneously, which suggests the curvature plays an important role in regulating cells organization.
Figure 1-8. Cell monolayer morphology on convex, concave and flat substrate. (A) F-actin fiber orientation on cylindrical concave and convex substrate with different diameters13. (B) Representative immunohistochemical images of vinculin (green) identifying focal adhesions, F-actin (red) and nuclei (blue) for hMSCs on concave and convex spherical surfaces (κ = 1/175 μm−1), and a flat surface12. Scale bar 50 μm. (C) Cells morphology on varying curvatures. Green for F-actin, blue for nuclei, red for nanofibers. (D) Basal actin stress fiber organization and orientation in different concave tube dimensions10. (E) Orientation of the actin stress fibers for wires of various radii. On the 85 μm wire, the actin fibers are disordered. Below R = 40 μm, actin fibers take a circumferential orientation. Note the continuity of the actin fibers visible across a cell boundary (B, Inset), demonstrating the mechanical continuity in these pluricellular assemblies. C shows circumferential orientation even though the wire is wrapped up by only one cell.11
Figure 1-9. Statistical physics in collective cell migration. (A) Visualization of cells trajectories on concave and convex cylindrical surface, with varies cylinder diameters13. (B) Aspect ratio of cell trajectories, and persistence time for concave cylindrical surface, convex cylindrical surface and flat surface13. (C) Correlation length as a function of microtube diameter, in longitudinal direction and circumferential direction10.
Werner et al. observed that cells tend to migrate along the axial direction on convex cylindrical surface while they tend to migrate more along the circumferential direction on concave cylindrical surface13. They further calculated the aspect ratio (dx/dy) of cell trajectories and demonstrated that
dx/dy is higher on convex surface than concave and flat surface. Besides, cells on convex
cylindrical surface are more persistent than on concave cylindrical surface. This mobility variation is directly related to F-actin orientation. F-actin tends to line along the axial direction on convex cylindrical substrate while along the circumferential direction in concave cylindrical substrate. Only a few studies demonstrated correlation length analysis. Both the longitudinal and circumferential correlation length increases as concave tubes diameter increases. The correlation length plateaued in circumferential direction appears at ~120–140 μm (Fig. 1-8 (C)), which agrees with the values of 120–200 μm for planar unconfined substrates25. As expected, reducing confinement and curvature leads to the epithelial dynamics resembling the one observed on 2D unconfined surfaces. Moreover, the change of correlation lengths in both directions reminisces the velocity vs. diameter pattern, a phenomenon not seen in the 2D equivalents25.
1.1.4 Cellular behavior on curved structure
Experimentally the curvature effect has only recently received more and more attention. It’s showed that geometrical features in cellular system plays an important role in regulating the morphology, polarization and movement of cells28-30. The supracellular bending due to curvature will emerge as a significant regulator in cell dynamics at the tissue scale, especially at high curvatures that are approaches to cellular level28-30. Besides, some modelling has been done to make predictions. Typically, bending energy, surface tension energy and cell-cell adhesions energy, cell elastic energy etc. are considered to construct the potential energy for cell monolayer. It’s worth to note that in all current model, the self-proposed velocity is only involved as an additional term in the time derivative position function7,31,32. A recent study finds that increasing curvature can suppress local swirling and enhance density fluctuations, due to a higher cell-cell bending energy31. Higher bending energy also suppresses the neighbor cell exchange frequency.
Figure 1-10. Cell-cell bending regulated collective cell migration on a spherical surface. Adopted from Lin et al31.
1.2 Cells packing on sphere
1.2.1 Colloidal particles packing on a sphere
Imagine spherical particles are randomly packed on flat surface and at lowest-energy-state particles form six-fold coordinated triangular lattice. However, crystals that assemble on closed surfaces are required by topological constraints. A minimum number of lattice defects must exist as conserved topological charges33-35. For example, soccer balls and C60 fullerenes both have 12 pentagons and 20 hexagons. The topological charge is defined as 6-Z, where Z is the vertices of polygons. Therefore, for a closed surface, the total topological charge is always 12, which determined the minimum energy configuration of repulsive particles, essential for crystallography on a sphere. Colloidal that packing on spheres generated by two immiscible liquids interact through Coulomb force. As the number of particles on the sphere grows, isolated charge 1 defects are
predicted to induce too much strain. This extra stain can be released by introducing additional dislocations, which are point-like topological defects in two dimensions. Moreover, crystal assembled on curved surfaces can spontaneously develop additional lattice defects to alleviate the stress imposed by the curvature36-38. The colloidal growth dynamics and defect formation are very different on flat and curved surface. Voronoi tessellation is commonly used here to study the defect evolution. As particles become denser, 5 and 7-fold defect fraction decreases on both flat and curved surface shown in Fig. 1-11 (C). However, the decrease on flat surface is almost 90 degree while on curved surface it takes some distance. As stated previously, at extremely high density, defect fraction on flat surface reaches to zero while on curved surface a non-zero constant (~3%) due to topological constraint39. On the other hand, bond-orientation order, which means the existing possibility of hexagon, shows the defect fraction from another aspect. The more densely packed spheres have a nearly all unit bond-orientation order, expect certain dislocations.
Both positive and negative curvatures are investigated38. The fine control of crystal order with curvature will enable explorations of general theories of defects in curved spaces40-42. A sequence of transition occurs when altering the curvature, which is consistent with the lowest energy state. On the other hand, efforts are made to understand how the elastic stress induced by Gaussian curvature affects the growth pathway. It is reported that crystals growing on spherical droplets formed branched ribbon-like domains with large voids and no topological defects. This morphology minimized the curvature-induced elastic energy.
Figure 1-11. Colloidal structure and defects on curved surfaces. (A) Fluorescent PMMA particles bound, by image attraction, to oil-glycerol interfaces in the shape of spheres, domes, waists and barrels. Adopted from Irvine et al38. (B) Topological charge on domes and waists. Isolated seven-fold disclinations can be seen at the neck of the capillary bridge. While on the dome, sphere and barrel, the defects group into grain boundaries each having a single five-fold dislocations depends only on R/a. The defect configurations on both surfaces are similar to the arrangement of defects on the surface of a sphere with no boundary. The black dots represent particles stuck to the glass surface, defects with charge +p/3 are colored brick, defects with charge -p/3 are colored cream. Detached topological charge on domes and waists versus the integrated Gaussian curvature. Detached charge is the sum of the charge isolated disclinations of scars that are not connected to the boundary. On domes (blue symbols), we find the intuitive result that there is approximately one (p/3) topological charge per unit’s p/3 worth of integrated curvature. On negatively curved capillary bridges (red symbols), we find no net disclinations on the surface for an integrated curvature down to -10. For total curvature beyond the threshold of -10, disclinations rapidly fill the surface until 12 (-p/3) disclinations match the -12 curvature. (C) Defects and order in spherical assemblies. The more densely packed particles exhibit the hexagonal order and the lattice lines that are characteristic of flat crystals. More ordered sphere has less defects and is covered mostly by 6-coordinated particles. Time averaged bond-orientation order parameter of particles on the disordered sphere is much more uniform than those on the ordered sphere. Measurements of defect fraction and bond-orientation order parameter for spheres decorated with N » 1,500 particles and for similar particles on flat surfaces.
Figure 1-12. Phase behavior of charged colloids at a fluid interface14. (A) Three samples of hydrophobic PMMA particles electrostatically bound to almost-flat droplets, at areal densities ρ of (a) 0.036 μm−2, (b) 0.043 μm−2, and (c) 0.049 μm−2. (B) Schematic of the experimental geometry. In the side view panel, the height h of the droplet is exaggerated compared to the base diameter D.
In experimental samples, h ≃ 5 μm. Particles sitting on the interface (shown in full color) are mobile, while the remaining particles (shown as faded) bind randomly and irreversibly to the bare glass surface. The boundary of the droplet is delineated by a row of particles stuck to the glass. The inset shows the origin of the dipolar repulsion between interfacial particles. (C) Absolute value of the average bond-orientational order parameter, plotted as a function of the interaction parameter. The dashed lines indicate the values of at the fluid-hexatic and hexatic-solid transitions, as defined by the behavior of the correlation functions g6(r) and g6(τ). Fraction of particles that do not have six nearest neighbors.
The remarkable predictions of Kosterlitz-Thouless-Halperin-Nelson-Young (KTHNY) theory of melting a plane is particularly well characterized in monolayers of paramagnetic colloidal particles interacting through induced magnetic dipoles. A single dimensionless interaction parameter, 𝛤, is used to quantify the entire phase behavior and defined as39:
𝛤 =("#)% !/#
$& 𝐴 (1.1) where 𝜌 is the number density of cells, 𝑇 is the temperature where the experiment takes place. This dimensionless parameter means the effective temperature of the system. A can be obtained from the potential function between the model of crystal particles interact via a repulsive screened Coulomb interaction38 when the interparticle distance is large compared to the diameter of particles14:
𝑈(𝑟) ≃('! (1.2) where 𝐴 = 𝑝!⁄8𝜋𝜖, with 𝑝 = 𝑞𝑑 the magnitude of the electric dipole moment of particles43.
1.2.2 Active matter packing on sphere
Cells are totally different from colloidal. They are soft, compressible and self-propelled. Cell-cell interaction only appears when cells start to be in contact. Once they start to interact, the shapes of cells actively change compressing or be compressed by their nearest neighbors. Cells can generate random velocities and the collective migration also cause the packing pattern change. The different material and dynamic properties of cells from rigid particles must cause very different behavior. How cells packing on sphere is an intriguing problem, yet currently this field of experimental side is totally blank. Here, it is necessary to review current understanding using simulation in the topic of crystallization of self-propelled particles on a spherical substrate.
Active matter, such as cells, have different behavior when packing on curved surface compared to colloids. The main reason is the active system has sustained energy input. Studies on flat surface demonstrated that the self-propelled particles froze at the sufficiently high packing fraction and low activity44-46. Although curved surface is gaining more and more attention, the focus is most of these studies focused on the polar or nematic films on spherical substrates. One recently study systematically investigates how activity influences global structure and dynamic motion of self-propelled particles on spherical substrates, which has significant meaning to cell packing on sphere
in experimental side. The model uses Lennard-Jones potential to mimic the interaction between particles. The packing fraction of N particles on sphere is defined as:
𝜙 =)"(* +-".⁄ )# # (1.3) where d is the radius of particles and R is radius of spheres. It is found that the packing fraction and self-propelled velocity are two core parameters that determine the packing behavior on sphere as shown in Fig. 1-13. Defect fraction generally decreases as packing fraction increases, yet a higher self-proposed velocity can cause a higher defect fraction at any packing fraction. Similarly, bond-orientation order generally increases as packing fraction increases, meaning the possibility of finding a hexagon locally increases, yet increasing the velocity will slow the increase. Fig. 1-13 shows the configuration of disclinations at various fraction and velocity. At low packing fraction, disclination is homogenous no matter whether velocity is introduced into the system. However, at very high packing fraction, large velocity will generate chaos into the system thus induce more defects. The twelve ‘scars’ are break apart at high velocity. From a bond-orientation parameter map at medium packing fraction, high velocity will potentially cause more defects. This analysis can provide important reference for collective cells packing in tissue surface.
Figure 1-13. The fraction and configuration of topological defects on the spherical substrate15. (A) the defect fraction Nd/N versus the packing fraction for various activities, where dashed vertical
lines correspond to the packing fraction φ = 0.60, 0.74, and 0.80. (B) the global time-averaged bond-orientational order parameter value |ψ6| versus the packing fraction φ for various activities. (C) The phase diagram of freezing for self-propelled particles on the spherical substrate. (D) snapshots of typical distributions of disclinations for various activities and packing fractions, where packing fractions are φ = 0.60, 0.74, and 0.80, respectively, self-propelled velocities are v = 0, 1, 5, and 10, respectively, most topological defects are 5-coordinated particles (violet) and 7-coordinated particles (green), and there are also a few disclinations of the coordination number less than 5 (blue) and more than 7 (cyan). (E) snapshots of the local bond-orientational order parameter ψ6 on the spherical substrate, where the packing fraction is φ = 0.74, and the self-propelled velocities are v = 0, 2, 4, 6, 8, and 10, respectively.
1.2.3 Alveolospheres system
Alveolus is natural system contains cell monolayer on a 2D sphere. Over the past 15 years the Lab led by Darrell Kotton at Boston University has developed methods for the directed differentiation of normal mouse or human pluripotent stem cells into primordial lung progenitors and their more mature proximal airway and distal alveolar epithelia47-50. Most relevant to this work, they recently found culture conditions that could mature these cells into functional AT2s-like cells able to indefinitely self-renew and secrete surfactant16. Fig. 1-14 shows the details of the derivation of alveolospheres. The human AT2s-like cells derived in vitro from pluripotent stem cells express a global transcriptome and ultrastructure that resembles primary adult AT2s, suggesting they may serve as useful in vitro models of AT2s-related human lung diseases. As a first proof-of-principle demonstration of this capacity, they found that AT2s generated from iPSCs of a pediatric patient carrying homozygous “loss-of-function” SFTPB mutations successfully modeled key aspects of the patient’s lung disease16. Importantly all aspects of the in vitro disease model were reversed after CRISPR-based, foot print-free gene editing to correct the mutation16. Here, we focus on applying our iPSCs-based model system for study of cellular packing behavior in a human 3D culture system where monolayered epithelial spheres, consisting of self-renewing human AT2 cells, are continually formed in culture. We use this alveolosphere system, a more natural system, to further test the curvature effect that we have observed from our fabricated well system.
Figure 1-14. Derivation of functional AT2-like cells (iAT2s) from human pluripotent stem cells, using the SFTPCtdTomato reporter system. (A) Directed differentiation timing. (B) Monolayered epithelial spheres (alveolospheres) in 3D Matrigel. (C) Sorting tdTomato (Tom+) cells provides indefinitely self-renewing iAT2s in spheres. (D) Alveolosphere ultrastructure by plastic section (note secreted lamellar bodies in lumen and TEM of 3 typical lamellar bodies. (E) RNA-Seq shows AT2 genes in top 10 in Tom+ cells compared to adult primary AT2s (HTII-280 sorted). (F) Validation of enrichment of SFTPC and ABCA3 in iAT2s (qPCR). See Jacob et al 2017 for details16.
1.3 Thesis objectives and outline
Given more and more evidence suggesting that cells migration is strongly affected by substrate Gaussian curvature, we tried to answer these questions: in what way cells feel the substrate curvature, how cell jamming and unjamming promote the generation and stabilization of curved structures, and the mechanism of cells packing on the sphere as soft active matter. Different from previous studies, we tried to interpret the phenomenon from statistical physics perspective. First, we analysis the individual cell migration properties. Density, velocity, persistence and mean square displacement (MSD) are discussed. Next, we are interested in how cells group themselves as they collectively migrate and whether these collective behaviors react to the variation of curvature. Briefly, velocity unit vector correlation and correlation length are calculated. Then the collective migration is decomposed into divergence, curl and shear. The correlation and correlation length of divergence, curl and shear are derived. To know how density is locally correlated and spatially correlated, spatial and temporal density correlation were calculated. Furthermore, we studied the cell packing behavior on sphere in the human iPS cells induced alveolospheres and
Self-renewing Alveolospheres SFTPCtdTomato 30-35 days Sort tdTomato+ (Tom+) and serial passage Characterize: 94-97% maintenance of SFTPCtdTomato SFTPCtdTomato Passage 8 RNA-Seq Top 1 0 up re gu late d tr an sc rip ts in SF TP Ctd To m ato + ce lls by F C. F D R<. 05 iPSC/ ESC NKX2.1+ lung Progenitors (Sort CD47hi/CD26neg) SFTPC+ alveolar cells Anterior foregut endoderm Day 0 D6 D15 D30 D0 D15 Sort D35 1°AEC2 SP212 SP212Corr A B C D Lamellar Bodies E F: RT-qPCR
compared with random generated system. By depleting ATP to decrease the system activity, we claimed that the cell systems are more stable than the random ones.
We anticipate that these novel findings will offer fundamental insights into the physical basis of airway and acinar development, as well as providing insight into how cell packing and jamming underlie the genesis of tissue shapes.
Chapter 2
2
Material and method
2.1 PDMS wells fabrication and substrate preparation
Glass beads (Polysciences, Cat# 18906) with four diameter ranges, 100 µm, 200~300 µm, 420~500 µm and 600~700 µm, are placed on clean silicon wafers respectively, subsequently applying a layer of SU-8 2000 using soft lithography. Briefly, SU-8 2000 photoresist is commonly exposed with conventional UV (350-400 nm) radiation. Upon exposure, cross-linking proceeds in two steps (1) formation of a strong acid during the exposure step, followed by (2) acid-catalyzed, thermally driven epoxy cross-linking during the post exposure bake (PEB) step. Then poly(dimethylsiloxane) (PDMS, SYLGARD 184 silicon elastomer base) and cross-linker (SYLGARD 184 silicon elastomer curing agent) (volume 10:1) were mixed together following a well-established method and placed in vacuum chamber to get rid of the bubbles at room temperature. A thin PDMS layer (~3 mm) was poured onto the fabricated silicon wafer. The sample was placed into 60 ℃ constant-temperature oven (Thermo Scientific) overnight and liquid mixture became an elastomer. The PDMS concave wells with different diameters can be obtained after peeling off the PDMS layer from silicon wafer. Initially, convex PDMS spherical surface was made by concave ones. First, PDMS with concave wells are cleaned using 0.1 M NaOH. Aquapel (a silane solution) was added onto the PDMS surface for about 10 mins. Then a PDMS liquid mixture was added onto Aquapel and was placed into 60 ℃ constant-temperature oven (Thermo Scientific) overnight. By separating the two PDMS layers, we can obtain a PDMS layer with convex spherical surface. The convex PDMS made using this method need to be cleaned using plasma cleaner before use. However, in most cases MDCK cells don’t grow well on these surfaces due to the remaining of chemicals. Later on, we tried to directly put glass beads with different sizes onto a thin (less than 200 µm) PDMS layer, shown in Fig. 2-1 (B). Fluorescent PDMS wells were also made by adding additional chemical Rhodamine B (Sigma, No. R6626) for presentation purpose. PDMS with wells are cut into small pieces and put into 35 mm petri dish for use. The PDMS layer with wells side was first cleaned using ethanol (70%, diluted in deionized water) and exposed in UV light for 15 min. Then 0.1 mg/mL collagen solution (1:100 diluted in PBS, Advanced BioMatrix, Catalog No. 5133) was coated onto the surface of wells overnight in 4 ℃ refrigerator. Before seeding cells, the coated PDMS was cleaned again to remove possible collagen precipitation using PBS (Gibco, REF No. 20012-027).
Figure 2-1. PDMS spherical surface fabrication and cells seeding. (A) Concave spherical surface fabrication using soft lithography. (B) Convex spherical surface fabricated by dropping glass bead with diameters range 200~300 µm, 420~500 µm and 600~700 µm onto PDMS layer.
2.2 MDCK cell culture
MDCK (Madin-Darby Canine Kidney) cells were cultured and induced following a previously established protocol. In details, MDCK cells (ATCC) were cultured in DMEM medium (Corning, No. 10-013-CV), supplemented with 5% fetal bovine serum (ATCC No. 30-2020), 1% Penicillin-Streptomycin (ThermoFisher, No. 15140122). To subculture cells, 0.25% Trypsin-EDTA solution (Corning, No. 25-053-CI) was added to a nearly confluent (~70%) cell layers grown within T-25 flasks in a normal cell culture incubator (5% CO2, 37 ℃). After 5~10 mins, MDCK cells were mostly separated and floating in the culture medium. The cell solution was removed into a 15 mL tube and centrifuged at 800 r/min for 5 min. After pouring the medium, 1 mL complete culture medium was added and pipetted it several times to fully mix. The cells solution was ready to use after diluting into a relatively lower concentration by adding more ~5 mL complete culture medium. One droplet of cell solution was added to each small PDMS sheet and subsequently put into incubator for 0.5~1 h to let cells attach to substrate. Then 2~3 mL complete culture medium was added into 35 mm petri dish. MDCK cells formed confluent monolayer after 2~3 days under 5% CO2 at 37 ℃ in a humiliated incubator.
It is worth to note that in our experiments, the cells are reluctant to move onto the convex spherical surface, while easier to move into concave spherical surface, which is the same as reported51. For convex spherical surface, the cells first grow onto the flat surface. Only after cells become very dense on flat surface can they move onto the convex spherical surface.