*For correspondence: JanRoelof.VanDerMeer@unil.ch Competing interests: The authors declare that no competing interests exist. Funding:See page 22 Received: 15 April 2020 Accepted: 24 July 2020 Published: 28 July 2020 Reviewing editor: Eva Top, University of Idaho, United States
Copyright Carraro et al. This article is distributed under the terms of theCreative Commons Attribution License,which permits unrestricted use and redistribution provided that the original author and source are credited.
An analog to digital converter controls
bistable transfer competence
development of a widespread bacterial
integrative and conjugative element
Nicolas Carraro
1, Xavier Richard
1,2, Sandra Sulser
1, Franc¸ois Delavat
1,3,
Christian Mazza
2, Jan Roelof van der Meer
1*
1
Department of Fundamental Microbiology, University of Lausanne, Lausanne,
Switzerland;
2Department of Mathematics, University of Fribourg, Fribourg,
Switzerland;
3UMR CNRS 6286 UFIP, University of Nantes, Nantes, France
Abstract
Conjugative transfer of the integrative and conjugative element ICEclc inPseudomonas requires development of a transfer competence state in stationary phase, which arises only in 3–5% of individual cells. The mechanisms controlling this bistable switch between non-active and transfer competent cells have long remained enigmatic. Using a variety of genetic tools and epistasis experiments in P. putida, we uncovered an ‘upstream’ cascade of three consecutive transcription factor-nodes, which controls transfer competence initiation. One of the uncovered transcription factors (named BisR) is representative for a new regulator family. Initiation activates a feedback loop, controlled by a second hitherto unrecognized heteromeric transcription factor named BisDC. Stochastic modelling and experimental data demonstrated the feedback loop to act as a scalable converter of unimodal (population-wide or ‘analog’) input to bistable (subpopulation-specific or ‘digital’) output. The feedback loop further enables prolonged production of BisDC, which ensures expression of the ‘downstream’ functions mediating ICE transfer competence in activated cells. Phylogenetic analyses showed that the ICEclc regulatory constellation with BisR and BisDC is widespread among Gamma- and Beta-proteobacteria, including various pathogenic strains, highlighting its evolutionary conservation and prime importance to control the behaviour of this wide family of conjugative elements.
Introduction
Biological bistability refers to the existence of two mutually exclusive stable states within a popula-tion of genetically identical individuals, leading to two distinct phenotypes or developmental pro-grams (Shu et al., 2011). The basis for bistability lies in a stochastic regulatory decision resulting in cells following one of two possible specific genetic programs that determine their phenotypic differ-entiation (Norman et al., 2015). Bistability has been considered as a bet-hedging strategy leading to an increased fitness of the genotype by ensuring survival of one of both phenotypes depending on environmental conditions (Veening et al., 2008). A number of bistable differentiation programs is well known in microbiology, notably competence formation and sporulation in Bacillus subtilis (Xi et al., 2013; Schultz et al., 2007), colicin production and persistence in Escherichia coli (Lewis, 2007), virulence development of Acinetobacter baumannii (Chin et al., 2018), or the lyso-genic/lytic switch of phage lambda (Sepu´lveda et al., 2016;Arkin et al., 1998).
Bistability may also be pervasive among many bacterial DNA conjugative systems, leading to the formation of specific conjugating donor cells at low frequency in the population (Delavat et al., 2017). The best described case of this is the dual lifestyle of the Pseudomonas integrative and
conjugative element (ICE) ICEclc (Figure 1A;Minoia et al., 2008). In the majority of cells ICEclc is maintained in the integrated state, but a small proportion of cells (3–5%) in stationary phase acti-vates the ICE transfer competence program (Minoia et al., 2008; Delavat et al., 2016). Upon resuming growth, transfer competent (tc) donor cells excise and replicate the ICE (Delavat et al., 2019), which can conjugate to a recipient cell, where the ICE can integrate (Delavat et al., 2016). ICEclc transfer competence comprises a differentiated stable state, because initiated tc cells do not transform back to the ICE-quiescent state. Although tc cells divide a few times, their division is com-promised by the ICE and eventually arrests completely (Takano et al., 2019;Reinhard et al., 2013).
ICEs have attracted wide general interest because of the large variety of adaptive functions they can confer to their host, including resistance to multiple antibiotics (Waldor et al., 1996;
Johnson and Grossman, 2015;Burrus et al., 2002), or metabolism of xenobiotic compounds, such as encoded by ICEclc (Miyazaki et al., 2015;Zamarro et al., 2016). ICEclc stands model for a ubiq-uitous family of genomic islands found by bacterial genome sequencing, occurring in important opportunistic pathogens such as Pseudomonas aeruginosa, Bordetella bronchiseptica, Xylella
fastid-iosa or Xanthomonas campestris (Miyazaki et al., 2015). The ICEclc family of elements is character-ized by a consistent ‘core’ region of some 50 kb (Figure 1A), predicted to encode conjugative functions, and a highly diverse set of variable genes with adaptive benefit (Miyazaki et al., 2015). Strong core similarities between ICEclc and the PAGI-2 family of pathogenicity islands in P.
aerugi-nosa clinical isolates have been noted previously (Miyazaki, 2011a;Klockgether et al., 2007). Although the existence and the fitness consequences of the ICEclc bistable transfer competence pathway have been studied in quite some detail, the regulatory basis for its activation has remained largely elusive (Delavat et al., 2017). In terms of its genetic makeup, ICEclc seems very distinct from the well-known SXT/R391 family of ICEs (Wozniak and Waldor, 2010) and from ICESt1/ICESt3 of
Streptococcus thermophilus (Carraro and Burrus, 2014). These carry analogous genetic regulatory circuitry to the lambda prophage, which is characterized by a typical double-negative feedback con-trol (Poulin-Laprade and Burrus, 2015; Bellanger et al., 2007). Transcriptomic studies indicated that the core region of ICEclc (Figure 1A) is higher expressed in stationary than exponential phase cultures grown on 3-chlorobenzoate (3-CBA), and organized in at least half a dozen transcriptional
eLife digest
Mobile DNA elements are pieces of genetic material that can jump from one bacterium to another, and even across species. They are often useful to their host, for example carrying genes that allow bacteria to resist antibiotics.One example of bacterial mobile DNA is the ICEclc element. Usually, ICEclc sits passively within the bacterium’s own DNA, but in a small number of cells, it takes over, hijacking its host to multiply and to get transferred to other bacteria. Cells that can pass on the elements cannot divide, and so this ability is ultimately harmful to individual bacteria. Carrying ICEclc can therefore be positive for a bacterium but passing it on is not in the cell’s best interest. On the other hand, mobile DNAs like ICEclc have evolved to be disseminated as efficiently as possible. To shed more light on this tense relationship, Carraro et al. set out to identify the molecular mechanisms ICEclc deploys to control its host.
Experiments using mutant bacteria revealed that for ICEclc to successfully take over the cell, a number of proteins needed to be produced in the correct order. In particular, a protein called BisDC triggers a mechanism to make more of itself, creating a self-reinforcing ‘feedback loop’.
Mathematical simulations of the feedback loop showed that it could result in two potential outcomes for the cell. In most of the ‘virtual cells’, ICEclc ultimately remained passive; however, in a few, ICEclc managed to take over its hosts. In this case, the feedback loop ensured that there was always enough BisDC to maintain ICEclc’s control over the cell. Further analyses suggested that this feedback mechanism is also common in many other mobile DNA elements, including some that help bacteria to resist drugs.
These results are an important contribution to understand how mobile DNAs manipulate their bacterial host in order to propagate and disperse. In the future, this knowledge could help develop new strategies to combat the spread of antibiotic resistance.
units (Gaillard et al., 2010). A group of three consecutive regulatory genes precludes ICEclc activa-tion in exponentially growing cells, with the first gene (mfsR) constituting a negative autoregulatory feedback (Figure 1B; Pradervand et al., 2014). Overexpression of the most distal of the three genes (tciR), leads to a dramatic increase of the proportion of cells activating the ICEclc transfer competence program (Pradervand et al., 2014). Despite this initial discovery, however, the nature of the regulatory network architecture leading to bistability and controlling further expression of the ICEclc genes in tc cells has remained enigmatic.
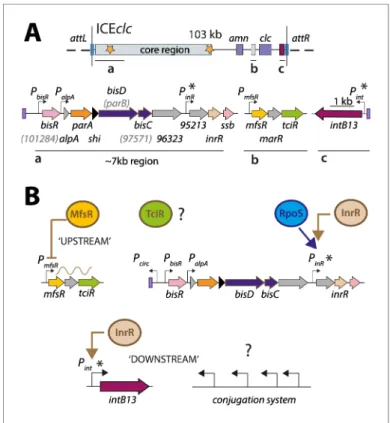
The primary goal of this work was to dissect the regulatory factors and nodes underlying the acti-vation of ICEclc transfer competence. Secondly, given that transfer competence only arises in a small proportion of cells in a population, we aimed to understand how the regulatory architecture yields and maintains ICE bistability. We essentially followed two experimental strategies and phenotypic readouts. First, known and suspected regulatory elements were seamlessly deleted from ICEclc in P. Figure 1. ICEclc and postulated regulation network for transfer competence formation. (A) Schematic
representation of the genetic organization of ICEclc (GenBank accession number AJ617740.2). Loci of interest (a, b and c) are detailed below the general map and drawn to scale. Note the ~7 kb left-end region, which is the major focus of the study. Genes are represented by coloured arrows with their name below (former names shown in lighter font inside brackets). Promoters are represented by hooked arrows pointing towards the transcription orientation. Those marked with an asterisk are known to be expressed only in the subpopulation of transfer competent cells. attL and attR, attachment sites; clc genes: 3-chlorocatechol degradation, amn genes:
2-aminophenol degradation. (B) Known steps in ICEclc transfer competence regulation. An ‘upstream’ cascade, with MfsR autorepressing its own transcription and that of tciR; TciR overexpression leading to transfer competence in almost all cells (Pradervand et al., 2014). Bistable expression of ‘downstream’ genes from PinRand Pintin the
subpopulation of transfer competent cells, and further roles of additional factors RpoS (Miyazaki et al., 2012) and InrR (Minoia et al., 2008).
The online version of this article includes the following figure supplement(s) for figure 1: Figure supplement 1. Postulated model of bistability generation of ICEclc.
Figure supplement 2. Protein domain predictions in the ICEclc bistability regulators BisR, BisD and BisC, and AlpA.
Figure supplement 3. Gene organization of ICEclc-related regulatory loci in different bacterial species. Figure supplement 4. BisDC homologs among Proteobacteria.
putida and complemented with inducible plasmid-cloned copies to study their epistasis in transfer of
the ICE. Secondly, individual and combinations of suspected regulatory elements were expressed in a P. putida host without ICE, to study their capacity to activate the ICEclc promoters Pintand PinR,
which normally only express in wild-type tc cells (Figure 1B; Minoia et al., 2008). As readout for their activation we quantified fluorescent reporter expression from single copy chromosomally inte-grated transcriptional fusions, as well as the proportion of cells expressing the reporters using sub-population statistics as previously described (Reinhard and van der Meer, 2013). On the basis of the discovered key regulators and nodes, we then developed a conceptual mathematical model to show by stochastic simulations how bistability is generated and maintained. This suggested that the ICEclc transfer competence regulatory network essentially converts a unimodal (analog) input signal from the ‘upstream’ regulatory branch occurring in all cells (Figure 1B) to a bistable (digital) output in a subset, and in scalable manner. We experimentally verified this scalable analog-digital conver-sion in a P. putida without ICEclc but with the reconstructed bistability generator. The key ICEclc bistability regulatory elements involve new previously unrecognized transcription factors, which are conserved among a wide range of Proteobacteria, illustrating their importance for the behaviour of this conglomerate of related ICEs.
Results
Activation of ICEclc starts with the LysR-type transcription regulator
TciR
Previous work had implied an ICEclc-located operon of three consecutive regulatory genes (mfsR,
marR and tciR,Figure 1B) in control of transfer competence formation (Pradervand et al., 2014). That work had shown that mfsR codes for an autorepressor, whose deletion yielded unhindered pro-duction of the LysR-type activator TciR. As a result, the proportion of tc cells is largely increased in
P. putida UWC1 bearing ICEclc-DmfsR (Delavat et al., 2016;Pradervand et al., 2014). We repro-duced this state of affairs here by cloning tciR under control of the IPTG-inducible Ptacpromoter on
a plasmid (pMEtciR) in P. putida UWC1-ICEclc. In absence of cloned tciR, transfer of wild-type ICEclc from succinate-grown P. putida to an ICEclc-free isogenic P. putida was below detection limit, indi-cating that spontaneous ICE activation under those conditions is negligible (Figure 2A). In contrast, inducing tciR expression by IPTG addition triggered ICEclc transfer from succinate-grown cells up to frequencies close to those observed under wild-type growth conditions with 3-CBA (Miyazaki and van der Meer, 2011b) (10–2transconjugant colony-forming units (CFU) per donor CFU,Figure 2A). Transfer frequencies were lower in the absence of IPTG, which indicated that leaky expression of
tciR from Ptacwas sufficient to trigger ICEclc transfer (Figure 2A). These results confirmed the
impli-cation of TciR and thus we set out to identify its potential activation targets on ICEclc.
Induction of tciR from pMEtciR in P. putida without ICEclc was insufficient to trigger eGFP pro-duction from a single-copy Pintpromoter, which is a hallmark of induction of ICEclc transfer
compe-tence (Figure 2B; Minoia et al., 2008; Delavat et al., 2016). In contrast, in presence of ICEclc, similar induction of tciR yielded a clear increased subpopulation of activated cells (Figure 2C). This suggested, therefore, that TciR does not directly activate Pint, but only through one or more other
ICE-located factors. To search for such potential factors, we examined in more detail the genes in a 7 kb region at the left end of ICEclc (close to the attL site,Figure 1A), where transposon mutations had previously been shown to influence Pintexpression (Sentchilo et al., 2003). In addition, three
promoters had been characterized in this region (Figure 1A;Gaillard et al., 2010), which we tested individually for potential activation by TciR (Figure 2B).
Promoters were fused with a promoterless egfp gene and inserted in single copy into the chro-mosome of P. putida UWC1 without ICEclc (Materials and methods). Induction of tciR from Ptacon
pMEtciR did not yield any eGFP fluorescence in P. putida UWC1 containing a single-copy PalpA- or
PinR-egfp transcriptional fusion (Figure 2B). In contrast, the PbisR-egfp fusion was activated upon
induction of TciR compared to a vector-only control (p=0.0042, paired t-test,Figure 2B & D). This suggested that the link between TciR and ICEclc transfer competence proceeds through transcrip-tion activatranscrip-tion of the promoter upstream of the gene bisR (previously designated orf101284). This transcript has previously been mapped and covers a single gene (Gaillard et al., 2010). We renamed
this gene as bisR, or bistability regulator, for its presumed implication in ICEclc bistability control (Figure 1—figure supplement 1, see further below).
BisR is the second step in the cascade of ICEclc transfer competence
initiation
bisR is predicted to encode a 251-aa protein of unknown function with no detectable Pfam-domains.
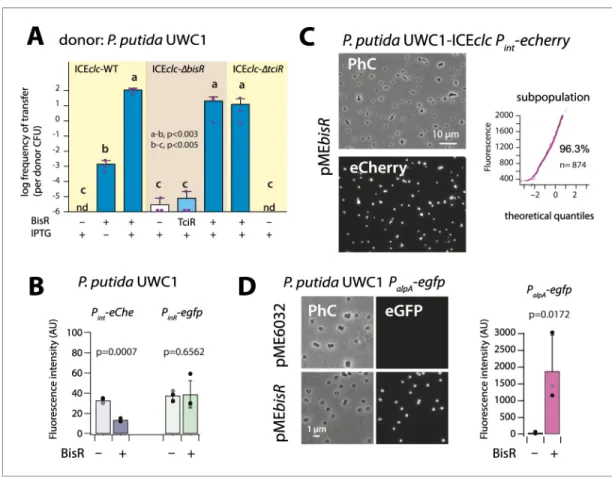
Further structural analysis using Phyre2 (Kelley et al., 2015) suggested three putative domains with low confidence (between 38% and 53%,Figure 1—figure supplement 2). One of these is a pre-dicted DNA-binding domain, which hinted at the possible function of BisR as a transcriptional regu-lator itself. BlastP analysis showed that BisR homologs are widely distributed and well conserved Figure 2. The LysR-type regulator TciR links to a single node in the regulation network. (A) Ectopic overexpression of tciR induces ICEclc wild-type conjugative transfer under non-permissive conditions. Bars show the means (+ one standard deviation) of transconjugant formation after 48 hr in triplicate matings using P. putida UWC1 donors carrying the indicated ICEclc or plasmids, in absence (-) or presence (+) of 0.1 mM IPTG, and with a GmR-derivative of P. putida as recipient. Dots represent individual transfer; nd: not detected (<10 7for the three replicates). p-value derives from
one-sided t-test comparison (n = 3). (B) Reporter expression from single copy chromomosomal PbisR, PinR, Pint, or PalpAtranscriptional egfp fusions in P.
putida UWC1 without ICEclc as a function of ectopically expressed TciR, in comparison to strains carrying the empty vector pME6032. Bars show means of the 75thpercentile fluorescence of 500–1000 individual cells each per triplicate culture grown on succinate, induced with 0.05 mM IPTG. Error bars denote standard deviation from the means from biological triplicates (dots show individual 75thpercentiles). AU, arbitrary units of brightness at 500 ms
exposure. p-values derive from pair-wise comparisons in t-tests between cultures expressing TciR and not. (C) Proportion of cells expressing eCherry from a single-copy chromosomal insertion of Pintin P. putida with ICEclc in presence of induced TciR (pMEtciR, 0.05 mM IPTG) or with empty vector
(pME6032). Fluorescence images scaled to same brightness (300–2000). Diagrams show quantile-quantile plots of individual cell fluorescence levels, with n denoting the number of analysed cells and the shaded part indicating the subpopulation size expressing Pint-echerry. (D) Fluorescence images of
P. putida without ICEclc with a single-copy chromosomal PbisR-egfp fusion in presence of empty vector or of induced TciR. Images scaled to same
brightness (300–1200).
The online version of this article includes the following source data for figure 2: Source data 1.Figure 2panel A: ICEclc transfer data.
Source data 2.Figure 2panel B: 75thpercentile fluorescence data. Source data 3.Figure 2panel C: qq-plot single cell fluorescence data.
among Beta-, Alpha- and Gammaproteobacteria, with homologies ranging from 43–100% amino acid identity over the (quasi) full sequence length (Figure 1—figure supplement 2).
In order to investigate its potential regulatory function, bisR was cloned on a plasmid (pMEbisR) and introduced into P. putida UWC1-ICEclc. Inducing bisR by IPTG addition from Ptactriggered high
rates of ICEclc transfer on succinate media (Figure 3A). Deletion of bisR on ICEclc abolished its transfer, even upon overexpression of tciR, but could be restored upon ectopic expression of bisR (Figure 3A). This showed that the absence of transfer was due to the lack of intact bisR, and not to a polar effect of bisR deletion on a downstream gene (Figure 1A). In addition, transfer of an ICEclc deleted for tciR (Pradervand et al., 2014) could be restored by ectopic bisR expression
Figure 3. Identification of BisR as a new intermediary regulator for PalpAactivation. (A) Ectopic overexpression of
bisR induces ICEclc conjugative transfer under non-permissive conditions and from ICEclc deleted of key regulatory genes. For explanation of bar diagram meaning, seeFigure 2Alegend. BisR (+), plasmid with bisR; TciR, pMEtciR; –, empty vector pME6032. nd: not detected (<10 7for the three replicates). Letters indicate significance groups in ANOVA followed by post-hoc Tukey testing (e.g., a-b: p-values between groups a and b; b-c: p-values between groups b and c). (B) Absence of direct induction by BisR of Pintor PinRfluorescence
reporters in P. putida without ICE. For explanation of bars, seeFigure 2Blegend. (C) Population-wide expression of Pint-echerry in P. putida with ICEclc upon ectopic induction of plasmid-located BisR (pMEbisR, 0.05 mM IPTG).
Image brightness scale: 300–2000. For vector control, seeFigure 2C. (D) Induced BisR from plasmid leads to reporter expression from the alpA-promoter in all cells of P. putida without ICEclc. Image brightness scales: 300– 1200. Bars show means and standard deviation from median fluorescence intensity of single cells (n = 500–1000, summed from 6 to 12 images per replicate) of biological triplicates. p-value derives from pair-wise t-test between cultures with empty vector (–) and those with induced BisR (+).
The online version of this article includes the following source data for figure 3: Source data 1.Figure 3panel A: ICEclc transfer frequencies.
Source data 2.Figure 3panel C: qq plot single cell fluorescence values. Source data 3.Figure 3panel B and panel D: 75thpercentile fluorescence data.
(Figure 3A). This indicated that TciR is ‘upstream’ in the regulatory cascade of BisR, and that TciR does not act anywhere else on the expression of components crucial for ICEclc transfer.
IPTG induction of bisR in P. putida without ICE again did not yield activation of the single-copy
Pint or PinR transcriptional reporter fusions, whereas some repression was observed on Pint itself
(Figure 3B). In contrast, BisR induction in P. putida UWC1 with ICEclc led to a massive activation of the same reporter constructs in virtually all cells (Figure 3C), compared to a vector-only control (Figure 2C, pME6032). This suggested that BisR was an(other) intermediate regulator step in the complete cascade of activation of ICEclc transfer competence. Of the tested ICE–promoters within this 7 kb region, BisR induction triggered very strong expression from a single copy PalpA–egfp
tran-scriptional fusion in all cells (Figure 3D). This indicated that BisR is a transcription activator, and an intermediate regulator between TciR and further factors encoded downstream of the alpA-promoter (Figure 1—figure supplement 1).
A new regulator BisDC is the last step in the activation cascade
Next, we thus focused our attention on the genes downstream of the alpA-promoter. Cloning the genes from alpA all the way to inrR (Figure 1A) on plasmid pME6032 under control of Ptac and
inducing that construct with IPTG resulted in activation of PinR–egfp and Pint–echerry expression in P.
putida without ICEclc (Figure 4A). Both these promoters had been silent upon activation of TciR or BisR (Figure 2BandFigure 3B). This indicated that one or more regulatory factors directly control-ling expression of PinRand/or Pintwere encoded in this region, which we tried to identify by
subclon-ing different gene configurations.
Removing alpA from the initial construct had no measurable effect on expression of the fluores-cent reporters, but replacing Ptacby the native PalpApromoter abolished all Pintreporter activation
(Figure 4B,Figure 4—figure supplement 1). This suggested that PalpAis silent without activation
by BisR (see below) and no spontaneous production of regulatory factors occurred. Removing three genes at the 3’ extremity (i.e., orf96323, orf95213 and inrR) reduced Pint–echerry reporter
expres-sion, but a fragment with a further deletion into the bisC gene was unable to activate Pint
(Figure 4B). Induction of inrR alone did not result in Pintactivation (Figure 4B). Deletion of parA and
shi at the 5’ end of the fragment still enabled reporter expression from Pint, narrowing the activator
factor regions down to two genes, previously named parB and orf97571, but renamed here to bisD and bisC (Figure 4B). Neither bisC or bisD alone, but only the combination of bisDC resulted in reporter expression from Pintin P. putida UWC1 without ICEclc (Figure 4B), and similarly, of PinR
(Figure 4—figure supplement 1). In the presence of ICEclc, inducing either bisC or bisD from a plasmid yielded a small proportion of cells expressing the Pintreporters (Figure 4C). This was not
the case in a P. putida carrying an ICEclc with a deletion of bisD (Figure 4—figure supplement 2), suggesting there was some sort of feedback mechanism of BisDC on itself (see further below). In contrast, induction of bisDC in combination caused a majority of cells to express fluorescence from
Pintin P. putida containing ICEclc (Figure 4C) or ICEclc-DbisD (Figure 4—figure supplement 2).
These results indicated that BisDC acts as an ensemble to activate transcription, and this pointed to
bisDC as the last step in the regulatory cascade, since it was the minimum unit sufficient for
activa-tion of the Pint–promoter, which is exclusively expressed in the subpopulation of tc cells of wild-type
P. putida with ICEclc (Delavat et al., 2016;Figure 1—figure supplement 1).
Induction of bisDC from plasmid pMEbisDC yielded high frequencies of ICEclc transfer from P.
putida UWC1 under succinate-growth conditions (Figure 4D). Expression of BisDC also induced transfer of ICEclc-variants deleted for tciR or for bisR (Figure 4D). This confirmed that both tciR and
bisR relay activation steps to PbisR and PalpA, respectively, but not to further downstream ICE
pro-moters (Figure 1—figure supplement 1). Moreover, an ICEclc deleted for bisD could not be restored for transfer by overexpression of tciR or bisR, but only by complementation with bisDC (Figure 4D). Interestingly, the frequency of transfer of an ICEclc lacking bisD complemented by expression of bisDC in trans was two orders of magnitude lower than that of similarly complemented wild-type ICEclc, ICEclc with tciR- or bisR-deletion (Figure 4D). This was similar as the reduction in reporter expression observed in P. putida ICEclc-DbisD complemented with pMEbisDC compared to wild-type ICEclc (Figure 4—figure supplement 2), and suggested the necessity of some ‘reinforce-ment’ occurring in the wild-type configuration that was lacking in the bisD deletion and could not be restored by in trans induction of plasmid-cloned bisDC.
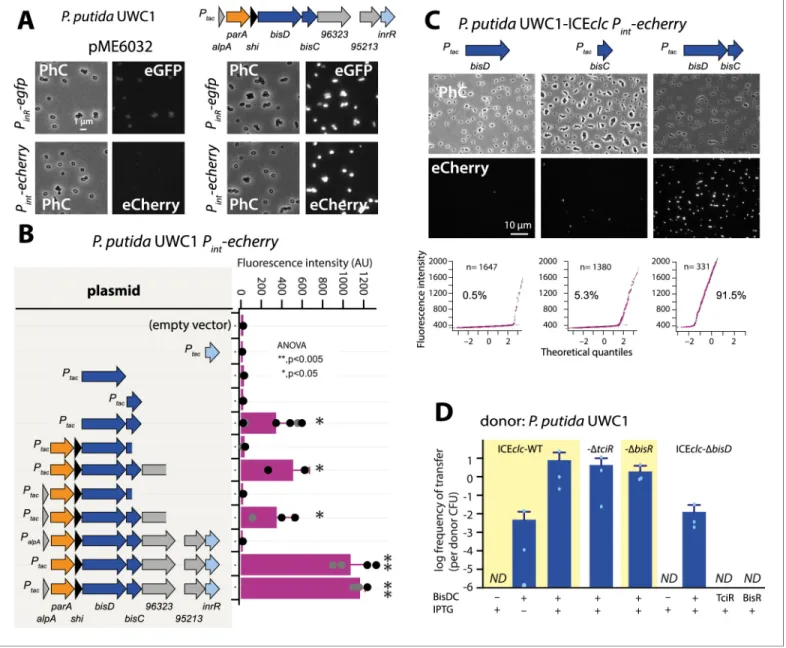
Figure 4. A new regulatory factor BisDC for activation of downstream ICEclc functions. (A) IPTG (0.05 mM) induction of a plasmid with the cloned ICEclc left-end gene region (as depicted on top) leads to reporter expression from the ‘downstream’ PinR- and Pint-promoters in P. putida without
ICEclc. Fluorescence images scaled to same brightness (300–1200). (B) Pint-echerry reporter expression upon IPTG induction (0.05 mM) of different
plasmid-subcloned left-end region fragments (grey shaded area on the left) in P. putida without ICEclc. Bars show means of median cell fluorescence levels with one standard deviation, from triplicate biological cultures (n = 500–1000 cells, summed from 6 to 12 images per replicate). Asterisks denote significance groups in ANOVA followed by post-hoc Tukey testing. (C) Population response of Pint-echerry induction in P. putida with ICEclc in presence
of plasmid constructs expressing bisD, bisC or both (fluorescence images scaled to 300–2000 brightness). Quantile-quantile plots (n = number of cells) below show the estimated size of the responding subpopulation. (D) Effect of bisDC induction from cloned plasmid (0.05 mM IPTG) on conjugative transfer of ICEclc wild-type or mutant derivatives. Transfer assays as in legend toFigure 2A. ND, below detection limit (10–7).
The online version of this article includes the following source data and figure supplement(s) for figure 4: Source data 1.Figure 4panel B: median fluorescence values.
Source data 2.Figure 4panel C: qq plot single cell fluorescence data. Source data 3.Figure 4panel D: ICEclc transfer data.
Figure supplement 1. Effect of bisDC containing plasmid constructs on fluorescent protein expression from a single copy dual Pint-PinRreporter in
P. putida without ICEclc.
BisDC is part of a positive autoregulatory feedback loop
To investigate this potential ‘reinforcement’ in wild-type configuration, we revisited the potential for activation of the alpA promoter. Induction by IPTG of the plasmid-cloned fragment encompassing the gene region parA-shi-bisDC caused strong activation of reporter gene expression from PalpAin
P. putida without ICEclc (Figure 5A). The minimal region that still maintained PalpAinduction
encom-passed bisDC, although much lower than with a cloned parA-shi-bisDC fragment (Figure 5A). Inter-estingly, when the parA-shi-bisDC fragment was extended by alpA itself, reporter expression from
PalpAwas abolished, whereas also a fragment containing only alpA caused significant repression of
the alpA promoter (Figure 5A). The alpA gene is predicted to encode a 70-amino acid DNA binding protein with homology to phage regulators (Trempy et al., 1994;Figure 1—figure supplement 2). These results would imply feedback control on activation of PalpA, since its previously mapped
tran-script covers the complete region from alpA to orf96323 on ICEclc, including bisDC (Figure 1A;Gaillard et al., 2010). Although induction of BisDC was sufficient for activation of tran-scription from PalpA, this effectively only yielded a small subpopulation of cells with high reporter
fluorescence values (Figure 5B & C), in contrast to induction of the larger cloned gene region encompassing parA-shi-bisDC that activated all cells (Figure 5B & C). The feedback loop, therefore, seemed to consist of a positive forward part that includes BisDC (reinforced by an as yet unknown other mechanism) and a modulatory repressive branch including AlpA (Figure 1—figure supple-ment 1).
Modelling suggests positive feedback loop to generate and maintain
ICEclc bistable output
The results so far thus indicated that ICEclc transfer competence is initiated by TciR activating tran-scription of the promoter upstream of bisR. BisR then kickstarts expression from the alpA-promoter, leading to (among others) expression of BisDC. This is sufficient to induce the ‘downstream’ ICEclc transfer competence pathway (Figure 1—figure supplement 1), exemplified here by activation of the Pintand PinRpromoters that become exclusively expressed in the subpopulation of transfer
com-petent cells under wild-type conditions (Minoia et al., 2008). In addition, BisDC reinforces transcrip-tion from the same alpA-promoter.
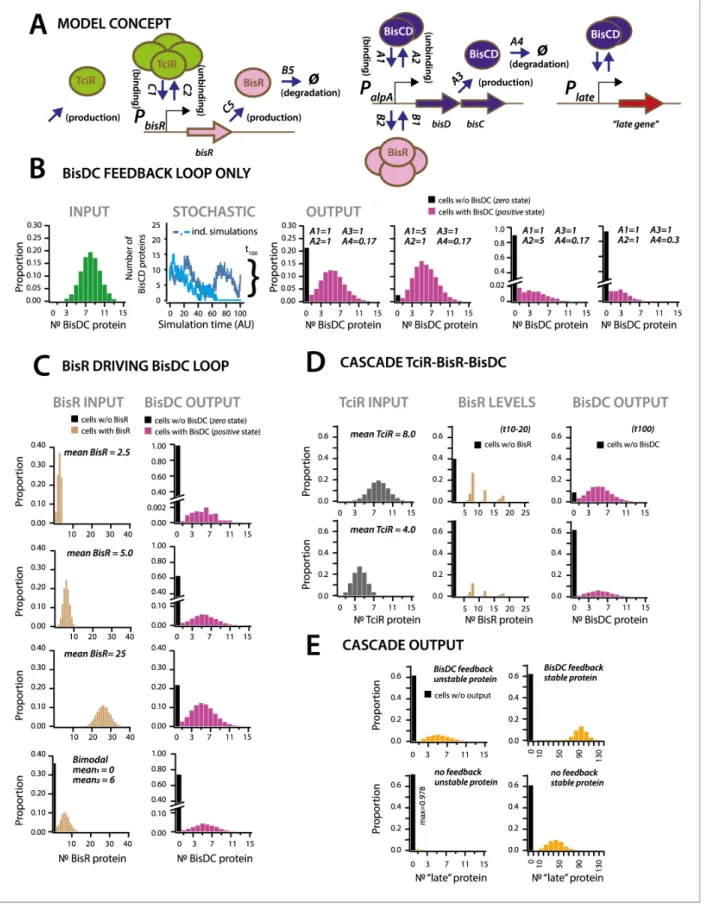
In order to understand the importance of this regulatory architecture for generating bistability, for initiating and maintaining (downstream) transfer competence, we developed a conceptual mathe-matical model (Figure 6A, Materials and methods, SI model). The model assumes the regulatory fac-tors TciR, BisR and BisDC, typical oligomerization (Tropel and van der Meer, 2004), as well as binding of the oligomerized forms to and unbinding from their respective nodes (i.e., the linked pro-moters PbisR, PalpAand Pint). Binding is assumed to lead to protein synthesis and finally, protein
deg-radation (Figure 6A). We varied and explored the outcomes of different regulatory network architectures and parts, testing their effect on production of intermediary and downstream elements in stochastic simulations, with each individual simulation corresponding to events taking place in an individual cell (Figure 6A,SImodel).
First we simulated the cellular output of BisDC in a subnetwork configuration with only BisDC activating PalpA(i.e., in absence of TciR or BisR,Figure 6B). Stochastic simulations (n = 10,000) of
this bare feedback loop with an arbitrary start of binomially distributed BisDC quantities (mean = 8 molecules per cell,Figure 6B, INPUT), yielded a bimodal population with two BisDC output states after 100 time steps, one of which is zero (black bar in histograms) and the other with a mean
posi-tive BisDC value (magenta) (Figure 6B). The output zero results when BisDC levels stochastically fall to 0 (as in case of the light blue line in the panel STOCHASTIC ofFigure 6B), since in that case there is no BisDC to stimulate its own production. Parameter variation showed that the proportion of cells with output zero from the loop is dependent on the binding and unbinding constants of BisDC to the alpA promoter, and the BisDC degradation rate (Figure 6B, different A1, A2 and A4-values). In addition, BisDC unbinding and degradation rates can influence the median BisDC output quantity in cells with positive state (Figure 6B, case of A2 = 5 or A4 = 0.3). This simulation thus indicated that a BisDC feedback loop can produce bimodal output, once BisDC is present.
Since the feedback loop cannot start without BisDC, it is imperative to kickstart the alpA pro-moter by BisR (Figure 6C). Simulations of a configuration that includes activation by BisR, showed how upon a single pulse of BisR, the feedback loop again leads to a bimodal population with zero
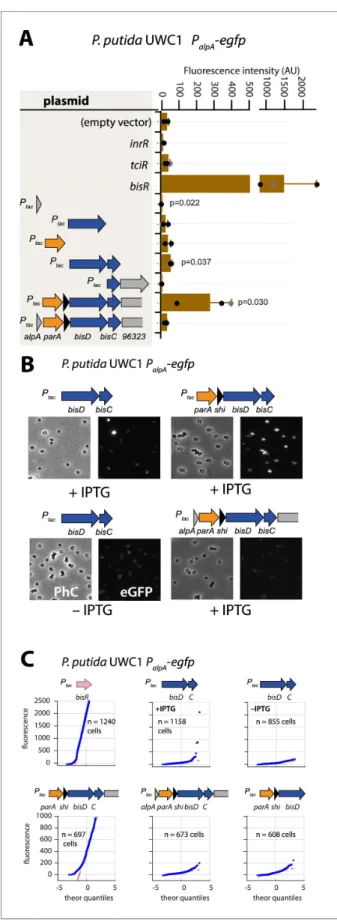
Figure 5. Autoregulatory feedbacks on the alpA promoter. (A) PalpA-reporter expression upon IPTG induction
(0.05 mM) of plasmid-cloned individual genes or gene combinations (as depicted in the shaded area on the left) in P. putida without ICEclc. Bars represent means of median cell fluorescence plus one standard deviation, as in legend toFigure 2B. p-values stem from pair-wise comparisons between triplicate cultures carrying the empty Figure 5 continued on next page
and positive BisDC levels (Figure 6C). Increasing the (uniformly distributed) mean quantity of BisR in the simulations, within a per-cell range that is typically measured for transcription factors (Li et al., 2014), increased the proportion of cells with positive BisDC state, but did not influence their mean BisDC quantity (Figure 6C). Even bimodally distributed BisR input also gave rise to bimodal BisCD output, but with a higher proportion of zero BisDC state (Figure 6C, bimodal). In contrast to the BisDC loop alone, therefore, activation by BisR only influences the proportion of zero and positive BisDC states in the population, but not the mean resulting BisDC quantity in cells with positive state. In the full regulatory hierarchy of the ICE, production of BisR is controlled by TciR. Simulation of this configuration showed that bimodality already appeared at the level of BisR (Figure 6D). The proportions of zero and positive states of both BisR and BisDC varied depending on the mean of uniformly distributed amounts of TciR among all cells, again sampled to within regular empiric tran-scription regulator quantities in individual cells (Li et al., 2014;Figure 6D). Bimodal BisDC levels are propagated by the network architecture to downstream (‘late’) promoters, as a consequence of them being under BisDC control (Figure 6A & E). Importantly, simulations of an architecture without the BisDC feedback loop consistently resulted in lower protein output from BisDC–regulated pro-moters in activated cells than with feedback (Figure 6E). This suggests two crucial functions for the ICE regulatory network: first, to convert unimodal or stochastic (‘analog’) expression of TciR and BisR among all cells to a consistent subpopulation of cells with positive (‘digital’) BisDC state, and secondly, to ensure sufficient BisDC levels to activate downstream promoters within the positive cell population (Figure 6E). Through the kickstart by BisR and reinforcement by BisDC itself, bimodal expression at the alpA-promoter node can thus yield a stably expressed transfer competence path-way in a subpopulation of cells.
ICEclc regulatory architecture exemplifies a faithful analog-to-digital
converter
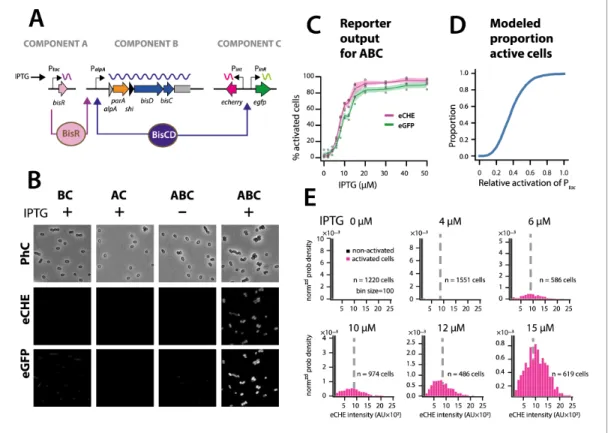
Simulations thus predicted that the ICE regulatory network faithfully transmits and stabilizes analog input (e.g., a single regulatory factor uniformly or stochastically expressed at moderately low levels in all cells [Li et al., 2014]) to bistable output (e.g., a subset of cells with transfer competence and the remainder silent). To demonstrate this experimentally, we engineered a P. putida without ICEclc, but with a single copy chromosomally inserted IPTG-inducible bisR, a plasmid with
alpA-parA-shi-bisDC under control of PalpA, and a single-copy dual Pint-echerry and PinR-egfp reporter (Figure 7A).
Induction from Ptacby IPTG addition yields unimodal (analog) production of BisR, the mean level of
which can be controlled by the IPTG concentration (Figure 7—figure supplement 1). In the pres-ence of all components of the system, IPTG induction of BisR led to bistable activation of both reporters (Figure 7B, ABC). Increasing BisR induction was converted by the feedback loop into an increased proportion of fluorescent cells (Figure 7C). This effectively created a scalable bimodal (digital) output from unimodal input, dependent on the used IPTG concentration (Figure 7C, Fig-ure 7—figFig-ure supplement 1). The proportion of fluorescent cells was in line with predictions from stochastic simulations as a function of the relative strength of Ptacactivation (Figure 7D).
Further-more, in agreement with model predictions (Figure 6C), the median fluorescence of activated cells remained the same at different IPTG (and thus BisR) concentrations (Figure 7E). These results con-firmed that the feedback loop architecture transforms a unimodal (analog) regulatory factor concen-tration (BisR) into a stabilized bimodal (digital) output.
Figure 5 continued
vector pME6032 and the indicated plasmid-cloned gene(s). (B) Cell images of P. putida PalpA-egfp without ICEclc
expressing plasmid-cloned combinations with bisDC (fluorescence brightness scaled to 300–1200, 0.05 mM IPTG). (C) Quantile-quantile estimation of subpopulation expression of the PalpA-egfp reporter, showing the sufficiency of
bisDC induction for autoregulatory feedback and the reinforcement from upstream elements (n denotes the number of cells used for the quantile-quantile plot, summed from 6 to 12 images of a single replicate culture). The online version of this article includes the following source data for figure 5:
Source data 1.Figure 5panel A: Median fluorescence values.
Figure 6. Stochastic simulations of ICEclc regulatory network configurations. (A) Conceptual model of the ICEclc regulatory cascade producing bistable output. Ellipses indicate the three major regulatory factors (TciR, BisR and BisDC) interacting with their target promoters (PbisR, PalpA), and
BisDC-regulated downstream output (here schematically as Plateand a late gene). Relevant simulated processes include: production (combination of
transcription and translation, with corresponding rates: C5, A3), oligomerization (assumed number of protein monomers in the binding complex), Figure 6 continued on next page
BisDC-elements are widespread in other presumed ICEs
Pfam analysis detected a DUF2857-domain in the BisC protein, and further structural analysis using Phyre2 indicated significant similarities of BisC to FlhC (Figure 1—figure supplement 2). FlhC is a subunit of the master flagellar activator FlhDC of E. coli and Salmonella (Claret and Hughes, 2000;
Liu and Matsumura, 1994). BisD carries a ParB domain, with a predicted DNA binding domain in the C-terminal portion of the protein (Figure 1—figure supplement 2). Although no FlhD domain was detected in BisD, in analogy to FhlDC we named the ICEclc activator complex BisDC, for bist-ability regulator subunits D and C.
Database searches showed that bisDC loci are also widespread among pathogenic and environ-mental Gamma- and Beta-proteobacteria, and are also found in some Alphaproteobacteria ( Fig-ure 1—figFig-ure supplement 3). Phylogenetic analysis using the more distantly related sequence from
Dickeya zeae MS2 as an outgroup indicated several clear clades, encompassing notably bisDC
homologs within genomes of P. aeruginosa and Xanthomonas (Figure 1—figure supplement 4). Several genomes contained more than one bisDC homolog, the most extreme case being Bordetella
petrii DSM12804 with up to four homologs belonging to four different clades (Figure 1—figure sup-plement 4).
The gene synteny from bisR to inrR of ICEclc was maintained in several genomes (Figure 1—fig-ure supplement 3), suggesting them being part of related ICEs with similar regulatory architecture. Notably, some of those are opportunistic pathogens, such as P. aeruginosa, B. petrii, B.
bronchisep-tica, or X. citri, and regions of high similarity to the ICEclc regulatory core extended to the
well-known pathogenicity islands of the PAGI-2 (Klockgether et al., 2007) and PAGI-16 families (Hong et al., 2016; Figure 1—figure supplement 3). Several of the ICEclc core homologs carry genes suspected in virulence (e.g., filamentous hemagglutinin [Sun et al., 2016] encoded on the P.
aeruginosa HS9 and Carb01-63 genomic islands), or implicated in acquired antibiotic resistance (e.g,
multidrug efflux pump on the A. xylosoxidans NH44784-1996 element (Miyazaki et al., 2015), and carbapenem resistance on the PAGI-16 elements [Hong et al., 2016]). This indicates the efficacy of the ICEclc type regulatory control on the dissemination of this type of mobile elements, and conse-quently, on the distribution and selection of adaptive gene functions they carry.
Discussion
ICEs operate a dual life style in their host, which controls their overall fitness as the integral of verti-cal descent (i.e., maintenance of the integrated state and replication with the host chromosome) and horizontal transfer (i.e., excision from the host cell, transfer and reintegration into a new host) (Delavat et al., 2017;Delavat et al., 2016;Johnson and Grossman, 2015). The decision for hori-zontal transfer is costly and potentially damages the host cell (Delavat et al., 2016;
Pradervand et al., 2014), which is probably why its frequency of occurrence in most ICEs is fairly low (<10–5per cell in a host cell population) (Delavat et al., 2017). Consequently, the mechanisms
Figure 6 continued
binding and unbinding to the target promoter, and degradation. All processes are simulated as stochastic events across 100 time steps, and protein output levels are summarized from 10,000 individual stochastic simulations (curly bracket in B; detailed parametrization inSupplementary file 4; one simulation being equivalent to an individual cell). (B) Behaviour of a BisDC autoregulatory feedback loop on the distribution of BisDC protein levels per cell (histograms, n = 10,000 simulated cells) as a function of different binding (A1), unbinding (A2), production (A3) and degradation (A4) rate constants, starting from a uniformly distributed set of BisDC levels (input, in green). Black bar indicates the proportion of cells with zero output (i.e., non-activated circuit). Light blue: simulation example where BisDC levels go to zero and loop would die out. Dark blue: BisDC levels remain positive. (C) As for A, but for an architecture of BisR initiating bisDC expression, with different input distributions (uniformly low to high mean, or bimodal BisR input). Note how higher or bimodal BisR input is not expected to change the median BisDC quantity in active cells, but only the proportion of ‘cells’ with positive (magenta, bars) and zero state (black bars; n = 10,000 simulated cells; note different ordinate scales). (D) As for A, but for the complete cascade starting with TciR. Shown are regulatory factor level distributions from two different TciR starting distributions across 10,000 simulations; for BisR integrated between time points 10 and 20 (t10-20), and for BisDC after 100 time steps (t100). Bimodal expression of zero and positive states arises at the bisR node, but is further maintained to constant BisDC output as a result of the feedback loop. (E) Importance of the BisDC-feedback on the output of a downstream (‘late’) BisDC-dependent expressed protein, for a case of a stable and an unstable protein (n = 10,000 simulated cells).
The online version of this article includes the following source data for figure 6: Source data 1.Figure 6panels B–E: Model simulations and histogram data.
that initiate and ensure ICE horizontal transfer must have been selected to operate under extremely low opportunity with high success. In other words, they have been selected to maximize faithful maintenance of transfer competence development, once this process has been triggered in a host cell. One would thus expect such mechanisms to impinge on rare, perhaps stochastic cellular events, yielding robust output despite cellular gene expression and pathway noise. ICEclc is further particu-lar in the sense that its transfer competence is initiated in cells during stationary phase conditions (Miyazaki et al., 2012), which restricts global transcription and activity, and may even profoundly alter the cytoplasmic state of the cell (Parry et al., 2014).
The results of our work here reveal that the basis for initiation and maintenance of ICEclc transfer competence in a minority of cells in a stationary phase population (Reinhard et al., 2013), originates in a multinode regulatory network that further includes a positive feedback loop. Genetic dissection, epistasis experiments and expression of individual components in P. putida devoid of the ICE showed that the network consists of a number of regulatory factors, composed of MfsR, TciR, BisR and BisDC, acting sequentially on singular (TciR, BisR) or multiple nodes (BisDC). The network has an ‘upstream’ branch controlling the initiation of transfer competence, a ‘bistability generator’ that Figure 7. The ICEclc bistability generator is a scalable analog-digital converter. (A) Schematic representation of the three ICEclc components used to generate scalable bistable output in P. putida UWC1 without ICE. (B) Cell images of P. putida with the different bistability-generator components as indicated, induced in presence or absence of IPTG (0.1 mM). Fluorescence brightness scaled to between 300–1200. (C) Proportion of active cells (estimated from quantile-quantile plotting as inFigure 2C) as a function of IPTG concentration (same induction time for all). Lines correspond to the means from three biological replicates with transparent areas representing the standard deviation. (D) Modelled proportion of cells with positive output in the architecture ofFigure 6Cas a function of the relative BisR starting levels from Ptac. (E) Measured distributions (as normalized probability density)
of eCherry fluorescence among the subpopulations of activated (magenta bars) and non-activated cells (black bars) at different IPTG concentrations, showing same subpopulation fluorescence median (dotted grey lines), as predicted in the stochastic model. AU, arbitrary units of fluorescence brightness at 500 ms exposure. n denotes the number of cells used to produce the histograms, summed from 6 to 12 images from a single replicate culture. Panels autoscaled to maximum ordinate.
The online version of this article includes the following source data and figure supplement(s) for figure 7: Source data 1.Figure 7panel C: Mean fluorescence data.
Source data 2.Figure 7panel E: Single cell and histogram fluorescence data of IPTG induction.
confines the input signal, and maintains the ‘downstream’ path of transfer competence to a dedi-cated subpopulation of cells (Figure 1—figure supplement 1).
The previously characterized mfsR-marR-tciR operon (Pradervand et al., 2014), whose transcrip-tion is controlled through autorepression by MfsR, is probably the main break on activatranscrip-tion of the upstream branch. This was concluded from effects of deleting mfsR, which resulted in overexpres-sion of TciR, and massively increased and deregulated ICE transfer even in exponentially growing cells (Pradervand et al., 2014). We showed here that TciR activates the transcription of a hitherto unrecognized transcription factor gene named bisR, but not of any further critical ICEclc promoters. Autorepression by MfsR in wild-type ICEclc results in low unimodal transcription from PmfsR
(Pradervand et al., 2014) and therefore, likely, to low TciR levels in all cells. TciR appeared here as a weak activator of the bisR promoter, suggesting that only in a small proportion of cells it manages to trigger bisR transcription, as our model simulations further attested.
The BisR amino acid sequence revealed only very weak homology to known functional domains, thus making it the prototype of a new family of transcriptional regulators. In contrast to TciR, BisR was a very potent activator of its target, the alpA promoter. Model simulations suggested that BisR triggers and transmits the response in a scalable manner to the bistability generator, encoded by the genes downstream of PalpA. Triggering of PalpA stimulated expression of (among others) two
consecutive genes bisD and bisC, which code for subunits of an activator complex that weakly resembles the known regulator of flagellar synthesis FlhDC (Claret and Hughes, 2000;Liu and Mat-sumura, 1994). BisDC production was sufficient to activate the previously characterized bistable ICEclc promoters Pintand PinR, making it the key regulator for the ‘downstream’ branch (Figure 1—
figure supplement 1). Importantly, BisDC was also part of a feedback mechanism activating tran-scription from PalpA, and therefore, regulates its own production. Simulations and experimental data
indicated that the feedback loop acts as a scalable analog-to-digital converter, transforming any
positive input received from BisR into a dedicated cell that can regenerate sufficiently high BisDC
levels to activate the complete downstream transfer competence pathway.
Bistable gene network architectures are characterized by the fact that expression variation is not resulting in a single mean phenotype, but can lead to two (or more) stable phenotypes - mostly resulting in individual cells displaying either one or the other phenotype (Ferrell, 2012; Fer-rell, 2002;Dubnau and Losick, 2006). Importantly, such bistable states are an epigenetic result of the network functioning and do not involve modifications or mutations on the DNA (Kussell and Lei-bler, 2005;Bala´zsi et al., 2011). Bistable phenotypes may endure for a particular time in individual cells and their offspring, or erode over time as a result of cell division or other mechanism, after which the ground state of the network reappears. One can thus distinguish different steps in a bista-ble network: (i) the bistability switch that is at the origin of producing the different states, (ii) a
prop-agation or maintenance mechanism and (iii) a degradation mechanism [11].
Some of the most well characterized bistable processes in bacteria include competence formation and sporulation in Bacillus subtilis (Dubnau and Losick, 2006). Differentiation of vegetative cells into spores only takes place when nutrients become scarce or environmental conditions deteriorate (Veening et al., 2008;Veening et al., 2006). Sporulation is controlled by a set of feedback loops and protein phosphorylations, which culminate in levels of the key regulator SpoOA ~P being high enough to activate the sporulation genes (Dubnau and Losick, 2006). In contrast, bistable tence formation in B. subtilis is generated by feedback transcription control from the major compe-tence regulator ComK. Stochastic variations among ComK levels in individual cells, ComK degradation and inhibition by ComS, and noise at the comK promoter determine the onset of comK transcription, which then reinforces itself because of the feedback mechanism (Su¨el et al., 2006;
Maamar et al., 2007). Initiation and maintenance of the ICEclc transfer competence pathway thus resembles DNA transformation competence in B. subtilis in its architecture of an auto-feedback loop (BisDC vs ComK). However, the switches leading to bistability are different, with ICEclc depending on a hierarchy of transcription factors (MfsR, TciR and BisR), and transformation competence being a balance of ComK degradation and inhibition of such degradation (Su¨el et al., 2006;Maamar et al., 2007). ICEclc bistability architecture is clearly different from the well-known double negative feed-back control exerted by, for example the phage lambda lysogeny/lytic phase decision in E. coli (Arkin et al., 1998;Bednarz et al., 2014). That switch entails essentially a balance of the counteract-ing transcription factors CI, CII and Cro (Arkin et al., 1998;Bednarz et al., 2014). Interestingly, other ICEs of the SXT/R391 family carry this typical double negative feedback loop architecture,
which may therefore control their (bistable) activation (Poulin-Laprade and Burrus, 2015;
Bellanger et al., 2008;Beaber and Waldor, 2004;Poulin-Laprade et al., 2015). Given the low fre-quencies of conjugative transfer of many different elements (Delavat et al., 2017), bistability activa-tion mechanisms may be much more widespread than assumed.
Mathematically speaking, the ICEclc transfer competence regulatory architecture has two states, one of which is zero (inactive) and the other with a positive value (activation of transfer competence). Stochastic modelling suggested that the feedback loop maintains positive output during a longer time period than in its absence (although it will drop to zero at infinite time). Previous experimental data suggested that the tc cells indeed do not return to a silent ICEclc state, but become irreparably damaged, arrest their division (Takano et al., 2019) and wither (Reinhard et al., 2013). However, because their number is proportionally low, there is no fitness cost on the population carrying the ICE (Delavat et al., 2016; Gaillard et al., 2008). The advantage of prolonged feedback output seems that constant levels of the BisCD regulator can be maintained, allowing coordinated and organized production of the components necessary for the ICEclc transfer itself. This would consist of, for example, the relaxosome complex responsible for DNA processing at the origin(s) of transfer, and the mating pore formation complex (Carraro and Burrus, 2015). Because Pseudomonas cells activate ICEclc transfer competence upon entry in stationary phase, the feedback loop may have a critical role to ensure faithful completion of the transfer competence pathway during this period of limiting nutrients, and to allow the ICE to excise and transfer from tc cells once new nutrients become available (Delavat et al., 2016).
Although our results were conclusive on the roles of the key regulatory factors (MfsR, TciR, BisR, BisDC), there may be further auxiliary and modulary factors, and environmental cues that influence the transfer competence network. For example, we previously found that deletions in the gene inrR drastically decreased ICEclc transfer capability by 45–fold and reduced reporter gene expression from Pint(Minoia et al., 2008). Expression of InrR alone, however, did not show any direct activation
of Pint, PinRor PalpA, and InrR is thus unlikely to be a direct transcription activator protein. Our results
also indicated that induction of AlpA may repress output from the PalpApromoter, and modulate the
feedback loop that is initiated by BisR and maintained by BisDC. Furthermore, although induction of
bisDC was sufficient to activate expression from PalpA, it was enhanced through an as yet
uncharac-terized mechanism involving its upstream regions. Previous results also highlighted the implication of the stationary phase sigma factor RpoS for PinR activation (Figure 1B; Miyazaki et al., 2012),
which may be more generally important for other ICEclc regulatory promoters as well. Unraveling these details in future work will be important for a full understanding of the generation and mainte-nance of bistability of the ICEclc family of elements, and its role in effective horizontal dissemination. Phylogenetic analyses showed the different ICEclc regulatory loci (i.e., bisR-alpA-bisDC-inrR) to be widely conserved in Beta- and Gammaproteobacteria, with only few small variations in regulatory gene configurations. Most likely, these regions are part of ICEclc-like elements in these organisms, several of which have been detected previously (Miyazaki et al., 2015; Miyazaki, 2011a;
Gaillard et al., 2006). They are further part of PAGI-2 (Klockgether et al., 2007) and PAGI-16 family genomic islands in P. aeruginosa clinical isolates (Hong et al., 2016) that have been implicated in the distribution of virulence factors and antibiotic resistance elements. The ICEclc regulatory cascade for transfer competence thus seems widely conserved, controlling horizontal dissemination of this important class of bacterial conjugative elements.
Materials and methods
Key resources table
Reagent type (species)
or resource Designation Source or reference Identifiers Additional information
Gene (Pseudomonas knackmussii ICEclc)
ICEclc PMID:16484212 GenBank:
AJ617740.2
Full
ICEclc sequence Continued on next page
Continued Reagent type (species)
or resource Designation Source or reference Identifiers Additional information
Gene (Pseudomonas knackmussii ICEclc)
tciR PMID:24945944 GenBank:
CAE92867.2 Transcriptional regulator of ICEclc Gene (Pseudomonas knackmussii ICEclc)
bisR; orf101284 this paper GenBank:
CAE92957.1 Transcriptional regulator of ICEclc Gene (Pseudomonas knackmussii ICEclc)
bisD; parB; orf98147 this paper GenBank:
CAE92953.1
Subunit D of the transcriptional regulator complex BisCD of ICEclc Gene
(Pseudomonas knackmussii ICEclc)
bisC; orf97571 this paper GenBank:
CAE92952.1
Subunit C of the transcriptional regulator complex BisCD of ICEclc Gene
(plasmid pZS2FUNR)
echerry PMID:19098098 Red fluorescent protein
gene used for the miniTn7:Ptac-echerry reporter
Strain, strain background
(Pseudomonas putida)
UWC1 PMID:2604401 NCBI:
txid1407054
Background strain for ICEclc transfer and mutagenesis experiments Strain, strain
background
(Pseudomonas putida)
2737 PMID:21255116 UWC1 carrying ICEclc
in tRNAGly Strain, strain
background
(Pseudomonas putida)
UWCGC PMID:21255116 Recipient strain used
for conjugation transfer experiments Strain, strain
background (Escherichia coli)
DH5alpir PMID:10610816 Cloning strain
Recombinant DNA reagent pME6032; pME (plasmid) PMID:11807065 GenBank: DQ645594.1 Broad-host range cloning vector, lacIq-Ptac expression Recombinant DNA reagent miniTn5 (plasmid; transposon) PMID:21342504 (RRID:Addgene_60487) GenBank: HQ908071.1 Transposon suicide vector for gene reporter constructs Recombinant DNA reagent miniTn7 (plasmid; transposon) PMID:15908923 (RRID:Addgene_63121) GenBank: AY619004.1 Transposon suicide vector for single copy insertions Recombinant DNA reagent miniTn7:Ptac (plasmid; transposon) PMID:15908923 GenBank: AY599234.1
Transposon vector used for miniTn7:Ptac-echerry reporter Recombinant DNA reagent miniTn5:PinR-egfp/Pint-echerry
PMID:19098098 Dual single copy
insertion reporter system for ICEclc bistable activity
Sequence-based reagent
DNA fragment containing PalpA, alpA, parA, shi and
the 5’ part of bisD
ThermoFisher Scientific Synthetic DNA fragment Commercial assay or kit
Nucleospin Plasmid Kit Macherey-Nagel Macherey-Nagel: 740588.50
Plasmid purification Commercial
assay or kit
Nucleospin Gel and PCR Clean-up Kit Macherey-Nagel Macherey-Nagel: 740609.50 PCR fragment purification Commercial assay or kit Quick-Fusion Cloning Kit
Bimake Bimake: B22611 Generation of
recombinant vectors Chemical compound, drug IPTG; isopropyl b-D-1-thiogalactopyranoside Sigma-Aldrich Sigma-Aldrich: I5502
Used for induction of Ptacpromoter
Continued Reagent type (species)
or resource Designation Source or reference Identifiers Additional information
Chemical compound, drug 3-CBA; 3-chlorobenzoate (3-chlorobenzoic acid) Sigma-Aldrich Sigma-Aldrich: C24604 Specific carbon source for selection of ICEclc in Pseudomonas Chemical compound, drug Sodium succinate; succinate (Sodium succinate dibasic hexahydrate) Sigma-Aldrich Sigma-Aldrich: 14170
General carbon source for growth
of Pseudomonas
Software, algorithm MEGA7 PMID:27004904 Phylogenetic analysis
Software, algorithm Visiview Visitron
systems GMbH
https://www.visitron.de /products/visiviewr-software.html
Microscopy images acquisition
Software, algorithm ImageJ PMID:22930834 Image processing
Software, algorithm MatLab (v 2016a)
Mathworks Data treatment
Software, algorithm R ggplot Hadley Wickham https://ggplot2
.tidyverse.org/
Data visualization Software, algorithm Julia; Differential
Equations.jl package
DOI:http://doi.org/ 10.5334/jors.151
Mathematical model
Other Minimum media; MM
(culture media)
PMCID:PMC494262 Supplementary file 2 Carbon source-free base for
minimal media
Other Bio-Rad Gene
Pulser Xcell
Biorad Biorad: 165–2660 Device used for
electro-transformation of bacterial strains Other Zeiss Axioplan II microscope
(Carl Zeiss); EC ‘Plan-Neofluar’ 100x/1.3 Oil Pol Ph3 M27 objective lens (Carl Zeiss); SOLA SE light engine (Lumencor); SPOT Xplorer slow-can charge coupled device camera 1.4 Megapixels monochrome w/o IR
(Diagnostic Instruments)
Carl Zeiss; Lumencor; Diagnostic instruments
Carl Zeiss: Axioplan II; Carl Zeiss: 420491-9910-000; Lumencor: SOLA 6-LCR-SC; Diagnostic instrument: XP2400
Microscope for single cell phase contrast and epifluorescence imaging Other 0.2–mm cellulose acetate filters Sartorius Sartorius: 11107–25 N filters for conjugative transfer
Strains and growth conditions
Bacterial strains and plasmid constructions used in this study are shortly described inTable 1 and with more detail inSupplementary file 1. Strains were routinely grown in Luria broth (10 g l–1 Tryp-tone, 10 g l–1NaCl and 5 g l–1Yeast extract, LB Miller, Sigma Aldrich) at 30˚C for P. putida and 37˚C for E. coli in an orbital shaker incubator, and were preserved at –80˚C in LB broth containing 15% (v/
v) glycerol. Reporter assays and transfer experiments were carried out with cells grown in type 21C
minimal media (MM, Supplementary file 2;Gerhardt, 1981) supplemented with 10 mM sodium succinate or 5 mM 3-chlorobenzoate (3-CBA). Antibiotics were used at the following concentrations: ampicillin (Ap), 100 mg ml–1for E. coli and 500 mg ml–1for P. putida; gentamicin (Gm), 10 mg ml–1for
E. coli, 20 mg ml–1for P. putida; kanamycin (Kn), 50 mg ml–1; tetracycline (Tc), 12 mg ml–1for E. coli,
100 mg ml–1or 12.5 mg ml–1for P. putida grown in LB or MM, respectively. Genes were induced
from Ptacby supplementing cultures with 0.05 mM isopropyl b-D-1-thiogalactopyranoside (IPTG; or
else at the indicated concentrations).
Molecular biology methods
Plasmid DNA was purified using the Nucleospin Plasmid kit (Macherey-Nagel) according to manufac-turer’s instructions. All enzymes used in this study were purchased from New England Biolabs. PCR
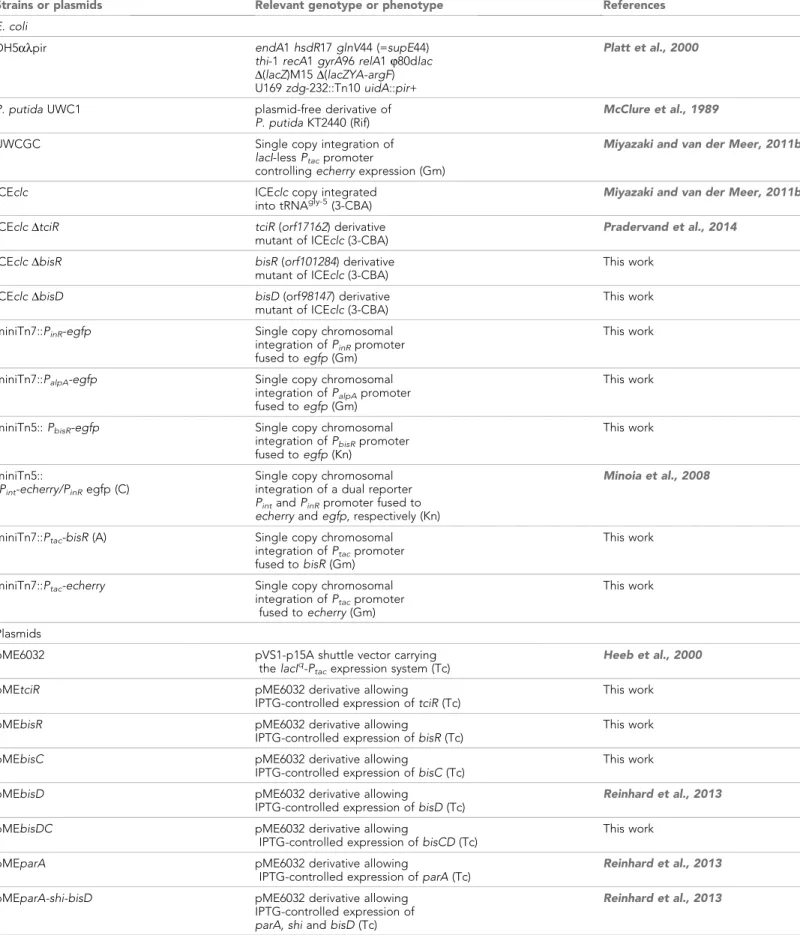
Table 1. Strains and plasmids used in this study.
Strains or plasmids Relevant genotype or phenotype References
E. coli
DH5alpir endA1 hsdR17 glnV44 (=supE44)
thi-1 recA1 gyrA96 relA1 j80dlac D(lacZ)M15 D(lacZYA-argF) U169 zdg-232::Tn10 uidA::pir+
Platt et al., 2000
P. putida UWC1 plasmid-free derivative of P. putida KT2440 (Rif)
McClure et al., 1989
UWCGC Single copy integration of
lacI-less Ptacpromoter
controlling echerry expression (Gm)
Miyazaki and van der Meer, 2011b
ICEclc ICEclc copy integrated
into tRNAgly-5(3-CBA) Miyazaki and van der Meer, 2011b
ICEclc DtciR tciR (orf17162) derivative
mutant of ICEclc (3-CBA)
Pradervand et al., 2014
ICEclc DbisR bisR (orf101284) derivative
mutant of ICEclc (3-CBA)
This work
ICEclc DbisD bisD (orf98147) derivative
mutant of ICEclc (3-CBA)
This work miniTn7::PinR-egfp Single copy chromosomal
integration of PinRpromoter
fused to egfp (Gm)
This work
miniTn7::PalpA-egfp Single copy chromosomal
integration of PalpApromoter
fused to egfp (Gm)
This work
miniTn5:: PbisR-egfp Single copy chromosomal
integration of PbisRpromoter
fused to egfp (Kn)
This work
miniTn5::
Pint-echerry/PinRegfp (C)
Single copy chromosomal integration of a dual reporter Pintand PinRpromoter fused to
echerry and egfp, respectively (Kn)
Minoia et al., 2008
miniTn7::Ptac-bisR (A) Single copy chromosomal
integration of Ptacpromoter
fused to bisR (Gm)
This work
miniTn7::Ptac-echerry Single copy chromosomal
integration of Ptacpromoter
fused to echerry (Gm)
This work
Plasmids
pME6032 pVS1-p15A shuttle vector carrying
the lacIq-P
tacexpression system (Tc)
Heeb et al., 2000
pMEtciR pME6032 derivative allowing
IPTG-controlled expression of tciR (Tc)
This work
pMEbisR pME6032 derivative allowing
IPTG-controlled expression of bisR (Tc)
This work
pMEbisC pME6032 derivative allowing
IPTG-controlled expression of bisC (Tc)
This work
pMEbisD pME6032 derivative allowing
IPTG-controlled expression of bisD (Tc)
Reinhard et al., 2013
pMEbisDC pME6032 derivative allowing
IPTG-controlled expression of bisCD (Tc)
This work
pMEparA pME6032 derivative allowing
IPTG-controlled expression of parA (Tc)
Reinhard et al., 2013 pMEparA-shi-bisD pME6032 derivative allowing
IPTG-controlled expression of parA, shi and bisD (Tc)
Reinhard et al., 2013
reactions were carried out with primers described inSupplementary file 3. PCR products were puri-fied using Nucleospin Gel and PCR Clean-up kits (Macherey-Nagel) according to manufacturer’s instructions. E. coli and P. putida were transformed by electroporation as described by
Dower et al., 1988. in a Bio-Rad GenePulser Xcell apparatus set at 25 mF, 200 V and 2.5 kV for E.
coli and 2.2 kV for P. putida using 2 mm gap electroporation cuvettes (Cellprojects). All constructs
were verified by DNA sequencing (Eurofins).
Cloning of regulatory pathway elements
Different ICEclc gene configurations were cloned in P. putida with or without ICEclc, and further with different promoter-reporter fusions, using the broad host-range vector pME6032, allowing IPTG-controlled expression from the LacIq-Ptacpromoter (Koch et al., 2001;Table 1). Genes tciR,
bisR, bisC, bisDC, bisC+96323, alpA and inrR were amplified using primer pairs as specified in
Supplementary file 3, with genomic DNA of P. putida UWC1-ICEclc as template. Amplicons were digested by EcoRI and cloned into EcoRI-digested pME6032 using T4 DNA ligase, producing after transformation the plasmids listed in Table 1. The 6.4 kb ICEclc left-end fragment encompassing
parA-inrR was recovered from pTCB177 (Sentchilo et al., 2003) and cloned into pME6032 (produc-ing pMEregDalpA, Supplementary file 1). An alpA-parA-shi-bisD’ fragment was amplified by PCR (Supplementary file 2) and cloned into pME6032 using EcoRI restriction sites (Supplementary file 1). The resulting plasmid was digested with SalI and the 4.8 kb fragment containing the Ptac
pro-moter, alpA-parA-shi-bisD’ was recovered and used to replace the parA-shi-parB part of
pMEr-egDalpA. This generated a cloned fragment encompassing alpA all the way to inrR (pMEreg,
Supplementary file 1). Further 3’ deletions removing orf96323-inrR or bisC-inrR were generated by Table 1 continued
Strains or plasmids Relevant genotype or phenotype References
pMEbisC96 pME6032 derivative allowing
IPTG-controlled expression of bisC and 96323 (Tc)
This work
pMEalpA pME6032 derivative allowing
IPTG-controlled expression of alpA (Tc)
This work
pMEinrR pME6032 derivative allowing
IPTG-controlled expression of inrR (Tc)
This work
pMEreg pME6032 derivative allowing
IPTG-controlled expression of the alpA-inrR loci (Tc)
This work
pMEregDalpA pME6032 derivative allowing
IPTG-controlled expression of the parA-inrR loci (Tc)
This work
pMEregDalpADP pMEregDalpA derivative lacking
3’ half of 96323, 95213 and inrR (Tc)
This work
pMEregDalpADA pMEregDalpA derivative lacking
the bisC, 96323, 95213 and inrR (Tc)
This work
pMEregDP pMEreg derivative lacking 3’ half
of 96323, 95213 and inrR (Tc)
This work
pMEregDA pMEreg derivative lacking
the bisC, 96323, 95213 and inrR (Tc)
This work
pMEbg lacIq-P
tac-less pME6032
derivative carrying the PalpA-inrR loci (Tc)
This work pMEbg_short
(comp B)
pMEbg derivative lacking 96323, 95213 and inrR (Tc)
This work
pUX-BF13 helper plasmid for
integration of Tn7 (Ap)
Heeb et al., 2000 3-chlorobenzoate (3-CBA); Ampicillin (Ap); gentamycin (Gm); kanamycin (Kn); rifampicin (Rf); tetracycline (Tc).
(A), (B) and (C) refer to components of the reconstituted bistability generator. For strain numbers, see Supplementary file 1.