HAL Id: hal-01000849
https://hal.archives-ouvertes.fr/hal-01000849
Submitted on 4 Jun 2014
HAL is a multi-disciplinary open access archive for the deposit and dissemination of sci-entific research documents, whether they are pub-lished or not. The documents may come from teaching and research institutions in France or abroad, or from public or private research centers.
L’archive ouverte pluridisciplinaire HAL, est destinée au dépôt et à la diffusion de documents scientifiques de niveau recherche, publiés ou non, émanant des établissements d’enseignement et de recherche français ou étrangers, des laboratoires publics ou privés.
agriculture and livestock
C. C. Cerri, S. M. F. Maia, M. V. Galdos, C. E. P. Cerri, B. J. Feigl, Martial
Bernoux
To cite this version:
C. C. Cerri, S. M. F. Maia, M. V. Galdos, C. E. P. Cerri, B. J. Feigl, et al.. Brazilian greenhouse gas emissions: the importance of agriculture and livestock. Scientia Agricola, Escola Superior de Agricultura, 2009, 66 (6), pp.831-843. �10.1590/S0103-90162009000600017�. �hal-01000849�
Review
BRAZILIAN GREENHOUSE GAS EMISSIONS:
THE IMPORTANCE OF AGRICULTURE AND LIVESTOCK
Carlos Clemente Cerri1; Stoecio Malta Ferreira Maia2; Marcelo Valadares Galdos2; CarlosEduardo Pellegrino Cerri3*; Brigitte Josefine Feigl1; Martial Bernoux4
1
USP/CENA - Lab. de Biogeoquímica Ambiental, Av. Centenário, 303 - 13400-970 - Piracicaba, SP - Brasil.
2
USP/ESALQ - Programa de Pós-Graduação em Solos e Nutrição de Plantas.
3
USP/ESALQ - Depto. de Ciência do Solo, Av. Pádua Dias, 11 - 13418-900 - Piracicaba, SP - Brasil.
4
Institut de Recherche pour le Développement - IRD, UMR Eco&Sols “Functional Ecology & Soil Biogeochemistry” (INRA-IRD-SupAgro), Bat. 12, 2 Place Viala, 34060 - Montpellier Cedex 1 - France. *Corresponding author <cepcerri@esalq.usp.br>
ABSTRACT: Data from the 1990-1994 period presented in the “Brazil’s Initial National Communication” document indicated that the country is one of the top world greenhouse gas (GHG) emitters. A large majority of Brazil’s GHG emissions come from deforestation mainly of the Amazon biome for agriculture and livestock land uses. This unique inventory is now out of date. Thus, the aims of this review were (i) to update estimates of the GHG emissions for the Brazilian territory, (ii) to estimate the sinks to provide calculations of the GHG net emissions for the 1990-2005 period, (iii) to calculate the actual and estimate shares of agricultural and livestock activities, and (iv) to discuss in light of the new figures and patterns the best mitigation options for Brazil. Total emissions in CO2-eq increased by 17% during the 1994-2005 period. CO2 represented 72.3% of the total, i.e. a small decrease, in favour of non-CO2 GHG, in relation to 1994 when its share was 74.1%. The increase of all GHG excluding Land Use Change and Forestry (LUCF) was 41.3% over the period 19942005. Climate Analysis Indicators Tool (CAIT) -World Resources Institute (WRI) estimated a higher increase (48.9%) that classified Brazil at the 69th position. Using our estimates Brazil will fall to the 78th position. But in both cases Brazil increased in clearly lower values than the tendency calculated for China and India, two major emitters, with increases of 88.8% and 62.1%, respectively. Brazil’s increase is less than those presented for some countries in Annex 1 that are submitted to a quota of reduction, e.g. Spain with 55.6% of increase and New Zealand with 45.8%. Brazil also is below the average increase shown by non-Annex I countries, estimated to be 61.3%, but above the world average (28.1%). Besides the effort to curb emissions from the energy and deforestation sectors, it is now a top priority to implement a national program to promote mitigation efforts concerning the agricultural and livestock sectors. These mitigation options should not be only focused on emission reductions, but also prone enhancement of the carbon sink. Such a program would be easy to be implemented, because several mitigation strategies have already proven to be efficient, simple to adopt and economically viable.
Key words: CO2-equivalent (CO2-eq), soil, inventory, land use change and forestry
EMISSÕES DE GASES DO EFEITO ESTUFA DO BRASIL:
IMPORTÂNCIA DA AGRICULTURA E PASTAGEM
RESUMO: Os resultados referentes ao período de 1990-1994 apresentados na Comunicação Nacional brasileira indicam que o país é um dos maiores emissores de gases do efeito estufa (GEE) do mundo. O documento também estabelece que a maior parte da emissão de GEE advém do desmatamento, principalmente do bioma Amazônia, para dar lugar á agricultura e pecuária. Este único inventário está agora ultrapassado. Os objetivos desta revisão foram: (i) atualizar a estimativa da emissão de GEE para o território brasileiro; (ii) estimar a possível fixação de C que permita calcular a emissão líquida de GEE para o período de 1990-2005; (iii) calcular a contribuição efetiva e compartilhada das atividades agrícolas e pecuárias; e (iv) discutir sob a luz dos novos conhecimentos as melhores opções de mitigação para o Brasil. A emissão total de GEE em equivalente em CO2 aumentou em 17% durante o período de 1994-2005. O CO2 foi responsável por 72,3% do total, ou seja, houve uma pequena diminuição em relação aos outros GEE, uma vez que em 1994 sua participação foi de 74,1%. O aumento de todas as fontes dos GEE, excluída mudança do uso da terra e reflorestamento, foi de 41,3% durante o período
de 1994-2005. Climate Analysis Indicators Tool (CAIT) - World Resources Institute (WRI) estimaram um crescimento maior (48,9%), que classifica o Brasil na 69a
posição no ranking mundial de emissores. Utilizando as estimativas deste estudo, o Brasil ocuparia a 78a
posição. Em ambos os casos, porém, o Brasil claramente aumentou suas emissões num ritmo menor do que os que foram calculados para a China e Índia, dois dos maiores emissores, com aumentos de respectivamente 88,8 e 62,1%. O Brasil reduziu suas emissões em taxa maior do que alguns países do Anexo I, sujeitos a uma quota de redução. É o caso da Espanha e a Nova Zelândia que aumentaram em 55,6% e 45,8% suas emissões. O Brasil também está abaixo da média de aumento apresentado pelos países que não são do Anexo I, o qual foi estimado em 61,3%. No entanto, está acima da média global que foi de 28,1%. Além de trabalhar pela redução das emissões dos setores de energia e desmatamento, o Brasil deve agora ter como meta prioritária a implantação de um programa nacional de incentivo ás mitigações nos setores agrícola e pecuário. Tais opções de mitigação não deverão se concentrar somente na redução das emissões, mas também favorecer a fixação de carbono. Tal programa seria de fácil implementação, pois diversas estratégias de mitigação já provaram ser eficientes, fáceis de adotar e economicamente viáveis. Palavras-chave: equivalente em CO2 (CO2-eq), solo, inventário, mudança do uso da terra e reflorestamento
INTRODUCTION
The Land Use, Land-Use Change and Forestry (LULUCF) is a key sector of Climate Change, being at the same time responsible for an important amount of greenhouse gases (GHGs) released but also repre-senting an important role and potential in climate change mitigation (Cerri et al., 2004). The agricultural sector alone (i.e. Land Use) is responsible for about 14% of the total global anthropogenic GHGs emissions and is expected to have high emission growth rates, driven mainly by population and income increases. De-forestation is responsible for an additional 17%, set-ting the total contribution of the LULUCF sector to nearly one third of the current total global emissions (IPCC, 2007).
Brazil is one of the top world greenhouse gas (GHG) emitters, and a large majority of Brazil’s GHG emissions, which contribute to global warming, comes from burn-ing linked to deforestation of the Amazon biome, and not from fossil fuels which are the main culprit in most countries (Cerri et al., 2007). Brazil suffered and still regularly suffers pressure to curb destruction of the Amazon rainforest. The latest official Brazilian data on GHG emissions and sinks were published in 2004 in the report entitled “Brazil’s Initial National Communication to the United Nation Framework Convention on Climate Change” (Brazil, 2004). The second part of this report included the first GHG inventory but comprehended only the period from 1990 to 1994. This report showed that the sub-sector “Forest conversion” (known as the Land-Use Change and Forestry LUCF sector) from the bulk LULUCF Sector was the main contributor in 1994, representing 55% of the total GHG sources, which totalised 1728 Mt CO2-eq (CO2 equivalent), and nearly 82% of the sole emissions of CO2. This last percentage is reduced to 75% when considering the net result, which includes a CO2 sink of 251 Mt.
The agricultural sector is now facing a crossroad of issues linked to food security, rural livelihoods, en-vironmental sustainability, bio-energy, climate change adaptation and mitigation, in a context of important and difficult negotiations for a future regime for LULUCF under the United Nation Framework Convention on Climate Change in a post-2012 international agreement. According to the Climate Analysis Indicators Tool (CAIT) from the World Resources Institute (WRI, 2009), Brazil ranked 69th for the year 2009 with total GHG emissions of 1005 Mt CO2-eq, including CH4 and N2O emissions, but excluding LUCF (deforestation). No recent data are provided for the LULUCF sector in Brazil. In the last ten years LULUCF activities in Bra-zil underwent important changes, therefore in this new context where the agricultural sector is more than ever central in the international agenda of negotiations, it is important to identify the actual share of GHG emis-sions and potential sinks.
The main focus of the majority of the National In-ventories is on GHG emissions. However, in Brazil we do include sinks in our net GHG emissions. The sinks are mainly due to carbon fixation in soils and phytomass resulting from advanced agricultural man-agement practices, reforestation and land abandon-ment.
Thus, the objectives of this review are (i) to up-date estimates of the GHG emissions for the Brazilian territory, (ii) to estimate the sinks to provide calcula-tions of the GHG net emissions for the 1990-2005 pe-riod, (iii) to calculate the actual and estimated share of agriculture and livestock activities, and (iv) to dis-cuss the best mitigation options for Brazil in light of the new figures and patterns.
Brazil’s Initial National Communication
Data for 1990-1994 period, i.e. the period covered by the “Brazil’s Initial National Communication” (BINC)
document, were calculated following, in broad lines, the format and the IPCC methodologies of the National Communications. In most cases the methodology em-ployed followed the approach proposed by the Revised 1996 Guidelines for National Greenhouse Gas inven-tories (IPCC, 1997).
The estimates were made separately for the five main sectors (Energy, Industry, Agriculture and Live-stock, LUCF and Waste treatment) by specialists of each area that produced background reports (all the reports are available at http://www.mct.gov.br/ index.php/content/view/20233.html). In total 15 reports were elaborated, of which five were related to the Ag-riculture and Livestock sector and four additional the LUCF sectors. Each report provides in detail the data used, and the steps followed in the calculation, thus enabling the possibility to update the results with the same methodology. Both the methodology and results were submitted to a peer-review process and in most cases they were published in scientific journals. For in-stance the report that covered the emissions and remov-als of CO2 by soils from land use change and liming were published in three articles (Bernoux et al., 2001, 2002 and 2003) and as a background report entitled “Emissions and removals of carbon dioxide by soils from land use change and liming”, part of the Brazil’s Initial National Communication (Cerri et al., 2002).
Calculation procedures for recent and forecasted GHG emission
Actual and recent data and forecast values (from 2005 to 2020) were obtained from two main interna-tionally recognized sources:
• Climate Analysis Indicators Tool (CAIT) from the World Resources Institute (WRI, 2009), available on line at http://cait.wri.org.
• Emission Databases for Global Atmospheric Research (EDGAR) from the Netherlands Environmental Assess-ment Agency (http://www.mnp.nl/edgar/model/).
Specifically for Brazil, data of the CAIT from WRI were derived from individual sectors. For the CO2 emission, fossil fuel emissions for the period 1971-2005 were obtained from IEA (2007). The emissions from cement manufacture and gas flaring were in-cluded for the year 1980 and subsequent years. CO2 emissions for the period 1950-2000 were calculated from Houghton (2003). Finally CH4 and N2O emissions each five years for the period 1990-2005 were esti-mated using EPA (2006).
Concerning the EDGAR database, two principal databases were used. Data for the years 1990 and 1995 where derived from the EDGAR 3.2 database (Olivier
et al., 2002) that provides global annual emissions per country of Kyoto Protocol greenhouse gases CO2, CH4, N2O, and F-gases (HFCs, PFCs and SF6). Data for the year 2000 were obtained from the EDGAR 3.2 Fast Track 2000 dataset that incorporated updated values from EDGAR 3.2. Most data in EDGAR derived from IEA, FAO and UN databases.
Emissions for the LULUCF sectors were calculated and updated for the years 2000 and 2005 using the same methodologies described in the background re-ports of the BINC. Details of the methodologies are provided in each report, but they are all based on steps proposed by the Revised 1996 Guidelines for National Greenhouse Gas inventories (IPCC, 1997). The esti-mates of GHG emissions associated with the LULUCF sector were updated for the 2000-2005 period accord-ing to data availability. The LULUCF sector was sub-divided into the following two broad sub-sectors: Land-use change and Forestry, and Agriculture. The former represented the GHG emissions and removals due to deforestation of the native vegetation, changes in forest and other woody biomass stocks, abandon-ment of managed areas, and from soils. The agricul-ture sub-sector represented the emissions of GHG from the enteric fermentation, manure management, rice cultivation, field burning of agricultural residues, and agricultural soils. Agricultural soils include the emissions produced by the use of synthetic N fertiliz-ers; organic N applied as fertilizer (e.g., animal ma-nure, compost, sewage sludge, rendering waste); urine and dung deposited on pasture, range and paddock by grazing animals; crop residues, including from N-fix-ing crops. The GHG emissions from the agriculture sub-sector were estimated based on the procedures and parameters adopted in the Brazil’s Initial National Com-munication.
GHG emissions estimates associated with the For-est sub-sector for the 1990-1994 period were derived from the use of remote sensing, which covered for this period the land cover situation in the main Brazil-ian biomes (Amazônia, Cerrado, Mata Atlântica, Caatinga, and Pantanal). However, only the Amazônia and Mata Atlântica biomes have a regular and consis-tent land cover monitoring system (remote sensing), that allows estimating the annual deforestation rates. In the case of Amazônia, monitoring has been con-ducted by the National Institute for Space Research (INPE), while that for Mata Atlântica it has been con-ducted by “SOS Mata Atlântica” in association with INPE through the Atlantic Forest Remaining Atlas. Thus, for these two biomes, the GHG emissions dur-ing the 2000-2005 time period were estimated usdur-ing a direct ratio between the emission and deforested area
in 1994. For example, during the period of 1990-1994 there was an annual gross emission of 43.3 Tg CO2 from a deforested area of 65714 ha of Mata Atlântica, so, we extrapolated this ratio for the period of 2000-2005, and the same idea was used for the Amazônia data.
For the other biomes (Cerrado, Caatinga and Pantanal) it was necessary to use specific assumptions to calculate the GHG emissions for 2000-2005. First, for the Cerrado biome we assumed an annual defor-estation rate of 0.67% provided by an International Conservancy report (Machado et al., 2004), which was obtained from remote sensing information as well as literature review. The deforested area in the Caatinga was estimated based on the average agricultural ex-pansion (cropland and pasture) during the period of 1996-2006 (IBGE, 2008) in the Brazilian states located in this biome. In the case of the Pantanal biome, ow-ing to the lack of updated information about the rates of deforestation, we used the same rate as for the 1990-1994 period.
The CO2 emissions from soils were estimated ac-cording to the approach proposed by the Revised 1996 Guidelines for National Greenhouse Gas Inventories (IPCC, 1997) and adapted by Bernoux et al. (2001). The estimate was based on the variations in soil C stocks due to the land-use changes for the time pe-riod of 1985-2005, assuming a linear change in C stor-age. The 20-year period, the soil depth (0-30 cm) and the units of measurement (Mha for land areas and Mg C ha–1 for soil C) suggested by the IPCC were used in the present study. The calculation was performed by state and more details about the parameters adopted and procedures can be found in Bernoux et al. (2001). CO2 emissions due to the organic soils cultivation were also included, using the same methodology used in the Brazil’s Initial National Communication, assuming as organic soils the lowlands cultivated with rice, and adopting the IPCC emission factors (IPCC, 1997).
All results are expressed in CO2 equivalent (CO2 -eq) using the official global warming potential (GWP) considered for the 1st commitment period, i.e. 21 for methane and 310 for nitrous oxide. The latest IPCC assessment report provided revised values (25 for CH4 and 298 for N2O).
Official (1994 baseline) greenhouse gas emission results and comments
The Brazilian National Communication reported that, in 1994, net anthropogenic greenhouse emissions were estimated at 1030 Tg CO2, 13.2 Tg CH4, and 0.55 Tg N2O. Other minor GHG emissions (CF4, C2F6, SF6, HFC-23 and HFC-134a) were also reported but these emissions corresponded to less than 0.7% of the total
emissions in CO2-eq, and thus will not be considered throughout this review. Between 1990 and 1994, total emissions of CO2, CH4 and N2O increased by 5%, 6% and 12%, respectively. This net amount included a sink (only concerning CO2 emission) of 251 Mt CO2 mainly due to Abandonment of Managed Lands (204 Mt CO2 -eq) and secondarily to Changes in Forest and Other Woody Biomass Stocks (47 Mt CO2). Considering only sources, CO2 emissions amounted to a total of 1280.8 Mt CO2, and the corresponding total for all GHG is 1728 Mt CO2-eq. Figure 1 details reparation by sec-tors.
In 1994, CO2 was responsible for 74% of the total amount in CO2-eq, followed by CH4 representing an additional 16%. Nitrous oxide emissions were the less important among these three gases representing circa 10% of the total. An analysis of the main contributors (Table 1) revealed that, as it was already largely re-ported and discussed by the civil society and scien-tists, deforestation of Forest was the first individual contributor, being alone responsible for more than half of the total Brazilian GHG emissions. There were only four contributors higher than 100 Mt CO2-eq (Table 1), and they represented about 90% of the total and covered the three main GHG. However, if sinks due to reforestation and land abandonment are also con-sidered in the calculations, the net emissions for For-est and Grassland Conversion would be 742.4 Mt CO2 -eq, which corresponds to 48.8% of the total emissions. In this case, the relative contribution of Fossil Fuel Combustion, Enteric Fermentation and Agricultural Soil would be 15.8%, 13% and 9.8%, respectively, evidenc-ing the present tendency to reduce the emission from deforestation in relation to the other sectors.
A detailed analysis of each main contributor showed that there was an unequal distribution of the origin of the emissions within each sub-sector. Con-cerning the Fossil Fuel Combustion, the Transporta-tion sub-sector alone led the rank with 39.3%, followed
Figure 1 - Sources of GHG for the year 1994 according to the 1st
by the Industrial sector (31.3%). The Energy sub-sector represented only 12% of the Fossil Fuel Com-bustion.
Enteric Fermentation was the third contributor in CO2-eq, but it is also by far the first contributor for CH4 emission. Among the components, the non-dairy cattle is responsible for 82.2% of total enteric fermen-tation. Agricultural soil sub-sector gather different sources of nitrous oxide emissions, but one is domi-nant, namely “Grazing Animals” which corresponds to direct manure deposition on the field by animals. Graz-ing animals contribution is 46% of the sub-sector, of this 34% is from non-dairy cattle. Other direct N2O emissions for the Agricultural soils sub-sectors are at-tributed to various individual sources, e.g. synthetic fertilizer, animal manure produced off-field, biological fixation, crop residue etc.
CO2 recent emissions excluding Land Use Change and Forestry
WRI and EDGAR reported an increase in CO2 emis-sions (excluding LUCF) for the years 2000 and 2005. WRI estimates are always lower than EDGAR values, but WRI estimates are really closer to values reported by the BINC in 1990, and in 1994/95. MCT (2008) compared results from the IEA calculation, which are used by WRI, and Brazilian calculations made under the responsibility of the Brazilian Ministry of Science using the software “bal-eec” and data from the National En-ergy Balance. Both results from bottom-up and top-down approaches were compared. MCT (2008) showed that differences, by both approaches, are at the maxi-mum 1% for the period 1990-2005. WRI estimates ap-peared therefore more consistent with Brazilian esti-mates. Emissions in 2000 ranged from 328 to 367 Mt CO2-eq, i.e. increase of circa 57% in relation to 1990 levels. Only WRI reported emission for the year 2005, with an increase of 69% in relation to 1990 and a cor-responding amount of 352 Mt CO2-eq (Figure 2). Us-ing these average percentages of increase applied to the 1990 level calculated by the BINC, the projected levels would be 346 and 372 Mt CO2-eq for the years 2000 and 2005, respectively.
CH4 and N2O recent emissions for all sub-sectors
Both estimates from WRI and EDGAR for meth-ane are very similar. The detailed calculation made by the BINC lead to results for the years 1990 and 1994 10.3% lower, compared to WRI estimates. Consider-ing this same correction in percentage, usConsider-ing WRI es-timates as references, the methane emissions in Brazil would have been 327.9 and 349.0 MtCO2-eq for 2000 and 2005, respectively.
The N2O emission values proposed by EDGAR are systematically 20-25% higher than WRI estimates. In order to maintain consistency with the preceding esti-mates, WRI estimates were used as references. BINC values for 1990 and 1994 are about 14.6% lower than WRI numbers. Using this correction leads to estimates for N2O emissions of 199.9 and 219.0 Mt CO2-eq for the years 2000 and 2005, respectively (Figure 2). To-tal estimates for bulk emissions of CO2 excluding LUCF, N2O and CH4 are therefore 873.8 and 940.0 Mt CO2-eq for the years 2000 and 2005.
CO2 recent emissions exclusively from Land Use Change and Forestry
CO2 from LUCF are completely different between WRI, EDGAR and BINC (Table 2). BINC calculated intermediary values between WRI and EDGAR (Table 2). Moreover, there is also no consistency in the trends, WRI showed a regular decrease whereas there is a sharp increase in 2000 for EDGAR. Also the meth-odologies used are not detailed, mainly for EDGAR. Thus, no global values can be estimated for this
sec-r o t c e s b u S Sector n o i s s i m E s a G e s u o h n e e r G d e t a i c o s s A G H G n i a M MtCO2-eq % oftotal n o i s r e v n o C d n a l s s a r G d n a t s e r o F LUCF CO2 993.5 56.3 n o i t s u b m o C l e u F li s s o F Energy CO2 240.4 13.6 n o i t a t n e m r e F c i r e t n E Agricutlure CH4 196.9 11.3 s li o S l a r u tl u c i r g A Agricutlure N2O 147.6 8.4 s r e h t O Allsectors - 191.3 10.4
Table 1 - Top sub-sector emission contributors for the year 1994.
a t a d f o e c r u o S 1990 1995 2000 O C t M -- 2--- -I R W 1956 1507 1372 R A G D E 456.3 359.6 759.9 C N I B 993 1027.5
Table 2 - Available estimates for CO2 emissions from Land Use Change and Forestry sector
WRI: World Resource Institute; EDGAR: Emission Databases for Global Atmospheric Research; BINC: Brazil’s Initial National Communication
Figure 2 - Bulk estimates for emissions of CO2 excluding Land Use Change and Forestry, CH4 and N2O by WRI and EDGAR, compared with Brazilian estimates from BINC (dashed bars) and estimates obtained in this study (diamonds). y r t s e r o f d n a e g n a h c e s u d n a L 1990 1994 2000 2005 -- MtCO2--- -Sources n o i s r e v n o C d n a l s s a r G d n a t s e r o F 882,477 951,873 1003,541 1026,067 s li o S m o r f s l a v o m e R d n a s n o i s s i m E 110,233 75,613 67,912 65,146 l a t o T 992,710 1027,486 1071,453 1091,213 S kin s s k c o t S s s a m o i B y d o o W r e h t O d n a t s e r o F n i s e g n a h C -45,051 -46,885 s d n a L d e g a n a M f o t n e m n o d n a b A -189,378 -204,270 l a t o T -234,429 -251,155 -225,036 -230,194 NetCO2emission(sources-sinks) 758,281 776,331 846,417 861,019
Table 3 - Sources, sinks and net emissions of CO2 in the Land Use Change and Forestry sector in 1990-2005.
Negative values indicate the removal from the atmosphere to the biosphere.
tor using the same preceding approach. Main estimates could be obtained by using updated calculations based on the BINC approach
Updated CO2, N2O and CH4 emission values for Land Use Change Forestry sector
Results obtained performing updates of the
calcu-lation used in the BINC, for each greenhouse gas, are presented in detail by sectors and sub-sectors in Tables 3 and 4. Table 3 presented values from 1990 to 2005 for the CO2 emissions for LUCF. For 2000 and 2005 only the total results of the sink are estimated without distinction of the origin. Results of CO2 emissions from the Land Use Change and Forestry sector (Table 3), including more specifically the emissions from soils and forest and grassland conversion also include the sink from changes in forest and other woody biom-ass stocks and abandonment of managed lands. Con-sidering the gross emission, it was observed that for-est and grassland conversion was responsible for 93.7% and 94% of the CO2 emitted in 2000 and 2005, respectively, while the emissions from soils represented only 6.3% and 6%, respectively. In terms of net emis-sion (i.e. excluding the CO2 removed) our study found that there was a net emission of 846,417 Mt CO2 and 861,019 Mt CO2 in 2000 and 2005, respectively. The data also showed a reduction in the amount of absorbed CO2 (sinks) in 2000 and 2005, mainly when compared with the year 1994. This was essentially due to the substantial decreased in the sink from the Mata Atlântica biome (data not shown).
N2O and CH4 emissions expressed in CO2-eq for Agriculture and LUCF sectors (Table 4), show that the Agriculture sector increased in 21% and 24% the emis-sions of CH4 and N2O for the years 2000 and 2005, respectively. For CH4, the main contributor for this in-crease was the sub-sector Enteric fermentation, which was responsible for more than 93% of the CH4 released in both years. Therefore, it represents the most im-portant source of CH4 to the atmosphere.
In terms of N2O emissions, the sub-sector Agri-cultural soils represented more than 95% of N2O emis-sions for the years 2000 and 2005 (Table 4). The Ag-ricultural soils sub-sector includes direct N2O emission sources such as grazing animals, synthetic fertilizer,
animal manure produced off-field, biological fixation, crop residue etc, and also indirect N2O emission sources that include leaching, runoff, and atmospheric deposition. However, grazing animals is still the main contributor, accounting for about 40% of the sub-sec-tor, similarly of what occurred in the 1990-1994 pe-riod. The CH4 and N2O emissions from the Land Use Change and Forestry sector were also estimated.
Changes between 2000 and 2005 were minimal (Table 4). One possible explanation is that deforestation rates for both years were similar, leading to CH4 and N2O emissions of the same magnitude.
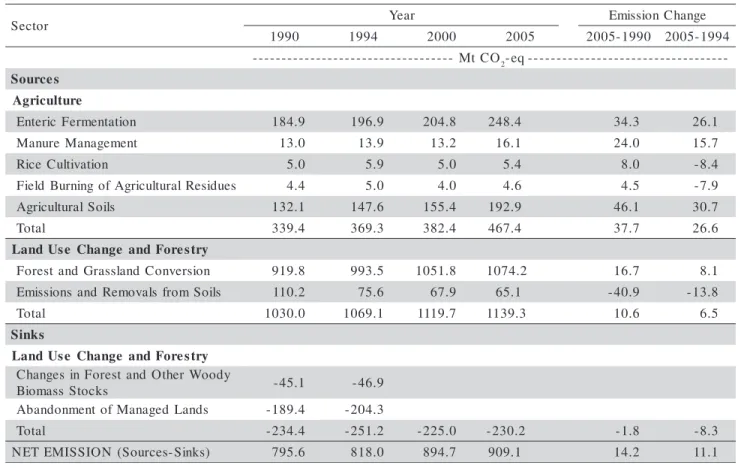
Table 5 presents the total emission in CO2-eq and the evolution for the periods 2005-1990 and 2005-1994 for the Agriculture and Land Use Change and Forestry sectors. Within the Agriculture sector, the enteric
fer-Table 4 - Emissions of N2O and CH4 for the Agriculture and Land Use Change and Forestry sectors for the 1990-2005 period. r o t c e S n o i s s i m E s a G e s u o h n e e r G H C 4 N2O 0 9 9 1 1994 2000 2005 1990 1994 2000 2005 O C t M -- 2-eq--- -e r u t l u c i r g A n o i t a t n e m r e F c i r e t n E 184,947 196,917 204,759 248,399 t n e m e g a n a M e r u n a M 7,098 7,728 7,265 8,854 5,890 6,200 5,955 7,257 n o i t a v i tl u C e c i R 5,040 5,943 5,017 5,445 s e u d i s e R l a r u tl u c i r g A f o g n i n r u B d l e i F 2,541 2,793 2,253 2,585 1,860 2,170 1,733 1,988 s li o S l a r u tl u c i r g A 132,060 147,560 155,400 192,908 l a t o T 199,626 213,381 219,294 265,283 139,810 155,930 163,088 202,154 y r t s e r o F d n a e g n a h C e s U -d n a L l a t o T 33,915 37,905 43,948 43,818 3,410 3,720 4,364 4,351
Table 5 - Emissions from Agriculture and Land Use Change and Forestry, sinks from Land Use Change and Forestry expressed in CO2 equivalent for the period 1990-2005.
Negative values indicate the removal from the atmosphere to the biosphere. o t c e S r Year EmissionChange 0 9 9 1 1994 2000 2005 2005-1990 2005-1994 -- MtCO2-eq--- -s e c r u o S e r u t l u c i r g A n o i t a t n e m r e F c i r e t n E 184.9 196.9 204.8 248.4 34.3 2 16. t n e m e g a n a M e r u n a M 13.0 13.9 13.2 16.1 24.0 15.7 n o i t a v i tl u C e c i R 5.0 5.9 5.0 5.4 8.0 -8.4 s e u d i s e R l a r u tl u c i r g A f o g n i n r u B d l e i F 4.4 5.0 4.0 4.6 4.5 -7.9 s li o S l a r u tl u c i r g A 132.1 147.6 155.4 192.9 46.1 30.7 l a t o T 339.4 369.3 382.4 467.4 37.7 26.6 y r t s e r o F d n a e g n a h C e s U d n a L n o i s r e v n o C d n a l s s a r G d n a t s e r o F 919.8 993.5 1051.8 1074.2 16.7 8.1 s li o S m o r f s l a v o m e R d n a s n o i s s i m E 110.2 75.6 67.9 65.1 -40.9 -13.8 l a t o T 1030.0 1069.1 1119.7 1139.3 10.6 6.5 S kin s y r t s e r o F d n a e g n a h C e s U d n a L y d o o W r e h t O d n a t s e r o F n i s e g n a h C s k c o t S s s a m o i B -45.1 -46.9 s d n a L d e g a n a M f o t n e m n o d n a b A -189.4 -204.3 l a t o T -234.4 -251.2 -225.0 -230.2 -1.8 -8.3 ) s k n i S -s e c r u o S ( N O I S S I M E T E N 795.6 818.0 894.7 909.1 14.2 11.1
mentation and agricultural soils were the most impor-tant CO2-eq sources. They were responsible on aver-age for 53.3% and 41%, respectively, of the total emis-sion, while the other sources accounted for the rest of 5.7% (i.e. these values represent the average for 2000 and 2005). Additionally, the emission in the 1990-2005 period was higher than in 1994-1990-2005. These re-sults are associated exclusively with the increase in the livestock population, which was higher between 1990 and 2005 than 1994 and 2005.
For the Land Use Change and Forestry sector, the most important source was the sub-sector Forest and Grassland conversion as mentioned before. The emis-sions from soils contributed only with 6% to the gross emissions, and moreover, decreased substantially over time, mainly when evaluated for the period 1990-2005 (Table 5). This could be expected if we take into
ac-count that carbon emissions from soils are estimated considering the land use change in a period of 20 years (IPCC, 1997), and that the advance of the Brazilian agricultural frontier was more intense during the 90s.
Comparing the emission changes rates between the gross and net emissions in the LUCF sector (Table 5), we found higher rates in the net emission estimates, which are due to the differences between the sinks, when a reduction occured in the years of 2000 and 2005 comparatively to 1994 and 1990. However, the sink estimates were roughly performed, and future studies must be conducted aiming at improving these estimates.
Updated GHG inventory for Brazil
A tentative proposal is presented in Table 6 for the Brazilian main greenhouse gas (CO2, CH4 and N2O)
r o t c e S s a G e s u o h n e e r G O C 2 CH4 N2O 0 9 9 1 1994 2000 2005 1990 1994 2000 2005 1990 1994 2000 2005 O C t M -- 2-eq --- -y g r e n E n o i t s u b m o C l e u F li s s o F 198.0 231.4 316.2 336.6 7.0 6.2 5.6 7.4 2.5 2.8 3.0 3.0 s n o i s s i m E e v i ti g u F 5.4 5.1 5.0 5.0 2.2 2.3 2.3 2.3 l a t o T 203.4 236.5 321.2 341.6 9.2 8.4 7.9 9.7 2.5 2.8 3.0 3.0 s e s s e c o r P l a i r t s u d n I n o i t c u d o r P t n e m e C 10.2 9.3 19.0 14.2 r e h t O 6.7 7.5 9.0 14.6 l a t o T 16.9 16.9 28.1 28.9 0.1 0.1 0.1 0.1 2.5 4.3 6.0 8.0 e r u t l u c i r g A n o i t a t n e m r e F c i r e t n E 184.9 196.9 204.8 248.4 t n e m e g a n a M e r u n a M 7.1 7.7 7.3 8.9 5.9 6.2 6.0 7.3 n o i t a v i tl u C e c i R 5.0 5.9 5.0 5.4 f o g n i n r u B d l e i F s e u d i s e R l a r u tl u c i r g A 2.5 2.8 2.3 2.6 1.9 2.2 1.7 2.0 s li o S l a r u tl u c i r g A 132.1 147.6 155.4 192.9 l a t o T 199.6 213.4 219.3 265.3 139.8 155.9 163.1 202.2 d n a e g n a h C e s U d n a L y r t s e r o F d n a l s s a r G d n a t s e r o F n o i s r e v n o C 882.5 951.9 1003.5 1026.1 s l a v o m e R d n a s n o i s s i m E s li o S m o r f 110.2 75.6 67.9 65.1 l a t o T 992.7 1027.5 1071.4 1091.2 33.9 37.9 43.9 43.8 3.4 3.7 4.4 4.4 e t s a W l a t o T 15.5 16.9 18.9 20.7 3.7 3.7 3.7 3.7 L A T O T 1213.0 1280.9 1420.7 1461.7 258.3 276.6 290.2 339.5 151.9 170.5 180.2 221.2
Table 6 - Greenhouse gas emissions related to Energy, Industrial Processes, Agriculture, Land Use Change and Forestry and Waste for the 1990-2005 period.
emissions for the 2005-1990 period based on the above results for LUCF, amended with sectors estimated for the other categories (Energy, Industrial Processes and Waste). The most crucial sector to be estimated is the Energy because of the importance of its share. Our estimate is based on the results calculated for the na-tional carbon balance in the energy sector (MCT, 2007). The authors calculated the emission from fos-sil fuel combustion using both bottom-up and top-down approaches for the 1970-2005 period, and also com-pared their results to BINC values. They concluded that their results systematically underestimate the val-ues from the BINC in 5%. Therefore, in our calcula-tions, the estimates for the Energy sector for CO2 and CH4 derived from their proposed values for the year 2000 and 2005 were corrected by this coefficient (5%). For the other emissions of the Energy sector (Fugi-tive emissions, and N2O emissions from fossil fuel combustion) a conservative approach was used con-sidering the level unchanged in relation to 1994.
Cement production is the main contributor of the Industrial Processes. Emissions from this sub-sector were calculated according to the energy inputs in the processes (reported by MCT, 2007). The total emis-sions for the Industrial Processes were estimated in the same manner, and emissions from Other Activi-ties were calculated by difference. N2O and CH4 emis-sions from Cement production were calculated using a linear trend. This last approach was also used in the case of the Waste sector.
Table 6 does not include the CO2 fixation by the phytomass from reforestation and abandoned lands. If these sinks are accounted in the calculations, the net emissions for the Land Use Change and Forestry de-creases by about 26%, from 1189.5 to 936.7 Mt CO2. Then, the total net emission for 2005, adjusted con-sidering the mentioned removals, would be 1231.5 against 1461.7 Mt CO2, which is about 19% lower in relation to only the emission scenario.
Discussion on recent emission trends
Global emissions in CO2-eq increased by 17% dur-ing the 1994-2005 period. CO2 represented 72.3% of the total, i.e. a small decrease, in favour of non-CO2 GHG, in relation to 1994 when its share was 74.1%. The increase of all GHG excluding LUCF was 41.3% over the period 1994-2005. CAIT-WRI estimated a higher increase (48.9%) that classified Brazil at the 69th position. Using our estimates Brazil will fall to the 78th position. But in both cases Brazil increased in clearly lower values than the tendency calculated for China and India, two major emitters, with increases of 88.8%and 62.1%, respectively. Brazil’s increase is lower than those for some Annex 1 countries that are
submitted to a quota of reduction, e.g. Spain with 55.6% of increase and New Zealand with 45.8%. Brazil also is below the average increase shown by non-An-nex I countries, estimated to be 61.3%, but above the world average (28.1%). Results in Table 7 can be also compared to bulk estimates, For the year 2000 the dif-ference between the two approaches is 54.1 Mt CO2-eq for 2000, but only 8.7 Mt CO2-CO2-eq for the year 2005. The share of the top four increased from 89.6% in 1994 to 90% in 2005 (Table 8).
More recently these trends should certainly at least be maintained, or even accentuated, as it is the case for deforestation for which recent trends showed that annual deforestation in the Brazilian Amazon fell be-low 10,000 square kilometres for the first time since record-keeping began, reported Brazil’s Environment Minister Carlos Minc on June 2009. Minc said pre-liminary data from the country’s satellite-based defor-estation detection system (DETER) showed that Ama-zon forest loss between August 2008 and July 2009 would be below 10,000 square kilometres, the lowest level in more than 20 years. Official figures are due in August or September 2009.
Greenhouse gas mitigation options
Choosing a set of practices to mitigate greenhouse gases is one of the great challenges that Brazil faces in the coming years. The search for feasible options will require balancing cost-effectiveness and other ob-jectives. Several mitigation strategies in Brazilian ag-riculture and livestock have been identified as poten-tial alternatives.
Conventional versus no-tillage system in agriculture
No-tillage can be defined as a crop production sys-tem where soil is left undisturbed from harvest to planting except for fertilizer application. No-tillage prac-tices, cause less soil disturbance, often resulting in sig-nificant accumulation of soil C (Sá et al., 2001; Schuman et al., 2002) and consequent reduction of gas emissions, especially CO2, to the atmosphere (Lal, 1998; Paustian et al., 2000) as compared to conven-tional tillage. There is a lot of controversy regarding whether no-till really does sequester much soil C, es-pecially when the whole soil profile is considered (Smith et al., 1998; Six et al., 2002). The quantity of residues returned, variations in the practices imple-mented and perhaps the type of climate are factors likely to influence the outcome. According to Smith et al. (1998) only certain fixed amounts of soil C can be gained, up to a new equilibrium limit, which is re-versible if management reverts to conventional tillage. The total area in Brazil under no-tillage system is about 20 million ha, and the weighted average soil C accumulation rate due to no-tillage adoption is 0.5 t C
ha–1 yr–1 in the first 10 cm layer, giving an estimated change in total soil C of about 10 Mt yr–1. In addition we should include a C offset due to a significant re-duction in fuel consumption (60 to 70%) compared to the conventional tillage system (EMBRAPA, 2006).
Sugar-cane agrosystem
The net contribution of the Brazilian sugar cane in-dustry to the evolution of atmospheric CO2 is a com-bination of three activities, two industrial and one ag-ricultural.
The first activity is the substitution of gasoline by alcohol as a fuel. Since the early 1930’s the Brazilian
Table 8 - Top emission sector contributors in 2005 (90%) and trends compared to 1994.
r o t c e s -b u S Sector Greenhouse Gas Emissions O C t M 2-eq %ofthetotal Variation2005-1994 n o i s r e v n o C d n a l s s a r G d n a t s e r o F LUCF 1074.2 51.9 +8.1 n o i t s u b m o C l e u F li s s o F Energy 347.0 16.8 +44.4 n o i t a t n e m r e F c i r e t n E Agricutlure 248.4 12.0 +26.1 s li o S l a r u tl u c i r g A Agricutlure 192.9 9.3 +30.7 s r e h t O Allsectors 208.1 10.0 +8.8 r o t c e S 1990 1994 2000 2005 2005-1994 O C t M -- 2-eq--- % y g r e n E n o i t s u b m o C l e u F li s s o F 207.4 240.4 324.9 347.0 44.4 s n o i s s i m E e v i ti g u F 7.6 7.4 7.3 7.3 -0.5 l a t o T 215.1 247.7 332.2 354.3 43.0 s e s s e c o r P l a i r t s u d n I n o i t c u d o r P t n e m e C 10.2 9.3 19.0 14.2 52.5 r e h t O 6.7 7.5 9.0 14.6 94.2 l a t o T 19.5 21.3 34.1 36.9 73.6 e r u t l u c i r g A n o i t a t n e m r e F c i r e t n E 184.9 196.9 204.8 248.4 26.1 t n e m e g a n a M e r u n a M 13.0 13.9 13.2 16.1 15.7 n o i t a v i tl u C e c i R 5.0 5.9 5.0 5.4 -8.4 l a r u tl u c i r g A f o g n i n r u B d l e i F s e u d i s e R 4.4 5.0 4.0 4.6 -7.9 s li o S l a r u tl u c i r g A 132.1 147.6 155.4 192.9 30.7 l a t o T 339.4 369.3 382.4 467.4 26.6 y r t s e r o F d n a e g n a h C e s U d n a L n o i s r e v n o C d n a l s s a r G d n a t s e r o F 919.8 993.5 1051.8 1074.2 8.1 s li o S m o r f s l a v o m e R d n a s n o i s s i m E 110.2 75.6 67.9 65.1 -13.8 l a t o T 1030.0 1069.1 1119.7 1139.3 6.5 e t s a W l a t o T 19.2 20.6 22.7 24.4 18.5 L A T O T 1623.2 1728.0 1891.1 2022.3 17.0
Table 7 - Greenhouse gas emissions for the 1990-2005 period for the Energy, Industrial Processes, Agriculture, Land Use Change and Forestry and Waste sectors.
government has given incentives for alcohol produc-tion from sugar cane to be added to gasoline in the transportation sector (Sociedade Nacional de Agricultura, 2002). Due to oil crises in 1973-74, Bra-zilian authorities created new incentives through the Brazilian alcohol program (Proalcool) to increase the production of alcohol to 10.7 billion litres per year (Coelho et al., 2000). During 1975 to 2000, 156 mil-lion m3 of hydrated alcohol and 71 million m3 of an-hydrous alcohol were produced. Considering that 1 m3 of gasoline is substituted for 1.04 m3 anhydrous alco-hol and 0.8 m3 hydrated alcohol and that gasoline
con-tains on average 86.5% C (American Petroleum Insti-tute, 1988) we calculate that during the 1975-2000 pe-riod, 172 Mt C were offset and consequently not emit-ted to the atmosphere, which gives an average annual offset of 6.8 Mt C. However, the alcohol production and consumption are increasing every year in Brazil. If data just for the last 10 years were used, the offset would be about 10 Mt C yr–1.
The second associated mitigation factor in the sugar cane system is related to the use of plant resi-dues as a fuel. At the mill, the cane stalks are shred-ded and crushed to extract the cane juice while the fibrous outer residue, known as bagasse, is burnt to provide steam and electricity for the mill (Luca, 2002). For instance, in 1998 approximately 45 Mt dry matter of sugar cane residues were produced in Brazil (Balanço Energético Brasileiro, 1999). Assuming that 2.35 t of residues substitute for 1 t of fossil fuel (Macedo, 1997) we estimate that 8 Mt C were off-set in 1998 due to use of sugar cane residues at the mill instead of fuel. This renewable energy resource, found mainly in developing countries, has obvious appeal for international efforts to reduce carbon di-oxide emissions. Moreover, the organic wastewater stream from alcohol production, known as vinasse, can be used as fertilizer or can be converted to meth-ane gas through anaerobic digestion. The transpor-tation fleets used in sugar factories and ethanol dis-tilleries in Brazil have in some cases been powered by methane gas (Johnson, 2000). The production of alcohol has been viewed as a valuable means of sav-ing foreign exchange in developsav-ing countries while at the same time providing local and global environ-mental benefits (Oliveira et al., 2005). In addition to climate mitigation and reduction of local pollutants, it can serve as an octane enhancer that might speed the phasing-out of leaded gasoline. The economic and environmental attractiveness of sugar cane as a re-newable energy resource and the variety of options for increasing use of cane by-products and co-prod-ucts could one day lead to sugar becoming the by-product rather than the main by-product.
Finally, the third activity associated with CO2 miti-gation in the sugar cane system is the switch of the harvesting practice. Sugar cane is a perennial crop that is harvested on an annual cycle, with up to six cycles before re-planting. Traditionally, sugar cane was burnt in the field before harvesting in order to facilitate manual cutting by removing leaves and insects (Thorburn et al., 2001). However, since May 2000 this common practice has been progressively prohibited by law in some areas in Brazil. In 1997 about 20% of the Brazilian sugar cane area was harvested by machines (Silva, 1997) and it is estimated that about 80% of the
planted area in the most productive sugar cane region in Brazil will use mechanical harvesting in the next 20 years (CENBIO, 2002). By the return of crop residues to the soil surface the mechanical approach has indi-rectly favored soil organic matter accumulation (Thorburn et al., 2001; Luca, 2002) and gas emission reduction when compared to the burning system (Andreae & Merlet, 2001). For instance, Blair et al. (1998) found significant increases in the labile C frac-tion in green trash treatments compared to the trash burnt treatments in the surface soils of two green trash management trials in Australia. In Southern Brazil, Feller (2001) reported that an average of 0.32 t C ha–1 yr–1 was accumulated in 12 years in the first 20 cm depth of an Oxisol due to burn omitting. Other esti-mates exist, but for shorter period of no-burning. For instance, Luca (2002) reported increases ranging from 2 to 3.1 and 4.8 to 7.8 t C ha–1 respectively for the top 5 cm and 40 cm layers during the first 4 years following no-burning. The corresponding annual in-crease ranges from 0.5 to 0.78 t C ha–1 yr–1 for the 0-5 cm layer and 1.2 to 1.9 t C ha–1 yr–1 for the 0-40 cm layer. However, sugar cane is typically replanted each 6-7 years and tillage practices are commonly used. This procedure would probably reduce the high rates presented by Luca (2002) if the study had been for a longer period. In our estimate of C sequestration we have used the value found by Feller (2001) because it represents the longest period of harvest without burn-ing in Brazil and incorporates cane replantburn-ing. Thus, considering the area under this management system and the mean annual C accumulation rate, a total of 0.48 Mt C yr–1 is sequestered in Brazil.
When sugar cane is burnt other greenhouse gases like CH4 and N2O are also emitted to the atmosphere. Macedo (1998) shows that 6.5 kg CH4 ha–1 are released from the burning of sugar cane. Considering the total area with sugar cane under the no burning harvesting system (1.5 Mha) and that the methane has the global warming potential of 21, we have calculated that 0.2 Mt CO2-equivalent (0.05 Mt C) that are not emitted annually to the atmosphere due to the adoption of no burning. The same calculation is required for N2O emission; however, currently there are no adequate measurements of this gas in sugar cane.
In summary, when sugar cane is harvested me-chanically without burning in Brazil, 0.48 Mt C yr–1 is sequestered in the soil and a methane emission equiva-lent of 0.05 Mt C yr–1 is avoided. This total of 0.53 Mt C yr–1 is the contribution of the agricultural sec-tor. Moreover, the industrial sector contributes not only the 10 Mt C yr–1 offset due to substitution of fossil fuel by alcohol for transportation but also the 8 Mt C yr–1 by substituting fossil fuel for power generation at
the mill. Combining the agricultural and the industrial sectors, sugar cane produced without burning gives a total of 18.5 Mt C yr–1 removed from the atmosphere.
Livestock
The beef production sector’s challenge is to vide scientific research based information to help pro-ducers create “low cost - high profit” cattle that yield a product desired by the consumer and manage re-sources in a sustainable manner while maximizing profits. Nowadays, the profit per area is more impor-tant than per animal. Ranchers are assimilating the idea of obtaining a better knowledge of agribusiness and start to correctly plan the production processes. In consequence, the traditional extensive cattle breeding is one of the activities which mostly looses competi-tiveness. Day by day the herds are driven towards cheaper lands to maintain a small number of animals per area. The mean occupation of pastures in Brazil is 0.9 AU per hectare, a too low number to be sustained by expensive land (IBGE, 2008). Increase the occu-pation rate shows up as one of the most promising directives for beef cattle production. Beside genetic improvement to increase output, enhance product qual-ity and increase disease resistance of the livestock, pas-ture quality is actually the main challenge. To be con-sidered of high quality pasture must both support a high level of intake as well as have high concentra-tions of energy, protein and minerals. Pasture quality is influenced by plant species and age, soil fertility, sea-sons (drought), among other factors.
Nowadays one of the best ways to establish a low cost, sustainable and high quality pasture in the Ama-zon region is to adopt the integrated crop-livestock sys-tem. In this system the pasture renovation is made by the introduction of agriculture, with benefits to both. The adoption of feedlots can be another way to in-crease beef production. This system is specially ap-propriated to overcome dry periods, when fodder is scarce. Feedlots are thus an alternative to regulate beef production during the period in which beef offer is low and demand is high. The modernization process of the Brazilian beef cattle will result in productivity gains and consequently lower GHG emissions, from both enteric fermentation and higher pasture occupation.
CONCLUDING REMARKS
In Brazil most mitigation efforts focused on the en-ergy and LUCF, i.e. mostly on the reduction of defor-estation in the Amazon. The later aspect succeeded since deforestation rates decreased. On the other hand, despite the intensification of ethanol use (increasing percentage of flex fuel cars), the energy sector showed
the highest level of increase (+44%). However, the en-ergy-related programs and measures implemented in the 90’s and thereafter have provided a broad range of benefits for the Brazilian economy, and helped to lower carbon emissions in relation to was considered business as usual in the yearly 90’s.
Besides effort to curb emissions from the energy and deforestation sectors, it is now a top priority to implement a national program to incentive mitigation efforts concerning the agricultural sectors (+27%). These mitigation options should not be only focused on emission reductions, but also prone enhancement of the carbon sink. Such a program would be easy to be implemented, because several mitigation strate-gies have already proven to be efficient, simple to be adopted and economically viable.
ACKNOWLEDEGMENT
Research work that leads to this publication was supported partly by CNPq, FAPESP and CAPES/ COFECUB.
REFERENCES
AMERICAN PETROLEUM INSTITUTE. Alcohols and ethers. Washington, D.C.: API, 1988. 34p. (Publication, 4261). ANDREAE, M.O.; MERLET, P. Emission of trace gases and
aerosols from biomass burning. Global Biogeochemical Cycles, v.15, p.955-966, 2001.
BERNOUX, M.; CARVALHO, M.C.S.; VOLKOFF, B.; CERRI, C.C. CO2 emission from mineral soils following land-cover change in Brazil. Global Change Biology, v.7, p.779-787, 2001. BERNOUX, M.; CARVALHO, M.C.S.; VOLKOFF, B.; CERRI, C.C.
Brazil’s soil carbon stocks. Soil Science Society of America Journal, v.66, p.888-896, 2002.
BERNOUX, M.; VOLKOFF, B.; CARVALHO, M.C.S.; CERRI, C.C. CO2 emissions from liming of agricultural soils in Brazil. Global Biogeochemical Cycles, v.17, p.1049, 2003.
BLAIR, G.J.; CHAPMAN, L.; WHITBREAD, A.M.; BALL-COELHO, B.; LARSEN, P.; TIESSEN, H. Soil carbon changes resulting from trash management at two locations in Queensland, Australia and in North-east Brazil. Australian Journal of Soil Research, v.36, p.873-882, 1998.
CENTRO NACIONAL DE REFEÊNCIA EM BIOMASSA -CENBIO. Banco de dados de biomassa no Brasil. 2002. Available at : http://infoener.iee.usp.br/cenbio. Accessed 10 Dec. 2002. CERRI, C.C.; BERNOUX, M.; CARVALHO, M.C.S.; VOLKOFF, B.
Emissions and removals of carbon dioxide by soils from land use change and liming. Background reports of the razil’s Initial National Communication to the United Nations Framework Convention on Climate Change. Brasilia: Ministério da Ciencia e Tecnologia, 55p. 2002.
CERRI, C.C.; BERNOUX, M.; CERRI, C.E.P., FELLER, C. Carbon cycling and sequestration opportunities in South America: the case of Brazil. Soil Use and Management, v.20, p.248-254, 2004.
CERRI, C.E.P.; SPAROVEK, G.; BERNOUX, M.; EASTERLING, W.E.; MELILLO, J.M.; CERRI C.C. Tropical agriculture and global warming: impacts and mitigation options. Scientia Agricola, v.64, p.83-89, 2007.
COELHO, S.T.; BOLOGNINI, M.F.; PALETTA, C.E.M. Proalcool: the Brazilian Alcohol Program. GreenTimes, v.7, p.1-2, 2000.
EMPRESA BRASILEIRA DE PESQUISA AGROPECUÁRIA – EMBRAPA. Plataforma plantio direto. Brasília, EMBRAPA, 2006. Available at : http://www.embrapa.br/plantiodireto. Accessed 11 Dec. 2006.
FELLER, C. Efeitos da colheita sem queima da cana-de-açúcar sobre a dinâmica do carbono e propriedades do solo. Piracicaba, 2001. 150p. (Final Report Fapesp Contract 98/ 12648-3).
HOUGHTON, R.A. Emissions (and sinks) of carbon from land-use change: estimates of national sources and sinks of carbon resulting from changes in land use, 1950 to 2000. Washington, D.C.: WRI, 2003. 13p. (Report to the World Resources Institute from the Woods Hole Research Center).
INSTITUTO BRASILEIRA DE GEOGRAFIA E ESTATÍSTICA - IBGE. Instituto Brasileiro de Geografia e Estatística. Available at: http://www.ibge.gov.br/home/estatistica/indicadores/ agropecuaria. 2008. Accessed 08 Oct. 2008
INSTITUTO DE ECONOMIA AGRÍCOLA - IEA. CO2 emissions from fuel combustion. 2007. Available at: http://data.iea.org/ ieastore/statslisting.asp?. Accessed 10 Jul. 2009.
INTERGOVERNMENTAL PANEL ON CLIMATE CHANGE – IPCC. IPCC guidelines for national greenhouse gas inventories: reporting instructions. Geneva: IPCC, 1997. 3v. INTERGOVERNMENTAL PANEL ON CLIMATE CHANGE -IPCC., United Nations Environment Programme. Assessment Report 4: Contribution of Working Groups I, II and III to the Fourth Assessment Report of the Intergovernmental Panel on Climate Change. Geneva: 2007. 104p.
JOHNSON, F. Sugarcane resources in southern Africa. Tiempo: Global Warming and the Third World, v.35, p.1-4, 2000. LAL, R. Soil processes and the greenhouse effect. In: LAL, R.; BLUM, W.H.; VALENTINE, C.; STEWART, B.A., (Ed.) Methods for assessment of soil degradation. Boca Raton: CRC Press, 1998. p.199-212.
LUCA, E.F. Matéria orgânica e atributos do solo em sistemas de colheita com e sem queima da cana-de-açúcar. Piracicaba : USP/ ESALQ, 2002. 101p. Tese (Doutorado).
MACEDO, I.C. Emissão de gases do efeito estufa e a produção/ utilização de etanol da cana-de-açúcar no Brasil. Piracicaba: Centro de Tecnologia Copersucar, 1997. 19p. (Relatório interno CTC-05/97).
MACEDO, I.C. Greenhouse gas emissions and energy balances in bio-ethanol production and utilization in Brazil. Biomass and Bioenergy, v.14, p.77-81, 1998.
MACHADO, R.B.; RAMOS NETO, M.B., PEREIRA,T.G.T., CALDAS, E.F., GONÇALVES, D.A., SANTOS, M.S.; TABOR, K.; STEININGER, M. Estimativas de perda de área de cerrado Brasileiro. Brasília: Conservação Internacional, 2004. 26p. (Relatório Técnico).
MINISTÉRIO DE CIÊNCIA E TECNOLOGIA - MCT. Balanço de carbono nas atividades energéticas do Brasil. Brasília: MCT, 2007. 33p (Economia & Energia, 62). Available at: http:// ecen.com/eee62/eee62p/ecen_62p.htm. Accessed 07 Jul. 2009.
MINISTÉRIO DE CIÊNCIA E TECNOLOGIA - MCT. Emissões de CO2 provenientes da queima de combustível: comparação entre os valores do IEA e os de e&e/MCT. Brasília: MCT, 2008. 7p (Economia & Energia, 66). Available at: http://ecen.com/eee66/ eee66p/ecen_66p.htm. Accessed 07 Jul. 2009.
MINISTÉRIO DAS MINAS E ENERGIA. Balanço energético brasileiro. 1999. Available at: http://www.brasil-rounds.gov.br/ infogeral/balanco.htm. Accessed 10 Feb. 2002.
OLIVIER, J.G.J.; BERDOWSKI, J.J.M.; PETERS, J.A.H.W.; BAKKER, J.; VISSCHEDIJK, A.J.H.; BLOOS, J.P.J. Applications of EDGAR, including a description of EDGAR 3.2: reference database with trend data for 1970-1995. Bilthoven: RIVM, 2002. 12p. (Report 773301 001/NRP; Report 410200 051). Available at: http://www.mnp.nl/edgar/model/edgarv32. Accessed 07 Jul. 2009
OLIVEIRA, M.E.D.; VAUGHAN, B.E.; RYKIEL JR., E.J. Ethanol as fuel: energy, carbon dioxide balances, and ecological footprint. BioScience, v.55, p.593-602, 2005.
PAUSTIAN, K.; SIX, J.; ELLIOTT, E.T.; HUNT, H.W. Management options for reducing CO2 emissions form agricultural soils. Biogeochemistry, v.48, p.147-163, 2000. SÁ, J.C.; CERRI, C.C.; DICK, W.A; LAL, R.; VENZKE FILHO,
S.P.; PICCOLO, M.C.; FEIGL, B.J. Organic matter dynamics and carbon sequestration rates for a tillage chronosequence in a Brazilian oxisol. Soil Science Society of America Journal, v.65, p.1486-1499, 2001.
SCHUMAN, G.E.; JANZEN, H.H.; HERRICK, J.E. Soil carbon dynamics and potential carbon sequestration by rangelands. Environmental Pollution, v.116, p.391-396, 2002. SIX, J.; FELLER, C.; DENEF, K.; OGLE, S.M.; SÁ, J.C.M.;
ALBRECHT, A. Soil carbon matter, biota and aggregation in temperate and tropical soils: effects of no-tillage. Agronomie, v.22, p.755-775, 2002.
SILVA, G.M.A. Cana crua x cana queimada: restrições técnicas e implicações sociais e econômicas. In: SECAPI, 1., Piracicaba, 1997. Proceedings. Piracicaba, 1997. p.55-57.
SMITH, P.; POWLSON, D.S.; GLENDINING, M.J.; SMITH, J.U. Preliminary estimates of the potential for carbon mitigation in European soils through no-till farming. Global Change Biology, v.4, p.679-685, 1998.
SOCIEDADE NACIONAL DE AGRICULTURA. Brasil, açúcar e álcool: cronologia da cana no Brasil. 2002. Available at: http:// www.snagricultura.org.br. Accessed 20 Nov. 2000.
U.S. ENVORONMENTAL PROTECTION AGENCY - EPA. Global anthropogenic non-co2 greenhouse gas emissions: 1990-2020. 2006. Available at: http://www.epa.gov/nonco2/econ-inv/ international.html. Accessed 29 Jun. 2009.
THORBURN, P.J.; PROBERT, M.E.; ROBERTSON, F.A. Modelling decomposition of sugar cane surface residues with APSIM-Residue. Field Crops Research, v.70, p.223-232, 2001.
Received July 14, 2009 Accepted August 14, 2009