HAL Id: hal-00992849
https://hal.archives-ouvertes.fr/hal-00992849
Submitted on 4 Aug 2020
HAL is a multi-disciplinary open access
archive for the deposit and dissemination of
sci-entific research documents, whether they are
pub-lished or not. The documents may come from
teaching and research institutions in France or
abroad, or from public or private research centers.
L’archive ouverte pluridisciplinaire HAL, est
destinée au dépôt et à la diffusion de documents
scientifiques de niveau recherche, publiés ou non,
émanant des établissements d’enseignement et de
recherche français ou étrangers, des laboratoires
publics ou privés.
Combining criteria for delineating lahar- and
flash-flood-prone hazard and risk zones for the city of
Arequipa, Peru
Jean-Claude Thouret, G. Enjolras, Kim Martelli, O. Santoni, J.A. Luque, N.
Nagata, A. Arguedas, L. Macedo
To cite this version:
Jean-Claude Thouret, G. Enjolras, Kim Martelli, O. Santoni, J.A. Luque, et al.. Combining criteria
for delineating lahar- and flash-flood-prone hazard and risk zones for the city of Arequipa, Peru.
Natural Hazards and Earth System Sciences, European Geosciences Union, 2013, 13 (2), pp.339-360.
�10.5194/nhess-13-339-2013�. �hal-00992849�
Nat. Hazards Earth Syst. Sci., 13, 339–360, 2013 www.nat-hazards-earth-syst-sci.net/13/339/2013/ doi:10.5194/nhess-13-339-2013
© Author(s) 2013. CC Attribution 3.0 License.
EGU Journal Logos (RGB)
Advances in
Geosciences
Open Access
Natural Hazards
and Earth System
Sciences
Open AccessAnnales
Geophysicae
Open AccessNonlinear Processes
in Geophysics
Open AccessAtmospheric
Chemistry
and Physics
Open AccessAtmospheric
Chemistry
and Physics
Open Access DiscussionsAtmospheric
Measurement
Techniques
Open AccessAtmospheric
Measurement
Techniques
Open Access DiscussionsBiogeosciences
Open Access Open Access
Biogeosciences
DiscussionsClimate
of the Past
Open Access Open Access
Climate
of the Past
Discussions
Earth System
Dynamics
Open Access Open Access
Earth System
Dynamics
DiscussionsGeoscientific
Instrumentation
Methods and
Data Systems
Open Access
Geoscientific
Instrumentation
Methods and
Data Systems
Open Access DiscussionsGeoscientific
Model Development
Open Access Open Access
Geoscientific
Model Development
DiscussionsHydrology and
Earth System
Sciences
Open AccessHydrology and
Earth System
Sciences
Open Access DiscussionsOcean Science
Open Access Open Access
Ocean Science
DiscussionsSolid Earth
Open Access Open Access
Solid Earth
DiscussionsOpen Access Open Access
The Cryosphere
Natural Hazards
and Earth System
Sciences
Open Access
Discussions
Combining criteria for delineating lahar- and flash-flood-prone
hazard and risk zones for the city of Arequipa, Peru
J.-C. Thouret1, G. Enjolras2, K. Martelli1, O. Santoni3, J. A. Luque4, M. Nagata5, A. Arguedas4, and L. Macedo6 1PRES Clermont, Universit´e Blaise Pascal, Laboratoire Magmas et Volcans, UMR6524 CNRS et IRD-R163, 5 rue Kessler,
63038 Clermont-Ferrand cedex, France
2CRET-LOG, Aix-Marseille University, 14 avenue Jules Ferry, 13621 Aix-en-Provence cedex, France
3Ceramac, Maison des Sciences de l’Homme, Universit´e Blaise Pascal, 4 rue Ledru, Clermont-Ferrand, France 4Defensa Civil Paucarpata and NGO PREDES, Av. Uni´on Nro. 200, Urb. C´esar Vallejo, Paucarpata, Arequipa, Peru 5Departamento de Geografia, Pontifica Universidad Cat´olica de Lima, Av. Universitaria 1801, San Miguel, Lima, Peru 6INGEMMET, Instituto Nacional de Geologia, Minero y Metalurgico, Av. Dolores (Urb. Las Begonias B-3),
Jos´e Luis Bustamante y Rivero, Arequipa, Peru
Correspondence to: J.-C. Thouret (j.c.thouret@opgc.univ-bpclermont.fr)
Received: 13 July 2012 – Published in Nat. Hazards Earth Syst. Sci. Discuss.: –
Revised: 28 December 2012 – Accepted: 7 January 2013 – Published: 14 February 2013
Abstract. Arequipa, the second largest city in Peru, is
ex-posed to many natural hazards, most notably earthquakes, volcanic eruptions, landslides, lahars (volcanic debris flows), and flash floods. Of these, lahars and flash floods, triggered by occasional torrential rainfall, pose the most frequently oc-curring hazards that can affect the city and its environs, in particular the areas containing low-income neighbourhoods. This paper presents and discusses criteria for delineating ar-eas prone to flash flood and lahar hazards, which are lo-calized along the usually dry (except for the rainy season) ravines and channels of the R´ıo Chili and its tributaries that dissect the city. Our risk-evaluation study is based mostly on field surveys and mapping, but we also took into account quality and structural integrity of buildings, available socio-economic data, and information gained from interviews with risk-managers officials.
In our evaluation of the vulnerability of various parts of the city, in addition to geological and physical parameters, we also took into account selected socio-economic parame-ters, such as the educational and poverty level of the popula-tion, unemployment figures, and population density. In addi-tion, we utilized a criterion of the “isolation factor”, based on distances to access emergency resources (hospitals, shelters or safety areas, and water) in each city block. By combin-ing the hazard, vulnerability and exposure criteria, we pro-duced detailed risk-zone maps at the city-block scale,
cov-ering the whole city of Arequipa and adjacent suburbs. Not surprisingly, these maps show that the areas at high risk co-incide with blocks or districts with populations at low socio-economic levels. Inhabitants at greatest risk are the poor re-cent immigrants from rural areas who live in unauthorized settlements in the outskirts of the city in the upper parts of the valleys. Such settlements are highly exposed to natural hazards and have little access to vital resources.
Our study provides good rationale for the risk zoning of the city, which in turn may be used as an educational tool for better understanding the potential effects of natural hazards and the exposure of the population residing in and around Arequipa. We hope that our work and the risk-zonation maps will provide the impetus and basis for risk-management au-thorities of the Municipality and the regional government of Arequipa to enforce existing regulations in building in haz-ardous zones and to adopt an effective long-term strategy to reduce risks from lahar, flash flood, and other natural haz-ards.
1 Introduction
Volcanoes can pose potential severe hazards to nearby cities. Cities such as Naples in Italy (Rolandi, 2010), Arequipa in Peru (Thouret et al., 2001; Vargas-Franco et al., 2010),
340 J.-C. Thouret et al.: Combining criteria for delineating lahar- and flash-flood-prone hazard
Ibagu´e in Colombia (Thouret and Laforge, 1994; K¨unzler et al., 2012) and Yogyakarta in Indonesia (Lavigne, 1999) are all located in vulnerable zones as urbanization encroaches the slopes of their nearby volcanoes. During a large eruption, py-roclastic flows, surges, and heavy tephra fall represent imme-diate and substantial hazards. Perhaps equally hazardous are the secondary lahars (volcanic debris flows) and flash floods triggered by heavy rainstorms, because they can threaten the populations even when the volcano is quiescent (Thouret, 2002).
The city of Arequipa, southern Peru, is representative of a population centre exposed to volcano-related hazards. Al-though the last eruption of El Misti volcano occurred dur-ing the 15th Century, the volcano still represents a poten-tial threat to the local population. Because of its hazardous setting, scientists have studied the basin area of the city and its neighbouring El Misti volcano in recent decades. Among catastrophic volcanic hazards, heavy rainfall and as-sociated floods affect the city once to twice per decade. Risk-management institutions including Civil Protection au-thorities and public institutes such as INGEMMET (Insti-tuto Geol´ogico Minero y Metal´urgico) and CISMID (Centro de Investigaci´on Sismol´ogica y de Mitigaci´on de Desastres) have produced hazard-zone maps (e.g. Mari˜no et al., 2007; Macedo, 2012). However, given the demographic pressures to encroach the slopes of the volcano, it is necessary to trans-form such documents into risk maps.
The aim of this paper is therefore to delineate lahar- and flash flood-prone risk zones in the city of Arequipa (Peru) by defining a set of criteria for outlining zones vulnerable to these hazards. Such work has two applications (Mechler, 2004): (1) with respect to risk evaluation, maps can outline the areas that could be damaged. They can be used to im-prove the urban management planning of Arequipa. (2) With respect to risk management, the knowledge of mapped ar-eas allows for preparation for floods and lahars, by diffus-ing information, prepardiffus-ing evacuations and recovery. Thus, the mapping provides strong support to Civil Protection for mitigating casualties and damage and also for recovery, thus promoting resiliency (Hollnagel, 1996).
Evaluating natural risk requires considering both hazard and vulnerability (Blaikie et al., 2004; Schneiderbauer and Ehrlich, 2004). A hazard is the occurrence of a natural phe-nomenon of a given magnitude and frequency. This gen-eral definition is commonly accepted, although each type of hazard needs to be parameterized according to the con-text (Smith and Petley, 2009). For example, lahar risk is first studied across a spectrum of hazards, i.e. the characteristics of flows measured by parameters such as volume, height, velocity and density, modulated by the return period (Val-lance, 2000). Vulnerability encompasses the foreseeable con-sequences of hazards on people and the assets to be affected by any given hazardous phenomenon (K¨unzler et al., 2012). Determining potential losses requires identifying the key fac-tors which generate vulnerability. However, published
lit-erature indicates that this question remains open (Cutter et al., 2003; Hufschmidt et al., 2005). According to K¨unzler et al. (2012), two concepts of vulnerability need to be taken into account: (1) the physical vulnerability related to the sensitiv-ity of elements at risk, for instance people, buildings and fa-cilities; and (2) the socio-economic vulnerability correlated to the ability of the society to cope with hazards. The latter indicator must take into account both the structure and the or-ganization of the society, which includes a person’s exposure to hazards and the relief organization.
Over the years, some aspects of lahar hazards and risks have been well studied in the city of Arequipa, focusing on some of their components. Modelling lahar hazards at the citywide scale has been undertaken by Vargas-Franco et al. (2010) and Martelli (2011). The challenge is to obtain more precise information at the scale of a district or block within the city. In such cases, the evaluation of vulnerabil-ity is much more complex because it is constrained by the amount and quality of data. Physical vulnerability of build-ings has led to a classification of buildbuild-ings according to their resistance to lahars and floods (Martelli et al., 2010; Martelli, 2011). Without neglecting the above-mentioned parameters, the analysis is focused on the evaluation of socio-economic vulnerability in Arequipa. Due to the lack of consensus in literature, the main challenge is to determine the relevant parameters that will emphasize the specificity of the local vulnerability (Keys, 2007). In addition to a selection of rel-evant socio-economic indicators such as level of education and employment, the access to key facilities for the effec-tive management of crises is accounted for (De La Cruz-Reyna et al., 2000). Exposure to natural hazards is directly linked to the isolation from strategic resources and supply chains (D’Ercole and Metzger, 2004; Peck, 2006). Therefore, a main point of this paper is to assess vulnerability as a func-tion of the distance between each city block and resource el-ements such as hospitals, fire stations, water tanks and “safe” areas.
Using a large set of variables related to hazard and vulner-ability, a map of lahar risk was drawn for the city of Arequipa considering these two components on an equal basis. Infor-mation from this document is provided at the block scale; thus it can be used at the district level without loss of infor-mation. Our study has been carried out with two purposes: (1) for the case study of the city of Arequipa, the maps pro-vided in this study may help to mitigate the social and eco-nomic consequences from future lahar and flash flood events in the city; and (2) to describe our methodology for other cities exposed to similar risks.
This paper will (1) depict the setting and exposure of Are-quipa, focusing on the natural hazards posed to the city at the foot of an active volcano; (2) present data and methods used for this research project; (3) evaluate lahar and flood hazard in Arequipa; (4) discuss criteria for assessing overall vulnerability in the city; and (5) outline risk areas, including
implications for risk management. The concluding remarks will provide a few recommendations.
2 Study area: the city of Arequipa
Arequipa, the second largest city in Peru, is one of the ma-jor commercial and tourism centres in the country. Like many South American cities, its recent economic and demo-graphic growth is very dynamic (Pinto da Cunha, 2002). Its GDP grew by 66 % between 2003 and 2008, exceeding 9 % each year, which is the highest rate among Latin American cities (Gonz´alez and D´ıaz, 2008). The general extent of Are-quipa has grown considerably (+400 %) since 1960 because of a massive influx of people from rural areas, civil unrest and violence in the 1990s, and due to flourishing economic activities. Over the past four decades, the built area has en-croached into approximately 70 % of the oasis and its arable, irrigated land (Municipalidad Provincial de Arequipa, 2002). Such a rapid growth over the past 60 yr has generated a fast expansion of the city boundaries, which now encroach on the slopes of Nevado Chachani to the N and El Misti to the NE (Fig. 1). Today, the population of Arequipa, neighbour-ing villages in its oasis, and Chiguata (20 km to the ENE) approaches one million habitants: the population has grown from 331 843 in 1972 to 821 692 inhabitants in 2007, with a resulting population growth rate of approximately 2.5 % per year.
The city site is located within a depression between the western flank of the Western Cordillera of the Central Andes and the Arequipa batholith to the east of the Pacific pied-mont. The depression, which encompasses the R´ıo Chili and R´ıo Andamayo valleys, is surrounded by three volcanic edi-fices: Pichu Pichu, the oldest, to the ESE; the Chachani vol-canic complex to the N; and El Misti the youngest composite cone to the NE. The active, fumarolic El Misti (5822 m.a.s.l.) is located approximately 17 km north-east of the historical city centre at 2300 m.a.s.l. The city is irrigated by the R´ıo Chili, a perennial river from the wetter Altiplano to the N and NE of the Western Cordillera. The R´ıo Chili valley and ad-jacent terraces support houses, industries, commercial settle-ments and sport facilities, contain six bridges, and supply the drinking water for one million inhabitants. Five ravines (lo-cally termed quebradas or torrenteras), which are usually dry but sporadically wet during the December to March rainy season, dissect the city. The major quebradas, which co-incide with pilot areas for this study, are Qda. Huarangal-Paucarpata (north-eastern suburbs of the city) and Qda. San Lazaro (northern part), which have formed two fans (Fig. 1). These fans and areas located between the volcano flanks and the historical city centre have been mostly urbanized since the 1960s.
Upon arrival, the new migrants often settle in unauthorized locations, without basic services or facilities (drinkable wa-ter, electricity), because in principle the valleys and higher
slopes are protected from construction. However, there is lit-tle living space in a rapidly expanding city and these areas are where the new “illegal” settlements are cropping up. More-over, many of the migrants have remained in places where they first arrived, even if their housing is located in an area highly exposed to natural hazards, with new neighbourhoods quickly forming and claiming basic services from the City Hall. Except for the sectors located on the fringes of the city, all districts have their own social organization. In many cases, a representative, who has been chosen by the inhabi-tants, acts as a relay with the civil administration of the city. This delegate knows both the population and the district area well and he/she can then convey information about natural hazard prevention and facilitate evacuation and the relief or-ganization during a crisis.
As a result of increasing urbanization, Arequipa is exposed to four main categories of natural hazard, whose threatening effects are enhanced by poor-quality housing and lack of ur-ban infrastructure. The hazards include (1) frequent earth-quakes due to either the subduction zone or active faults crossing the depression. The last major earthquake (Mw=
8.4) struck the city on 21 June 2001. (2) Flash floods can oc-curr in the tributaries of the R´ıo Chili, whose channels are temporarily filled by sporadic flows during the rainy sea-son or after an eruption. Dam-break floods can also result along the R´ıo Chili due to the temporary damming of its up-per course or failure of the two-dammed lakes north of El Misti volcano. (3) Lahars (both debris flows and hypercon-centrated flows) can occur during and after an eruption, when the rain or other water remobilizes unconsolidated volcanic debris. Hyperconcentrated streamflows carry predominantly sand and gravel sediments with concentrations between 20 to 60 % by volume and 40 to 80 % by weight. Debris flows are mixtures of solid and fluids > 40 % by volume and > 60 % by weight, which move downstream approximately in uni-son (Pieruni-son, 2005). Secondary, non-eruption-related lahars can also be triggered by heavy rainstorms on loose debris on the volcano flanks. And (4) despite the most recent (AD 1440–1460) El Misti eruption being a low-magnitude vulca-nian event, much more powerful explosive activity has oc-curred in the past and may occur again, as evidenced by the voluminous (VEI ≥ 4, volume 0.1–1 km3) Subplinian and Plinian eruptions in the recent geologic past, which have occurred on average every 4000 to 5000 yr over the past 50 000 yr (Thouret et al., 2001; Cobe˜nas et al., 2012; Harpel et al., 2011).
Figure 2 summarizes the geological hazards that endanger Arequipa. The most exposed areas are located on the slopes of the volcanoes that surround the city (Chachani, north of the airport; and El Misti, north-east of the city) and also along the main valleys (R´ıo Chili, Qda. Huarangal). These areas are geologically unstable because of unconsolidated rocks, characterized by low-bearing capacity deposits and therefore high soil acceleration. In addition, the surface water drainage is accelerated in case of heavy rainfall.
342 J.-C. Thouret et al.: Combining criteria for delineating lahar- and flash-flood-prone hazard
Fig. 1. The setting of Arequipa city in relation to El Misti volcano, showing the volcano, drainage and location of all quoted sites in text.
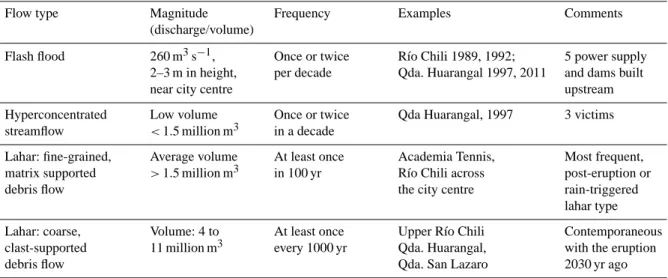
Lahar frequency and magnitude have been evaluated on the basis of dated deposits in the city area and in archives (newspapers, chronicles and reports). Table 1 shows the lahar frequency according to four types of magnitude. La-hars are infrequent except after eruptions, but flash floods have occurred on average about twice per decade in the otherwise dry environment of Arequipa (average annual rain-fall of 150 mm). Flash floods and hyperconcentrated flows occurred in 1982, 1989, 1992, 1997 and 2011, claiming only
a few victims (3 in 1997) but inflicting sizeable damage on housing, infrastructure and environment. The most recent flash floods occurred between 10 and 16 February 2011 af-ter two weeks of intense rainfall (126 mm, i.e. three quar-ters of the average amount of annual rainfall). Three ur-ban areas were partly damaged: the right ur-bank and chan-nel of Qda Huarangal-Mariano Melgar (San Geronimo city block), Alto Selva Alegre (Villa Ecologica city block) and the right bank of R´ıo Chili (Avenida Arancota) down valley
Table 1. Characteristics of lahars and flash floods in the city of Arequipa (after Martelli, 2011; Vargas-Franco et al., 2010; Delaite et al., 2005; and Thouret et al., 2001).
Flow type Magnitude
(discharge/volume)
Frequency Examples Comments
Flash flood 260 m3s−1, 2–3 m in height, near city centre
Once or twice per decade
R´ıo Chili 1989, 1992; Qda. Huarangal 1997, 2011
5 power supply and dams built upstream Hyperconcentrated streamflow Low volume <1.5 million m3 Once or twice in a decade
Qda Huarangal, 1997 3 victims
Lahar: fine-grained, matrix supported debris flow Average volume >1.5 million m3 At least once in 100 yr Academia Tennis, R´ıo Chili across the city centre
Most frequent, post-eruption or rain-triggered lahar type Lahar: coarse, clast-supported debris flow Volume: 4 to 11 million m3 At least once every 1000 yr
Upper R´ıo Chili Qda. Huarangal, Qda. San Lazaro
Contemporaneous with the eruption 2030 yr ago
of Puente Tingo in the south part of the city. According to the regional Civil Protection committee in Arequipa, these flash flood and runoff events ruined 20 houses and damaged about 400 houses located along the quebradas (especially Qda Huarangal) and on steep slopes (Villa Ecologica). How-ever, most damage is indirectly linked to the effects of flash floods due to water impounded by artificial infill obstacles in dry channels, which broke out upstream of the city blocks. The consequences of flash floods directly affect the neigh-bourhoods located in the valleys but also indirectly affect the whole population. Drinkable water is a scarce resource to which access can be disrupted or impeded by the many haz-ards (e.g. floods, landslides, earthquakes), even in so-called “safe” areas. Water is stored in two dams located in the up-per part of the R´ıo Chili (north of El Misti volcano), and, because of topographic obstacles in the canyon, the trans-port of drinkable water is not continuous between the storage and the city. The R´ıo Chili canyon becomes a large irrigated alluvial valley only 7 km upstream of the city centre. The canyon is very vulnerable to landslides and sudden floods; on 8 and 9 February 1989, a sudden flood obstructed water pipes and destroyed segments of the water-distribution net-work. For 25 days, the city received only 200 L s−1while the usual consumption exceeds 1500 L s−1, and as a result the whole population of the city faced drastic water rationing. This example illustrates why an analysis taking account of all components of risk needs to be carried out at the city scale.
3 Data acquisition and processing
The quality of information collected for evaluating the risk and its components is critical, and thus data is gathered from three sources. These include (1) land-use planning schemes, whose information is officially distributed; (2) surveys and
interviews conducted in the city of Arequipa among institu-tions and people in charge of risk management; and (3) sim-ulations and evacuation exercises led by Civil Protection and City Hall, considering for instance the occurrence of a flash flood in February 2011 or an earthquake in November 2010.
3.1 Land-use planning schemes
Urban planning in Arequipa is constrained by a scheme de-fined at city scale (Municipalidad Provincial de Arequipa, 2002), taking into account the current land use and provid-ing recommendations for the sustainable development of the city. The urban-development scheme serves as a reference for district-scale construction planning considering natural haz-ards. The urban scheme contains many maps, which indicate hazards at the city-block scale. However, socio-economic in-dicators such as literacy and employment rates are scarce and defined only at the local district scale. Moreover, the docu-ment does not take into account the “unofficial” developdocu-ment of the city towards the volcano’s slopes. Although these areas are designed as unbuildable and requiring “special attention”, they have already been built up.
Volcanic and lahar risks result from geologic and hydro-logic hazards in the city area of Arequipa, but both cate-gories of risks differ in their origin, their consequences and the ways their effects can be mitigated. Therefore, these two kinds of hazards need to be defined. Following the adoption of the municipal ordinance 658 on 15 November 2010, the volcanic-hazard-zone map published by Mari˜no et al. (2007), largely based on Thouret et al. (2001), has become an offi-cial planning document. Accordingly, the city of Arequipa prevents any construction within the red zones on this map. The red zones correspond to the summit flanks of El Misti volcano and the uppermost reaches of the quebradas, in which “illegal” housing already exists; red zones also extend
344 J.-C. Thouret et al.: Combining criteria for delineating lahar- and flash-flood-prone hazard
Fig. 2. Multi-hazard-zone map of the city of Arequipa showing hazard level (low to very high) for earthquake and landslide, and that related to bedrock, soil type, water and groundwater.
downstream from the volcano along the valleys of the R´ıo Chili and its tributaries. In addition, an official prevention plan to mitigate the effects of heavy rainfall was adopted in 2010 (Municipalidad Provincial de Arequipa, 2010). These mitigation plans, produced by the Municipality of Arequipa Province and the volcanic-hazards map, are examples of official documents that are assumed to be accessible to in-habitants. In practice, however, the map has rarely been dis-seminated throughout the city. This map only represents
ar-eas prone to flooding: it does not depict vulnerable arar-eas and elements at risk. The map lacks explanatory detail, for exam-ple, that the quebradas are identified by a colour showing the potential danger and not the actual extents of past flooding.
In summary, the official documents emphasize the haz-ardous sectors around the volcano but do not consider the vulnerable assets at risk (e.g. houses, bridges, hospitals). At present, there are no official maps that delineate the risks from hazardous processes. In recent years, the official
documents have been complemented by some expert advice to fulfil some essential requirements, such as identifying the location of water tanks, safety of bridges, and plans for evac-uation routes. However, this additional information is not summarized in a unique document or maps that can be ac-cessed, shared, and used by institutions in charge of risk man-agement.
3.2 Surveys and interviews
Previous work on lahar and flash flood risk in Arequipa has mainly focused on the assessment of damage to build-ings (Martelli et al., 2010). In this study, surveys and inter-views were also used to understand how city institutions deal with lahar-risk management from a general point of view. People in charge of risk management in the city of Arequipa can be divided into two groups. (1) Civil Protection represen-tatives from INDECI (Instituto Nacional de Defensa Civil) are involved in risk analysis and emergency planning. They anticipate potential damages and how to overcome them. And (2) representatives of local administrations and compa-nies (i.e. decentralized institutions) who mainly focus on pre-vention, early warning and communication. This dichotomy in the actions carried out by risk managers can be conspicu-ous when considering the actions carried out in the districts: while Civil Protection inspects the buildings, INGEMMET organizes simulations for evacuation (Macedo, 2009). These two tasks are complementary and must be incorporated into the mapping of lahar and flash-flood risks.
Interviews have been conducted with ten people in charge of risk management from the six relevant institutions (Ta-ble 2): Civil Protection (INDECI) through its national, re-gional and municipal committees, INGEMMET, City Hall, Department of Arequipa, Region of Arequipa, and SEDA-PAR (Servicio de Agua Potable y Alcantarillado de Are-quipa). The interviews with city managers were intended to measure their own risk knowledge and perception, while the results indicate how risk zoning is planned and regu-lation policy is enforced in Arequipa. Semi-directive inter-views were conducted in July–August 2010 and in February– March 2011 following the most recent flash-flood event, and each interview was complemented by a questionnaire filled out by the risk managers. Managers have been asked to com-pare lahar risk to other natural risks that may affect the city. They were also asked to provide their own perception of the threats lahars represent for the city. Records of the 2011 cri-sis were also collected from INDECI and local newspapers, including reports on casualties and damage, as well as the emergency measures used to face the floods and provide sup-port to the affected population.
The results of the interviews (Table 2) indicate that the institution managers are aware of lahar and flood risk but do not consider this issue a priority for Arequipa. Accord-ing to them, the most important hazards are earthquakes and El Misti eruptions, with flood hazards only in third position.
On 23 June 2001, a large earthquake (Mw=8.4) hit the
re-gion of Arequipa, killing 75 people and damaging at least 50 000 homes. However, the frequency of lahars and flash floods in recorded history is much higher than that of earth-quakes and volcanic eruptions, but their resulting damage is significantly less. Consequently, the risk managers attach rel-atively small importance to inundation hazards. Nonetheless, the limited attention attributed by managers to lahar risk be-lies the tasks performed by Civil Protection and other insti-tutions to anticipate lahar and flood risk.
3.3 Simulations and evacuation exercises
The efficacy of risk reduction can be measured through re-peated simulations of critical situations, such as a major earthquake. In August and November 2010, simulations were simultaneously carried out at the national scale in Peru, in-cluding Arequipa. In addition, programmes regarding flood awareness have been initiated in a few districts of Arequipa where the Civil Protection office is especially involved (Mu-nicipalidad Provincial de Arequipa, 2010). Occurrences of actual floods also provide opportunities to measure the effec-tiveness of the crisis-response system. During the February 2011 flash floods, fire and rescue teams could not reach some neighbourhoods due to the destruction of several roads. The water supply was also damaged and interrupted for one day. In April 2011, people involved in rescue operations could participate in a debriefing with the objective of sharing expe-riences between Civil Protection and affected people.
4 Evaluating lahars and floods hazard in Arequipa
The city of Arequipa has developed entirely on fluvial ter-races along the R´ıo Chili valley and on the fans and banks that have been formed by its five tributaries (Quebradas) across the city (Fig. 1). In particular, two alluvial and vol-caniclastic fans have been constructed over the past 50 yr: Huarangal-Mariano Melgar to the NE and San Lazaro to the N. Heavy rainfalls affect all quebradas as well as parts of the city located on steep terrain. Water runoff uses natural chan-nels such as the quebradas and some adjacent roads. Runoff is also conveyed through the steep and narrow streets located on the lowermost south-western slopes of El Misti.
Figure 3 shows some examples of damage generated by la-hars and mudflows in mid-February 2011 in R´ıo Chili and in Qda. Huarangal. Debris lying on the quebradas beds, from inhabitants dumping garbage and trash, were swept away by the flows. Many constructions located on steep, unstable hill slopes were destroyed or severely damaged by runoff. For the whole city, INDECI reported 629 people injured and 2568 directly affected. As many as 172 houses were de-stroyed while 576 houses were damaged, mainly in the “il-legal” suburbs located on higher slopes to the N and NE of the city. A 350-m-long segment of road was destroyed.
346 J.-C. Thouret et al.: Combining criteria for delineating lahar- and flash-flood-prone hazard
Fig. 3. Pictures showing the R´ıo Chili valley near the city centre (Puente Grau) and Qda. Huarangal in Arequipa (own work). The location of pictures (A) and (B) is provided in Fig. 5.
Fortunately, no one was killed by the flows and no strategic bridges were damaged.
4.1 Volume and return period of lahars and floods
Lahar events and deposits include both debris-flow and hyperconcentrated-flow processes. Debris-flow deposits crop out in valleys across Arequipa but cannot be assigned to specific eruptions. The one exception is a pumice-rich la-har deposit linked to pyroclastic-flow deposits produced by the Plinian eruption c. 2030 years BP (1.2 km3 of tephra-fall and pyroclastic-flow deposits: Cobe˜nas et al., 2012). Hyperconcentrated-flow deposits, consisting of sand and gravel beds, are the most abundant and recent (historical and Holocene in age) deposits in the ravines dissecting the city. The relationship between the magnitude and frequency of la-har and flood has been established from the study of lala-har and flood deposits preserved within the city area of the R´ıo Chili valley and its tributaries with additional information from the archives (e.g. newspapers, city reports, television footage) (Table 1).
Floods can occur in the R´ıo Chili valley during heavy rain-fall: at least nine damaging flood events have been recorded in the past 50 yr, e.g. 1961, 1972, 1973, 1989, 1994, 1997,
1999, 2001, and 2011. Other large, historical floods may be due to dam-lake breakouts, as lacustrine deposits underlie terraces in the upper course of the R´ıo Chili valley (in Char-cani Grande-Quinto, Fig. 1), suggesting that the upper reach of the canyon was once naturally dammed to form a lake. This prehistoric lake was formed about 2030 yr BP (14C, Martelli, 2011) at the time of the last Plinian eruption from El Misti (Harpel et al., 2011; Cobe˜nas et al., 2012). Flash floods sometimes occur in quebradas, which are normally dry but drain El Misti slopes during the rainy season be-tween November–December and March–April (annual aver-age rainfall of 150 mm). Based on a 70-yr-long record, flash floods in the R´ıo Chili tributaries may occur about twice in 10 yr (Fig. 4). Flash floods are triggered by heavy rainstorms that bring 10 to 30 mm per day to the arid landscape of Are-quipa. In the upper catchment of Qda. Huarangal, 33 mm of rain fell in 3 h on 25 February 1997, and as much as 126 mm of rain fell in 10 days in early February 2011, with a maxi-mum of 19.2 mm day−1. Rainfall may last a few hours over 2 to 5 days during which up to 10 mm h−1fall on dry soil and loose debris in gravel channels or on anthropogenic in-fill. Unfortunately, these unstable areas are also where poor-quality housing is located.
Table 2. Summary of interviews with institutes, civil authorities and agencies in charge of lahar- and flood-risk management. Each line of the table corresponds to a single interview with a risk manager who compared lahar risk with other risks posed by natural hazards (e.g. volcanic eruptions, earthquakes, landslides, drought and climate change).
Institution Service Role in lahar and
flash flood zoning
Lahar risk
Lahar threat
Main tasks performed for risk management
INDECI Civil Protection
operations
Identification of at risk areas
Fair Very
low
Risk analysis, early warning system, coordination with other institutions, simulations
INDECI Civil Protection
prevention units
Identification of safe areas and evacuation routes
Low Low Risk analysis, activation of an emergency group, estimation of damages
Arequipa Region Environmental authority
No High High Coordination with other
institutions Arequipa Province Risk management Consulting for the
elaboration of local management plans
Low Fair Simulations, information to the population
Arequipa Province Civil Protection No High Fair Information to the population
Mariano Melgar District Civil Protection Planning at the district level
Very high
Very low
Simulations, information to the population
Paucarpata District Civil Protection Evaluation of at risk areas
Fair Low Simulations, information to the population Firemen Corps Command centre Identification of at
risk areas
High Fair Risk analysis, emergency planning and scenarios, estimation of damages INGEMMET Communication Creation of risk maps Fair High Early warning system, simulations, information to the population and the authorities
SEDAPAR Human-resources
management
Identification of water resources
Low Low Information to the engineers and the authorities
NGO PREDES Social promotion Identification of safe and at risk areas
Very high
Fair Early warning system, simulations, information to the population
4.2 Hazards mapping and modelling
We outline hazard zones along the valley of R´ıo Chili, Qda. San Lazaro and Qda. Hurangal-Mariano Melgar on the basis of the morphology of the floodplains, terraces and fans sur-rounding the channels. Lahar paths are determined by past la-har flows that have shaped the existing quebradas. The dura-tion and intensity of cumulative precipitadura-tion on the El Misti volcano and surrounding mountains, Chachani and Pichu Pichu, will determine the impact of a flood of non-volcanic origin (Vargas-Franco et al., 2010). Factors such as dams or the clearing out of the valley channel can lessen the conse-quences of a flood. However, other factors may worsen the situation, whether they are permanent (i.e. urbanization of the channels), or temporary (i.e. rock falls or landslips) that
can form unstable, natural dams in the R´ıo Chili canyon up-stream of the city. Artificial lakes, such as Aguada Blanca and El Frayle, which dam the R´ıo Chili canyon and its trib-utary R´ıo Blanco north of El Misti (Fig. 1), may also fail in case of an earthquake and landslide. Fortunately, these facil-ities and infrastructure did not fail during the major earth-quake Mw=8.3 (USGS) that struck Arequipa, Caraveli, and
Moquegua on 23 June 2001.
Our mapping is based on GIS techniques using the results of multidisciplinary studies (Delaite et al., 2005; Vargas-Franco et al., 2010; Martelli, 2011; Santoni, 2011). Seven stages or terraces have been identified: the channel bed T0 (< 1 m above the river) and the terraces T1 (2–3 m high), T1’ (3–4 m high), T2 (4–5 m high), T2’ (5–10 m high), T3 (10–15 m high) and T4 (15–30 m high). Terraces and fans
348 J.-C. Thouret et al.: Combining criteria for delineating lahar- and flash-flood-prone hazard
Fig. 4. Adjustment of maximum annual flood for the R´ıo Chili using a Gumbel distribution (after Martelli, 2011). The figure allows us to determine the maximum annual flood discharge and recurrence intervals (2, 5, 20, 50 and 100 yr) in the R´ıo Chili.
that exceed 30 m above the valley bottom are not likely to be flooded under the current climatic conditions.
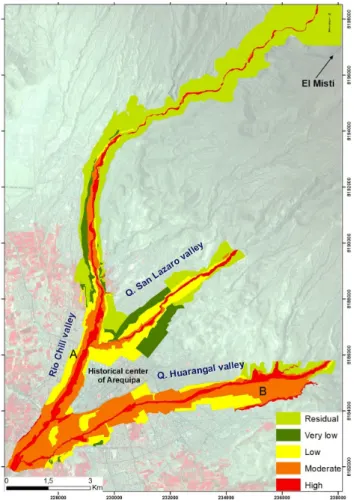
Likely scenarios for flooding and lahars include five haz-ard severities based on terrace groups as defined in Table 3 and depicted for the whole city of Arequipa in Fig. 5. The terrace groups include the following. (1) The flood-plain and T0 of the R´ıo Chili valley (≤ 1 m deep), which are flooded at least once every year in the rainy season: the maximal annual discharge (“normal” river flow) reaches about 50 m3s−1, while the average daily discharge can be as low as 10–15 m3s−1 (given the fact that discharge is artificially controlled upstream). (2) The T1 terraces are flooded once in 2- to 5-yr time intervals: the river dis-charge ranges between about 50 and 100 m3s−1. The T1 ter-races may also be inundated by lahars whose volume does not exceed 0.5 million m3. (3) The T1’ and T2 terraces are rarely flooded, once in 20 to 50 yr on average. In such cir-cumstances, flood discharge would range between 100 and 150 m3s−1, while the lahar average volume would range be-tween 0.5 and 1.5 million m3. (4) The T2’ terrace is rarely flooded, with discharges between 230 and 260 m3s−1, oc-curring about once in 50 to 100 yr on average. The T2’ terrace would be inundated by large but infrequent dam-breakout floods, 10 m in height, or by lahars whose volume could be 1.5 to 4 million m3 with a ≥ 100-yr return period (Delaite et al., 2005; Vargas-Franco et al., 2010). (5) The T3 terrace would only be flooded by voluminous lahars linked to a sizeable volcanic eruption (> VEI3, i.e. volume of de-posits ≥ 1 km3). The volume of syn- or post-eruption lahars could exceed 4 million m3. The most recent sizeable volcanic eruption (> VEI3) at El Misti occurred about 2030 yr ago (Thouret et al., 2001; Harper et al., 2011; Cobe˜nas et al., 2012).
Fig. 5. Lahar-prone areas in the city of Arequipa. Hazard level (HL) includes five classes according to Table 3. Letters A and B refer to the places where pictures in Fig. 3 were taken.
Figure 5 shows the areas that potentially could be affected by lahars and flash floods in the city of Arequipa, along the R´ıo Chili valley, Qda. Huarangal (NE) and Qda. San Lazaro north of the city. Mapping flash floods and lahar hazard zones is different from other volcanic-hazard zoning as lahars and floods are usually confined to valleys, i.e. along the R´ıo Chili valley across the city and the two main quebradas. However, Fig. 6 shows that overbank flooding can occur along the gen-tly sloping R´ıo Chili valley, in particular on the left bank (T1 and T1’) near the city centre, e.g. in 1989, and upstream of the confluence with R´ıo Andamayo, e.g. as in 2011. As a re-sult, for some city blocks (e.g. in 1989), crops and recreation areas (e.g. as in 2011) can be damaged.
4.3 Hazard and land use
When a lahar occurs, the material density and flow speed are critical characteristics, which generate a dynamic over-pressure on buildings, bridges and/or lifelines in the city (Zanchetta et al., 2004). As a result, the observed dam-age results from the dynamic pressure generated by the flow.
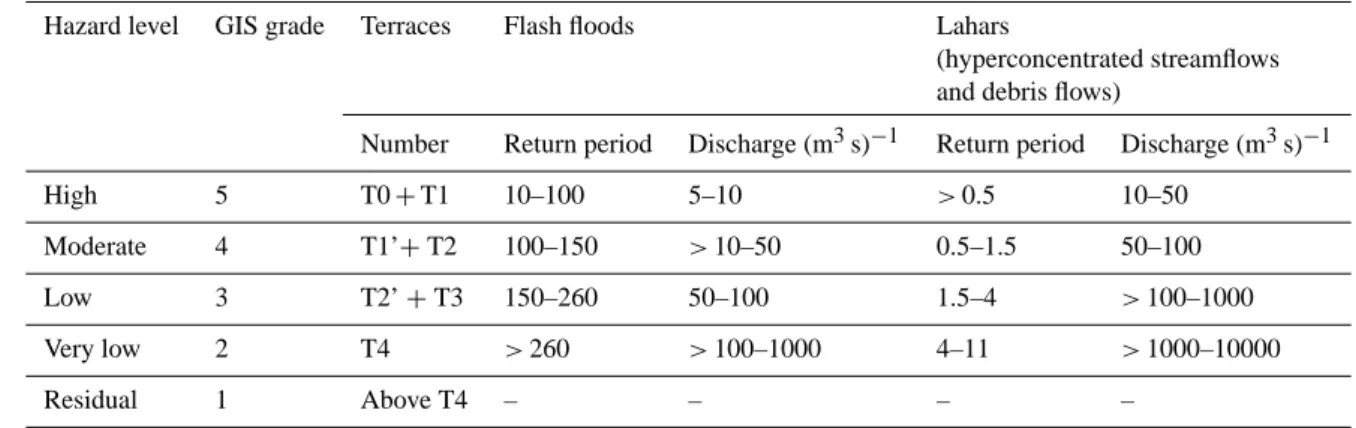
Table 3. Measuring hazard parameters at the city-block scale. Hazard levels resulting from the delineation of terraces (height above channel and return period) are represented in Fig. 5.
Hazard level GIS grade Terraces Flash floods Lahars
(hyperconcentrated streamflows and debris flows)
Number Return period Discharge (m3s)−1 Return period Discharge (m3s)−1
High 5 T0 + T1 10–100 5–10 >0.5 10–50
Moderate 4 T1’+ T2 100–150 >10–50 0.5–1.5 50–100
Low 3 T2’ + T3 150–260 50–100 1.5–4 >100–1000
Very low 2 T4 >260 >100–1000 4–11 >1000–10000
Residual 1 Above T4 – – – –
Fig. 6. Terraces in the city centre of Arequipa. This figure shows the system of terraces in the centre of Arequipa, from river channels to fan terraces. The delineated terraces are completed with land use types identified on each of the banks of R´ıo Chili (see Fig. 7).
Dynamic pressure depends on flow velocity, flow density and on the resistance of the building or urban infrastructure (material, cement, structure, etc.). The resistance of housing and infrastructure (bridges, roads, lifelines, etc.) is variable
according to the nature of the flows; i.e. the velocity of a hyperconcentrated streamflow is rapid but its density will re-main lower than that of a debris flow. However, the effect of the lahars and floods also depends on the location of hous-ing and bridges with respect to the channel bed and lahar flow. For instance, an embankment may change the height and speed of the flow. The 1989 decadal flood of R´ıo Chili (discharge on the order of 200 m3s−1) shows that the terrace T1’, located 3 to 4 m above the river bed on the left bank near the city centre, can be extensively flooded. Flooding on the left bank can be favoured by the recent bridge below the colo-nial “Grau”, which is vulnerable owing to its low strength and table only 4 m above the river bed.
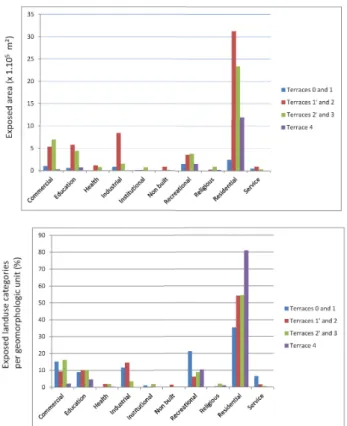
Figure 7 indicates that the historical centre of Arequipa is bounded by the banks of the R´ıo Chili and quebradas San Lazaro and Huarangal. The banks of the valleys host peren-nial activities. For instance, the main power plant of the city is located on the terrace T1’–T2 of the R´ıo Chili, 3 km up-stream from the city centre. Residential and recreational ac-tivities take place on most of the lowest terraces (T0 and T1) and a large part of the highest ones (T1’ to T4). Most industrial and commercial activities are located downstream from the city on intermediate terraces (T1’ to T3). Such loca-tion and exposure of land-use types and businesses near the riverbeds are therefore a source of vulnerability in case of flooding.
5 Evaluating vulnerability and exposure to lahars and floods in Arequipa
This section considers the vulnerability of the city based on both physical and socio-economic components. The magni-tude of risk is added to these usual components by measuring how much a given city block can become isolated from vital resources in the case of a crisis. Relevant data used in our evaluation derive from the official land-use planning of Are-quipa (Municipalidad Provincial de AreAre-quipa, 2002), book-lets from risk-management institutions belonging to the Civil
350 J.-C. Thouret et al.: Combining criteria for delineating lahar- and flash-flood-prone hazard
Fig. 7. Exposure of at-risk land-use types along the R´ıo Chili val-ley, according to the height of the terrace above the channel (after Vargas-Franco et al., 2010, modified). The delineation of terraces is based on the hazard-zone map shown in Fig. 6. The census of activ-ities is based on field surveys and aerial surveys using Google Earth Pro™.
Protection agencies, and aerial surveys using Google Earth Pro™.
5.1 Physical vulnerability
The evaluation of physical vulnerability is based on the char-acteristics of buildings. Three principal criteria are taken into account: (1) the size of the buildings, a high building be-ing less vulnerable to floods; (2) the quality of construction; and (3) the population density. Although population density strictly speaking is not a building characteristic, such data help to make physical vulnerability also reflect overall vul-nerability. Two types of indexes are computed: (1) a building vulnerability index (BuV), which is obtained by the com-bination of the characteristics mentioned above, and (2) a residential vulnerability index (RvI) resulting in a discrete scale of residential vulnerability index (RvI). The details of the computations is given in Table 4.
The five classes of residential vulnerability index are rep-resented in Fig. 8 for the entire city of Arequipa. This map extends previous works performed in pilot areas (Martelli et al., 2010). Thanks to the surveys made by the Civil
Protec-Fig. 8. Map of the residential vulnerability in Arequipa. The res-idential vulnerability index (RvI) comprises five classes (see Ta-ble 4). The scale of original data (city block) ensures a high level of precision. Using this general map, one can focus on specific areas without any additional computation.
tion offices, the precision of this analysis now pertains to the block scale. The results shown in Fig. 8 exhibit roughly con-centric zones around Yanahuara district (west bank of R´ıo Chili), where buildings are newer and made of more-resistant materials, and the city centre (east bank), which is composed of mostly historic buildings of weaker construction. Start-ing from the centre, vulnerability increases outward and at-tains its highest level in the outskirts of the city. These sub-urbs usually host “unofficial” housing sites for newcomers from rural areas. The migrant populations have chosen such neighbourhoods by default, simply because they constitute the only available affordable space to build a house, usu-ally made of the least-expensive, weak materials. In addition, these poorly-built suburbs are among the most densely popu-lated in the city (e.g. 10 432 inhabitants per km2in Alto Selva Alegre and 9100 in Yanahuara in 2007).
5.2 Socio-economic vulnerability
The physical vulnerability of housing has been then com-bined with socio-economic criteria to give an indication of both physical and social vulnerability. Because of the lack
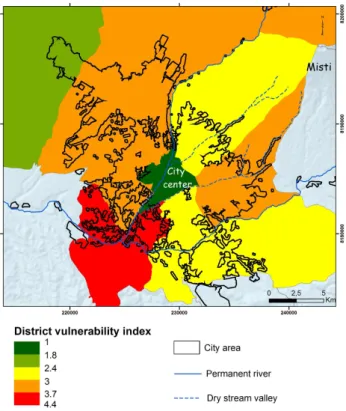
Fig. 9. Map of the socio-economic vulnerability in Arequipa. Socio-economic vulnerability index (SEvI) comprises five classes (see Ta-ble 5). Due to the scale of original data (city district), this map is less precise than the others maps obtained from this research.
of data at the scale of city blocks, the criteria are defined at the scale of city districts. A socio-vulnerability (SEvI) index has been computed which combines unemployment rates, the quality of public services and the lack of schools with an equal weight (Table 5). The final vulnerability index (SEvI) is made up of five classes for which each criterion has been weighted on an equal basis.
Figure 9 shows the distribution of the socio-economic vul-nerability index for the entire city. Because of data limita-tions, the map is depicted at the district scale, while all other maps considered in this analysis are drawn at the city-block scale. Despite this poorer precision, much can be learned about the extent and location of poverty in the city. Socio-economic vulnerability is quite low in the city centre due to commercial and touristic activities, which generate sus-tained economic activity. Outside the city centre livelihood conditions are more precarious. Despite the relatively crude scale of the map, a correlation between the quality of build-ings (Fig. 8) and the living standard of the population can be observed. The distance to the city centre appears propor-tional to the density and inversely proporpropor-tional to people’s vulnerability. Populations living along the quebradas gener-ally have a lower level of income and education than those in other districts (Municipalidad Provincial de Arequipa, 2002). The districts and suburbs of the city located on the upper
part and the most recently built fans (e.g. Alto Selva Ale-gre, Alto Misti and Alto Grau), and on the lower flanks of El Misti (e.g. Alto Belen upstream of Mariano Melgar) are the poorest areas.
5.3 Evaluating exposure: the “isolation” factor
To overcome the inadequacy of available socio-economic data, “isolation” of districts and blocks has been analysed. “Isolation” is a measure of exposure which reflects the un-equal exposure of the population towards risk and its unun-equal access to vital resources such as “safe” areas, hospitals or drinking water (Cannon, 1993). This issue becomes crucial during a crisis and disaster, as people need to be evacuated or rescued in a short amount of time. As a result, people lo-cated in very hazardous areas but close to resources may be less affected by damaging lahars and floods without resulting in high harm or death. Conversely, people, even if relatively safe from hazards, may suffer from their indirect impact if they lack or lose access to potable water (McEntire, 2001).
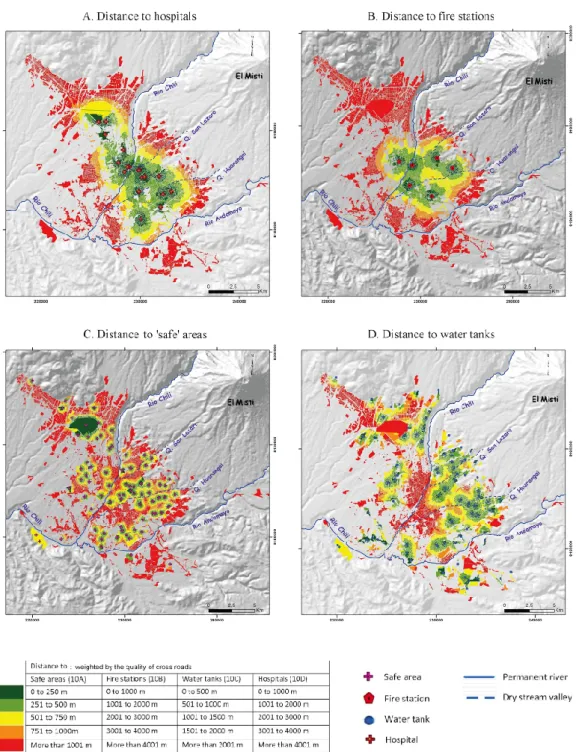
In the case of an emergency, the distance between the pop-ulation and exposed resource elements and “safe” areas plays a major role in saving lives (Tatham and Kovacs, 2007). Therefore, isolation is measured in terms of distance from vital resources. Table 6a summarizes the indicators used to compute a “global” isolation index (II) based on (i) distance to hospitals (Fig. 10a) and fire stations (Fig. 10b), which rep-resents immediate needs; (ii) distance to “safe”, large and open areas (Fig. 10c), either stadiums or car parks, that can be used for shelters; and (iii) distance to water tanks (Fig. 10d), if access to running water is disrupted. The “distance” maps reveal major inequalities in ease of rescue in the case of a crisis. For instance, most medical centres are located in the city centre (Fig. 10a). The populations located in the sub-urbs of the city, especially in the upper reaches of the
que-bradas, cannot easily access hospitals or even dispensaries.
Combined with a lack of nearby fire stations (Fig. 10b), this situation makes it necessary to identify safe areas where mo-bile rescue units can be deployed in case of floods and lahars. In contrast with the entire city of Arequipa, which is di-rectly and widely exposed to volcanic hazards, many districts are protected from flash floods outside the quebradas and El Misti slopes (Fig. 5). In these districts the identification of potential “safe areas” allows a response unit to be provided to the population in the flood-prone districts. Figure 10c in-dicates all safe areas that have been identified in the city of Arequipa. The map shows a rather uniform distribution, al-though many districts located outside the city centre (mainly north and south) lack safe areas. These areas should be lo-cated outside of the quebradas but close to them in order to host small command units and temporary shelters as well as to facilitate the distribution of emergency relief. They should be easily converted in the case of emergency to provide basic needs to the population. For instance, parks, playgrounds and sport fields are free from buildings and can easily serve as
352 J.-C. Thouret et al.: Combining criteria for delineating lahar- and flash-flood-prone hazard
Fig. 10. Distances to hospitals, “safe” areas and water tanks in Arequipa. The figures represent the measure of isolation at the block scale including hospitals (A), fire stations (B), and “safe” areas such as parks and playgrounds (C) and water tanks (D). The resources (hospitals, etc.) were identified using field and aerial surveys. The distance includes five classes for each indicator (see Table 6a). The distance also takes into account the road conditions (Table 6b).
emergency-shelter areas. Also, large sporting facilities such as football stadiums and sports clubs (e.g. Arequipa’s Melgar team stadium) as well as the airport area meet these criteria. However, safe areas can only be used if they remain accessi-ble by road from other parts of the city.
People can also become isolated if they lack resources such as water during a crisis. As much as 90 % of the city of Arequipa is connected to running water, which is sup-plied by the R´ıo Chili catchment. Facing the risk of a water shortage, the company termed SEDAPAR in charge of water supply decided in 2010 to launch an audit. The aim was to
Table 4. Evaluating building vulnerability. Building vulnerability (BuV) is defined as a multiplicative function of the size, the quality of con-struction of buildings and the population density. Data stems from the official urban-planning scheme of Arequipa (Municipalidad Provincial de Arequipa, 2002). The data precision is at the city-block scale. To obtain a discrete indicator, five classes of residential vulnerability (RvI) were created. Classes take into account how skewed distributions can be generated by multiplication. The map of building vulnerability for the whole city of Arequipa is shown in Fig. 8.
Name Data used Sources Calculation Scale of
observation Building size Number of storeys Municipalidad Provincial de Arequipa (2002) Ranked from 1 to 4: 4 storeys and more = 1 3 storeys = 2 2 storeys = 3 1 storey = 4 City block Building conservation Expert knowledge Municipalidad Provincial de Arequipa (2002) Ranked from 1 to 3: Good maintenance = 1 Medium maintenance = 2 Bad maintenance = 3 City block Population density
Census Municipalidad Provincial de Arequipa (2002) Ranked from 1 to 4: High = 1 Medium = 2 Low = 3 Very low = 4 City block Building vulnerability index (BuV)
BuV: Building size X Building quality of construction X Popu-lation density City block Residential vulnerability index (RvI) Index from 1 to 5: RvI=1 if BuV=1 to 3 RvI=2 if BuV=4 to 6 RvI=3 if BuV=7 to 12 RvI=4 if BuV=13 to 24 RvI=5 if BuV=25 to 48 City block
Table 5. Evaluating the socio-economic vulnerability. The measure of socio-economic vulnerability is carried out at the district scale, which is the lowest administrative division in Arequipa. However, this scale offers much less precision than that for the city-block scale. Original data (unemployment, access to public services, and inadequate number of schools) is fitted to build a global vulnerability index (SEvI) scaled from 1 to 5. The map of socio-economic vulnerability for the whole city of Arequipa is shown in Fig. 9.
Name Data used Sources Calculation Scale of
observation Unemployment
( %U)
Census Municipalidad Provincial de Arequipa (2002)
Original data between 8.1 % and 13.3 % Fitted index: Iu = 0.77*( %U) − 5.23
District
Service sector ( %Ss)
Census Municipalidad Provincial de Arequipa (2002)
Original data between 30.4 % and 81.3 % Fitted index: Iss = −0.0786*( %Ss) + 7.39
District
Inadequate number of schools ( %Ns)
Census Municipalidad Provincial de Arequipa (2002)
Original data between 0 % and 56.73 % Fitted index: Ins = 0.07*( %Ns) + 1
District
District vulnerability index (SEvI)
From 1 (low vulnerability) to 5 (high vulnerability) SEvI = (Iu + Iss + Ins)/3
District
identify all the wells and water tanks across the city and to evaluate their capacity for the basic needs of the population. The results have yielded a strategic document at city scale, which showed that each district could receive enough water for many days in case of a disruption of water supply from
the principal R´ıo Chili catchment. Yet the location of water tanks in case of disruption shows a heterogeneous distribu-tion of this facility throughout the city (Fig. 10d). Blocks located near the boundaries of the city, in particular on the sloping piedmonts that ring El Misti, benefit by being close
354 J.-C. Thouret et al.: Combining criteria for delineating lahar- and flash-flood-prone hazard Table 6a. Evaluating the “isolation” factor (see text for discussion). The measurement of “isolation” has been carried out at the city-block scale. All variables are divided into five classes and mapped (Fig. 10). For the computation of overall isolation (Table 6a), a weighting factor equal to 1 is assigned to critical facilities such as hospitals, fire stations and safety areas, while a weighting factor equal to 0.5 is assigned to non-essential facilities such as water tanks. The map of “isolation” for the whole city of Arequipa is shown in Fig. 11. Starting from the computation of the isolation index (II), the mapping takes into account road conditions and natural constraints (rivers and bridges). Poor road conditions result in additional travel time to facilities and an increase in isolation (Table 6b).
Computation of isolation
Name Data used Sources Calculation Scale of
observation Distance to hospitals
(DH)
Public and large private hospitals Google Maps™ (2011), Gobierno Regional de Arequipa (2007), Municipalidad Provincial de Arequipa (2002)
From 1 to 5: A class each 1000 m. Elaborated with ArcGIS’s Spatial Analyst using a road cost raster
City block
Distance to fire stations (DFS)
Fire stations Cuerpo General de Bomberos Voluntarios del Per´u (2012)
From 1 to 5: A class each 1000 m. Elaborated with ArcGIS’s Spatial Analyst using a road cost raster
City block
Distance to safety areas (DSA)
Stadiums and car parks, surface > 3500 m2
Google Earth Pro™ (2011) From 1 to 5: A class each 250 m. Elaborated with ArcGIS’s Spatial Analyst using a road cost raster
City block
Distance to water tanks (DWT)
Water tanks Google Earth Pro™ (2011) From 1 to 5: A class each 500 m. Elaborated with ArcGIS’s Spatial Analyst using a road cost raster
City block
Isolation index (II)
From 1 (low isolation = short distance) to 5 (high isolation = long distance). Multiple criteria analysis:
−Vital facility: weighting factor 1 −Other facility: weighting factor 0.5 Formula: II
=(DH+DFS+DSA+1/2xDWT)/3.5
City block
Table 6b. Road conditions. Starting from the computation of the isolation index (II), the mapping takes into account road conditions and natural constraints (rivers and bridges). Poor road conditions result in additional travel time to facilities and an increase in isolation.
Road conditions
Road type Criteria Weigh coefficient
Type 1 Major roads. 1 m = 1
Type 2 Good, large and paved streets. 1 m = 1.5
Type 3 Half paved and half dirt (or gravel road). Well graded and maintained. 1 m = 1.7 Type 4 Gravel road or dirt road, sometimes with slope. Badly or even not graded. 1 m = 1.9 Type 5 Out of the city, connection with remote houses. 1 m = 2.1
Bridges 1 m = 3
Rivers Cannot be crossed without bridges
to the reservoirs, even though they do not have any access to running water. In contrast, the city centre, which has running water, appears to be more vulnerable to a water shortage, should the R´ıo Chili water system be disrupted.
The four categories of indicators (distance to hospitals, fire stations, safe areas and water tanks) that have been taken into account exhibit a contrasted isolation for each city block. The details of the computing of the overall isolation index (II) is presented in Table 6. The evaluation of the isolation index takes into account road conditions, as distances can be mea-sured in kilometres and time (D’Ercole and Metzger, 2004). While major roads are paved and remain usable during heavy
rainfall, dirt roads may delay or even hinder evacuations. The key role of bridges was accounted for as they can be closed, damaged or destroyed by a lahar. Isolation at city scale is given by Fig. 11 and reveals an obvious gap between the cen-tre and the periphery. In general, the city cencen-tre benefits from good access to vital resources (health centres and evacuation areas), even though R´ıo Chili and Qda. San Lazaro and Qda. Huarangal crisscross it. The density of bridges and the qual-ity of road pavement allows people to overcome this natural constraint, but the inner part of Arequipa is vulnerable to wa-ter disruption. In contrast, all blocks located in suburbs in the
Table 7. Evaluating the overall vulnerability. This table provides the calculation of the population vulnerability index (PVI), which combines residential vulnerability, socio-economic vulnerability and the isolation index. The overall measure is provided at the city-block scale, although the socio-economic vulnerability is computed at the district scale. Figure 12 shows a map representing PVI.
Name Calculation Scale of observation
Population vulnerability index (PvI) PvI= (II + RvI + SEvI/10)/2,1 or PvI = (II +SEvI/10)/1,1 for city blocks with no residential buildings
City block
Table 8. Evaluating the risk level based on hazard level and overall population vulnerability. This table provides an overall measure of flood and lahar risk for the city of Arequipa. The lahar risk level (LRL) is the combination (using an equal weight) of the hazard level calculated in Table 3 and the population vulnerability index calculated in Table 7. Starting from its elaboration, LRL only concerns the banks of the rivers and the quebradas that cross Arequipa. Figure 13 shows the resulting map for the whole city and Fig. 14 for Quebrada San Lazaro.
Name Calculation Scale of observation
Hazard level (HL) From 1 to 5 (Table 3) City block
Population vulnerability index (PvI) From 1 to 5 (Table 7) City block Lahar risk level (LRL) If PvI=0, LRL=0
If PvI > 0 and HL≤1, LRL=1 If PvI > 0 and HL > 1, LRL=(PvI+HL)/2
City block
periphery are quite landlocked with poor access to vital fa-cilities such as hospitals, with the exception of water supply.
5.4 Overall vulnerability
By combining data from building vulnerability, socio-economic vulnerability and exposure to hazards, an over-all vulnerability index (PvI) has been created. Indicators of physical vulnerability and isolation are included in the formulae with an equal weight, while socio-economic pa-rameters are underweighted for scale reasons (Table 7). A scale of overall population vulnerability from 0 to 5 (PvI: Fig. 12) has been computed. The overall vulnerability map reinforces the results obtained by using the isolation in-dex (Fig. 11), and in particular the contrasting situation be-tween the city centre and the suburbs is emphasized. Vul-nerability increases with distance from the city centre. Ar-eas located in recent and remote suburbs near the boundaries of the city, on the upper banks of the quebradas and in the northern part of the city are the most vulnerable. Poor qual-ity of housing, lack of education, high unemployment rates and isolation from vital resources characterize these neigh-bourhoods.
6 Defining and outlining risk areas
Finally, the lahar and flood risk maps (Figs. 13 and 14) have been prepared at the city scale, in order to encompass the R´ıo Chili valley and all quebradas across the districts that
are threatened by lahars and flash floods. These maps show the degree of risk that each city block of the city faces from lahars and flash floods. They also outline areas at risk in case of heavy rainfall.
6.1 Definition and results
The method for computing risk is described in Table 8. The lahar risk level (LRL) has been defined as the combina-tion (using an equal weight) of the hazard level calculated in Table 3 and the population vulnerability index calculated in Table 7. As with the case for hazards and vulnerability, the risk scale is defined from 0 to 5. This measure of the risk level using an averaging of both hazard and vulnerability attributes the same weight to hazard and vulnerability in the computa-tion of the risk level. The lahar risk level also presents the advantage of making a non-zero risk appear as soon as the land is populated. Such residual risk takes into account the possibility of water runoff in the streets, even outside of the
quebradas in the case of heavy rainfall (e.g. in 2011).
Figure 13 presents the resulting lahar- and flood-risk map at the city scale and for each block. Areas at risk are obvi-ously located along the main valleys that cut the city, with the city centre contrasting with the suburbs. Many poor dis-tricts located in relatively isolated areas on the lower vol-cano flanks are safe from lahars (but not from heavy runoff), whereas wealthier districts located near the city centre and close to the valley channels on low terraces are at risk. The principal areas at risk are located along Qda. San Huarangal,
356 J.-C. Thouret et al.: Combining criteria for delineating lahar- and flash-flood-prone hazard
Fig. 11. Map showing the combined “isolation” of the population in Arequipa. The overall isolation index (II) comprises five classes (see Table 6a). The map takes into account road conditions (Ta-ble 6b). The scale of original data (city block) results in a high level of precision.
both in its upper reaches and at its confluence with R´ıo Chili. The high-risk areas mostly correspond to new and precarious “illegal” settlements, situated upstream on the formerly non-built areas on the volcano slopes and down valley in former agricultural areas. Along the entire Quebrada reaches and on both banks, an area 1 km across is moderately exposed to la-har risk. Some residential areas located in R´ıo Chili, such as Obrero (terrace T1’, downstream from the Grau bridge) are also among the most dangerous areas. A lot of strategic infrastructure located in the R´ıo Chili valley is also in areas at risk: (1) the main water intake located in the upper R´ıo Chili valley (Fig. 1) and (2) the principal power plant of the city on terrace T1’–T2 located on the left bank of the river. The wa-ter intake may be damaged or destroyed in the case of a 5- to 10-yr return event, while the power plant may be damaged in case of a 50-yr return event. Quebrada San Lazaro is also at risk from lahars and flash floods (Fig. 14), with the exposed area reaching 1 km between banks; this is less extensive than the wide fan of Quebrada Huarangal. However, the 5- to 10-m-deep channel means that the risk is much lower: the entire valley (located on terrace T3) may be severely damaged in
Fig. 12. Map of the overall population vulnerability in Arequipa. The overall vulnerability index comprises ofive classes according to Table 7 (PvI). The scale of original data (city block) results in a high level of precision.
the case of rare but intense events (return period > 150 yr) rather than smaller events. The population living near the Qda. San Lazaro is vulnerable because fire stations and hos-pitals are far away. In addition, a small number of safe ar-eas only can be converted into shelters or evacuation centres across this area, which could pose a complex logistical prob-lem in case of crisis.
Figures 13 and 14 allow us to better visualize where the areas at risk from lahar impacts are located in the city of Are-quipa. However, the maps have the drawback of not linking lahars with their origin (e.g. intense rainfalls), whose con-sequences are also critical. For instance, heavy rainfall may cause damage to roads, which may disable rescue units. Be-tween 10 and 16 February 2011, rescue units could not access all districts because many roads were destroyed. Therefore, Figs. 13 and 14 must not belie the fact that all districts lo-cated outside the valleys and the quebradas (e.g. on the lower slopes of El Misti) may also remain at risk in case of heavy rainfall.
Fig. 13. Areas prone to lahar and flood risk in Arequipa. Areas prone to lahar and flood risk have been divided into five classes according to Table 8 (LRL). The scale of original data (city block) ensures a high level of precision. The figure takes into account flood and lahar risk only; hence only the river and Quebrada channels are at risk.
6.2 Recommendations for disaster prevention and risk management in Arequipa
The detailed risk maps (Figs. 13 and 14) can be compared with existing documents such as the official risk map for heavy rainfall and floods (Municipalidad Provincial de Are-quipa, 2010). While the strength of land-use planning lies in identifying riverbanks, bridges and dikes at risk, the official map does not provide socio-economic data related to risk. Our approach offers precise information at the city-block and district scale, identifying areas that need to receive attention on a priority basis because their inhabitants are at high risk. The maps clearly indicate that existing official maps and documents should be updated. In addition to the nature and consequences of natural hazards, emergency plans must also consider the population’s vulnerability in addition to hazard levels. The current encroachment of the city towards more hazardous areas (Fig. 1) makes this task a high priority, be-cause new settlements near the boundaries of the city are
Fig. 14. Areas prone to lahar risk in the Quebrada San Lazaro; this map is an enlargement of Fig. 13.
poorly built and do not have any access to basic facilities in the case of an emergency.
Based on risk maps provided in this study and lessons gained from the management of the recent Ubinas erup-tion (Rivera et al., 2010), five categories of prevenerup-tion plan-ning measures can be recommended:
1. Prohibit any further construction on El Misti’s south-western flanks within 10 km and quebradas within 15 km of the summit. The municipal ordinance N.658 (15 November 2010), which relies on the volcanic-hazard-zone map published by several research institutes in 2007 (Mari˜no et al., 2007), should be enforced in practice: new settlements may not be established in the flood- and lahar-prone areas, i.e. river channels, low terraces, and on steep slopes. Even after the heavy rain-fall in February 2011 and its aftermath on Arequipa’s suburbs, many inhabitants reconstructed their houses in the most dangerous areas (e.g. Quebrada Huarangal). The ravines are also used for disposal of garbage and other waste, notably contributing to increased flood volume and impacts.