HAL Id: hal-02550869
https://hal.inrae.fr/hal-02550869
Submitted on 22 Apr 2020
HAL is a multi-disciplinary open access archive for the deposit and dissemination of sci-entific research documents, whether they are pub-lished or not. The documents may come from teaching and research institutions in France or abroad, or from public or private research centers.
L’archive ouverte pluridisciplinaire HAL, est destinée au dépôt et à la diffusion de documents scientifiques de niveau recherche, publiés ou non, émanant des établissements d’enseignement et de recherche français ou étrangers, des laboratoires publics ou privés.
Distributed under a Creative Commons Attribution - NonCommercial| 4.0 International License
scenarios is correlated with carbohydrate metabolism in
meristems
Florence Volaire, Annette Morvan-Bertrand, Marie-Pascale Prud’homme,
Marie-Lise Benot, Angela Augusti, Marine Zwicke, Jacques Roy, Damien
Landais, Catherine Picon-Cochard
To cite this version:
Florence Volaire, Annette Morvan-Bertrand, Marie-Pascale Prud’homme, Marie-Lise Benot, Angela Augusti, et al.. The resilience of perennial grasses under two climate scenarios is correlated with carbohydrate metabolism in meristems. Journal of Experimental Botany, Oxford University Press (OUP), 2020, 71 (1), pp.370-385. �10.1093/jxb/erz424�. �hal-02550869�
Journal of Experimental Botany, Vol. 71, No. 1 pp. 370–385, 2020
doi:10.1093/jxb/erz424 Advance Access Publication September 26, 2019
This paper is available online free of all access charges (see https://academic.oup.com/jxb/pages/openaccess for further details)
© The Author(s) 2019. Published by Oxford University Press on behalf of the Society for Experimental Biology.
This is an Open Access article distributed under the terms of the Creative Commons Attribution Non-Commercial License (http://creativecommons.org/licenses/ by-nc/4.0/), which permits non-commercial re-use, distribution, and reproduction in any medium, provided the original work is properly cited. For commercial re-use, please contact journals.permissions@oup.com
RESEARCH PAPER
The resilience of perennial grasses under two climate
scenarios is correlated with carbohydrate metabolism in
meristems
Florence Volaire1,*, , Annette Morvan-Bertrand2, Marie-Pascale Prud’homme2, Marie-Lise Benot3,4,
Angela Augusti3,5, Marine Zwicke3, Jacques Roy6, Damien Landais6, and Catherine Picon-Cochard3 1 INRA, USC 1338, CEFE UMR 5175, 1919 route de Mende, 34293 Montpellier Cedex 5, France
2 Normandie Univ, UNICAEN, INRA, EVA, 14000 Caen, France
3 UCA, INRA, VetAgro Sup, UMR 874, 63000 Clermont-Ferrand, France
4 INRA and Université de Bordeaux, UMR 1202 BIOGECO33610, 33610 Cestas, France 5 CNR-Institute of Research on Terrestrial Ecosystems, 05010 Porano (TR), Italy
6 CNRS, UPS 3248, Ecotron Européen de Montpellier, 34980 Montferrier-sur-Lez, France
* Correspondence: florence.volaire@cefe.cnrs.fr
Received 9 May 2019; Editorial decision 6 September 2019; Accepted 10 September 2019 Editor: Christine Foyer, University of Birmingham, UK
Abstract
Extreme climatic events (ECEs) such as droughts and heat waves affect ecosystem functioning and species turnover. This study investigated the effect of elevated CO2 on species’ resilience to ECEs. Monoliths of intact soil and their
plant communities from an upland grassland were exposed to 2050 climate scenarios with or without an ECE under ambient (390 ppm) or elevated (520 ppm) CO2. Ecophysiological traits of two perennial grasses (Dactylis glomerata
and Holcus lanatus) were measured before, during, and after ECE. At similar soil water content, leaf elongation was greater under elevated CO2 for both species. The resilience of D. glomerata increased under enhanced CO2 (+60%)
whereas H. lanatus mostly died during ECE. D. glomerata accumulated 30% more fructans, which were more highly polymerized, and 4-fold less sucrose than H. lanatus. The fructan concentration in leaf meristems was significantly increased under elevated CO2. Their relative abundance changed during the ECE, resulting in a more polymerized
as-semblage in H. lanatus and a more depolymerized asas-semblage in D. glomerata. The ratio of low degree of polymeriza-tion fructans to sucrose in leaf meristems was the best predictor of resilience across species. This study underlines the role of carbohydrate metabolism and the species-dependent effect of elevated CO2 on the resilience of grasses
to ECE.
Keywords: Dactylis glomerata, elevated CO2, extreme climatic event, fructans, Holcus lanatus, resilience, sucrose.
Introduction
Grasslands are the most important agro-ecosystems world-wide; they deliver many ecosystem services, ranging from forage supply to soil carbon storage and biodiversity preser-vation (Pilgrim et al., 2010; Gaujour et al., 2012). However,
climate change caused by increased greenhouse gas emissions in the atmosphere may jeopardize the stability and functions of many ecosystems (Intergovernmental Panel on Climate Change, 2014). Reduced precipitation coupled with increased
temperatures will lead to more frequent and intense droughts (Tubiello et al., 2007; Dai, 2011) and severe heat waves (Trnka
et al., 2011; Orlowsky and Seneviratne, 2012; Seneviratne et al.,
2014). The interactions between these combined climatic fac-tors result in complex responses that challenge our current understanding and will affect plant physiological processes in a way that cannot be predicted from single-factor treatments (Albert et al., 2011a; Dieleman et al., 2012; Mueller et al., 2016). An important issue is to explore to what extent extreme cli-matic events (ECEs, as defined by Smith, 2011a) will interact with the predicted rise in CO2, in particular, regarding their
impact on plant mortality and therefore on overall ecosystem resilience (Way, 2013; Niu et al., 2014; Felton and Smith, 2017).
Many studies have explored the role of moderate water deficits on plant water status and carbon uptake under elevated CO2 concentrations (eCO2) (Clark et al., 1999; Korner, 2000;
Volk et al., 2000; Knapp et al., 2001; Morgan et al., 2004; Grant
et al., 2014). Generally, eCO2 enhanced plant biomass
produc-tion and improved water relaproduc-tions under drought (Clark et al., 1999; Ghannoum et al., 2000; Robredo et al., 2011). In addition, depending on the warming intensity (Dieleman et al., 2012), eCO2 alleviated the drought response in a range of grassland
species (Naudts et al., 2013), and mitigated the impacts of cli-mate extremes on the growth and production of Arabidopsis
thaliana (Zinta et al., 2014). Conversely, the stimulatory effects of eCO2 on growth and photosynthesis may decline due to
in-creases in temperature stimulating photorespiration (Ziska and Bunce, 1994) or due to water and nitrogen limitations (Reich
et al., 2014). However, the effects of combined severe climatic
extremes and CO2 concentration on the ability of perennial
herbaceous plants to survive and recover from severe stress have been explored relatively little (Roy et al., 2016).
The accumulation of water-soluble carbohydrates (WSCs) under eCO2 may contribute to increases in both drought
re-sistance, that is, the maintenance of leaf growth under mod-erate water deficit, and also drought survival under severe water deficit (Roy et al., 2016; Volaire, 2018). Under severe drought, once complete leaf senescence is reached, the dehydration tolerance of meristematic tissues of shoots and roots ensures plant survival by maintaining cell integrity through cell mem-brane stabilization (Volaire et al., 2014; Zwicke et al., 2015). WSCs, particularly fructans (soluble sucrose-derived fructose polymers), contribute to dehydration tolerance (Volaire, 1995; Livingston et al., 2009) through cellular protection by mem-brane stabilization (Hincha et al., 2007) and reactive oxygen species (ROS) scavenging (Peshev et al., 2013). These WSC re-serves also play a role during recovery, since they are hydrolysed to fuel regrowth after rehydration (Amiard et al., 2004). Under eCO2, temperate grassland species generally accumulated more
WSCs, but a high variability of responses between species has been reported (Casella and Soussana, 1997; Allard et al., 2003; Dumont et al., 2015). Moreover, climate extremes under eCO2
also elicited larger increases in the quantities of WSCs including fructans in grasses (AbdElgawad et al., 2014). Since the pro-tective properties of WSCs differ among compounds, in terms of both membrane stabilization (Hincha et al., 2007) and ROS scavenging (Morelli et al., 2003), the biochemical composition of the WSC pool should be considered. Indeed, temperature
conditions can modify not only the amount of WSCs but also their composition (Abeynayake et al., 2015), such as the distri-bution of fructan polymers [i.e. the relative content of low and high degree of polymerization (DP) fructans].
An experimental approach seems best suited to explore the impacts of combined environmental factors on plant re-sponses (Reyer et al., 2013). At the Montpellier (France) Ecotron, eCO2 was shown to enhance both the resistance and
the short-term overall resilience of an upland grassland com-munity submitted to an ECE consisting of a severe edaphic drought and air warming (Roy et al., 2016). Nevertheless, plant responses to eCO2 are species-specific (Reich et al., 2001;
Roumet et al., 2002; Teyssonneyre et al., 2002b; Maestre et al., 2007). Exploring the responses of dominant species to climate extremes will be key for predicting ‘winner’ and ‘loser’ spe-cies (Dukes, 2007) and therefore future ecosystem dynamics and function (Hoover et al., 2014; De Boeck et al., 2018). Temperature regimes interact with eCO2 to affect plant
physi-ology and growth according to plant functional groups; for instance, C3 plants are more responsive than C4 species (Wang
et al., 2012). Water stress and eCO2 also interact to affect in
dif-ferent ways the growth of grasses that have contrasting drought strategies (Fernandez et al., 2002; Wullschleger et al., 2002). The botanical composition of temperate grasslands was shown to be modified under eCO2 (Teyssonneyre et al., 2002b), and
changes in species abundance could result from differential mortality of different species under ECE (Grant et al., 2014). Overall, in combination with an ECE, eCO2 may differentially
affect species or plant functional groups (Morgan et al., 2011) and/or have a mitigating effect, particularly on drought sur-vival (Volaire, 2018) and growth recovery after drought, as was shown at the community level (Roy et al., 2016).
This study was designed within an experiment conducted at the ecosystem level (Roy et al., 2016) to analyse the effect of eCO2 on the resistance and resilience to an ECE of two
coexisting C3 grass species (Dactylis glomerata and Holcus lanatus).
We investigated traits associated with nitrogen, carbon, and water use, at shoot level (biomass), leaf level (water potential, growth, nitrogen content), and surviving leaf meristem level (water status, membrane stability, non-structural carbohydrate metabolism). The chosen species are known to respond positively to eCO2,
but with higher drought resistance and survival for Dactylis (Teyssonneyre et al., 2002a, b). The extent of the intraspecific variability in response to an ECE and eCO2 was therefore tested
according to the following hypotheses: (i) eCO2 increases
resist-ance to ECE (leaf growth maintenresist-ance during ECE) through higher water and WSC content; (ii) eCO2 improves survival and
biomass recovery and therefore resilience after ECE; and (iii) WSC metabolism and fructan composition in leaf meristems play a central role to support cell protection in the most severe stages of ECE, and contribute to plant resilience.
Materials and methods
Experimental design
The experimental design was previously described by Roy et al. (2016). The study tested the species’ response to future climate scenarios pro-jected for the period of the 2050s (Ciais et al., 2005) For the representative
year 2045, the projected annual means for air temperature and precipi-tation at Saint-Genès-Champanelle, France, were 10.9 °C and 770 mm (corresponding to +2.3 °C and –33 mm, respectively, compared with the 1990–2009 means). Therefore, the control treatment consisted of warmer and drier climatic conditions than the long-term climatic con-ditions occurring at Saint-Genès-Champanelle. The atmospheric CO2 concentration projected for the 2050s under the A2 scenario is 520 ppm compared with the ambient CO2 concentration (aCO2) of 390 ppm measured at the Mauna Loa Observatory (Hawaii) in 2010.
Forty-eight monoliths (1 m2 each) of intact soil and their resident plant communities were excavated in June 2009, down to the bedrock at 0.6 m depth, from an extensively managed upland semi-natural grassland site (Redon, 45°43′N, 03°01′E, 800 m a.s.l.) near Saint-Genès-Champanelle in the French Massif Central. The average botanical composition of plant communities was initially dominated by C3 perennial grasses (60%), leg-umes (35%), and forbs (5%). The grasses D. glomerata and H. lanatus were present in all monoliths and constituted 37% and 14%, respectively, of the initial above-ground community biomass. The soil in this site is a Cambisol (59.5% sand, 19.2% silt, 21.4% clay, pH H2O 5.9).
The excavated monoliths were brought to Clermont-Ferrand INRA research station (45°46′N, 03°08′E, 350 m a.s.l., long-term 1980–2010 mean annual temperature 11.4 °C) for temperature acclimation until September 2009, where they received ambient precipitation and irriga-tion to maintain soil water content (SWC) near 80% of field capacity. They were then transported to Montpellier, and four monoliths repre-sentative of the species composition of the grassland were inserted in each of the 12 Ecotron macrocosms, where they acclimated, at aCO2, from April 2010 to early March 2011 to the climatic conditions of the representative year 2045. The Ecotron climate-regulation system tracked the hourly means of air temperature, air humidity, and daily precipitation projected by the model.
From mid-March 2011 to the end of the experiment, six macrocosms randomly selected out of the 12 were subjected to eCO2 (520 ppm) while the other six were subjected to aCO2 (390 ppm) (Fig. 1). ECE included a reduction in precipitation by 50% during 4 weeks in mid-summer (25 June to 21 July: date D1) followed by 2 weeks (22 July to 4 August: date D2) with no irrigation and a concomitant heat wave (+3.4 °C compared with the 2050s average) (Fig. 1). This increase in air temperature corresponded to 7.1 °C above the 2000–2009 average for
the same period, a value above the average of the 14 consecutive hottest days of the exceptional heat wave in summer 2003. This ECE, mimicking the strongest of such events projected by the downscaled ARPEGEv4 model over 2040–2060, was applied to three randomly selected macro-cosms out of the six at each CO2 concentration. After the ECE, from 5 to 31 August, irrigation was progressively increased in the treatment with ECE to obtain the same cumulative precipitation as in the control treatment (Con) referring to the 2050s climatic conditions without ECE. After the ECE and until the end of the experiment on 3 November, the macrocosms subjected to each CO2 treatment had the same climatic con-ditions, replicating the downscaled model projections for the representa-tive year 2045. Each of the four experimental treatments (390 Con, 390 ECE, 520 Con, 520 ECE) was replicated three times. For further details on the experimental conditions, see Roy et al. (2016).
Plant community-level measurements
SWC was continuously measured at three soil depths (7, 20, and 50 cm) with TDR probes (IMKO, Ettlingen, Germany) and averaged across soil depths to assess relative SWC (RSWC) at each sampling date. The field capacity of the soil (SWCfc) was 32.90% and the minimum soil moisture (SWCmin) at the end of the ECE, when all plants were senescent, was 8.16%. RSWC was calculated as the fraction of soil moisture available for plants with this equation: RSWC=(SWC–SWCmin)/(SWCfc–SWCmin). The vegetation was cut at 5 cm height on 14 March, 26 April, 9 June, and 3 November, to mimic mown grassland. After harvest, samples of the last three cuts were frozen at –18 °C, then defrosted, sorted by species, and oven-dried at 60 °C for 48 h to determine specific level above-ground biomass. The March cut was excluded from the analyses as it represented biomass production from the previous autumn, before the onset of CO2 treatment. For each species and each of the four treatments, resilience to ECE was estimated by the biomass resilience index (RESIL), calculated as the ratio of above-ground biomass harvested after the ECE (November cut) to above-ground biomass harvested before the ECE (mean of April and June cuts). A RESIL value of 1 corresponds to full recovery of spe-cies biomass. This index was chosen from among others (Ingrisch and Bahn, 2018) because the biomass data harvested in November integrate ECE resistance and recovery periods. This index allows comparison of the treatments because it is calculated for each replicate macrocosm.
Fig. 1. Experimental design and time course of the experiment. After a 1-year acclimation period, the vegetation was cut at 5 cm height (14 March)
and the monoliths were submitted to four climatic scenarios: ambient (aCO2: 390 ppm, blue) or elevated (eCO2: 520 ppm, red) atmospheric CO2
concentration, combined with an extreme climatic event (390 ECE and 520 ECE) or without ECE (390 Con and 520 Con). The ECE included a reduction in precipitation by 50% during 4 weeks in midsummer (25 June to 21 July: D1) followed by 2 weeks (22 July to 4 August: D2) with no irrigation and a concomitant heat wave (+3.4 °C compared with the projected 2050s average). Thereafter, the precipitation was gradually increased. The vegetation was cut at 5 cm height again on 26 April, 9 June, and 3 November. Leaf meristematic tissues were sampled at D1 (21 July) and D2 (4 August).
Plant traits
Before the onset of ECE (21 June) to 3 weeks after the ECE (22 September), lamina length was measured twice a week on the fastest-growing leaves of four tillers per species (D. glomerata and H. lanatus) and per macrocosm to analyse the dynamics of leaf elongation rates. The mean leaf elongation rates measured during the ECE (LERECE) and the maximum leaf elongation rates measured during the recovery period (LERr) were analysed. Pre-dawn leaf water potential was measured on three detached green laminae from each species in each monolith on 17 June, 21 July (D1), and 4 August (D2) (Scholander pressure chamber, model 1000, PMS Instrument Company, Corvallis, OR, USA). On the same days, the relative water content (RWC) of these laminae was meas-ured by weighing lamina tissue before and after rehydration overnight at 4 °C and after drying at 80 °C for 24 h.
Leaf and leaf meristem traits
For each species, leaves collected during the cuts on 26 April, 9 June, and 3 November and those used for water potential measurements were oven-dried at 60 °C for 48 h and then ball milled (MM200, Retsch, Germany). Leaf nitrogen content was analysed in the Isotopic platform of INRA Nancy (Isoprime100, IsoPrime, Manchester, UK). At dates D1 and D2, measurements were carried out on the leaf meristematic tis-sues (three tillers for each macrocosm), which are the organs that sur-vive the longest in perennial grasses. From the fraction containing the lowest 20 mm of the tillers, the enclosed bases of immature leaf meri-stems were dissected out and split out into two subsamples. One was immediately weighed and then dried at 80 °C for 24 h to determine its water content. The other fresh subsample was used to measure electrolyte leakage (Volaire and Thomas, 1995) from the cells (seed analyser G2000, Wavefront Inc., Ann Arbor, MI, USA) and calculate the coefficient of membrane stability (CMS).
For the WSC analysis, on the same dates, three other subsamples of fresh leaf meristems per species and monolith were quickly weighed, dropped into liquid nitrogen and stored at –80 °C before freeze-drying at –100 °C for 48 h. Finely powdered samples (30–50 mg) were extracted in 80% ethanol and purified in mini-columns (Mobicols, MoBITec, Göttingen, Germany) with ion-exchange resins (Amiard et al., 2003). WSCs (mg g−1) were analysed by HPLC on a cation exchange column (Sugar-PAK, 300×6.5 mm, Waters Corporation, Milford, MA, USA), eluted at 0.5 ml min−1 and 85 °C with 0.1 mM Ca-EDTA in water, and quantified using a refractive index detector (2410 Differential Refractometer, Waters Corporation, Milford, MA, USA). External standards used to quantify carbohydrates were glucose, fructose, sucrose, and Cichorium intybus inulin (Sigma-Aldrich, MO, USA).
Carbohydrates in the assay mixture were analysed by high-performance anion exchange chromatography and pulsed amperometric detection (HPAEC-PAD ICS-3000, Dionex, CA, USA) equipped with a CarboPac PA1 anion-exchange column (4×250 mm) with elution at 1 ml min−1 with 150 mM NaOH and an increasing concentration of sodium acetate: 0 mM (0–6 min), 50 mM (6–12 min), 100 mM (12–18 min), 175 mM (18–19 min), 250 mM (19–30 min), 425 mM (30–60 min). Fructan type (levan versus inulin) and DP were identified by comparison with stand-ards of commercial fructans (1-kestotriose, 1,1-kestotetraose; Megazyme, Ireland), purified fructans (6-kestotriose; kind gifts of Professor I. Izuka, Hyogo, Japan) and inulin extracted from Taraxacum spp. Comparison of standards with D. glomerata and H. lanatus extracts revealed that both species accumulated β2,6 linked fructan (levans), in accordance with the literature (Chatterton et al., 1993; Bonnett et al., 1997). Owing to the lack of commercially available analytical standards for fructans, absolute quantification of each peak was not possible. Instead, the relative amounts of the same DP were compared for each sample. The peak area of each DP of β2,6 fructan polymer (using the major peak when multiple peaks were present) from DP3 to DP65 was used to calculate the relative area of each peak as a percentage of the sum of DP3 to DP65 peak areas. As the amperometric response declines with increased chain length, it was not possible to compare the relative area of fructans differing in DP. The relative area of each peak (or group of peaks) expressed as a percentage of total peak area was used to analyse the treatment effects for each peak
(or range of DPs). For analysis of the correlations between traits across species (Supplementary Table S1 at JXB online), the area percentage was weighted by the total fructan content in each sample.
Statistical analysis
Statistical analyses were carried out with R software (RStudio Team, 2015). Data were transformed when necessary (log, inverse, square, power 4, 5, or 6, boxcox) before analysis of variance (ANOVA) with the ‘lmtest’ package to conform to the assumptions of normality (Shapiro–Wilk test), homogeneity of variances (Bartlett test), and independence (Durbin– Watson test) or normality (Shapiro–Wilk test) of residues. For data for which the assumptions of normality, homogeneity of variances, and/or normality of residues were not obtained, analyses were carried out with the non-parametric Kruskal–Wallis test. For each trait, the factors species (D. glomerata, H. lanatus), CO2 concentration (390, 520 ppm), climatic condition (Con, ECE), and date (D1, D2), as well as all of their inter-actions, were explored. Relationships between cell membrane stability and WSC, and relationships between resilience and plant traits, were ana-lysed with non-parametric Spearman correlation tests.
Results
Responses of above-ground biomass
For both species, above-ground biomass in the spring before the ECE was not affected by the CO2 concentration and was
approximately 2-fold greater for H. lanatus than for D. glomerata (P=0.007; Table 1, Fig. 2A, B). In the autumn after the ECE (re-covery period), no difference in biomass production was found between the species; the biomass of both species was slightly higher under eCO2 (P=0.077), with a significant interaction
between species and ECE (P=0.01; Table 1, Fig. 2A, B). As a result, the RESIL for control plants of D. glomerata was around 1.1 (±0.6) in both CO2 treatments, and equal to 1.4 (±0.7) and
1.7 (±0.8) after the ECE under aCO2 and eCO2, respectively
(Fig. 2C). By contrast, the RESIL was close to zero after the ECE for H. lanatus but it was 2-fold higher (0.75±0.47) for the control plants under eCO2 than under aCO2 (0.34±0.16)
(Fig. 2D).
Responses at leaf level
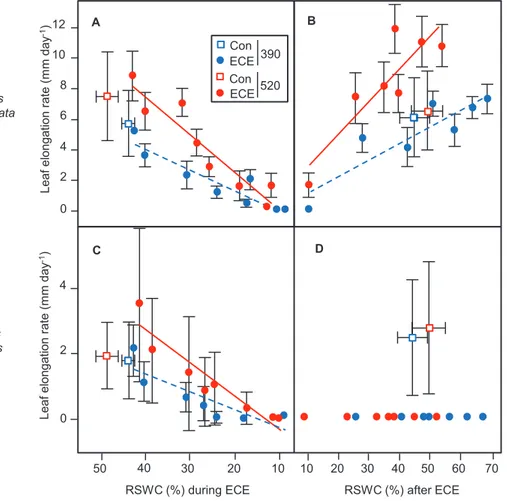
During the ECE, the mean leaf elongation rate (LERECE) was
significantly (P<0.0001) affected by all fixed factors (species, CO2, ECE) and with significant interactions between
fac-tors (Table 1). Across all treatments, LERECE was 3- to 5-fold
higher for D. glomerata than for H. lanatus, for which the vari-ability of data was also greater (Fig. 3A, C). The pattern of LERECE response was similar for both species, with higher
rates under eCO2, a decline during the ECE, and a final
ces-sation of elongation for all stress treatments under less than 20% of RSWC. At that time, all leaves were mostly senescent for all plants of the swards under stress (Roy et al., 2016). As the stress progressed, the leaf water potential declined down to –7 MPa in both species (Table 2). The leaf RWC was signifi-cantly higher in D. glomerata (P=0.03), although a CO2×ECE
interaction was significant for both leaf water potential and RWC (Table 1). Leaf nitrogen content was on average 20% higher in D. glomerata than in H. lanatus, and declined during the ECE for both species, but increased at the lowest RSWC,
with a significantly lower nitrogen content in H. lanatus at eCO2 (Supplementary Fig. S1).
During the recovery period, all treatments and interactions significantly affected the LERr (Table 1). Although some Table 1. Effect of species (D. glomerata, H. lanatus), CO2 concentration (390, 520 ppm), climatic condition (Clim) (Con, ECE), date
(D1, D2) and their interactions, based on ANOVA, on above-ground biomass (BIOM), resilience index (RESIL), mean leaf elongation rate during ECE (LERECE), maximum leaf elongation rate during the recovery period (LERr), leaf pre-dawn water potential (POT), leaf relative
water content (RWC), and leaf nitrogen content (LNC)
Period Variable Species CO2 Clim Species×
CO2 Species× Clim CO2× Clim Species× CO2×Clim Date Date× Species Date× CO2 Date× Clim Before ECE BIOM 0.007 NS NS During ECE LERECE <0.0001 <0.0001 <0.0001 <0.0001 <0.0001 0.0037 NS POT <0.0001 NS <0.0001 NS <0.0001 0.0188 NS <0.0001 NS NS <0.0001 RWC 0.03 NS <0.0001 NS NS 0.019 NS <0.0001 NS 0.006 <0.0001 LNC <0.0001 <0.0001 NS 0.032 NS NS NS NS NS NS NS Recovery after ECE LERr <0.0001 <0.0001 <0.0001 <0.0002 <0.0001 0.0042 <0.0001 LNC 0.0101 0.0100 <0.0001 NS NS NS NS BIOM NS 0.077 NS NS 0.010 NS NS RESIL 0.0047 NS NS NS NS NS NS
P values are shown when <0.05. NS, Not significant. Three periods are considered: before ECE, during ECE, and during recovery after ECE (see Fig. 1)
Dactylis glomerata Holcus lanatus
390 Con ECE 50 100 150 Above-ground m M D g( ss a moi b -2) 520 Con ECE 390 Con ECE 520 Con ECE
BefRecov BefRecov BefRecov BefRecov BefRecov BefRecov BefRecov BefRecov
Resilience inde x 390 Con ECE 2 1 520 Con ECE 0 380 Con ECE 520 Con ECE 2 1 0 Resilienc ei ndex C A D B
Fig. 2. Above-ground biomass (A, B) and resilience index (C, D) of two perennial grass species, D. glomerata (A, C) and H. lanatus (B, D) under four
climatic scenarios: 390 (blue) or 520 (red) ppm atmospheric CO2 concentration, combined with the ECE or without ECE (Con). Above-ground biomass
was the biomass harvested above 5 cm height before the ECE (Bef; mean of two cuts on 26 April and 9 June) and after the ECE at the end of the
recovery period (Recov; 3 November cut). For the recovery period, the absence of a bar for H. lanatus grown at 390 ECE coincides with mortality. The
resilience index was calculated by the Recov to Bef above-ground biomass ratio; A value of 1 corresponds to full recovery of species biomass. Mean ±SD
are shown (n=3).
H. lanatus plants in the macrocosms recovered, none of the
plants of this species sampled for LERr measurements re-covered after the ECE (Fig. 3D). The LERr of D. glomerata reached that of control plants at aCO2 for a RSWC greater
than 50% (Fig. 3B). In addition, the recovery of D. glomerata was greatly enhanced under eCO2, since its LERr reached up
to 12 mm day−1, that is, 2-fold more than the control plants
(Fig. 3B). In parallel, leaf nitrogen content more than doubled
during the recovery period for both species (Supplementary Fig. S1).
Responses at leaf meristem level
The water content and the CMS of meristematic tissues were not affected by CO2 concentration but were significantly
re-duced in both species by the ECE treatment (Table 3, Fig. 4). Dactylis glomerata Holcus lanatus A B Con 390 ECE Con 520ECE ya d m m( et ar noit ag nol ef ae L -1) 10 12 6 8 2 4 0 2 4 ya d m m( et ar noit ag nol ef ae L -1)
RSWC (%) during ECE RSWC (%) after ECE 0
50 40 30 20 10 10 20 30 40 50 60 70
C D
Fig. 3. Leaf elongation rate during the ECE (A, C) and during the recovery period after the ECE (B, D) as a function of the relative soil water content
(RSWC) of two perennial grass species, D. glomerata (A, B) and H. lanatus (C, D). Blue and red symbols correspond to 390 ppm and 520 ppm
atmospheric CO2 concentration, respectively. Squares correspond to control treatments (390 Con and 520 Con), for which only mean values of the three
periods are shown. Blue triangles and dotted blue lines correspond to ECE treatment at 390 ppm CO2. Red triangles and solid red lines correspond to
ECE treatment at 520 ppm CO2. Mean ±SD are shown (n=3). For 390 Con and 520 Con, horizontal (RSWC) and vertical (LER) SD are shown.
Table 2. Pre-dawn leaf water potential and lamina relative water content (RWC) of D. glomerata and H. lanatus under four climatic
scenarios
390 ppm 520 ppm
Control ECE Control ECE
3 dates Before ECE D1 D2 3 dates Before ECE D1 D2
D. glomerata
Leaf water potential (–MPa) 0.9±0.3 1.1±0.3 3.3±0.9 6.7±0.6 0.9±0.2 0.9±0.3 3.1±0.2 7±0 Lamina RWC (%) 90.9±3.4 80.2±2.7 53.5±6.1 38.2±0.3 84.1±8.8 84.3±1.7 62.3±13.4 39.7±6.7
H. lanatus
Leaf water potential (–MPa) 1.1±0.3 1.3±0.02 3.6±0.6 7.00±0 1.2±0.1 1.4±0.4 2±0.1 7±0
Lamina RWC (%) 84.3±7.4 81.9±5.3 65.2±7.3 10.8±5.9 83.8±5.4 79.8±5.0 65.7±16.7 43.4±18.9 Climatic scenarios were two atmospheric CO2 concentrations (390, 520 ppm) with or without an ECE at three dates (before ECE, 17 June; during ECE,
D1; end of ECE, D2; see Fig. 1). For the control treatment, average values of the three dates are shown. Data are presented as mean ±SD (n=3)
In both species, fructans were the main WSCs in leaf meri-stematic tissues (Fig. 4, Supplementary Fig. S2). Levels of fructans, sucrose, and glucose, but not fructose, significantly differed between the species (Table 3). Overall, fructan con-tent was ~30% higher in D. glomerata (mean 526 mg g DM−1)
than in H. lanatus (mean 357 mg g DM−1), while sucrose
con-tent was 3- to 5-fold lower in D. glomerata (mean 16 mg g DM−1) than in H. lanatus (mean 53 mg g DM−1) (Table 3, Fig.
4). Fructan content was higher under eCO2 (Table 3, Fig. 4E,
F). Moreover, fructan content increased between D1 and D2 in ECE-treated and control plants of D. glomerata (P=0.027;
t-test) and H. lanatus (P=0.026; t-test) (Fig. 4E, F). Sucrose content was affected by the ECE, with interactions with CO2
concentration and date (Table 3, Fig. 4G, H). The ECE in-creased sucrose content at D2, with a bigger effect under aCO2
than under eCO2 (Fig. 4G, H).
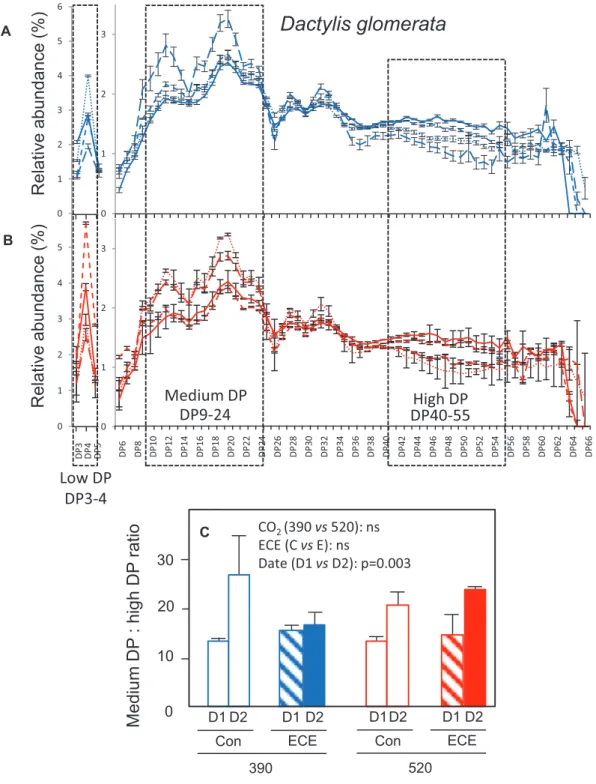
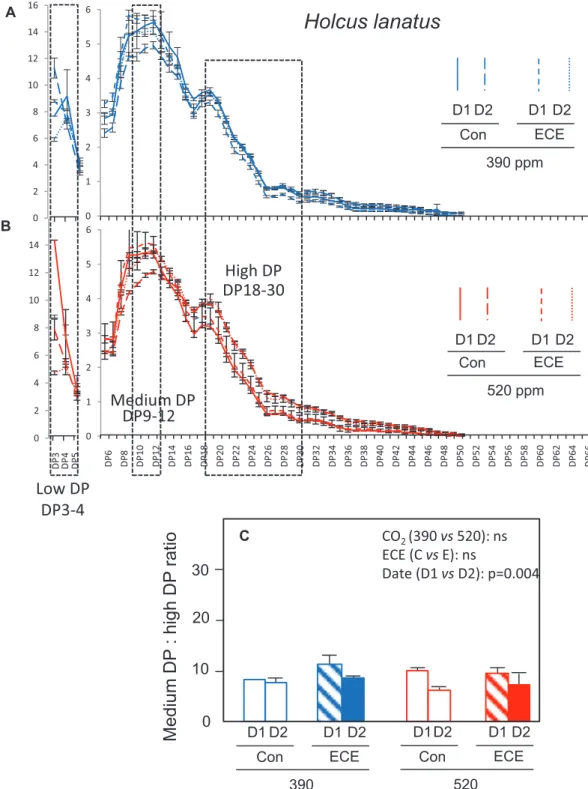
The analysis of fructan composition (Fig. 5) showed that fructans consisted of a mixture of oligo- and polysaccharides of mainly β(2,6) fructans (levans) in both species. In D. glomerata, fructans up to DP65 were identified, while in H. lanatus the highest detected DP was only 45. The pattern of fructan DP distribution varied between D1 and D2 and differed among species (Figs 6 and 7; Table 3). In D. glomerata, the relative abun-dance of DP9–24 increased while that of DP40–55 decreased (Fig. 6A, B), so that their ratio increased (Fig. 6C). Conversely, in H. lanatus, the relative abundance of DP9–12 declined while that of DP16–30 increased (Fig. 7A, B), so that their ratio de-creased (Fig. 7C). Fructans were divided into three groups cor-responding to low, medium, and high DP. For both species, low DP corresponds to the sum of DP3 and DP4. Medium DP corresponds to DP9–24 for D. glomerata and DP9–12 for
H. lanatus. High DP corresponds to DP40–55 for D. glomerata
and DP18–30 for H. lanatus. Other fructan DPs were not con-sidered since they were not affected by the environmental fac-tors (CO2 concentration, climatic condition, date) (Figs 6 and
7). The relative abundance of the three DP groups of fructans was not affected by eCO2 (Table 3, Supplementary Fig. S3).
For each species, correlations between CMS and carbohydrate data in leaf meristems measured at D1 and D2 were investigated (Table 4). In both species, CMS was not correlated to fructan content or fructan composition (relative content of low- and high-DP fructans). In H. lanatus, CMS was negatively correl-ated to relative content of medium-DP fructans. In both species, CMS was lowest when the sucrose content was highest (Fig. 8A, B), and CMS was negatively correlated to sucrose content in
H. lanatus (Table 4). CMS was negatively correlated to hexose
contents in D. glomerata, and positively correlated to hexose con-tents in H. lanatus (Table 4). In H. lanatus, CMS was correlated with the low-DP fructans to sucrose ratio and with sucrose con-tent (r=0.70 and –0.65, respectively; Table 4, Fig. 8D).
For the analysis of correlations across species between re-silience to the ECE and plant traits, the traits related to me-dium- and high-DP fructans were not considered, since the DP groups differed according to the species (Figs 6 and 7). The best predictors of resilience were the fructans to sucrose ratios, especially the low-DP fructans to sucrose ratio in leaf meri-stems at D1 and D2 (Supplementary Table S1, Fig. 9).
Discussion
This study explored the response of two coexisting peren-nial grass species growing in a community of a temperate semi-natural grassland grown under the predicted climatic Table 3. Effect of species, CO2 concentration (390, 520 ppm), climatic condition (Clim) (Con, ECE), date (D1, D2), and their interactions
(based on ANOVA) on water content, cell membrane stability (CMS), soluble carbohydrate content, total fructans:sucrose ratio, and low DP:sucrose ratio in leaf meristems of D. glomerata and H. lanatus
Variable Species CO2 Clim Species×
CO2 Species× Clim CO2× Clim Species× CO2xClim Date Date× Spe-cies Date× CO2 Date× Clim Water content 0.004 NS <0.001 NS NS 0.050 NS <0.001 NS NS <0.001 CMS NS NS <0.001 NS 0.009 NS NS 0.003 NS NS <0.001 Soluble carbohydrate content (mg g DM−1) Fructans <0.001 0.042 NS NS NS NS NS <0.001 NS NS NS Sucrose <0.001 NS <0.001 NS NS 0.038 NS NS NS NS <0.001 Glucose 0.027 NS NS NS <0.001 NS NS 0.004 NS NS NS Fructose NS NS NS NS 0.004 NS NS <0.001 NS NS NS Fructan composition (relative content, %) Low DP <0.001 NS NS NS 0.004 NS NS NS NS 0.018 NS Medium DP NR NS NS NR NR NS NR <0.001 NR NS NS High DP NR NS NS NR NR NS NR 0.012 NR NS NS Fructans:sucrose ratios Total fructans:sucrose <0.001 NS <0.001 NS NS NS NS NS NS NS <0.001 Low DP:sucrose 0.001 NS 0.002 – – – – NS – – – Medium DP:sucrose NR NS <0.001 NR NR NS NR NS NR NS <0.001 High DP:sucrose NR NS NS NR NR NS NR NS NR NS 0.004 Fructans:fructans ratios Low DP:Medium DP NR NS NS NR NR – NR NS NR – – Low DP:High DP NR NS NS NR NR NS NR 0.0037 NR 0.019 NS Medium DP:High DP NR NS NS NR NR – NR NS NR – –
For medium and high DP composition, medium DP:sucrose, high DP:sucrose and fructans:fructans ratios, the effect of species was not relevant (NR) since groups of medium and high DP were not similar in the two species. For the ratios of low DP:sucrose; low DP:medium DP, and medium DP:high DP, the effects of CO2, Clim, and date were analysed independently by non-parametric Kruskal–Wallis tests. P values are shown when <0.05. NS,
Non-significant effect. –, Conditions for analysis not met.
conditions of the 2050s, subjected or not subjected to an ECE including extreme drought and a heat wave, under ambient or elevated CO2 concentrations. The resistance during the
ECE and recovery after the ECE were high for D. glomerata and lower for H. lanatus. These results confirm that most na-tive grasslands are likely to contain plants with a high diversity
Dactylis glomerata Holcus lanatus
D1 D2 D1 D2 390 Con ECE D1D2 D1 D2 520 Con ECE D1 D2 D1 D2 390 Con ECE D1D2 D1 D2 520 Con ECE 20 40 (t net no cr et a W% ) 60 80 A 40 80 Cel le nar b me ms tabilit y( %) 100 20 60 Fructans (m g g DM -1) 400 800 40 80 120 M D g g m( es orc uS -1) B C D E F G H
Fig. 4. Water content (A, B), cell membrane stability (C, D), fructan content (E, F), and sucrose content (G, H) in leaf meristems of two perennial grass
species, D. glomerata (A, C, E, G) and H. lanatus (B, D, F, H) under four climatic scenarios: 390 (blue) or 520 (red) ppm atmospheric CO2 concentration,
combined with the ECE treatment (ECE) or without ECE (Con). Leaf meristematic tissues of the two species were sampled at D1 (21 July) and D2 (4 August). Mean ±SD are shown (n=3).
of drought resistance (Craine et al., 2013) and also drought survival after severe water deficit (Pérez-Ramos et al., 2013; Zwicke et al., 2015). Contrary to our hypothesis, we found no significant mitigating effect of eCO2 on the mortality of H. lanatus. However, eCO2 had a positive effect on both
resist-ance and recovery of D. glomerata. These results are discussed in light of the water, nitrogen, and carbon status response of the plants to the treatments.
Elevated CO2 increases the drought resistance of
H. lanatus and D. glomerata during moderate drought Both grass species had higher leaf growth and leaf RWC under a combination of eCO2 and moderate drought during the first
stage of ECE. As shown at community level, these positive ef-fects should have slowed leaf senescence and maintained photo-synthesis for a longer period during drought than under aCO2
(Roy et al., 2016), leading to the higher content of fructans in leaf meristems. This confirms the importance of improved water relations under eCO2, which to some degree sustain
photosynthesis in dry periods (Albert et al., 2011b). In addition, as leaf N content was significantly higher in D. glomerata than in H. lanatus, it may be hypothesized that the photosynthetic activity of D. glomerata is higher than that of H. lanatus, espe-cially under eCO2 (CO2×species interaction: Table 1; Harmens
et al., 2000). Altogether, our results underline and confirm that
eCO2 alleviates the effects of drought stress by conservation of
water (Morgan et al., 2001, 2011; Robredo et al., 2007; Holtum and Winter, 2010), higher carbon fixation, and higher fructan accumulation; thus, eCO2 contributed to increased drought
re-sistance. Previous studies have shown that the level of WSC accumulation in response to eCO2 largely depended on N
availability in the leaves (Dumont et al., 2015). Here, the rela-tively low WSC accumulation under eCO2 may indicate that
N availability was high enough to sustain leaf growth (Fig. 3), root growth (Roy et al., 2016), and root exudation (Pendall
et al., 2004), which limited storage of WSCs in both species.
H. lanatus and D. glomerata show contrasting ECE
survival
Although H. lanatus and D. glomerata are both C3
peren-nial grasses co-occurring in temperate grassland with similar rooting depth (Pages and Picon-Cochard, 2014), they showed contrasting survival after the ECE. It was previously shown that although species with different growth habits varied in their responses to CO2 and nitrogen, there was also substantial
vari-ation in responses among species within groups (Reich et al., 2001). In the present study, almost all H. lanatus plants died, whereas all D. glomerata survived. This stark contrast between a ‘loser’ and a ‘winner’ species (Dukes, 2007) strongly affected the botanical composition of the grassland macrocosms following the treatments (data not shown). As the grassland macrocosms had a realistic soil depth of 0.6 m, it can be assumed that both species had a rooting depth able to explore the full soil profile and therefore that their potential water uptake was comparable under drought. It has been suggested that long-term respon-siveness to rising CO2 concentrations differs between slow- and
fast-growing plants (Ali et al., 2013). Our results also tend to suggest that growth patterns, with a much greater growth po-tential for D. glomerata than H. lanatus, may be associated with greater ECE survival, irrespective of the treatments. Although above-ground growth of both species was maintained for a similar period in the summer, the water status of leaves and meristems of D. glomerata was higher at some dates, especially under eCO2. Altogether, the species with a greater acquisition
strategy and higher growth rate (D. glomerata) survived better than the species with a more resource-conservative strategy
10 15 20 25 30 35 40 45 50 55 60 0 50 100 150 200 250 0 rot cet e De sn op ser( nC )
Retention time (min) DP3 DP3 DP4 DP5 DP6DP7 DP8DP10 DP20 DP30 DP40 DP4 DP5 DP6 DP7 DP8DP10 DP20 DP30 DP40 DP50 DP60 Dactylis glomerata Holcus lanatus 50 100 150 200 250 A B
Fig. 5. Distribution of the fructans according to their degree of polymerization (DP). HPAEC-PAD chromatogram profiles of water-soluble carbohydrates
in leaf meristems of two perennial grass species, D. glomerata (A) and H. lanatus (B). DP for levans [β(2,6) linked fructans] are indicated above the corresponding peak.
(H. lanatus). Assuming that this pattern for temperate ecotypes of perennial grasses can be generalized, it differs from the pat-tern found for Mediterranean ecotypes of perennial grasses such as D. glomerata, for which a reduction or cessation of leaf growth (summer dormancy) are the most efficient strategies to conserve soil water resources and therefore to survive severe drought (Volaire, 1995; Volaire and Norton, 2006).
Since the leaves were mostly senescent at the end of the ECE for all species present in the community (Roy et al., 2016),
plant survival relied on maintenance of the viability of leaf meristems (Volaire, 1995; Volaire et al., 2014). Our study found major differences between the tested species in WSC accumu-lation in meristematic tissues of leaves. The stress-tolerant spe-cies D. glomerata accumulated a larger amount of fructans than the sensitive species H. lanatus, which in turn accumulated a larger amount of sucrose. These differences in WSC level and composition might be associated with the two species’ differ-ential survival and recovery after the ECE. In particular, the
D1 D2 D1 D2 390 Con ECE D1D2 D1 D2 520 Con ECE 20 30 10
Medium
DP
: high DP
rati
o
0 CO2 (390 vs 520): ns ECE (C vs E): ns Date (D1 vs D2): p=0.003Low DP
DP3-4
Dactylis glomerata
Relative
abundanc
e(
%)
0 1 2 3Relative
abundance
(%
)
0 1 2 3DP9-24
DP40-55
Medium DP
High DP
DP 6 DP 8 DP10 DP12 DP14 DP16 DP18 DP20 DP22 DP24 DP26 DP28 DP30 DP32 DP34 DP36 DP38 DP40 DP42 DP44 DP46 DP48 DP50 DP52 DP54 DP56 DP58 DP60 DP62 DP64 DP66 0 1 2 3 4 5 6 0 1 2 3 4 5 DP 3 DP 4 DP 5 A B CFig. 6. Relative abundance of fructans based on their degree of polymerization (DP) (A, B) and ratio of medium- to high-DP fructans (C) in leaf meristems
of D. glomerata under four climatic scenarios: 390 (A) or 520 (B) ppm atmospheric CO2 concentration combined with the ECE treatment (ECE) or
without ECE (Con). The dashed boxes include the two groups of fructans with medium and high DP that were the most altered by the treatments. Leaf meristematic tissues were sampled at D1 (21 July) and D2 (4 August). Mean ±SD are shown (n=3).
level of sucrose, which accumulated to a much greater extent in the sensitive species, was highly and negatively correlated to the maintenance of cell stability of the meristems at the end of the ECE, confirming previous results on temperate ecotypes of herbaceous species (Zwicke et al., 2015). The higher degree of polymerization of fructans in D. glomerata (up to DP65) could contribute to its greater survival compared with H. lanatus, which accumulated smaller fructans (up to DP45). Similar
differences have been observed among the Asteraceae family, in which drought-resistant species (Echinops ritro and Vigueira
discolor) accumulate fructans of higher DP (30–100) (Itaya et al., 1997; Vergauwen et al., 2003) than species with lower drought resistance (Cichorium intybus, Helianthus tuberosus; Van den Ende
et al., 1996; Marx et al., 1997). It has been observed in vitro that
highly polymerized fructans (from bacteria) had a greater pro-tective effect against water stress than lower DP fructans (from 20 30 10
Medium
DP
: high DP
rati
o
0 D1 D2 D1 D2 390 Con ECE D1D2 D1 D2 520 Con ECE CO2 (390 vs 520): ns ECE (C vs E): ns Date (D1 vs D2): p=0.004Low DP
DP3-4
0 1 2 3 4 5 6 0 1 2 3 4 5 6DP9-12
DP18-30
Holcus lanatus
Medium DP
High DP
DP 6 DP 8 DP10 DP12 DP14 DP16 DP18 DP20 DP22 DP24 DP26 DP28 DP30 DP32 DP34 DP36 DP38 DP40 DP42 DP44 DP46 DP48 DP50 DP52 DP54 DP56 DP58 DP60 DP62 DP64 DP66 D1 D2 D1 D2 390 ppm Con ECE D1 D2 D1 D2 520 ppm Con ECE A DP 3 DP 4 DP 5 0 2 4 6 8 10 12 14 16 0 2 4 6 8 10 12 14 B CFig. 7. Relative abundance of fructans based on their degree of polymerization (DP) (A, B) and ratio of medium- to high-DP fructans (C) in leaf meristems
of H. lanatus under four climatic scenarios: 390 (A) or 520 (B) ppm atmospheric CO2 concentration combined with the ECE treatment (ECE) or without
ECE (Con). The dashed boxes include the two groups of fructans with medium and high DP that were the most altered by the treatments. Leaf meristematic tissues were sampled at D1 (21 July) and D2 (4 August). Mean and ±SD are shown (n=3).
Cichorium) (Demel et al., 1998), and that positive synergistic ef-fects on membrane stabilization were obtained with a mixture of DP<7 and DP>7 fructans (from oat or rye) compared with either DP<7 or DP>7 fructans alone (Hincha et al., 2007). In
D. glomerata, the high range of DP (from DP3 to DP65) could
lead to a better synergistic effect than in H. lanatus, with its smaller range of DP, and this could partly explain the differ-ence in membrane stability between the two species. Fructans can act on membranes either directly, by inserting into the lipid headgroups (Livingston et al., 2009), or indirectly, by re-ducing lipid peroxidation through ROS scavenging (Peshev
et al., 2013). In D. glomerata, the maintenance of CMS observed
under ECE might be due to the accumulation of highly poly-merized fructans.
According to current knowledge, levans are synthesized by sucrose:fructan 6-fructosyltransferase (6-SFT) and degraded by fructan 6-exohydrolase (6-FEH) (Vijn and Smeekens, 1999). 6-SFT catalyses the transfer of a fructosyl residue from sucrose to sucrose or from sucrose to fructans by forming a β(2,6) fructosyl-fructose linkage. 6-SFT allows both the initi-ation of levan synthesis and the elonginiti-ation of the levan chain. In H. lanatus, the relative abundance of the different fructan polymers changed during the ECE, resulting in a more poly-merized assemblage. Given that at the same time, total fructan content did not increase, the entry of carbon (in the form of the fructosyl residue from sucrose) into the fructan pool via 6-SFT activity for levan elongation was balanced by an exit of carbon via 6-FEH activity, which catalyses the release of fruc-tose from fructans. This fructan trimming strategy may be asso-ciated with the low ECE survival of H. lanatus. In D. glomerata,
the total fructan content increased during the ECE and the relative abundance of the different fructan polymers changed, resulting in a more depolymerized assemblage. This might be due to the fact that all newly synthesized fructans were of me-dium DP or that, concomitantly with fructan synthesis, the pre-existing high-DP fructans were depolymerized. Such a strategy combining fructan trimming and accumulation may have enhanced the ECE survival of D. glomerata. In plant spe-cies that accumulate inulin [fructan consisting of linear β(2,1) linked fructosyl units], fructan synthesis requires two enzymes, a sucrose:sucrose 1-fructosyltransferase for initiation and a fructan:fructan 1-fructosyltransferase for elongation (Van den Ende et al., 1996; Vijn and Smeekens, 1999). To date, proteins with fructan:fructan 6-fructosyltransferase (6-FFT) activity have not been described in levan-accumulating plant species. If 6-FFT exists in H. lanatus and D. glomerata, the results obtained would be interpreted differently. Indeed, contrary to 6-SFT, which catalyses both the initiation and elongation of fructans, 6-FFT is responsible only for fructan elongation without con-comitant entry of carbon into the fructan pool, the fructosyl donor being fructan instead of sucrose. Consequently, changes in the relative abundance of fructans could be supported by the induction of 6-FFT activity in H. lanatus and by the increase of 6-SFT, 6-FFT, and/or 6-FEH activity in D. glomerata. Further research is needed to unravel levan metabolism and its regula-tion in levan-accumulating grass species.
In addition, the WSC composition was associated with re-silience. Indeed, the ratio of low-DP fructans to sucrose present in the leaf meristems during the ECE was the best predictor of resilience. Altogether, the results showed that a fine-tuning of the relative content and composition of WSCs is crucial for ECE survival. As previously shown in wheat (Joudi et al., 2012; Zhang et al., 2015; Hou et al., 2018) and among carbohydrate-metabolizing enzymes, FEHs are key proteins for ECE survival, since they are involved in fructan size adjustment for cell pro-tection during the ECE and fructan mobilization for carbon feeding of growing cells after the ECE. Comparison of a larger inter- and intra-specific range of populations of grasses should allow further exploration of the mechanistic relationships be-tween drought resilience and fructan metabolism.
Elevated CO2 enhances strong compensatory growth
after stress for the species surviving ECE
During the ECE, the overall water use efficiency at the com-munity level was greater under eCO2 (Roy et al., 2016), while
leaf extension rate in water-stressed plants of both species were also enhanced, as found previously (Casella and Soussana, 1997; Drake et al., 1997). In our study, and as hypothesized, the most striking result was the enhancement of growth recovery of D. glomerata after the ECE under eCO2. Under aCO2, no
compensatory growth of this species was observed after the ECE. These results contradict previous studies showing com-pensatory growth after drought in herbaceous species at aCO2
but not eCO2 (Newton et al., 1996; Clark et al., 1999). This
discrepancy may be due to the different nature and intensity of the stress to which plants were subjected, but also to the dur-ation of acclimdur-ation to eCO2. Compared with the moderate
Table 4. Spearman correlation coefficients of soluble
carbohydrate traits against cell membrane stability (CMS) measured in leaf meristems of D. glomerata and H. lanatus at D1 and D2 (n=24 for each species)
Plant traits Correlation with CMS
D. glomerata H. lanatus Soluble carbohydrate content (mg g DM−1) Fructans –0.34 NS 0.27 NS Sucrose –0.33 NS –0.65*** Glucose –0.56** 0.56** Fructose –0.49* 0.46* Fructan composition (relative content, %) Low DP 0.01 NS 0.31 NS Medium DP –0.04 NS –0.42* High DP 0.05 NS 0.19 NS
Fructans:sucrose ratios Total
fructans:sucrose 0.11 NS 0.64*** Low DP:sucrose 0.36 NS 0.70*** Medium DP:sucrose 0.37 NS –0.64*** High DP:sucrose 0.34 NS 0.57** Fructans:fructans ratios Low DP:Medium
DP 0.01 NS 0.54** Low DP:High DP 0.13 NS 0.17 NS Medium DP:High DP –0.03 NS –0.27 NS
*P<0.05, **P<0.01, *** P<0.001; high significant Spearman correlations (P<0.001) are in bold. NS, Not significant.
drought applied in previous studies, the severity of the ECE in the present study resulted in full above-ground senescence of all plants. It was only under eCO2 that resource use was
efficiently enhanced after the ECE. The rapid regrowth of
D. glomerata during the recovery period might take advantage
of the pool of accumulated WSCs in leaf meristematic tissues together with a putative enhancement of 6-FEH expression allowing the release of fructose through fructan breakdown. In addition, the strong recovery of D. glomerata could also be ex-plained by the capacity of roots to take up nitrogen, as shown at the community level in previous studies (Roy et al., 2016; Carlsson et al., 2017) and reflected in our study by the high leaf nitrogen content in this species (Supplementary Fig. S1B). Moreover, this study shows the effects of eCO2 and extreme
stress over an entire growing season, but the long-term impact of the stimulated resilience identified for one species and for the entire plant community (Roy et al., 2016) should be tested on a longer-term time scale due to a possible lag effect of ECE on biomass and species composition (Lee et al., 2011; Zwicke
et al., 2013).
Although the ability of species to survive drastic climate change was claimed to be generally greater than hitherto rec-ognized (Hof et al., 2012), our results also highlight a strong inter-specific variability that should be further explored ex-perimentally and taken into account in models. D. glomerata, although present at low abundance, responded in the same way as the whole plant community in the samples, whereas
H. lanatus tended to disappear after the extreme climatic stress,
hence modifying the overall species abundance, with potential long-term impacts on grassland properties linked to ecosystem
Cell en ar b me ms tability (% )
Sucrose content (mg g-1 DW) Sucrose content (mg g-1 DW) 100
Low DP fructans : sucrose
Dactylis glomerata Holcus lanatus
A 40 50 60 70 80 90 100 0 20 40 60 80 100 120
Low DP fructans : sucrose
Cel le nar b me ms tability (% ) C 40 50 60 70 80 90 100 0 2 4 6 110 D 40 50 60 70 80 90 100 110 0 0.5 1.0 1.5 B 40 50 60 70 80 90 0 20 40 60 80 100 120 Con D1 390 ECE D2 D1 D2 Con D1 520 ECE D2 D1 D2
Fig. 8. Relationship between cell membrane stability and sucrose content (A, B) or the low-DP fructans to sucrose ratio (C, D) in D. glomerata (A, C) and
H. lanatus (B, D). Leaf meristematic tissues of the two species were sampled at D1 (21 July) and D2 (4 August). Dashed lines indicate a linear relationship (in B) or a logarithmic relationship (in D) for a significant Spearman correlation.
Fig. 9. Relationship between the resilience index of above-ground biomass
of D. glomerata and H. lanatus and the ratio of low-DP fructans to sucrose level in leaf meristems measured at D1 (21 July). The dashed line indicates a logarithmic relationship for a significant Spearman correlation (n=2).
services. Our results, showing strong effects of plant carbon, nitrogen, and water status, cast a light on the crucial and timely question of the mechanisms underlying plant resilience under extreme stress (Smith, 2011b; Nimmo et al., 2015).
Supplementary data
Supplementary data are available at JXB online.
Table S1. Correlations between plant traits and resilience. Fig. S1. Leaf nitrogen content in two grasses during and after an extreme climatic event.
Fig. S2. Monosaccharide contents in grass meristems during an extreme climatic event.
Fig. S3. Relative abundance of fructans in grass meristems during an extreme climatic event.
Acknowledgements
This study was supported by an ANR VALIDATE project grant and by the EC FP7 Animal Change project financially supported by the European Community’s Seventh Framework Programme (FP7/2007-2013) under the grant agreement number 266018. This study benefited from the CNRS staff and technical resources allocated to the ECOTRONS Research Infrastructure, as well as from the state allocation ‘Investissement d’Avenir’ AnaEE-France ANR-11-INBS-0001. We thank the technical staff of INRA UREP and Herbipole groups for extracting the intact soil monoliths; Pascal Chapon, Olivier Darsonville, Lionel Thiery, and the Ecotron team for their technical support during this experiment; and Pierre-Jean Haupais for his contribution to soluble carbohydrate analysis. AA and MLB received a post-doctorate position through an INRA sci-entific package (2010–2014); AA was also supported by the European FP7 ExpeER Transnational Access programme. MZ received a doctoral fellowship from the Auvergne region and the FEDER (Fond Européen du Développement Régional, ‘L’Europe s’engage en Auvergne’).
References
AbdElgawad H, Peshev D, Zinta G, Van den Ende W, Janssens IA, Asard H. 2014. Climate extreme effects on the chemical composition of
temperate grassland species under ambient and elevated CO2: a
com-parison of fructan and non-fructan accumulators. PLos One 9, e92044. Abeynayake SW, Etzerodt TP, Jonavičienė K, Byrne S, Asp T, Boelt B. 2015. Fructan metabolism and changes in fructan composition during cold acclimation in perennial ryegrass. Frontiers in Plant Science 6, 329.
Albert KR, Mikkelsen TN, Michelsen A, Ro-Poulsen H, van der Linden L. 2011a. Interactive effects of drought, elevated CO2 and
warming on photosynthetic capacity and photosystem performance in tem-perate heath plants. Journal of Plant Physiology 168, 1550–1561.
Albert KR, Ro-Poulsen H, Mikkelsen TN, Michelsen A, Van Der Linden L, Beier C. 2011b. Effects of elevated CO₂, warming
and drought episodes on plant carbon uptake in a temperate heath eco-system are controlled by soil water status. Plant, Cell & Environment 34,
1207–1222.
Ali AA, Medlyn BE, Crous KY, Reich PB. 2013. A trait-based ecosystem
model suggests that long-term responsiveness to rising atmospheric CO2 concentration is greater in slow-growing than fast-growing plants.
Functional Ecology 27, 1011–1022.
Allard V, Newton PCD, Lieffering M, Clark H, Matthew C, Soussana JF, Gray YS. 2003. Nitrogen cycling in grazed pastures at elevated CO2: N
re-turns by ruminants. Global Change Biology 9, 1731–1742.
Amiard V, Morvan-Bertrand A, Billard JP, Huault C, Keller F, Prud’homme MP. 2003. Fructans, but not the sucrosyl-galactosides,
raf-finose and loliose, are affected by drought stress in perennial ryegrass. Plant Physiology 132, 2218–2229.
Amiard W, Morvan-Bertrand A, Cliquet JB, Billard JP, Huault C, Sandstrom JP, Prud’homme MP. 2004. Carbohydrate and amino acid
composition in phloem sap of Lolium perenne L. before and after defoliation. Canadian Journal of Botany 82, 1594–1601.
Bonnett GD, Sims IM, Simpson RJ, Cairns AJ. 1997. Structural
diver-sity of fructan in relation to the taxonomy of the Poaceae. New Phytologist
136, 11–17.
Carlsson M, Merten M, Kayser M, Isselstein J, Wrage-Monnig N.
2017. Drought stress resistance and resilience of permanent grasslands are shaped by functional group composition and N fertilization. Agriculture Ecosystems & Environment 236, 52–60.
Casella E, Soussana JF. 1997. Long-term effects of CO2 enrichment and
temperature increase on the carbon balance of a temperate grass sward. Journal of Experimental Botany 48, 1309–1321.
Chatterton NJ, Harrison PA, Thornley WR, Bennett JH. 1993.
Structures of fructan oligomers in orchardgrass (Dactylis glomerata L.). Journal of Plant Physiology 142, 552–556.
Ciais P, Reichstein M, Viovy N, et al. 2005. Europe-wide reduction in
primary productivity caused by the heat and drought in 2003. Nature 437,
529–533.
Clark H, Newton PCD, Barker DJ. 1999. Physiological and morphological
responses to elevated CO2 and a soil moisture deficit of temperate pasture
species growing in an established plant community. Journal of Experimental Botany 50, 233–242.
Craine JM, Ocheltree TW, Nippert JB, Towne EG, Skibbe AM, Kembel SW, Fargione JE. 2013. Global diversity of drought tolerance and
grassland climate-change resilience. Nature Climate Change 3, 63–67. Dai AG. 2011. Drought under global warming: a review. Wiley Interdisciplinary
Reviews: Climate Change 2, 45–65.
De Boeck HJ, Bloor JMG, Kreyling J, Ransijn JCG, Nijs I, Jentsch A, Zeiter M. 2018. Patterns and drivers of biodiversity-stability relationships
under climate extremes. Journal of Ecology 106, 890–902.
Demel RA, Dorrepaal E, Ebskamp MJ, Smeekens JC, de Kruijff B.
1998. Fructans interact strongly with model membranes. Biochimica et Biophysica Acta 1375, 36–42.
Dieleman WI, Vicca S, Dijkstra FA, et al. 2012. Simple additive effects
are rare: a quantitative review of plant biomass and soil process responses to combined manipulations of CO2 and temperature. Global Change Biology 18, 2681–2693.
Drake BG, Gonzalez-Meler MA, Long SP. 1997. More efficient plants: a
consequence of rising atmospheric CO2? Annual Review of Plant Physiology
and Plant Molecular Biology 48, 609–639.
Dukes JS. 2007. Tomorrow’s plant communities: different, but how? New
Phytologist 176, 235–237.
Dumont B, Andueza D, Niderkorn V, Lüscher A, Porqueddu C, Picon-Cochard C. 2015. A meta-analysis of climate change effects on forage
quality in grasslands: specificities of mountain and Mediterranean areas. Grass and Forage Science 70, 239–254.
Felton AJ, Smith MD. 2017. Integrating plant ecological responses
to climate extremes from individual to ecosystem levels. Philosophical Transactions of the Royal Society B: Biological Sciences 372, 12.
Fernandez RJ, Wang MB, Reynolds JF. 2002. Do morphological
changes mediate plant responses to water stress? A steady-state experi-ment with two C4 grasses. New Phytologist 155, 79–88.
Gaujour E, Amiaud B, Mignolet C, Plantureux S. 2012. Factors and
processes affecting plant biodiversity in permanent grasslands. A review. Agronomy for Sustainable Development 32, 133–160.
Ghannoum O, Von Caemmerer S, Ziska LH, Conroy JP. 2000. The
growth response of C4 plants to rising atmospheric CO2 partial pressure: a
reassessment. Plant Cell and Environment 23, 931–942.
Grant K, Kreyling J, Heilmeier H, Beierkuhnlein C, Jentsch A. 2014.
Extreme weather events and plant–plant interactions: shifts between com-petition and facilitation among grassland species in the face of drought and heavy rainfall. Ecological Research 29, 991–1001.
Harmens H, Stirling CM, Marshall C, Farrar JF. 2000. Does
down-regulation of photosynthetic capacity by elevated CO2 depend on N supply
in Dactylis glomerata? Physiologia Plantarum 108, 43–50.
Hincha D, Livingston D, Premakumar R, Zuther H, Obel N, Cacela C, Heyer A. 2007. Fructans from oat and rye: composition and effects on
membrane stability during drying. Biochimica and Biophysica Acta 1768,
1611–1619.