HAL Id: hal-01279544
https://hal.archives-ouvertes.fr/hal-01279544
Submitted on 26 Feb 2016
HAL is a multi-disciplinary open access
archive for the deposit and dissemination of
sci-entific research documents, whether they are
pub-lished or not. The documents may come from
teaching and research institutions in France or
abroad, or from public or private research centers.
L’archive ouverte pluridisciplinaire HAL, est
destinée au dépôt et à la diffusion de documents
scientifiques de niveau recherche, publiés ou non,
émanant des établissements d’enseignement et de
recherche français ou étrangers, des laboratoires
publics ou privés.
Role of evaporation rate on the particle organization
and crack patterns obtained by drying a colloidal layer
Keyvan Piroird, Veronique Lazarus, Georges Gauthier, Arnaud Lesaine,
Daniel Bonamy, Cindy Rountree
To cite this version:
Keyvan Piroird, Veronique Lazarus, Georges Gauthier, Arnaud Lesaine, Daniel Bonamy, et al.. Role
of evaporation rate on the particle organization and crack patterns obtained by drying a colloidal layer.
EPL - Europhysics Letters, European Physical Society/EDP Sciences/Società Italiana di Fisica/IOP
Publishing, 2016, 113 (3), pp.38002. �10.1209/0295-5075/113/38002�. �hal-01279544�
Role of evaporation rate on the particle organization and crack
patterns obtained by drying a colloidal layer
K. Piroird1,2, V. Lazarus1 (a), G. Gauthier1, A. Lesaine1,2, D. Bonamy2 and C. L. Rountree2 1 Laboratoire FAST, Univ. Paris-Sud, CNRS, Universit´e Paris-Saclay, F-91405, Orsay, France.
2 SPEC, CEA, CNRS, Universit´e Paris-Saclay, 91191 Gif-sur-Yvette, France.
PACS 81.16.Dn– Self-assembly
PACS 82.70 Dd– Colloids
PACS 62.20.mt– Cracks
PACS 68.37.Ps– Surface analysis via Atomic force microscopy (AFM)
Abstract– A scientific hurdle in manufacturing solid films by drying colloidal layers is preventing them from fracturing. This paper examines how the drying rate of colloidal liquids influences the particle packing at the nanoscale in correlation with the crack patterns observed at the macroscale. Increasing the drying rate results in more ordered, denser solid structures, and the dried samples have more cracks.Yet, introducing a holding period (at a prescribed point) during the drying protocol results in a more disordered solid structure with significantly less cracks. To interpret these observations, this paper conjectures that a longer drying protocol favors the formation of aggregates. It is further argued that the number and size of the aggregates increase as the drying rate decreases. This results in the formation of a more disordered, porous film from the viewpoint of the particle packing, and a more resistant film, i.e. less cracks, from the macroscale viewpoint.
Obtaining solid layers via drying of colloidal suspensions is central to many technological fields [1]:Printing and painting [2], manufacturing protective or decorative coat-ings [3], designing materials at the nanoscale by low-cost processes [4, 5]. . . . From a fundamental viewpoint, col-loidal systems provide model systems to mimic the atomic behavior at a larger, more accessible length-scale [6,7].Un-derstanding, predicting and controlling the mechanisms driving their self-assembly represents a major challenge. Obtaining this control will aid in ensuring the resistance to failure while staying eco-friendly [3], especially for ap-plications requiring thick and/or hard coatings. Amongst several other parameters (thickness [8], ionic strength [9], substrate adhesion [10]...), the drying rate significantly im-pacts the cracking patterns [11–13]. This observation re-mains poorly understood for several reasons. During dry-ing, mass loss plays simultaneously [12] on the evolution of both the loading applying externally to the layer [14,15] and the intrinsic material properties of the forming solid [16]. From a macroscopic point of view, these two effects can hardly be deconvoluted. An important question to
(a)E-mail: veronique.lazarus@u-psud.fr
clarify is whether the drying rate plays only on the forma-tion kinetics yielding the same material or if it changes the way the material self-structures during evaporation lead-ing to variation in the final state.
This Letter experimentally investigates how the evap-oration kinetics influences the material properties at the particle (nano)scale and the fracture patterns at the con-tinuum scale. For this purpose, a colloidal suspension of hard monodisperse nanospheres was dried in a controlled atmosphere of tunable humidity. An atomic force micro-scope (AFM) captures the particle arrangement of the fi-nal layer topography. Bulk measurements of the pack-ing density complement these surface analyses. Counter-intuitively [4], these systems exhibit a progressive tran-sition from disorder to order when increasing the drying rate. This transition goes along with an increase of den-sity and more cracks. The balance between particle con-vection and diffusion alone cannot explain this transition, and particle agglomeration should be considered. Longer drying protocols enhance fracture resistance and favors particle agglomeration, and consequently disordered pack-ing structure and porosity.
col-K. Piroird et al.
loidal suspensions of monodisperse silica nanospheres (Lu-dox HS-40: φm
SiO2 = 40 ± 1% in mass of SiO2colloids with
a spec nominal diameter of 12 nm; φm
N a2O= 0.42 ± 0.04%
in mass of free alkalinity as Na2O; and spec density ρludox = 1.30 ± 0.01 g/cm3). Experiments herein use the
same bottle of suspension [17] and occur over a restricted time period (∼9 months). This ensures a minimal varia-tion and aging of the initial suspension. A glass Petri dish (inner radius R = 3.5 cm) initially contains 25 g (m0) of
Ludox. To capture the in-situ mass loss, the Petri dish rests on a precision scale (Sartorius Cubis series, accuracy 10−5g). The layer dries uniformly and forms a flat surface,
except in the vicinity of the dish edges where an upwards meniscus prevents the drop singularity (hence the coffee-ring type lateral drying [18]). The layer’s initial and final thicknesses are h0≃ 5 mm and h1≃ 1.8 mm, respectively.
An external humidity control system driven by Labview ensures a prescribed constant relative humidity (RH) in the scale housing [19], which is sealed with a gloverbox quality putty to minimize leaks.
Labview records the suspension’s mass (m), the tem-perature (T ), and the relative humidity (RH) during the whole drying process. For all the experiments, the tem-perature was T = 25 ± 2◦C. Hence, RH controls the
dry-ing rate. Initially, the mass decreases linearly with time (i.e. dm/dt ∼ constant) for a prescribed RH, as reported in the literature [20]. Transforming the mass loss into the evaporation rate, ˙E0 ( ˙E0 ≡ (dm/dt)/(ρwaterπR2)),
one finds that ˙E0 decreases linearly with the applied RH.
Experiments verified that ˙E0 for pure water and Ludox
are equal barring the same drying conditions. Modulating RH from 10% to 95% makes ˙E0 vary over a decade from
˙
E0= 36.1 ± 0.7 nm/s to ˙E0= 3.4 ± 0.2 nm/s.
After the constant evaporation rate regime, a falling-rate regime occurs where the evaporation slows down and eventually stops. Once dm/dt is negligible (after ∼ 50h for RH = 10% and after ∼ 700h for RH = 95%), the sample is brought back to ambient humidity. Postmortem observations reported hereafter are independent of the re-turning protocol: An abrupt return (obtained by opening the housing) or progressive one (obtained by bringing the RH inside the box back to ambient humidity in a stepwise process as slow as 10% humidity steps every 12 h) does not alter the solid porosity nor the particles surface ar-rangement. It has also been checked that increasing the Petri dish radius from 2.5 to 6.8 cm, keeping the same initial thickness, does not alter experimental observations reporter henceforth.
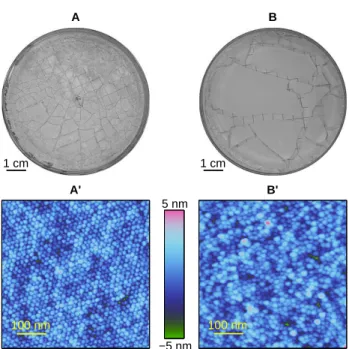
A camera (USB2 uEye from IDS imaging), located above the scale’s enclosure, images the evolution of the sample. As the solvent evaporates, the particles move closer to one another forming a solid network which pro-gressively retracts. The rigid substrate (i.e. the Petri dish) hampers the retraction leading to tensile stresses which cause the layer to fracture (Fig. 1). These cracks begin to appear just as the evaporation rate enters the
A’ 100 nm 5 nm −5 nm B’ 100 nm A 1 cm B 1 cm
Fig. 1: Effect of the drying rate at the macro and nanoscales. Top: Final crack patterns observed after evaporation for RH = 10% (A) and RH = 95% (B). Bottom: Topographical AFM images depicting the colloid arrangement at the surface of the layers for RH = 10% (A’) and RH = 95% (B’). The scan size is 500 × 500 nm2. The out-of-plane height ranges over 10 nm which is less than a colloid diameter.
falling-rate regime. This point also coincides with the time at which the meniscus forms at the top of the par-ticles layer, yielding a decreasing capillary pressure in the pores [8, 15, 21]. A Bruker Dimension Icon Atomic Force Microscope (AFM) images the particle arrangement on the evaporation surface of the fragmented morsels. The AFM records topographical images in Tapping mode us-ing a Bruker RTESPA tip (radius of curvature ∼ 8 nm). The scan sizes are 500 × 500 nm2with a resolution of 512
× 512 pixels2.
Determining the packing fraction, φ = mdry/(ρsilicaVT),
sheds light on the bulk ordering of the solids. The mass of a dried sample (mdry), its total volume (VT) and the
silica density (ρsilica) are estimated as follows. To
ob-tain mdry, the sample are heated at 200◦C for more
than 3 hours to remove remaining water [22]. To ob-tain VT, imbibition and Archimedes’ principle are used:
After immersion, the pores soak up water and the sam-ple’s total volume is obtained via hydrostatic weighing [23]. This process was repeated using ethanol rather than water; the two values of VT agree within less than
2%. To obtain an accurate estimation of ρsilica, the
di-lution method is invoked [24, 25]: Several diluted suspen-sions of Ludox, of densities ρdiluted, are prepared at
pre-scribed mass fractions (φm
diluted). The initial mass
frac-tion φm
0 is estimated by weighing dry residues at 200◦C
rela-tionship 1 − (ρwater/ρdiluted) = φmdiluted(1 − (ρwater/ρsilica)).
We found ρsilica= 2.26 g/cm3. Chemically adsorbed water
on the nano-particles leads to a possible overestimation of mdry and underestimation of ρsilica, and thus, an
overes-timation of the packing fraction φ. Silica dried at 200◦C
can retain up to 5 silanol groups per nm2[26]. This
corre-sponds to as much as 1.5% residual water in mass, leading to atmost 3.6% overestimation of φ.
Results–Figures 1A and B show snapshots of the crack-ing pattern observed in the Petri dish after drycrack-ing (i.e. when the mass loss is negligible) for the two extremes. Drying quickly (RH = 10%) leads to a large quantity of small fragments (∼ 50 visible fragments in the center of the Petri dish, within a disk of radius ∼ 1.75 cm). On the contrary, the slowest drying rate (RH = 95%) leads to a small quantity of large fragments (5 fragments visible over the same area). Generally, the typical fragment size de-creases as ˙E0 increases (or equivalently as RH decreases).
The drying rate also alters the nanoscale arrangement of the colloids at the layer surface as observed via the AFM. An almost 2D crystalline structure forms for the fastest rate (RH = 10%; Fig. 1A’), and an amorphous one for the lowest rate (RH = 95%; Fig. 1B’).
Two-dimensional Fourier spectrum conducted on the AFM topographical images shown in Figs. 2A (RH = 10%) and B (RH = 95%) access the differences in parti-cle arrangements on the drying surface. For the fastest evaporation rate, the pattern exhibits a sixfold symmetry characteristic of a hexagonal 2D lattice. On the contrary, no discrete wavenumber can be identified for RH = 95% and only a central circular halo occurs. This is character-istic of an amorphous structure.
The pair correlation function, g(r), represents the prob-ability of finding the center of a particle at a distance r away from a given reference particle. Moreover, it aids in characterizing the long range order of the images. As in standard practice, g(r) is normalized by that of an ideal gas (i.e. non-correlated particle positions) [29]. Fig. 2C depicts the two extreme cases: RH = 10% (top curve with circular points) and RH = 95% (bottom curve with trian-gular points). For RH = 10%, g(r) presents a well defined sequence of peaks extending more than 12 d where d ≃ 15 nm is the particle diameter acquired from Fig. 1A’ and 1B’ (note that this value is slightly higher than the spec one). The first several g(r) peaks coincide well with the-oretical values for a perfect hexagonal lattice (indicated by dash vertical lines), even if they widen as r increases. This is the signature of a quasi-long range translational order. Conversely, the RH = 95% peaks become barely visible for r ≥ 2d indicating a loss of translational order, as expected for amorphous structure.
The orientational order evolution can be investigated via the bond angle order parameter ψn defined by
ψn = 1 M M X k=1 1 Nk Nk X l=1 exp (i n θkl) , (1) 0 2 4 6 8 10 12 0 1 2 3 4 5 r/d g(r) RH=95% RH=10% A B C 1/10 nm−1 1/10 nm−1
Fig. 2: Fourier spectrum for RH = 10% (A) and RH = 95% (B), obtained by Fast Fourier transforms of the two topograph-ical AFM images presented in Fig. 1. Note the sixfold spot symmetry for RH = 10%, which is the signature of an hexag-onal particle arrangement. The spots vanish for RH = 95%, and the Fourier pattern become an isotropic disk, which is the signature of amorphous-like arrangement. Panel C shows the pair correlation function g(r) for these two images. The ra-dius has been normalized by the colloid diameter d ≃ 15 nm (as measured from Fig. 1). The vertical dashes lines corre-spond to the peaks of a perfect hexagonal lattice: r1/d = 1,
r1/d = √ 3, r1/d = 2, r1/d = √ 7, r1/d = 3, r1/d = √ 13, r1/d = 4, r1/d = √ 21, r1/d = 5, r1/d = √ 31. For sake of clarity, the g(r) obtained for RH = 10% is shifted upwards by two units.
where n is the number of nearest neighbors, M is the num-ber of particles in the AFM image, Nk corresponds to the
number of nearest neighbors of particle k, and θkl is the
angle between a fixed direction and the line linking the centers of particles k and l [30]. For the six-fold sym-metry visualized in Fig 2A, n should be set to 6. For a perfect hexagonal arrangement ψ6 = 1 while for an
amorphous phase ψ6 = 0. The evolution of ψ6 with ˙E0
(shown in Fig. 3A) exhibits two regimes with a crossover at ˙Ec ∼ 10 nm/s. For ˙E0 ≤ ˙Ec, ψ6 ≃ 0.05 ≪ 1. This
reflects a disordered surface for low evaporation rates. On the other hand when ˙E0> ˙Ec, ψ6 increases linearly with
˙
E0. This is consistent with the observations of the
trans-lation order (fig. 2C): Increasing the drying rate yields increasing hexagonal order at the surface. The fact that ψ6 remains significantly lower than one reveals that even
for the fastest drying rate the surfaces are not perfect 2D hexagonal lattices.
The above AFM analysis is restricted to surface char-acterizations of the particle arrangement. In a comple-mentary way, the particle volume fraction φ provides
in-K. Piroird et al. 0 10 20 30 40 0 0.1 0.2 0.3 0.4 0.5 0.6 ˙ E0 (nm/s) ψ6 A 0 10 20 30 40 0.55 0.6 0.65 0.7 ˙ E0(nm/s) φ B
Fig. 3: A: Bond orientational order parameter (ψ6) of the
par-ticle arrangement as a function of the evaporation rate ˙E0.
Error bars indicate the standard deviation over measurements performed on 10 different AFM images. The dashed horizontal and inclined lines correspond to linear fits over the two rate regimes and the vertical line in between indicates the crossover value ˙Ec≃ 10 nm/s. B: Overall packing fraction φ as a function
of ˙E0 measured by immersion of the samples in water (black
circles) and ethanol (red squares). The error bars take into account the overestimation of φ due to residual water.
formation on the bulk particle arrangement. Fig. 3B dis-plays the evolution of φ as a function of ˙E0. Two regimes
occur with a crossover ˙Ec ≃ 10 nm/s. This crossover
co-incides with that observed in Fig. 3A which is related to the surface orientational order. In the first regime
˙
E0 ≤ ˙Ec, φ increases linearly with ˙E0. In the second
regime ˙E0 > ˙Ec, φ increase rapidly slows down and even
saturates to φ ≃ 0.65 ± 0.02, which is just above the random close packing value (φRCP = 0.64 for
monodis-perse packing) but below the value of a compact structure (φHCC/F CC = 0.74). This shows that the bulk is, to a
large extent, disordered and raises the question to what extend does the order extend into the bulk.
Discussion–The packing structure results from the way the particles bundle. Its dependency on the drying rate is usually rationalized [31,32] via the dimensionless P´eclet number: P e ≡ h0E˙0/D0 where D0 is the diffusion
coef-ficient for silica particles. Using Stokes-Einstein relation, one gets D0 ≃ 2.04 × 10⁻¹¹m2/s at T = 25◦C. P e
rep-resents the ratio between the convection time for the par-ticles toward the suspension surface and their Brownian diffusion time. A high P e indicates directional packing implying the solid forms layer by layer. A low P e means uniform and isotropic bulk compaction.
Checking whether or not P e controls the packing struc-ture requires two additional experimental runs. The ex-periments invoke two parameter sets {h0, RH} at a
sim-ilar P´eclet number well above P e = 1.5 (i.e. E˙0 >
˙
Ec = 10 nm/s) which should result in a similar surface
crystalline arrangement. The first experimental run uses h0 = 5 mm and ˙E0 = 36.1 nm/s (RH=10 %) and yields
P e = 4.4. The second run uses h0 = 10 mm and
˙
E0= 26 nm/s (RH = 50 %) and yields P e = 6.4 (slightly
larger). The first run exhibits an ordered surface
arrange-C 0 50 100 150 200 250 10 15 20 25 t(h) m (g) A B
without holding period with holding period
Fig. 4: Influence of the drying protocol on the dried layer’s nanostructure and ability to crack. A: Time evolution of the Ludox mass m within the Petri dish in a drying experiment performed at RH = 10% with and without a holding period. This holding period occurs when the solid fraction is φ = 0.335 and lasts 180 h. B: Fourier spectrum of a typical topographical AFM images (main panel) and crack pattern (inset) observed after evaporation without the holding period (this figure is a composite of Fig. 2A and Fig. 1A, and facilitates the com-parison with panel C). C: Fourier spectrum of a typical topo-graphical AFM images (main panel) and crack pattern (inset) observed after evaporation with the holding period.
ment, while a disordered arrangement occurs for the sec-ond one. This demonstrates that P e is not the relevant parameter driving the particle packing.
Beyond the competition between convection and diffu-sion, the formation of aggregates within the suspension could be an important mechanism driving the crystalline-to-amorphous arrangement in the solid. If this is the sce-nario, then slower drying favors the formation of aggre-gates and subsequently the formation of an amorphous solid. Testing this hypothesis calls for two new experimen-tal runs. Both runs invoke RH = 10% and h0 = 5 mm
(Fig. 4). The first experimental run uses, as previously, a continuous drying scheme and gives a crystalline sur-face arrangement. The second experimental run invokes an 180 hours holding period (i.e. E˙0 ∼ 0 g/h for 180
hours) launched when m = 18.2 g. During this holding period φ = 0.335, the suspension is concentrated enough to favor agglomerate formation. After the holding period, the sample resumes drying with RH = 10% until ˙E0∼ 0.
The solid layer exhibits an amorphous arrangement on the drying surface. Thus, it is conjectured that long drying protocols (including holding periods) favor the agglomer-ate formation which subsequently alters the nanostructure packing (amorphous instead of crystalline as imaged with
the AFM). At the macroscale, the crack patterns of the second run are larger than the ones obtained, without a holding period, although they appear under the same ex-ternal drying conditions. This implies that slowing down the drying enhances the macroscopic resistance to fracture by changing the way the particles bundle.
Conjecturing agglomerate formation sheds new light on the ψ6vs. ˙E0 and φ vs. ˙E0 curves displayed in fig. 3. At
first glance, one expects a correlated increase of ψ6and φ
with ˙E0as they both increase with the packing order, yet
this does not occur. Still, the curves can be understood assuming that ˙Ec is a critical value below which every
particle of the suspension is part of an aggregate before solification. Subsequently:
• For ˙E0 < ˙Ec, the packing has to be amorphous and
Ψ6 ∼ 0. Increasing ˙E0 causes the mean size of the
aggregates to decrease, hence the mean size of the pores decreases, thus increasing the packing fraction (i.e. φ increases).
• For ˙E0 > ˙Ec, the number of isolated particles
in-creases with ˙E0, making it more likely to have
crys-talline zones, at least at the surface, where surface tension possibly drives the ordering [33].
As a result, ψ6 increases with ˙E0. Additionally,
iso-lated particles fill the space between the remaining aggregates. This explains the slower increase, and even the saturation of φ.
In conclusion, this paper demonstrates that the evapo-ration rate, during drying of a colloidal layer, modifies not only the drying kinetics but also the final dried material: Increasing the rate favors more ordered arrangements and denser packing. Explaining this scenario requires more than the Peclet number and its simple balance between advection and diffusion. Studies herein suggest that ag-gregation as a result of the drying protocol plays a sig-nificant role in the formation of the solid. This may be of practical interest in the design of colloidal drying pro-cesses to obtain tunable and well-controlled 3D nanopar-ticle self-assemblies (e.g. crystals, modulated porosity solids...) over large dimensions, with innovative photonics and biotechnology applications [34]. This rate dependent solid formation has a consequence on the fracture behav-ior: The resistance to fracture increases by decreasing the drying rate or by introducing a holding period at a wisely chosen time. Work in progress aims at quantifying how the material properties at the macroscale, notably its elastic modulus and toughness, emerge from the nanostructure and its history of formation.
∗ ∗ ∗
The co-authors would like to thank F. Doumenc, B. Guerrier, L.-T. Lee, P. Reis, J.-B. Salmon for fruitful discussions, A. Aubertin for the controlled drying cham-ber and for C. Wiertel-Gasquet for technical support in
Labview. This research is supported by Triangle de la Physique (RTRA), Ile-de-France (C’Nano and ISC-PIF) and Investissements d’Avenir of LabEx PALM 0039-PALM) and LabEx LaSIPS (ANR-10-LABX-0040-LaSIPS).
REFERENCES
[1] Xu P., Mujumdar A. S. and Yu B., Drying technology, 27(2009) 636.
[2] Routh A. F., Reports on Progress in Physics, 76 (2013) 046603.
[3] Keddie J. and Routh A. F., Fundamentals of Latex Film
Formation (Springer) 2010.
[4] Mar´ın A. G., Gelderblom H., Lohse D. and Snoeijer J. H., Phys. Rev. Lett., 107 (2011) 085502.
[5] Merlin A., Salmon J.-B. and Leng J., Soft Matter, 8 (2012) 3526.
[6] Yethiraj A. and van Blaaderen A., Nature, 421 (2003) 513.
[7] Editorial, Nature Materials, 14 (2015) 1.
[8] Lazarus V. and Pauchard L., Soft Matter, 7 (2011) 2552.
[9] Pauchard L., Parisse F. and Allain C., Phys. Rev. E, 59(1999) 3737.
[10] Groisman A. and Kaplan E., Europhysics Letters, 25 (1994) 415.
[11] Caddock B. and Hull D., Journal of materials science, 37(2002) 825.
[12] Gauthier G., Lazarus V. and Pauchard L., EPL, 89 (2010) 26002.
[13] Boulogne, F., Giorgiutti-Dauphin´e, F. and Pauchard, L., Oil Gas Sci. Technol. – Rev. IFP
Energies nouvelles, 69 (2014) 397.
[14] Scherer G. W., Journal of Non-Crystalline Solids, 109 (1989) 171.
[15] Chekchaki M. and Lazarus V., Transport in Porous
Media, 100 (2013) 143.
[16] Giorgiutti-Dauphin´e F.and Pauchard L., The
Euro-pean Physical Journal E, 37 (2014) 1.
[17] Ludox HS-40, Batch number BCBK7778V, http://www.sigmaaldrich.com/Graphics/COfAInfo/flu ka/pdf/PDF474093.pdf, accessed : November 12, 2015. [18] Deegan R. D., Bakajin O., Dupont T. F., Huber G.,
Nagel S. R.and Witten T. A., Nature, 389 (1997) 827. [19] Bodiguel H., Doumenc F. and Guerrier B.,
Lang-muir, 26 (2010) 10758.
[20] Brinker C. J. and Scherer G. W., Sol-gel science :
the physics and chemistry of sol-gel processing (Academic
Press, Boston) 1990.
[21] Dufresne E. R., Corwin E. I., Greenblatt N. A., Ashmore J., Wang D. Y., Dinsmore A. D., Cheng J. X., Xie X. S., Hutchinson J. W.and Weitz D. A.,
Physical Review Letters, 91 (2003) 224501.
[22] Iler R. K., The Chemistry of Silica: Solubility,
Polymer-ization, Colloid and Surface Properties and Biochemistry of Silica (Wiley) 1979.
[23] Barlet M., Kerrache A., Delaye J.-M. and Roun-tree C. L., Journal of Non-Crystalline Solids, 382 (2013) 32 .
K. Piroird et al.
[24] Finsy R., Moreels E., Bottger A. and Lekkerk-erker H., Journal of Chemical Physics, 82 (1985) 3812. [25] Adamczyk Z., Jachimska B. and Kolasiska M.,
Jour-nal of Colloid and Interface Science, 273 (2004) 668 .
[26] Zhuravlev L., Colloids and Surfaces A, 74 (1993) 71 . [27] Giuseppe E., Davaille A., Mittelstaedt E. and
Franc¸ois M., Rheologica Acta, 51 (2012) 451.
[28] Gauthier G., Lazarus V. and Pauchard L.,
Lang-muir, 23 (2007) 4715.
[29] Hansen J. P. and McDonald I. R., Theory of Simple
Liquids (3rd ed.) (Academic Press) 2005.
[30] Reis P. M., Ingale R. A. and Shattuck M. D.,
Phys-ical Review Letters, 96 (2006) 258001.
[31] Routh A. F. and Zimmerman W. B., Chem.
Engineer-ing Science, 59 (2004) 2961.
[32] Ekanayake P., McDonald P. J. and Keddie J. L.,
The European Physical Journal Special Topics, 166
(2009) 21.
[33] Bigioni T. P., Lin X.-M., Nguyen T. T., Corwin E. I., Witten Thomas. A.and Jaeger H. M., Nature
Materials, 5 (2006) 265.
[34] Dutta J. and Hofmann H., Self organization of
col-loidal nanoparticles in Encyclopedia of Nanoscience & Nanotechnology, edited by Nalwa H. S., Vol. 9