HAL Id: hal-01636477
https://hal.archives-ouvertes.fr/hal-01636477
Submitted on 16 Nov 2017HAL is a multi-disciplinary open access archive for the deposit and dissemination of sci-entific research documents, whether they are pub-lished or not. The documents may come from teaching and research institutions in France or abroad, or from public or private research centers.
L’archive ouverte pluridisciplinaire HAL, est destinée au dépôt et à la diffusion de documents scientifiques de niveau recherche, publiés ou non, émanant des établissements d’enseignement et de recherche français ou étrangers, des laboratoires publics ou privés.
Investigating Dynamic Triggering of Seismicity by
Regional Earthquakes: The Case of the Corinth Rift
(Greece)
Louis de Barros, Anne Deschamps, Anthony Sladen, Hélène Lyon-Caen,
Nicholas Voulgaris
To cite this version:
Louis de Barros, Anne Deschamps, Anthony Sladen, Hélène Lyon-Caen, Nicholas Voulgaris. Inves-tigating Dynamic Triggering of Seismicity by Regional Earthquakes: The Case of the Corinth Rift (Greece). Geophysical Research Letters, American Geophysical Union, 2017, �10.1002/2017GL075460�. �hal-01636477�
Investigating dynamic triggering of seismicity by
regional earthquakes:
the case of the Corinth Rift (Greece)
Louis De Barros
1*, Anne Deschamps
1, Anthony Sladen
1, Hélène
Lyon-Caen
2, Nicholas Voulgaris
31 Université Côte d’Azur, CNRS, OCA, IRD, Géoazur, 250 rue Albert Einstein, Sophia Antipolis, 06560 Valbonne, France
2 Laboratoire de Géologie, Département de Géosciences, Ecole Normale Supérieure,
CNRS UMR 8538, PSL Research University, Paris F-75005 France.
3 National and Kapodistrian University of Athens, Department of Geology &
Geonvironment , 15784 Athens, Greece
* Corresponding author : debarros@geoazur.unice.fr (Louis De Barros)
References
De Barros, L., Deschamps, A., Sladen, A., Lyon‐Caen, H., & Voulgaris, N. (2017). Investigating
dynamic triggering of seismicity by regional earthquakes: the case of the Corinth Rift (Greece).
Geophysical Research Letters. Doi:10.1002/2017GL075460
Abstract
Dynamic triggering has been commonly observed after large teleseismic events, but the physics behind it is still under debate. To broaden observations, we here focus on the dynamic triggering by regional earthquakes, i.e. by events with magnitude lower than 6.2 at distances smaller than 600 km. The western part of the Corinth Rift (Greece) is characterized by intense seismic swarms, and is therefore adapted to study such responses. The microseismicity rates before and after the transient perturbations are high enough to analyze 30 regional earthquakes out of the 59 occurring in 2013. More than 40 % of those 30 events, including earthquakes with magnitude as small as 4.5, are associated with a significant seismicity rate increase. The triggerability primarily depends on the amplitude of the seismic waves. However, triggering is mainly observed when the seismic perturbations are orthogonal to the faults, which suggests that fluid pressurization is likely involved.
Keywords
1 Introduction
Dynamic triggering, i.e. the triggering of seismicity by distant earthquakes, has been first observed after the Landers earthquake (1992) mainly in geothermal areas across the western United States (Hill et al., 1993), and after the M=7.1 Hector Mine (1999,
Gomberg et al, 2001). Following these pioneer observations, remote dynamic
triggering has been observed in numerous places and different contexts worldwide, mainly following large (M>7) earthquakes, at distances that can reach several thousand of kilometers (e.g. Prejean et al., 2004; Gomberg et al., 2005; Velasco et al, 2008; see Freed, 2005 and Hill and Prejean, 2015 for review papers). For examples, triggered events have been evidenced in Greece and Turkey after the 1999 M=7.6 Izmit (Brodsky et al, 2000, Durand et al, 2010), in western US after the 2002 M=7.9 Denali earthquake (Prejean et al, 2004), and worldwide after the 2011 M=9.0 Tohoku-Oki earthquake (Gonzalez-Huizar et al, 2012) or the 2012 M=8.6 East Indian Ocean (Pollitz et al., 2012). The dynamic transient perturbations induce a stress change, which is recognized to be strong enough to trigger slip on a pre-stressed fault (Gomberg et al., 1997). However, how transient perturbations with low amplitude can trigger earthquakes thousands of kilometers away from the source is still an open question, especially as remote triggering can last from a few seconds up to several days (e.g. Shelly et al, 2010, Brodsky, 2006). As most of the triggering cases were originally seen in geothermal or volcanic context (e.g. Hill et al, 1993), pressurized pore fluid and its subsequent diffusion are likely candidates. In recent years, the occurrence of triggered tremors (e.g. Peng et al., 2009; Zigone et al, 2012, Aiken et
al., 2016) shows that perturbing waves also trigger aseismic motion (Shelly et al.,
2011) and may modify frictional properties. Velasco et al. (2008) showed that dynamic triggering may happen in any context with any types of perturbing waves, suggesting that different processes can be involved. Therefore, despite numerous observations of dynamic triggering, the physics behind it is still under debate.
To explore those physical processes, observations are key. As aforementioned, observations of dynamic triggering by teleseismic earthquakes are now well documented. However, observations from regional earthquakes are far less common.
Arnadottir et al. (2004) and Daniel et al. (2008) studied dynamically triggered
responses at less than 100 km from two M~6.5 earthquakes in South Iceland. Hough (2005) observed remote dynamic triggering in Southern California by M5-to-7 events at distances up to 250 km. Aiken and Peng (2014) studied the responses of three geothermal areas in California to both regional (M >5.5) and teleseismic earthquakes. So, only few observations exist on triggering by regional earthquakes. However, in some areas of the world, moderate seismicity (up to M=6) at regional distances (i.e.
with distances smaller than 600 km) is far more frequent than large teleseismic events at the global scale, and might therefore have a large impact on the temporal behavior of seismicity.
In this study, we investigate the seismicity of the Western Corinth Rift, in western Greece, a choice motivated by 1) the intense seismic activity of the area, reflecting the near-critical state of stress of at least parts of the fault system (e.g. Lambotte et
al., 2014), 2) its very high extensional strain rate, which is expected to promote
dynamic triggering (Hill and Prejean, 2015), and 3) the occurrence of numerous regional earthquakes, at a few hundred kilometers, with a good azimuthal distribution. Our objective is therefore to look at the response of the Corinth Rift to transient, small perturbations coming from regional events with moderate magnitude (Mw from 4.2 to 6.2), at different times and from different origins. By a systematic analysis of those responses, we aim at better understanding the processes behind the dynamic triggering.
More specifically, our detection of microseismic events will be based on a seismic array of 8 stations, located North-West of the Gulf. The comparison of the seismicity rates measured a few hours before and after 59 regional earthquakes reveals a significant increase in more than 20% of the cases. We show that this dynamic triggering seems to be strongly dependent on the incoming wave amplitudes, but also on their azimuths.
2 Regional earthquakes and Corinth Rift microseismicity
The Corinth Rift, in Central Greece, is an almost east-west back-arc basin of the Hellenic subduction. At a regional scale, it is therefore surrounded by major faults, reflecting the transition between 1) the Hellenic subduction, southward and westward and 2) the eastward termination of the North-Anatolian fault. Similarly to the Corinth Rift, several other rifting zones, located north-east of the Gulf, are also active back-arc basins of the Hellenic subduction (Flotté et al., 2004, Royden and Papanikolaou, 2011). Therefore, numerous earthquakes with magnitude up to 6.2 occurred in 2013 within a few hundred kilometers from the Corinth Gulf. We focus here on regional earthquakes (later referred to as REQs) with magnitude greater than 4.2, occurring in 2013 at distances between 50 and 600 km from the array location. From the EMSC catalog (www.emsc-csem.org), 103 regional earthquakes were selected, mainly originating from the Hellenic subduction, the western Turkish coast, and the other rift zones of Greece. From this event list, we removed 1) the aftershocks occurring within 6 hours of their mainshocks; 2) the pairs of events separated by less than 6 hours; and 3) the events during periods when less than 6 stations where properly running in the station array. The location and magnitude of the 59 regional events kept for this study are shown in figure 1.
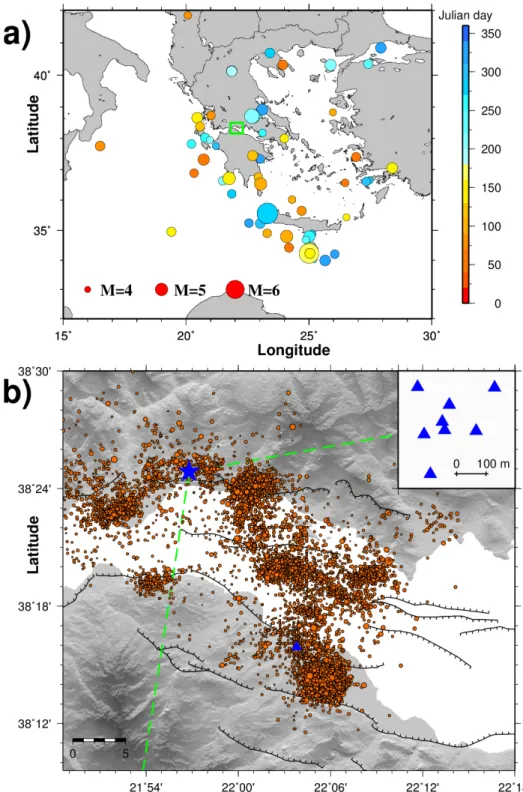
Figure 1: Map of situations. a) Regional map. The regional earthquakes used in this
study are shown as colored circles, which size indicates the magnitude. The color-scale stands for the Julian day in the year 2013. The green rectangle shows the location of the West part of the Corinth Rift which is zoomed in b. b) Corinth Rift map. The dots indicate the seismicity recorded in 2013 (CRL, crlab.eu). The star indicates the position of the array, which is detailed in the top-right insert. The triangle indicates the station AGEO location. The green dashed lines show the azimuthal limits in which
local seismicity is selected.
The high extensional strain rate (6-to-15 mm/yr localized in a 10-20 km wide area,
Briole et al., 2001) of the Corinth Rift makes this continental rifting area (and mainly
its western part) one of the most seismically active worldwide. It is monitored by the Corinth Rift Laboratory, a permanent network of 17 stations (CRL, crlab.eu). Some major earthquakes struck this area, such as the magnitude 6.2 earthquake in 1995 (Aigion, Bernard et al., 1997). However, the seismicity is mainly characterized by swarms of low-magnitude (M<3.8 in 2013) earthquakes. For example, intense but short swarms of seismic activity occurred in 2001 (Pacchiani & Lyon-Caen, 2010), 2003-2004 (Lambotte et al., 2014, Duverger et al., 2015) and 2013 (Kapetanidis et al., 2015; Chouliaras et al., 2015). Some authors suggested that this swarm behavior might be the consequence of pressurized fluids migrating at depth (e.g. Bourouis and
Cornet, 2009; Pacchiani & Lyon-Caen, 2010; Duverger et al., 2015). Another possibility
is the slow motion of a creeping layer at 7-to-10 km depth with embedded seismic patches (e.g. Dublanchet et al., 2015). The process driving this seismicity, and its relationships with the occurrence of large earthquakes are therefore still under debate. Throughout the year 2013, more than 22000 earthquakes of magnitude lower than 3.8 were detected and located by the CRL network. Scattered seismicity occurred in the center and north-west of the Gulf (see fig. 1b), together with a seismic swarm south-west of the Gulf between the 21th of May and the end of August 2013. Kapetanidis et
al. (2015) localized and analyzed more than 1500 events from this swarm, with
magnitude ranging between 1 and 3.7. They originated from a very localized area, South-West of the Gulf, 4 km southeast of the Aigion city. The depth of those events mainly ranged between 8 and 10 km, indicating that they are generated at the base of the Pirgaki fault (Kapetanidis et al., 2015). Two other seismic bursts of activity of short duration were also observed in September and November 2013.
3 Array detection and processing
To improve the detection of events compared to that of the CRL catalog, an array of 8 stations (Trillium 40s) has been running since the 1st of February 2013, north west of the Corinth Gulf (figure 1). The station distribution is inspired by a Fibonacci spiral curve, with a minimal and maximal aperture of 30 m and 370 m, respectively. Event detection is performed using the similarity of waveforms recorded on the vertical component, filtered between 2 and 8s. On 2s-long sliding windows, overlapped by 50 %, the cross-correlation function among all pairs of stations are computed and their maximum are averaged. A threshold of 0.6 is then used to detect events. Local noise signals of anthropogenic origin are discarded based on an amplitude criterion: if the maximum amplitude differs by more than 40 % among stations, events are not kept. We also discard regional events by selecting only events 1) with a computed duration smaller than 16 s and 2) which show a sharp onset (i.e. a 20 % jump in the correlation at the onset of the events). With this array analysis, the number of detected events is about threefold that of the CRL catalog. A drawback to this approach is that no
location can be computed for these newly detected events.
For each detected event, back-azimuth and incidence angles are then estimated using a standard beam-forming approach in time domain (Johnson and Dudgeon, 1992; Rost
and Thomas, 2002). The theoretical delay times between stations is computed on a
grid of azimuth and incidence angles and used to shift back the data. The shifted data are then stacked, the angles for which the stacked data have the highest energy are selected as the most likely angles. We then keep only the events originating from the Corinth Gulf, i.e. with a back-azimuth between 80 and 190°. This azimuthal range is quite large as site effects can disturb the azimuth computation by up to 25°.
We performed this array analysis for a 6-hour time-window centered on the theoretical P-wave arrival-time of every REQ. We define the ratio R as the number of events detected in the 3-hours following the REQ, normalized by the total number of events in the 6-hour window. This ratio is used as a quantitative indication of the changes in the microseismicity rate: a value around 0.5 means a constant activity, while a ratio close to 1 indicates a strong seismicity increase following the mainshock.
Figures S1 to S5 present the array analysis results together with the seismic waveforms for 5 regional earthquakes. In particular, the analysis is shown in fig S1 for a M=4.3 earthquake from Crete Island (2013/03/25, 20:55:19). Among the detected events, criteria on impulsive events, azimuths and duration of events allow the selection of 19 local events. Cross-checking this selection by eye-screening, all the waveforms look similar to the local event shown in fig. S1d, validating the efficiency of the selection even if the REQs and the local events occurred in similar directions. Among those 19 events, 14 events occurred after the REQ arrival time, leading to a R ratio of 0.73. The four other cases (fig. S2 to S5) are examples for which the REQs leads to a high R-ratios, with a high number of local events.
4 Results
Out of the 59 selected REQs, 29 are associated with less than 7 local seismic events detected and are discarded from the analysis. This threshold was chosen in order both to allow meaningful comparisons and to keep as many REQs as possible. For the remaining 30 REQs, associated with at least 7 local events, the distribution of the ratio R (figure 2a) shows a mean value of 0.55, but with a clear asymmetry. The natural seismicity variability is estimated by performing the same analysis on 600 windows randomly selected throughout the year 2013. The 256 6-hour windows which contain at least 7 events lead to a normal distribution with a mean value of 0.495 and a standard deviation of 0.17 (see fig. S6). Compared to this natural variability, the distribution obtained around the REQs (fig. 2a) is strongly biased toward high values of R, meaning that on average the number of microseismic events significantly increased after the REQs. A more detailed examination shows that out of the 30 REQs with more
than 7 local events, about 55% show a nearly constant rate of microseismicity with a R-ratio between 0.33 and 0.67. A ratio higher than 0.67 is observed for 12 events, i.e. for 40% of those REQs. The 29 REQs without 7 local events (see fig. S7) also seems to have a R-value distribution biased toward high values, with an increase of seismicity just after the REQs. 75 local events are indeed detected in the 3-hour window after the REQs, but only 61 events occurred before. However, we consider that the number of detection is too low to conclude on triggering. In summary, among the 59 selected REQs, 77% cannot be significantly associated with a change of local seismicity, but more than 20% unambiguously triggered seismicity.
Figure 2: a) Cumulative distribution of event ratio R. The red line indicates the
Poisson distribution, corresponding to the natural variability of the event rate (see fig. S6). b) Cumulative histogram of the number of local seismic events around the calculated arrival time of the regional earthquake. A cumulative rate of 10.9 events per 12 minutes is used to normalize this distribution, in order to have the average number of events before the REQs equal to 1 (black line). The red line is the best fit for an Omori's law (~1/t).
These percentages are based on 471 events detected in the 59 6-hour windows around REQ arrival times. Out of them, 156 and 315 occurred before and after the REQs arrival times, respectively, showing a clear increase in the seismicity rate. This dynamic response to transient perturbations can also be seen on the cumulative time distribution of microseismic events, centered on the REQs arrival times (Figure 2b). The background seismicity, i.e. the number of local events before the REQs, shows very small variations compared to the sharp increase following the REQs arrival time, where the seismicity rate is multiplied by a factor 4. The rate of seismicity is indeed varying from ca 10.9 events every 12 mins before the REQs to 46 events in the first 12 minutes following the REQs arrival (see fig 2b). This large and quick increase might be associated to a direct triggering by the propagating waves of the REQs. This can also be seen in figure S2, S3 and S5, where event rate increase accompany the REQs.
Moreover, as local events events are intertwined with the REQ coda, it is strongly possible that local events are missed in the detection process. It means that the rate increased might be underestimated. Then, the decay of the event number is consistent with a 1/t law (i.e. similarly to an Omori's law) during the 1st hour, as observed by e.g. Brodsky, (2006). This decay might be explained by either 1) a direct response to the REQ aftershock waves, or 2) aftershocks of triggered events by cascading effect (Brodsky, 2006) or 3) the sum of responses to perturbations of different durations (Aiken and Peng, 2014). However, the seismicity rate stays above the background level for about 3 hours as a second increase of seismicity occured after 1.5 hours, and is not in agreement with an Omori's law pattern. After 3 hours, the microseismicity rate comes back to the back-ground rate, and stay close to it in the following hours.
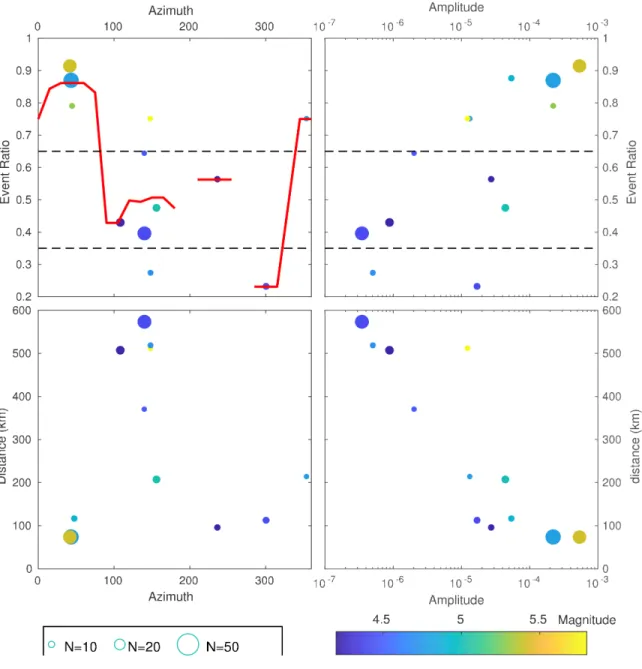
Overall, our analysis indicates that triggering exists, but is not seen after every REQs. In order to explore what factors might control that change, the triggering (ratio R) is compared to the main parameters (distance, azimuth, seismic amplitude and magnitude) of the 30 REQs with at least 7 local events in the 6-hour window (Fig. 3). Both distance and azimuth are computed from the center of the Corinth Gulf, where the rift seismicity is the densest. The amplitude of the REQs is measured as the maximum peak-to-peak amplitude in m/s on the data filtered between 1 and 8 Hz and recorded by station AGEO, which occupies a central location in the Corinth Gulf. This amplitude is a probe for the dynamic stress induced by the passing waves, as the latter is proportional to the time derivative of the seismic displacement (van der Elst
and Brodsky, 2010). As expected, the dynamic triggering shows a positive correlation
with the amplitude of the REQ waves, i.e. with the transient dynamic stress (Fig. 3d). Particularly, out of the 30 REQs, two are associated with a very large number (80 and 65) of events and a ratio larger than 0.85. Both events (2013-08-07, 09:06:07, M=5.4, fig. S2 and 2013-08-09, 11:49:23, M=4.8, fig. S3) occurred in the Evia Gulf, i.e. at small distances (approximately 75 km) North-East from the array. Seismic waves from those earthquakes therefore have large amplitude in the Corinth Gulf, and are associated with a large number of triggered events. However, the R-ratio versus the wave amplitude is very scattered (fig. 3b). This is not due to some specific amplification of the signals, as the relationships between amplitude, hypocentral distances and magnitude do not show any abnormal behaviors (fig. 3d). Therefore dynamic triggering should be also sensitive to some other parameter(s). Among the different parameters investigated, we find that all REQs coming from azimuths between N340 and N80, and mainly between N30 and N60, lead to dynamic triggering, whatever the distance or the amplitude (fig. 3a). This is the case for the two short distance events mentioned earlier, but also for other events, such a M=4.9 event as far as 400 km. Outside this azimuth interval, the event ratios are mainly fluctuating between 0.35 and 0.65, i.e. without clear systematic dynamic triggering. The main part of the triggering occurs quickly after the REQs, while a second increase in the seismicity rate is delayed in time (between 1h30 and 2h30, see fig. 2b). The R-ratios were computed for these two different periods, and compared with the amplitude and azimuth of the REQs. The triggering in both periods seems to behave
similarly, with the triggering depending primarily on the transient wave amplitude, and secondarily on the azimuth of the perturbations (see figs. S8 and S9).
Figure 3: Event ratio R versus a) REQ azimuths and b) REQ amplitudes. REQ
hypocentral distances versus c) REQs azimuths and d) REQs amplitudes. Both hypocentral distances and azimuths are computed from the center of the area (Lat=38°20', Long=22°). The REQ amplitudes are measured at station AGEO, which has a central position (see fig. 1b). f) Event ratio R throughout the year 2013. The green curve (right axis) shows the 2-days average number of local events detected by the CRL network. The red curves in panels a), b) and f) are sliding averages of the R ratio. The dotted lines, when present, indicate the value of R=0.35 and R=0.65. For the 5 panels, colors indicate the magnitude of the REQs and the size of the dots refers to the number of microseismic events detected in the time interval of +/- 3 hours.
Finally, we investigate the variability of the ratio R through the year 2013 (Fig. 3f), in order to compare the triggering occurrences with the overall local activity. Four main swarms of events occurred in May, July, September and November, with up to 200 events of magnitude greater than 1 detected daily by the CRL network. From the end of May till mid-September, i.e. in the period with the densest activity, the R-ratio seems to be slightly higher than during the rest of the year. As seismic activity is denser in this period, the faults could already be in a near-critical stress, close to failure. It is therefore not surprising that an increase of stress, coming from dynamic perturbations, allows the faults to slip. However, such observations have to be taken with caution, as the spatial distribution of the REQs is uneven through the year, and particularly the events coming from the closeby Evia rift occurred during this period. The local events, detected with the station antenna, were not located. However, 156 among the 471 detected local events are present in the CRL catalog, and have an absolute location. The location of the triggered events does not show any particular patterns (see fig. S10), as they are located in the areas where seismicity is strong in 2013 (mainly scattered in the center and the north-west of the the Gulf, with a cluster in the South). Therefore, triggering seems to occur in areas where seismicity level is already high.
5 Discussion and conclusion
The Corinth Rift is a seismically active area, with dense swarms of seismicity. Its extensional context makes it a perfect place to look for processes involved in dynamic triggering. We here focus on dynamic triggering by regional earthquakes, i.e. with magnitude between 4.2 and 6, occurring at distances lower than 600km. For about 20% of the 59 regional earthquakes used in this study, a significant increase of seismicity can be observed after the REQ wave passing through the area. For the remaining events, either the number of detected local events or the rate change is not large enough to be significant. Similarly to large earthquakes (Hill and Prejean, 2015, and references therein), we show here that earthquakes of smaller magnitudes, obviously at smaller distances, also have the potential to trigger remote seismicity.
Regional earthquakes of moderate magnitudes are quite common, as, for example, more than 100 events of M>4.2 occurred at less than 600km distance from the Corinth Gulf in 2013. These events could play a role in the modulation of the swarm activity. However, the triggering cases rather seem to occur toward the end of the seismic crises (Fig. 3f), meaning that the dynamic perturbations help dissipate residual stresses in areas already perturbed by a seismic crisis. Therefore, REQ triggering does not seem to be driving the swarm activity. It would thus not be an indication that faults are close to failure contrary to what has been suggested by Brodsky and van der Elst (2014).
Nearly 50% of the triggered events occurred in the first 24 minutes after the REQs arrivals (fig. 2b). Therefore, most of the triggering is quickly occurring after the REQs, and might be directly triggered by the perturbations. It is indeed firstly depending on the amplitude of the wavefield perturbations, and the transient stress associated. In addition to the amplitude, the triggering also seems to depend on the azimuth of the incoming perturbations. The REQs with an azimuth between N30 and N60 systematically increase the gulf activity. As the active faults in the area have strikes mainly ranging from N90 to N140 (see fig. 1), the incoming perturbations with an angle of arrival between 30 and 110° from the fault strike directions seems to trigger seismicity. In average, dynamic triggering is therefore high for perturbations coming at an incidence close to normal (ca 70°) to the faults. Such behavior is however not observed for REQs at azimuth around N210. However, too few REQs are coming from this direction to make a case of that observation. Conversely, perturbations coming from around N120 or N300, i.e. approximately in the fault strike directions, do not seem to trigger seismicity, even if REQs at close distance occurred at ~N300. Therefore, even if 1) the faults on which triggered seismicity occurred are not perfectly known (see fig. S10) and 2) the perturbations slightly fluctuate between different azimuths, there is a strong indication that the triggering potential is influenced by the azimuth of the incoming perturbation.
Triggering is most often associated with large amplitude Rayleigh waves or Loves waves (Velasco et al, 2008), and less with body waves (e.g. Hough, 2005). For normal faults, the triggering potentials of Love waves dominates, except for incoming perturbation arriving at an angle around 90° on the faults, where Rayleigh waves are more prone to trigger slips (Hill and Prejean, 2015). This suggests that the triggering we observed is likely due to Rayleigh waves. Indeed, their polarization belongs to the vertical plane which contains the rake vector. On the contrary, we observe very few triggering cases for perturbations propagating in the along strike direction, i.e. where Love triggering potential strongly dominates. Therefore, triggering by Love waves does not seem to be efficient, and processes based on a shear perturbation are not likely mechanisms to explain triggering. On the other side, the dilatation component of the Rayleigh waves may induce dynamic unclamping, favoring quick-onset seismicity. Another likely candidate involves fluid processes (Brodsky et al., 2003) as the Rayleigh waves contain a compressive component. This latter process is consistent with
observations from Bourouis and Cornet (2009) and Duverger et al. (2015) who showed that at least part of the seismicity may be driven by fluid pressure diffusion. A layer with an anomalously high Vp/Vs ratio, suggesting fluid pressure, was also imaged by Gautier et al. (2006) at the bottom of the seismogenic layer. Quick-onset triggering might be therefore induced by interstitial fluid pressurization, while more delayed triggering might involve fluid diffusion. Therefore, in areas of the Corinth Gulf which are already affected by a seismic swarm driven by fluid diffusion, even the very small perturbations from remote Mw=4.5 earthquakes allow for a pressurization of interstitial fluids and an increase of seismicity.
Acknowledgment
The seismic array installation was funded in REAKT program (ID:282862, FP7-ENVIRONMENT) and performed in a NKUA-CNRS collaboration. We greatly thanks all the participants to operations. Data are collected by the Corinth Rift Laboratory (crlab.eu) and distributed by RESIF datacenter (dx.doi.org/10.15778/RESIF.CL).
Bibliography
Aiken C., Chao K., Gonzalez-Huizar H., Douilly R., Peng Z., Deschamps A., Calais E. and Haase J. S., (2016) Exploration of remote triggering: A survey of multiple fault structures in Haiti, Earth and Planetary Science Letters, 455, 14-24, doi: 10.1016/j.epsl.2016.09.023
Aiken, C. and Z. Peng (2014), Dynamic triggering of microearthquakes in three geothermal/volcanic regions of California, J. Geophys. Res. Solid Earth, 119, 6992-7009 10.1002 / 2014JB011218.
Arnadottir, T., H. Geirsson, and P. Einarsson (2004), Coseismic stress changes and crustal deformation on the Reykjanes Peninsula due to triggered earthquakes on 17 June 2000, J. Geophys. Res., 109, B09307, doi:10.1029/2004JB003130.
Bernard, P., Briole, P., Meyer, B., Lyon-Caen, H., Gomez, J. M., Tiberi, C., et al. (1997). The Ms= 6.2, June 15, 1995 Aigion earthquake (Greece): evidence for low angle normal faulting in the Corinth rift. Journal of Seismology, 1(2), 131-150.
Bourouis, S., & Cornet, F. H. (2009). Microseismic activity and fluid fault interactions: some results from the Corinth Rift Laboratory (CRL), Greece. Geophysical Journal
International, 178(1), 561-580.
Briole, P., Rigo, A., Lyon-Caen, H., Ruegg, J.C., Papazissi, K., Mitsakaki, C., Balodimou, A., Veis, G., Hatzfeld, D. and Deschamps, A., (2000). Active deformation of the Corinth rift, Greece- Results from repeated Global Positioning System surveys between 1990 and 1995. Journal of Geophysical Research, 105(B11), 25605-25625.
Brodsky, E. E., Karakostas, V., & Kanamori, H. (2000). A new observation of dynamically triggered regional seismicity: Earthquakes in Greece following the August 1999 Izmit, Turkey earthquake. Geophysical Research Letters, 27(17), 2741-2744. Brodsky, E. E., E. Roeloffs, D. Woodcock, I. Gall, and M. Manga (2003), A mechanism for sustained groundwater pressure changes induced by distant earthquakes, J.
Geophys. Res., 108, doi:10.1029/2002JB002321.
Brodsky, E. E. (2006), Long-range triggered earthquakes that continue after the wave train passes, Geophys. Res. Lett., 33, L15313, doi:10.1029/2006GL026605.
Brodsky, E. E., & van der Elst, N. J. (2014). The uses of dynamic earthquake triggering.
Annual Review of Earth and Planetary Sciences, 42, 317-339.
Chouliaras, G., Kassaras, I., Kapetanidis, V., Petrou, P., & Drakatos, G. (2015). Seismotectonic analysis of the 2013 seismic sequence at the western Corinth Rift.
Journal of Geodynamics, 90, 42-57.
Daniel, G., D. Marsan, and M. Bouchon (2008), Earthquake triggering in southern Iceland following the June 2000 Ms 6.6 doublet, J. Geophys. Res., 113, B05310, doi:10.1029/2007JB005107.
Dublanchet, P., Godano, M., & Bernard, P. (2015). Inferring fault mechanical conditions from the source parameters of a complex microseismic multiplet in the Corinth rift, Greece, J. Geophys. Res., 120(11), 7655-7682.
Durand, V., M. Bouchon, H. Karabulut, D. Marsan, J. Schmittbuhl, M.-P. Bouin, M. Aktar, and G. Daniel (2010), Seismic interaction and delayed triggering along the North
Anatolian Fault, Geophys. Res. Lett., 37, L18310, doi:10.1029/2010GL044688.
Duverger, C., Godano, M., Bernard, P., Lyon‐Caen, H., & Lambotte, S. (2015). The 2003–2004 seismic swarm in the western Corinth rift: Evidence for a multiscale pore pressure diffusion process along a permeable fault system. Geophysical Research
Letters, 42(18), 7374-7382.
Freed, A. M. (2005). Earthquake triggering by static, dynamic, and postseismic stress transfer. Annu. Rev. Earth Planet. Sci., 33, 335-367.
Flotté N., Sorel D, Muller C, & Tensi J., (2005) Along strike changes in the structural evolution over a brittle detachment fault: Example of the Pleistocene Corinth-Patras rift (Greece), Tectonophysics, 403, 77-94, doi: 10.1016/j.tecto.2005.03.015
Gautier, S., Latorre, D., Virieux, J., Deschamps, A., Skarpelos, C., Sotiriou, A., Serpetsidaki, A. & Tselentis, A. (2006). A new passive tomography of the Aigion area (Gulf of Corinth, Greece) from the 2002 data set. Pure and Applied Geophysics, 163(2-3), 431-453.
Gomberg, J., Blanpied, M. L., & Beeler, N. M. (1997). Transient triggering of near and distant earthquakes. Bulletin of the Seismological Society of America, 87(2), 294-309. Gomberg, J., Reasenberg, P. A., Bodin, P., & Harris, R. A. (2001). Earthquake triggering by seismic waves following the Landers and Hector Mine earthquakes. Nature,
411(6836), 462-466.
Gomberg, J., & Johnson, P. (2005). Seismology: Dynamic triggering of earthquakes.
Nature, 437(7060), 830-830.
Gonzalez-Huizar, H., A. A. Velasco, Z. Peng, and R. R. Castro (2012), Remote triggered seismicity caused by the 2011, M9.0 Tohoku-Oki, Japan earthquake, Geophys. Res.
Lett., 39, doi:10.1029/2012GL051015.
Hill, D. P., Reasenberg, P. A., Michael, A., Arabaz, W. J., Beroza, G., Brumbaugh, D., et al. (1993). Seismicity remotely triggered by the magnitude 7.3 Landers, California, earthquake. Science, 260(5114), 1617-1623.
Hill, D.P., and S. Prejean (2015). Dynamic triggering, in Earthquake Seismology, Treatise on Geophysics, 2nd edition, (G. Schubert, ed. in chief) Vol 4, p. 273-304, Elsevier, Oxford.
Hough, S. E. (2005). Remotely triggered earthquakes following moderate mainshocks (or, why California is not falling into the ocean). Seismological Research Letters, 76(1), 58-66.
Johnson, D. H., & Dudgeon, D. E. (1992). Array signal processing: concepts and
techniques. Simon & Schuster.
Kapetanidis, V., Deschamps, A., Papadimitriou, P., Matrullo, E., Karakonstantis, A., Bozionelos, G., Kaviris, G., Serpetsidaki, A., Lyon-Caen, H. Voulgaris, N., & Bernard, P. (2015). The 2013 earthquake swarm in Helike, Greece: seismic activity at the root of old normal faults. Geophysical Journal International, 202(3), 2044-2073.
Lambotte, S., Lyon-Caen, H., Bernard, P., Deschamps, A., Patau, G., Nercessian, A., Pacchiani, F., Bourouis, S., Drilleau, M., & Adamova, P. (2014). Reassessment of the rifting process in the Western Corinth Rift from relocated seismicity. Geophysical
Journal International, 197(3), 1822-1844.
Pacchiani, F., & Lyon-Caen, H. (2010). Geometry and spatio-temporal evolution of the 2001 Agios Ioanis earthquake swarm (Corinth Rift, Greece). Geophysical Journal
International, 180(1), 59-72.
Peng, Z., J. E. Vidale, A. G. Wech, R. M. Nadeau, and K. C. Creager (2009), Remote triggering of tremor along the San Andreas Fault in central California, J. Geophys. Res., 114, B00A06, doi:10.1029/2008JB006049.
Pollitz, F. F., Stein, R. S., Sevilgen, V., & Bürgmann, R. (2012). The 11 April 2012 east Indian Ocean earthquake triggered large aftershocks worldwide. Nature, 490(7419), 250-253
Prejean, S. G., Hill, D. P., Brodsky, E. E., Hough, S. E., Johnston, M. J. S., Malone, S. D., et al. (2004). Remotely triggered seismicity on the United States west coast following the Mw 7.9 Denali fault earthquake. Bulletin of the Seismological Society of America,
94(6B), S348-S359.
Royden L. and D. Papanikolaou, (2011). Slab segmentation and late Cenozoic disruption of the Hellenic arc, Geochem. Geophys. Geosyst., 12 , doi: 10.1029/2010GC003280
Rost, S. & Thomas, C. (2002). Array seismology: methods and applications. Rev.
Geophys. 40, RG000100 .
Shelly, D. R., Peng, Z., Hill, D. P., & Aiken, C. (2011). Triggered creep as a possible mechanism for delayed dynamic triggering of tremor and earthquakes. Nature
Geoscience, 4(6), 384-388.
van der Elst, N. J., & E. E. Brodsky (2010), Connecting near-field and far-field earthquake triggering to dynamic strain, J. Geophys. Res., 115, B07311, doi:10.1029/2009JB006681.
Velasco, A. A., Hernandez, S., Parsons, T. O. M., & Pankow, K. (2008). Global ubiquity of dynamic earthquake triggering. Nature Geoscience, 1(6), 375-379.
Zigone, D., Rivet, D., Radiguet, M., Campillo, M., Voisin, C., Cotte, N., Walpersdorf, A., Shapiro, N.M., Cougoulat, G., Roux, P. and Kostoglodov, V., (2012). Triggering of tremors and slow slip event in Guerrero, Mexico, by the 2010 Mw 8.8 Maule, Chile, earthquake. J. Geophys. Res., 117, B09304, doi:10.1029/2012JB009160.
Geophysical Research letters
Supporting Information for
Investigating dynamic triggering of seismicity by regional earthquakes: the case of the Corinth Rift (Greece)
Louis De Barros1*, Anne Deschamps1, Anthony Sladen1, Hélène Lyon-Caen2, Nicholas Voulgaris3 1 Université Côte d’Azur, CNRS, OCA, IRD, Géoazur, 250 rue Albert Einstein, Sophia Antipolis, 06560 Valbonne, France
2 Laboratoire de Géologie, Département de Géosciences, Ecole Normale Supérieure, CNRS UMR 8538, PSL Research
University, Paris F-75005 France.
3 National and Kapodistrian University of Athens, Department of Geology & Geonvironment , 15784 Athens, Greece
Contents of this file
Figures S1 to S10
Introduction
Figures S1 to S5 show the seismic detections over 6-hour windows centered around the time of 5 different regional earthquakes. These examples are cases for which triggering seismicity is observed with a R-ratio greater than 0.75 and more than 13 detected events within the 6-hour timeframe.
Figure S6 shows the natural variability of the seismicity rate changes within the 6 hours, based on the analysis of 600 randomly selected 6-hour windows. This figure compares with figure 2, which shows the rate changes around regional earthquake arrival-times.
Figure S7 shows the distribution of triggering for REQs associated with less than 7 events in the Corinth Rift.
Figures S8 and S9 are to be compared to figure 3. They show the variability of the R-ratio with the REQs parameters, but specifically for the “quick-onset” triggered seismicity (S8) and the “delayed” one (S9).
Figure S10 shows the location of the triggered events, when existing in the CRL catalog. The location of the triggered events does not show any particular patterns compared to the seismicity before the REQs.
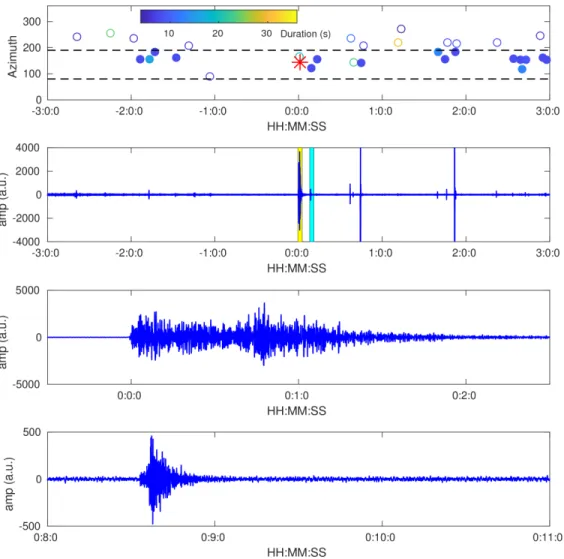
Figure S1. Example of data and detection results, for the M=4.5 earthquake occurring on the 2013/03/25, 20:55:19, at a distance of 369 km from the Corinth Gulf. a) Azimuth of the detected events versus time. The open circles are discarded, as not fulfilling the criteria of impulsive onset, azimuth or duration. Filled circles show the local events selected for subsequent analysis. Color scale shows the computed duration of events. The red cross indicates the theoretical azimuth of the regional earthquake (which was also detected). b) Six hours of seismic data, filtered between 1 and 10 Hz. The highlighted windows indicate the time where 3 minutes close-up on c) the REQs and d) the first detected events are shown.
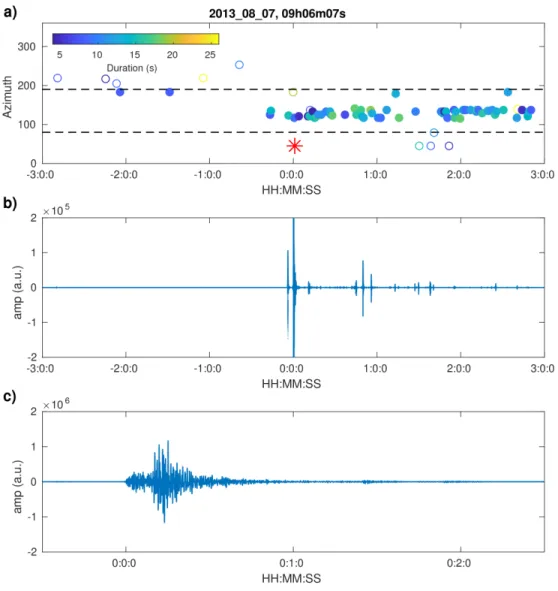
Figure S2. Seismic events detected in the Corinth gulf in a 6-hour window centered on the arrival time of the M=5.4 REQ occurring on the August 7, 2013 (09:06:07), in the Evia rift, at 75km from the Corinth gulf. a) Detected events. Filled circles indicate events that are selected, while unfilled circles show detected events that are not kept as they are either 1) not in the 80-190° azimuthal range, 2) not showing an impulsive onset, 3) coming with a dip angle lower than 50° or 4) having a duration greater than 16 s. The color indicates the duration of signals. b) 6-hours data centered on the arrival time of the REQs event. c) Close up on the REQ event recorded by station MG06 in the seismic antenna. 65 events were detected, leading to a R-ratio of 0.92.
Figure S3. Seismic events detected in the Corinth gulf in a 6-hour window centered on the arrival time of the M=4.8 REQ occurring on the August 9, 2013 (11:49:23), in the Evia gulf, at 73km from the Corinth gulf. a) Detected events. Filled circles indicate events that are selected, while unfilled circles show detected events that are not kept as they are either 1) not in the 80-190° azimuthal range, 2) not showing an impulsive onset, 3) coming with a dip angle lower than 50° or 4) having a duration greater than 16 s. The color indicates the duration of signals. b) 6-hour data centered on the arrival time of the REQs event. c) Close up on the REQ event recorded by station MG06 in the seismic antenna. 80 events were detected, leading to a R-ratio of 0.85.
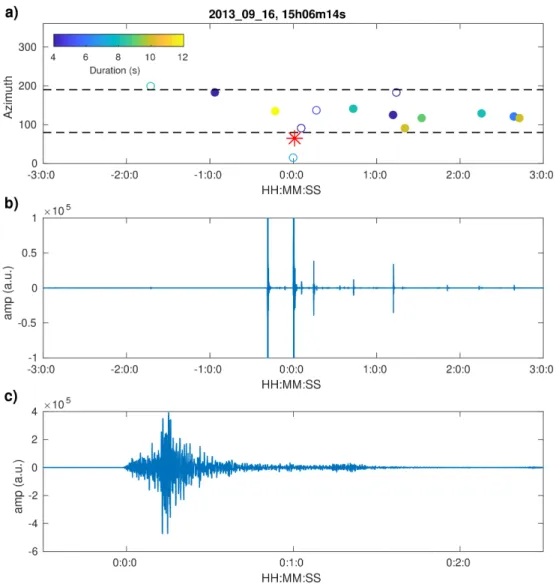
Figure S4. Seismic events detected in the Corinth gulf in a 6-hour window centered on the arrival time of the M=5.3 REQ occurring on the September 16, 2013 (15:06:14), in central Greece, at 77km from the Corinth gulf. a) Detected events. Filled circles indicate events that are selected, while unfilled circles show detected events that are not kept as they are either 1) not in the 80-190° azimuthal range, 2) not showing an impulsive onset, 3) coming with a dip angle lower than 50° or 4) having a duration greater than 16 s. The color indicates the duration of signals. b) 6-hour data centered on the arrival time of the REQs event. c) Close up on the REQ event recorded by station MG06 in the seismic antenna. 13 events were detected, leading to a R-ratio of 0.76.
Figure S5. Seismic events detected in the Corinth gulf in a 6-hour window centered on the arrival time of the M=4.9 REQ occurring on the November 12, 2013 (18:09:28), in central Greece, at 116 km from the Corinth gulf. a) Detected events. Filled circles indicate events that are selected, while unfilled circles show detected events that are not kept as they are either 1) not in the 80-190° azimuthal range, 2) not showing an impulsive onset, 3) coming with a dip angle lower than 50° or 4) having a duration greater than 16 s. The color indicates the duration of signals. b) 6-hour data centered on the arrival time of the REQs event. c) Close up on the REQ event recorded by station MG06 in the seismic antenna. 19 events were detected, leading to a R-ratio of 0.89.
Figure S6. Natural variability of a) the R ratio and b) the number of events versus time. This figure is similar to Figure 2, but computed for 600 times randomly picked through the year 2013. 256 6-hour windows contain at least 7 events coming from the Corinth Gulf. The R-ratios are computed as the number of events in the second-half of the windows over the total number of events. The distribution of those ratios shows a Gaussian distribution, centered on R=0.495, with a standard deviation of 0.17 (red curve). This curve is used in figure 2 to show the natural variability of the microseismicity out of the occurrence time of regional earthquakes. Panel b) compares with fig. 2b. It shows how the normalized cumulative number of events varies with time on the 6-hour windows. The variability is here very small without any clear changes in the number of events.
Figure S7. a) Cumulative distribution of event ratio R for REQs associated with less than 7 local events in the Corinth Rift. The red line indicates the Poisson distribution, corresponding to the natural variability of the event rate (see fig. S6). b) Cumulative histogram of the number of local seismic events around the calculated arrival time of the regional earthquakes. A cumulative rate of 4.2 events per 12 minutes is used to normalize this distribution, in order to have the average number of events before the REQs equal to 1 (black line). This figure compares with figure 2, which shows the same analysis for REQs associated with at least 7 events.
Figure S8. Variations of the event ratio R for “quick-onset” triggering only (i.e. in the first hour after the REQs). It compares to figure 3 (all triggering cases) and figure S9 (“delayed” triggering only). The R-ratio is computed as NAfter1/(Nbef/3+Nafter1), where Nafter1 is the number of events detected during the first hour after the REQs, and Nbef is the number of events in the 3-hour windows before the REQs. Only REQs with 7 local events in the analyzed time windows (i.e. 3 hours before + 1hour after the REQs) are represented. This ratio is compared with a) REQ azimuths and b) REQ amplitudes. REQ hypocentral distances versus c) REQs azimuths and d) REQs amplitudes. Both hypocentral distances and azimuths are computed from the center of the area (Lat=38°20', Long=22°). The REQ amplitudes are measured at station AGEO, which has a central position (see fig. 1b).The red curves in panels a), b) and f) are sliding averages of the R ratio. The dotted lines, when present, indicate the value of R=0.35 and R=0.65. For the 4 panels, colors indicate the magnitude of the REQs and the size of the dots refers to the number of microseismic events detected in the time interval.
Figure S9. Variations of the Event ratio R for “delayed” triggering only (i.e. from 1 to 3 hours after the REQs). It compares with figure 3 (all triggering cases) and figure S8 (“quick-onset” triggering only). This ratio is computed as NAfter2/(2*Nbef/3+Nafter2), where Nafter1 is the number of events detected from 1 to 3 hours after the REQs, and Nbef is the number of events in the 3-hours windows before the REQs. Only REQs with 7 local events in the analyzed time-windows (i.e. 3 hours before plus 2 hours after the REQs) are represented. This ratio is compared with a) REQ azimuths and b) REQ amplitudes. REQ hypocentral distances versus c) REQs azimuths and d) REQs amplitudes. Both hypocentral distances and azimuths are computed from the center of the area (Lat=38°20', Long=22°). The REQ amplitudes are measured at station AGEO, which has a central position (see fig. 1b).The red curves in panels a), b) and f) are sliding averages of the R ratio. The dotted lines, when present, indicate the value of R=0.35 and R=0.65. For the 4 panels, colors indicate the magnitude of the REQs and the size of the dots refers to the number of microseismic events detected in the time interval.
Figure S10. Map of triggered event in the Corinth Rift. The light blue dots indicate the seismicity recorded in 2013 (CRL, crlab.eu, see figure 1). The star indicates the position of the array, which is detailed in the top-right insert. The triangle indicates the station AGEO location. The green and orange dots show the events that were selected within the 6-hour windows around the REQs and present in the CRL catalog. Among the 471 selected events, only 163 events have a match within the CRL catalog, and 119 have been located. Red dots (43 events) show the events occurring before the REQs arrival time, while green dots (76 events) are for the post-REQs events. Darker red and green dots are for the microseismicity associated with the REQs occurring on August 7, 2013 (09:06:07, fig. S2) and August 9, 2013 (11:49:23, fig. S3). No striking differences in the location are observed with the background seismicity, as 1) events before and after the REQs occurred at similar locations, and 2) these locations correspond to area where seismicity rate is high in 2013.