HAL Id: hal-03198097
https://hal.sorbonne-universite.fr/hal-03198097
Submitted on 14 Apr 2021
HAL is a multi-disciplinary open access
archive for the deposit and dissemination of
sci-entific research documents, whether they are
pub-lished or not. The documents may come from
teaching and research institutions in France or
abroad, or from public or private research centers.
L’archive ouverte pluridisciplinaire HAL, est
destinée au dépôt et à la diffusion de documents
scientifiques de niveau recherche, publiés ou non,
émanant des établissements d’enseignement et de
recherche français ou étrangers, des laboratoires
publics ou privés.
the estimation of deep-sea biodiversity using
environmental DNA
Miriam Brandt, Florence Pradillon, Blandine Trouche, Nicolas Henry, Cathy
Liautard-Haag, Marie-Anne Cambon-Bonavita, Valérie Cueff-Gauchard,
Patrick Wincker, Caroline Belser, Julie Poulain, et al.
To cite this version:
Miriam Brandt, Florence Pradillon, Blandine Trouche, Nicolas Henry, Cathy Liautard-Haag, et
al.. Evaluating sediment and water sampling methods for the estimation of deep-sea biodiversity
using environmental DNA. Scientific Reports, Nature Publishing Group, 2021, 11 (1), pp.7856.
�10.1038/s41598-021-86396-8�. �hal-03198097�
Evaluating sediment
and water sampling methods
for the estimation of deep‑sea
biodiversity using environmental
DNA
Miriam I. Brandt
1*, Florence Pradillon
2, Blandine Trouche
3, Nicolas Henry
4,
Cathy Liautard‑Haag
1, Marie‑Anne Cambon‑Bonavita
3, Valérie Cueff‑Gauchard
3,
Patrick Wincker
5, Caroline Belser
5, Julie Poulain
5, Sophie Arnaud‑Haond
1*& Daniela Zeppilli
2 Despite representing one of the largest biomes on earth, biodiversity of the deep seafloor is still poorly known. Environmental DNA metabarcoding offers prospects for fast inventories and surveys, yet requires standardized sampling approaches and careful choice of environmental substrate. Here, we aimed to optimize the genetic assessment of prokaryote (16S), protistan (18S V4), and metazoan (18S V1–V2, COI) communities, by evaluating sampling strategies for sediment and aboveground water, deployed simultaneously at one deep‑sea site. For sediment, while size‑class sorting through sieving had no significant effect on total detected alpha diversity and resolved similar taxonomic compositions at the phylum level for all markers studied, it effectively increased the detection of meiofauna phyla. For water, large volumes obtained from an in situ pump (~ 6000 L) detected significantly more metazoan diversity than 7.5 L collected in sampling boxes. However, the pump being limited by larger mesh sizes (> 20 µm), only captured a fraction of microbial diversity, while sampling boxes allowed access to the pico‑ and nanoplankton. More importantly, communities characterized by aboveground water samples significantly differed from those characterized by sediment, whatever volume used, and both sample types only shared between 3 and 8% of molecular units. Together, these results underline that sediment sieving may be recommended when targeting metazoans, and aboveground water does not represent an alternative to sediment sampling for inventories of benthic diversity.Environmental DNA (eDNA) metabarcoding is an increasingly used tool for non-invasive and rapid biodiver-sity surveys and impact assessments. Using high-throughput sequencing (HTS) and bioinformatic processing, target organisms are detected using their DNA directly extracted from soil, water, or air samples1. Covering
more than 50% of Planet Earth, the deep seafloor is mostly comprised of sedimentary habitats, characterised by a predominance of small organisms2,3 difficult to identify based on morphological features4, and by high local
and regional diversity5–7. Given its increased time-efficiency and its wide taxonomic applicability, eDNA
meta-barcoding is thus a good candidate for large-scale biodiversity surveys and Environmental Impact Assessments in the deep-sea biome.
Size-class sorting such as sieving or elutriation is usually performed on sediment samples in order to split the organisms by size and facilitate morphological characterization of meiofauna and macrofauna. For metabarcod-ing approaches, it also has the advantage of limitmetabarcod-ing the over dominance of large organisms, which may produce higher amounts of DNA template, resulting in an incomplete detection of small and abundant taxa. However,
OPEN
1MARBEC, IFREMER, IRD, CNRS, Univ Montpellier, Sète, France. 2Centre Brest, Laboratoire Environnement
Profond (REM/EEP/LEP), IFREMER, CS10070, 29280 Plouzané, France. 3IFREMER, CNRS, Laboratoire de
Microbiologie Des Environnements Extrêmes (LM2E), Univ Brest, Plouzané, France. 4CNRS, Station Biologique
de Roscoff, AD2M, UMR 7144, Sorbonne University, 29680 Roscoff, France. 5Génomique Métabolique,
Genoscope, Institut François Jacob, CEA, CNRS, Univ of Évry, Paris-Saclay University, 91057 Evry, France. *email:
sieving requires large volumes of sediment, is very time-consuming, and previous studies have found that the use of non-sieved material does not significantly alter metazoan diversity patterns8, suggesting that dominance
of large (and often rare) taxa in the DNA extract does not result in important biases. Besides, for logistic reasons, the use of non-sieved sediment samples is preferable to (1) minimize on-board processing time, (2) minimize risks of contamination, and (3) facilitate other future applications (e.g., avoid RNA degradation, avoid losing the extracellular DNA compartment).
Finally, studies from various marine habitats have reported that benthic taxa could be found in aboveground water (overlying water layer to 6.5 m above seafloor), possibly due to sediment resuspension and transport, but also to active dispersal9–11. Application of eDNA metabarcoding on deep-sea aboveground water could thus be
a convenient alternative to surface sediment collection, as it involves simplified sample processing and shipping, while additionally allowing investigating benthopelagic diversity and dispersal capacities of benthic organisms. However, distance above seafloor has been variable (0.5–6.5 m) among studies9–11, and so has the water volume
sampled (12–1000 L). As the latter is a crucial aspect for efficient species detection12, it remains unclear whether
small volumes (< 10 L) are sufficient to obtain comprehensive species inventories in the deep-sea.
To evaluate the effect of sampling strategy on eDNA metabarcoding inventories targeting prokaryotes (16S V4-V5), unicellular eukaryotes (18S V4), and metazoans (18S V1–V2, COI) from deep-sea sediment and above-ground water, we compared biodiversity inventories resulting from (1) sieved versus unsieved sediment and (2) on-board filtration of 7.5 L of water collected with a sterile sampling box versus in situ filtration of large volumes (~ 6000 L) using a newly-developed pump.
Results
High‑throughput sequencing results.
A total of 26 million COI reads, 19 million raw 18S V1-V2 reads,, 14 million 18S V4 reads, and 17 million 16S V4–V5 reads were obtained from three Illumina HiSeq runs of amplicon libraries built from pooled triplicate PCRs of 22 environmental samples, 2 extraction blanks, and 4–6 PCR blanks (Supplementary Table S4 online). The in situ pump yielded less raw reads for COI and 16S (Supplementary Fig. S1 online, F = 4.02–14.4, p = 0.0003–0.03), while more raw reads were recovered from both water sampling methods with 18S V4 (F = 6.5, p = 0.007). Water samples generally yielded fewer raw clusters (F = 5.1–35.1, p = 3.2 × 10⁻⁶–0.02), except for 18S V4 where numbers were comparable across sample types(Sup-plementary Fig. S1 online).
Bioinformatic processing (quality filtering, error correction, chimera removal, and clustering for metazoans) reduced read numbers to 20 million for COI, 12 million for 18S V1–V2, 11 million for 18S V4, and 10 million for 16S V4–V5, resulting in 10,351 and 17,608 raw OTUs for COI and 18S V1–V2 respectively; 35,538 raw 18S V4 ASVs, and 62,646 raw 16S ASVs (Supplementary Table S4 online). For eukaryote markers, 17–55% of the raw reads remained in PCR blanks after bioinformatic processing, while 50–75% remained in extraction blanks and 52–87% in true samples. In contrast, with 16S, these values were at 87% for PCR blanks, 67% for extraction blanks, and 29–73% for true samples. Thus, negative control samples accounted for 7–13% of bioinformatically processed reads with eukaryotes, compared to 27% with prokaryotes. The vast majority of 16S reads generated by negative controls belonged to a common contaminant of Phusion polymerase kits, which is well amplified in low concentration samples such as negative controls. These reads however accounted for < 1% of 16S ASVs. After data refining (decontamination, removal of all control samples and of all unassigned or non-target clusters), rarefaction curves showed a plateau was reached for all samples except in situ pump samples with microbial loci and sediment samples with 18S V4, suggesting that not all protist and prokaryote diversity was captured at this sequencing depth in these samples (Supplementary Fig. S1 online). Refined datasets contained 7 million reads for prokaryotes and between 4.8 and 8.5 million target reads for eukaryotes, delivering 38,816 prokaryote ASVs (16S V4–V5), 8031 protist ASVs (18S V4), and 2,319 (COI) and 1,460 (18S V1–V2) LULU curated metazoan OTUs (Table S4). For COI, while only 1.2% of metazoan OTUs were unassigned at phylum-level, 57% had BLAST hit identities < 80%, i.e. unreliable at phylum-level. For 18S, 7% (18S V4) to 16% (18S V1-V2) of final ASVs/OTUs were unassigned at phylum-level, but only 12% (18S V4) and 13% (18S V1-V2) had BLAST hit identities < 86%. For 16S, 0.9% and 3% of ASVs had no or unreliable phylum-level assignments, respectively.
Alpha diversity between sampling methods.
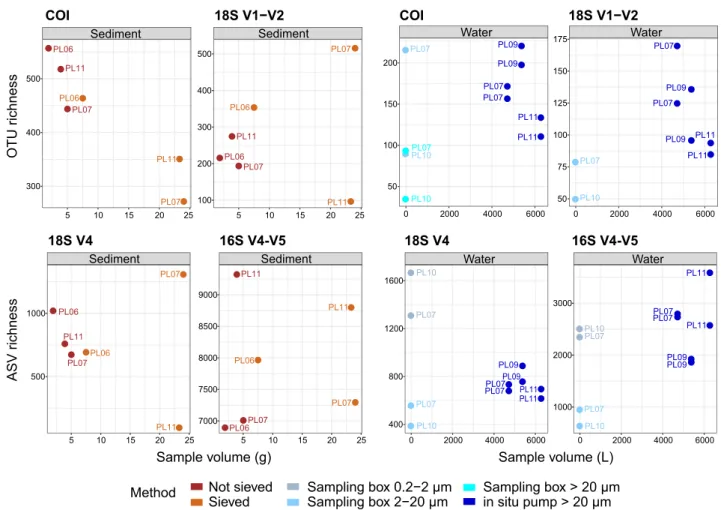
The number of recovered molecular clusters significantly differed with sampling method, water samples detecting less diversity than sediment samples for metazoans and prokaryotes (COI: F = 20.1, p = 4.4 × 10⁻⁵, 18S V1–V2: F = 6.5, p = 0.01, 16S: F = 56.0, p = 3 × 10⁻⁷), but bothsample types recovering similar levels of protist diversity (18S V4: F = 2.9, p = 0.07, Fig. 1). Sieved and unsieved sediment resulted in statistically comparable total cluster numbers in all loci investigated (Table 1) although, for metazoans detected with 18S V1–V2, this lack of significance was likely due to the very low yield observed in one sieved sample (PL11), as the other sieved samples detected considerably more OTUs (Fig. 1). For metazoans detected with COI, sieved samples tended to detect less OTUs although being based on larger sediment volumes (pool of 5 DNA extracts). The number of total recovered OTUs did not differ significantly between the water sampling box and the in situ pump for metazoans (COI, 18S V1–V2), but differences were observed for unicel-lular eukaryotes (18S V4) and prokaryotes (16S V4–V5) depending on the sampling box size fraction (Table 1), with the smallest fraction (0.2–2 µm) detecting more ASVs (Fig. 1).
Differences in total recovered diversity were not solely a result of differences in sample volume. Indeed, sieved samples, based on 3–6 times more sediment, did not consistently detect more diversity (Fig. 1). Similarly, the in situ pump, although sampling ~ 800 times more water than the sampling box, did not consistently detect more diversity than any size fraction of the sampling box (Fig. 1).
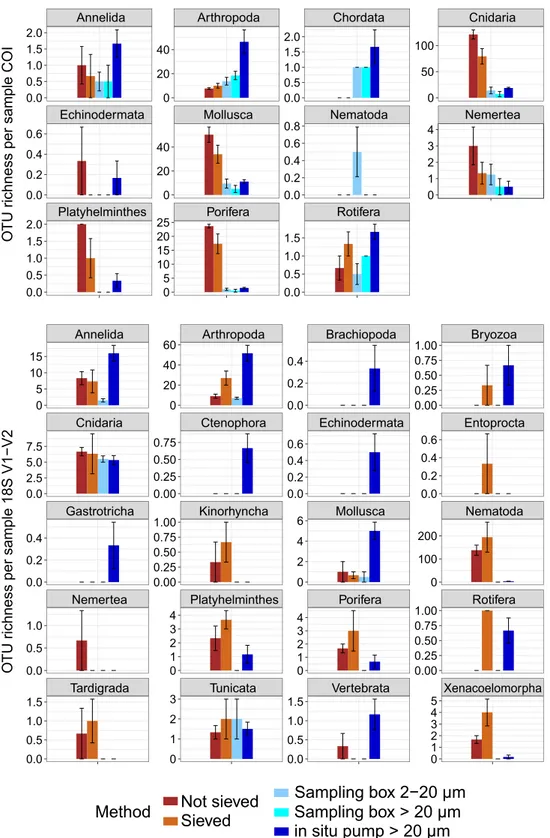
Recovered diversity among sample types strongly differed depending on phylum (Fig. 2). For metazoans, water samples led to the detection of significantly higher numbers of OTUs than sediment samples for Arthropoda,
Chordata (COI, t-tests, p = 0.006–0.01) and Mollusca (18S V1–V2, t-test, p = 0.03), and some phyla like Brachi-opoda, Ctenophora, Echinodermata, or Gastrotricha, were only detected in water samples (Fig. 2). In contrast, phyla such as Platyhelminthes, Porifera (COI, 18S V1–V2, t-tests, p = 0.001–0.04), Kinorhyncha, Nematoda, Tardigrada, or Xenacoelomorpha (18S V1–V2, t-tests, p = 0.001–0.04) produced significantly more OTUs in sediment than water samples (Fig. 2). Similarly, some protistan groups, such as the Acantharea, Chlorophyta, Dinophyceae, or Syndiniales (t-tests, p = 0.002–0.03) were predominant in water samples (Supplementary Fig. S2 online), while others were significantly more diverse in sediment, e.g., Apicomplexa, Filosa groups, Ciliophora, Labyrinthulea, RAD-B (t-tests, p = 0.001–0.04). For prokaryotes, most lineages were predominant in sediment (t-tests, p = 2.2 × 10⁻⁷–0.02, e.g., Archaea, Acidobacteria, Actinobacteria, Bacteroidetes, Chloroflexi, Delta-,
Gamma-proteobacteria, Gemmatimonadetes, Latescibacteria, Hydrogenedentes, Nitrospirae, Planctomycetes), and only Cyanobacteria were significantly more diverse in water samples (t-test, p = 0.001).
For sediment, recovered levels of alpha diversity among sampling methods also varied by phyla and organism size class (Fig. 2). For meiofauna phyla, best detected with 18S V1–V2, more OTUs were detected from sieved than from unsieved sediment (Kinorhyncha, Nematoda, Platyhelminthes, Rotifera, Tardigrada, Xenacoelomor-pha), although this difference was not significant, likely due to the low sample size. However, differences in alpha diversity among sampling methods were not only a result of differences in sample volume, as some unsieved samples yielded similar or greater numbers of OTUs than sieved samples for many phyla (Supplementary Fig. S3 online). Sieved and unsieved sediment detected comparable ASV numbers in most microbial groups, except the Chrysophyceae, Actinobacteria, Cyanobacteria, Gammaproteobacteria, Nanoarchaeaeota (Supplementary Fig. S2 online, paired t-tests, p = 0.02–0.04).
Water sampling methods strongly differed in terms of recovered alpha diversity depending on taxonomic com-partment. The in situ pump generally detected more metazoan diversity than the sampling box, and phyla such as Brachiopoda, Ctenophora, and Echinodermata were only detected by the pump (Fig. 2). However, the in situ pump detected significantly more ASVs than the sampling box only in some taxonomic groups for protists (Bacil-lariophyta, Oomycota, Phaeodarea) and prokaryotes (e.g., Bacteroidetes, Chlamydiae, Firmicutes, Tenericutes,
OTU richness 2 V − 1 V S 8 1 I O C 18S V4 16S V4-V5 ASV richness
Method Not sieved Sieved Sampling box 2−20 μmSampling box 0.2−2 μm Sampling box > 20 μmin situ pump > 20 μm ●● ●● ●● ●● ●● ● ●● ●● ●● ●● PL10 PL10 PL11 PL11 PL07 PL07 PL07 PL07 PL09 PL09 Water 50 100 150 200 ●● ●● ●● ●● ●● ●● PL06 PL06 PL07 PL07 PL11 PL11 Sediment 300 400 500 ) L ( e m u l o v e l p m a S ) g ( e m u l o v e l p m a S ●● ●● ●● ●● ●● ●● ●● ●● PL10 PL11 PL11 PL07 PL07 PL07 PL09 PL09 Water 50 75 100 125 150 175 ●● ●● ●● ●● ●● ●● PL06 PL06 PL07 PL07 PL11 PL11 Sediment 0 2000 4000 6000 5 10 15 20 25 5 10 15 20 25 0 2000 4000 6000 100 200 300 400 500 2 V − 1 V S 8 1 I O C ●● ●● ●● ●● ●● ●● ●● ●● ●● ●● PL10 PL10 PL11 PL11 PL07 PL07 PL07PL07 PL09 PL09 Water 400 800 1200 1600 ●● ●● ●● ●● ●● ●● PL06 PL06 PL07 PL07 PL11 PL11 Sediment 500 1000 ●● ●● ●● ●● ●● ●● ● ●● ●●● PL10 PL10 PL11 PL11 PL07 PL07 PL07 PL07 PL09PL09 Water 1000 2000 3000 ●● ●● ●● ●● ●● ●● PL06 PL06 PL07 PL07 PL11 PL11 Sediment 0 2000 4000 6000 5 10 15 20 25 5 10 15 20 25 0 2000 4000 6000 7000 7500 8000 8500 9000 18S V4 16S V4-V5
Figure 1. Numbers of metazoan OTUs (COI, 18S V1–V2), unicellular eukaryote (18S V4) and prokaryote (16S V4–V5) ASVs recovered by deep-sea sediment (brown) and aboveground water (blue), using for each sample type two sampling methods based on varying amounts of starting material. Sediment was either sieved through 5 mesh sizes to size-sort organisms prior DNA extraction, or DNA was extracted directly from crude sediment samples. Water was collected with a 7.5 L sampling box, allowing recovery of up to two size classes per taxonomic compartment, or sampled in large volumes with an in situ pump. Cluster abundances were calculated on rarefied datasets.
Lentisphaerae, and Delta-, Gammaproteobacteria, see Supplementary Fig. S2 online, t-tests, p = 9 × 10⁻⁵–0.003).
Other clades were significantly more diverse in the sampling box (e.g., the protist groups Haptophyta, Pico-zoa, Telonemia, and the Cyanobacteria, t-tests, p = 0.002–0.02). With the sampling box, the smallest size frac-tion (0.2–2 µm) allowed recovering more alpha diversity in all microbial groups than the larger size fracfrac-tion (2–20 µm). This difference was significant only for Chlorophyta, Labyrinthulea, Chloroflexi, and Verrucomicrobia (paired t-tests, p = 0.01–0.03), although non-significant comparisons may result from the limited number of samples available. The two size fractions available with the sampling box for COI (2–20 µm, > 20 µm) did not reveal differences in diversity recovery with size class, as most phyla were detected equally well in both (Fig. 2).
Effect of sampling method on community structures.
Community compositions significantly dif-fered among sampling methods for all investigated loci (COI: F = 2.3, p = 0.001; 18S V1–V2: pseudo-F = 2.3, p = 0.001, 18S V4: pseudo-pseudo-F = 4.1, p = 0.001, 16S: pseudo-pseudo-F = 18.3, p = 0.001) and sampling method accounted for 41–45% of variation among samples for metazoans (COI, 18S V1–V2), 60% for protists (18S V4), and 87% for prokaryotes (16S).Pairwise PERMANOVAs showed that community structures differed most strongly among sample types (water or sediment, R2 = 0.28–0.89), although not all pairwise comparisons were significant, likely due to the
limited number of samples available for the sampling box (Table 1). Relative taxonomic compositions revealed by Table 1. Effect of sampling method on cluster richness and community structure for the 4 studied genes. Pairwise comparisons of ANOVAs of ASV/OTU richness performed using rarefied datasets. Pairwise PERMANOVAs were performed on rarefied datasets using Jaccard distances for metazoans and Bray–Curtis distances for 18S V4 and 16S V4–V5. Significance was evaluated by permuting 999 times when possible, and comparisons where this was not possible are marked by *. Significant p values are in bold. R2: R-squared.
Pairwise comparison
Cluster richness Community differentiation
COI 18S V1–V2 18S V4 16S V4–V5 COI 18S V1–V2 18S V4 16S V4–V5 Not sieved/ Sieved* 0.26 0.64 0.99 1.0 0.4, R2 = 0.22 0.1, R2 = 0.22 0.1, R2 = 0.26 0.1, R2 = 0.42 Sampling box 0.2–2 µm/ not sieved* na na 0.26 < 0.0001 na na 0.1, R 2 = 0.64 0.1, R2 = 0.87 Sampling box 2–20 µm/ Not sieved* < 0.0001 0.10 0.63 < 0.0001 0.1, R 2 = 0.51 0.1, R2 = 0.46 0.1, R2 = 0.57 0.1, R2 = 0.89 Sampling box > 20 µm/not sieved* < 0.0001 na na na 0.1, R 2 = 0.50 na na na Sampling box 0.2–2 µm/ sieved* na na 0.10 < 0.0001 na na 0.1, R 2 = 0.56 0.1, R2 = 0.88 Sampling box 2–20 µm/ sieved* 0.01 0.02 0.86 < 0.0001 0.1, R 2 = 0.44 0.1, R2 = 0.43 0.1, R2 = 0.49 0.1, R2 = 0.89 Sampling box > 20 µm/ sieved* 0.0001 na na na 0.1, R 2 = 0.41 na na In situ pump/ not sieved < 0.0001 0.13 0.99 < 0.0001 0.01, R2 = 0.32 0.01, R2 = 0.29 0.02, R2 = 0.45 0.01, R2 = 0.78 In situ pump/ sieved 0.0001 0.002 1.00 < 0.0001 0.01, R2 = 0.28 0.01, R2 = 0.28 0.01, R2 = 0.38 0.007, R2 = 0.78 Sampling box 0.2–2 µm/in situ pump na na 0.04 1.0 na na 0.03, R 2 = 0.49 0.04, R2 = 0.74 Sampling box 2–20 µm/in situ pump 0.99 0.70 0.79 0.001 0.03, R 2 = 0.25 0.03, R2 = 0.25 0.04, R2 = 0.43 0.04, R2 = 0.59 Sampling box > 20 µm/in situ pump 0.10 na na na 0.04, R = 0.21 na na na Sampling box 0.2–2 µm/ Sampling box 2–20 µm* na na 0.03 0.007 na na 0.3, R2 = 0.47 0.3, R2 = 0.89 Sampling box 0.2–2 µm/ Sampling box > 20 µm* na na na na na na na na Sampling box 2–20 µm/ Sampling box > 20 µm* 0.26 na na na 0.3, R2 = 0.45 na na na
aboveground water samples differed from sediment samples, with higher proportions of arthropods, chordates, annelids, and tunicates in the water samples, while nematodes, poriferans, platyhelminths, and xenacoelomorphs
OT
U richness per sample CO
I
OT
U richness per sample 18S V1−V2
Method
Platyhelminthes Porifera Rotifera
Echinodermata Mollusca Nematoda Nemertea
Annelida Arthropoda Chordata Cnidaria
0 50 100 0 1 2 3 4 0.0 0.5 1.0 1.5 2.0 0.0 0.2 0.4 0.6 0.8 0.0 0.5 1.0 1.5 0 20 40 0 20 40 0 5 10 15 20 25 0.0 0.5 1.0 1.5 2.0 0.0 0.2 0.4 0.6 0.0 0.5 1.0 1.5 2.0
Not sieved
Sieved
Sampling box > 20 μm
in situ pump > 20 μm
Sampling box 2−20 μm
Tardigrada Tunicata Vertebrata Xenacoelomorpha
Nemertea Platyhelminthes Porifera Rotifera
Gastrotricha Kinorhyncha Mollusca Nematoda
Cnidaria Ctenophora Echinodermata Entoprocta
Annelida Arthropoda Brachiopoda Bryozoa
0.00 0.25 0.50 0.75 1.00 0.0 0.2 0.4 0.6 0 100 200 0.00 0.25 0.50 0.75 1.00 0 1 2 3 4 5 0.0 0.2 0.4 0.0 0.2 0.4 0.6 0 2 4 6 0 1 2 3 4 0.0 0.5 1.0 1.5 0 20 40 60 0.00 0.25 0.50 0.75 0.00 0.25 0.50 0.75 1.00 0 1 2 3 4 0 1 2 3 0 5 10 15 0.0 2.5 5.0 7.5 0.0 0.2 0.4 0.0 0.5 1.0 0.0 0.5 1.0 1.5
Figure 2. Mean numbers (± SE) of metazoan COI and 18S V1-V2 OTUs detected in target phyla for sediment (brown) and water (blue), using two sampling methods for both sample types. Sediment was either sieved to size-sort organisms prior DNA extraction, or DNA was extracted directly from crude sediment samples. Water was collected with a 7.5 L sampling box, allowing recovery of two size classes, or sampled in large volumes with an in situ pump. OTU numbers were calculated on rarefied datasets.
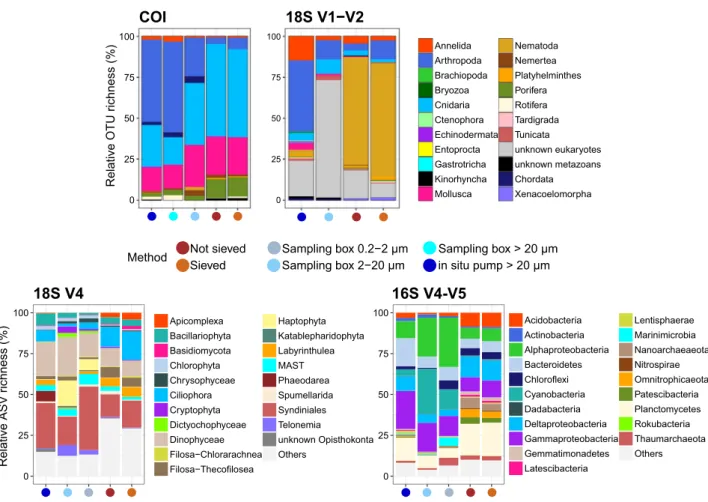
were predominant in sediment samples (Fig. 3 COI and 18S V1–V2). Similarly, protist diversity in aboveground water samples was dominated by Dinophyceae, Haptophyta, Phaeodarea, Syndiniales, and to a lesser extent Bacillariophyta and Telonemia, while apicomplexans, ciliates, filosans, and labyrinthuleans represented higher proportions of diversity in sediment samples (Fig. 3 18S V4). For prokaryotes, aboveground water communities were characterised by Alphaproteobacteria, Cyanobacteria, and Gammaproteobacteria, while Acidobacteria, Deltaproteobacteria, Archeae, Latescibacteria, and Planctomycetes showed higher diversity in sediment (Fig. 3
16S V4–V5).
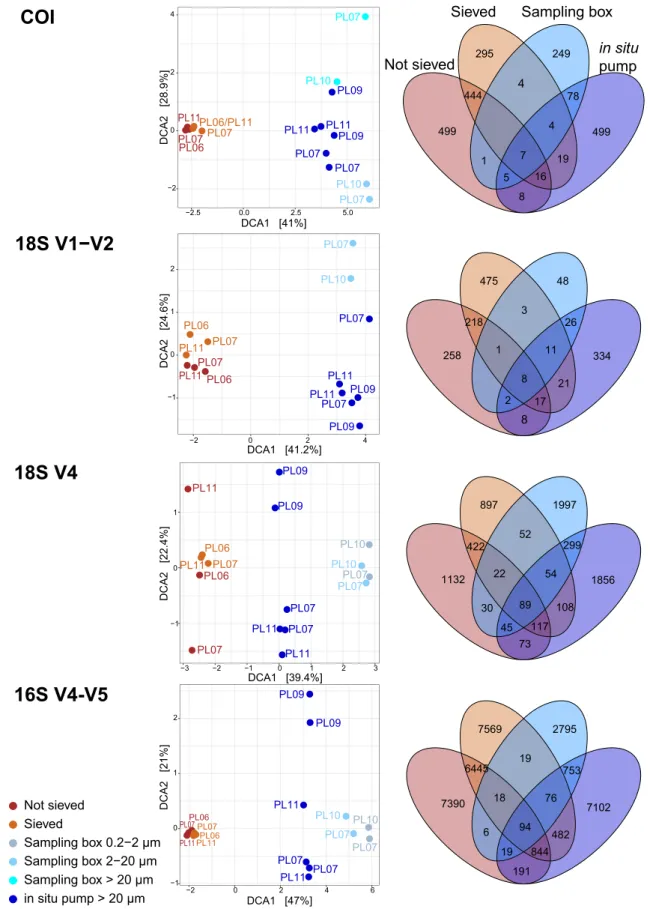
Only 3% (COI), 5% (18S V1–V2), 8% (18S V4), and 5% (16S) of clusters were shared between sediment and water samples, resulting in strong segregation in ordinations (Fig. 4). For metazoans, taxa shared among water and sediment samples were mostly assigned to hydrozoans (COI, 28%, 18S, 7%), copepods (COI, 6%, 18S, 20%), gastropods (COI, 31%), demosponges (COI, 6%), or polychaetes (18S, 10%), and chromadorean nematodes (18S, 11%). For protists, ASVs shared among sample types primarily belonged to the Syndiniales (39%), but other taxa included dinophyceans (11%), filosans (9%), labyrinthuleans (5%), and bacillariophytes (6%). For prokaryotes, ASVs shared across sample types were predominantly belonging to the Proteobacteria (Gamma, 19%, Alpha, 10%, Delta, 8%), Bacteroidetes (15%), or Planctomycetes (16%).
Sediment processing did not significantly affect detected community structures (Table 1), and sieved and unsieved sediment resolved comparable communities at the phylum-level (Fig. 3), although community segre-gation was observed in ordinations of metazoans resolved with 18S V1–V2 and protists resolved with 18S V4 (Fig. 4). Between 21 and 36% of sediment OTUs/ASVs were shared among sieved and unsieved sediment samples. Shared metazoan OTUs primarily belonged to Hydrozoa (18S, 2.5%, COI, 32%, Siphonophorae, Anthoathecata, Leptothecata), Demospongiae (COI, 9%), Gastropoda (COI, 32%), Nematoda (18S, 61% Chromadorea, 11% Enoplea), Polychaeta (18S, 2.5%), or Copepoda (18S, 4.5%). Microbial ASVs shared among sieved and unsieved sediment mostly belonged to Syndiniales (17%), Filosa (19%), Ciliophora (11%), Dinophyceae (9%), Plancto-mycetes (22%), Acidobacteria (10%), or Proteobacteria (Gamma, 9%, Alpha, 8%, Delta, 11%).
5
V
-4
V
S
6
1
4
V
S
8
1
Relative OTU richness (%
)
COI
18S V1−V2
Relative ASV richness (%
)
●
●
Not sieved●
●
●
Sieved
Sampling box 0.2−2 μm
Sampling box 2−20 μm
●
in situ pump > 20 μm Sampling box > 20 μm Method●
●
●
●
●
0 25 50 75 100 Annelida Arthropoda Brachiopoda Bryozoa Cnidaria Ctenophora Echinodermata Entoprocta Gastrotricha Kinorhyncha Mollusca Nematoda Nemertea Platyhelminthes Porifera Rotifera Tardigrada Tunicata unknown eukaryotes unknown metazoans Chordata Xenacoelomorpha●
●
●
●
0 25 50 75 100 Apicomplexa Bacillariophyta Basidiomycota Chlorophyta Chrysophyceae Ciliophora Cryptophyta Dictyochophyceae Dinophyceae Filosa−Chlorarachnea Filosa−Thecofilosea Haptophyta Katablepharidophyta Labyrinthulea MAST Phaeodarea Spumellarida Syndiniales Telonemia unknown Opisthokonta Others●
●
●
●
●
0 25 50 75 100 Acidobacteria Actinobacteria Alphaproteobacteria Bacteroidetes Chloroflexi Cyanobacteria Dadabacteria Deltaproteobacteria Gammaproteobacteria Gemmatimonadetes Latescibacteria Lentisphaerae Marinimicrobia Nanoarchaeaeota Nitrospirae Omnitrophicaeota Patescibacteria Planctomycetes Rokubacteria Thaumarchaeota Others●
●
●
●
●
0 25 50 75 100Figure 3. Patterns of relative cluster abundance resolved by eDNA metabarcoding of deep-sea sediment (brown) and aboveground water (blue), using two sampling methods for both sample types, and using four barcode markers targeting metazoans (COI, 18S V1–V2), micro-eukaryotes (18S V4), and prokaryotes (16S V4–V5). Sediment was either sieved to size-sort organisms prior DNA extraction, or DNA was extracted directly from crude sediment samples. Water was collected with a 7.5 L sampling box, allowing recovery of up to two size classes per taxonomic compartment, or sampled in large volumes with an in situ pump. Top 20 most abundant taxa are displayed for microbial groups.
●● ●● ●● ●● ●● ●● ●● ●● ●● ●● ●● ●● ●● ●●●●●●●● ●● ●● ●●●● ●●●● ●● ●● ●● ●● ●● ●● PL06 PL06/PL11 PL07PL07 PL10 PL10 PL11 PL11 PL11 PL07 PL07 PL07 PL07 PL09 PL09 −2 0 2 4 −2.5 0.0 2.5 5.0 DCA1 [41%] DCA2 [28.9% ] 249 78 295 19 4 4 8 1 5 444 16 7
Not sieved
Sieved
Sampling box
in situ
pump
COI
●● ●● ●● ●● ●● ●● ●● ●● ●● ●● ●● ●● ●● ●● ●● ●● ●● ●● ●● ●● ●● ●● ●● ●● ●● ●● ●● ●● PL06 PL06 PL07 PL07 PL10 PL11 PL11 PL11 PL11 PL07 PL07 PL07 PL09 PL09 −1 0 1 2 −2 0 2 4 DCA1 [41.2%] DCA2 [24.6%] 334 48 26 475 21 3 11 258 8 2 218 17 1 8 ●● ●● ●● ●● ●● ●● ●● ●● ●● ●● ●● ●● ●● ●● ●● ●● ●● ●● ●● ●● ●● ●● ●● ●● ●● ●● ●● ●● ●● ●● ●● ●● PL06 PL06 PL07 PL07 PL10 PL10 PL11 PL11 PL11 PL11 PL07 PL07 PL07 PL07 PL09 PL09 −1 0 1 −3 −2 −1 0 1 2 3 DCA1 [39.4%] DCA2 [22.4% ] 1856 1997 299 897 108 52 54 1132 73 30 45 422 117 22 8918S V4
●● ●● ●●●● ●● ●● ●●●● ●● ●● ●● ●● ●● ●● ●● ●● ●●●● ●●●● ●● ●● ●●●● ●● ●● ●● ●● ●●●● ●● ●● PL06 PL06 PL07PL07 PL10 PL10 PL11PL11 PL11 PL11 PL07 PL07 PL07 PL07 PL09 PL09 −1 0 1 2 −2 0 2 4 6 DCA1 [47%] DCA2 [21% ] 7102 2795 753 7569 482 19 76 7390 191 6 19 6445 844 18 9418S V1−V2
16S V4-V5
●●●●
●●●●
●●●●
●●●●
●●●●
Not sieved Sieved Sampling box 2−20 μm Sampling box > 20 μm in situ pump > 20 μm ●●●●
Sampling box 0.2−2 μm 499 499Figure 4. Detrended Correspondence Analyses (DCA) ordinations (left) and Venn diagrams (right), showing differences in community compositions detected by deep-sea sediment (brown) and aboveground water (blue) for metazoans (COI and 18S V1–V2), micro-eukaryotes (18S V4), and prokaryotes (16S V4–V5). Community segregation is strongest between sample types, but also among target size class in the water samples. Sediment was either sieved to size-sort organisms prior DNA extraction, or DNA was extracted directly from crude sediment samples. Water was collected with a 7.5 L sampling box, allowing recovery of two size classes in each taxonomic compartment, or sampled in large volumes with an in situ pump.
In contrast, sampling method significantly affected resolved community structure for water, as for all size fractions, the sampling box detected significantly different communities than the in situ pump (Table 1). Both sampling methods resolved different communities at the phylum-level (Fig. 3), and water samples always clus-tered apart in ordinations (Fig. 4) for all taxonomic compartments investigated.. Between 8 and 11% of ASVs/ OTUs detected in water were shared between the in situ pump and the sampling box. Taxonomic structures resolved by both sampling methods clearly changed due to targeted size fraction. The sampling box’s 2–20 µm size fraction did not detect the same metazoan community assemblage as the > 20 µm assemblage detect by the pump (Fig. 3 COI and 18S V1–V2). Similarly, for microbial data, the in situ pump targeting the > 20 µm size class, and the sampling box targeting both the 2–20 µm and the 0.2–2 µm size classes, detected different community assemblages. For protists, the in situ pump detected higher proportions of ASVs for Bacillariophyta, Ciliophora, Labyrinthulea, or Phaeodarea, while the sampling box detected more cryptophytes, haptophytes, MAST, and telonemians (Fig. 3 18S V4). For prokaryotes, the sampling box detected more diversity in the Alphaproteobac-teria, Chloroflexi, or Marinimicrobia (Fig. 3 16S V4–V5).
Discussion
Importance of substrate nature.
Sediment samples, whether sieved or unsieved, led to the detection of higher numbers of metazoan OTUs and prokaryote ASVs than water samples (Fig. 1), indicating that more diversity could be found in the benthos compared to the pelagos at this Mediterranean site for those groups. For unicellular eukaryotes, the difference in diversity between sediment and aboveground water was not significant. However, this may primarily be due to the fact that more benthic protists (e.g., filosans, labyrinthuleans, and cili-ates) were well detected by water samples (Supplementary Fig. S2 online). Indeed, 19% of protist sediment ASVs were also detected in the water samples, while for other loci this percentage was at 5–8%. These findings are congruent with other studies in the marine realm that reported notably higher diversity in sediments compared to seawater13–15 for microbial communities, and show that higher diversity can also be expected for metazoans.Community compositions differed markedly between sediment and aboveground water samples for all life compartments investigated (Figs. 3, 4), and only 3–8% of total molecular clusters were shared between substrate types, a range congruent with previous findings11,15,16. Metazoan infauna taxa (e.g., nematodes, platyhelminths,
kinorhynchs, tardigrades, and xenacoelomorphs) were specifically detected by sediment samples, while other epibenthic, benthopelagic, and pelagic metazoans were more prevalent in water samples (e.g., echinoderms, chordates, ctenophores). Similarly, with protists and prokaryotes, sediment samples detected lineages typically reported in the deep seafloor, with prokaryotic communities mostly comprised of Proteobacteria, Acidobac-teria, Planctomycetes, Archeae, Bacteroidetes, and Chloroflexi17–20, and protist communities characterized by
benthic heterotrophic groups such as ciliates, labyrinthuleans, and filosans21,22. Water samples instead recovered
taxa commonly reported in pelagic studies, with unicellular eukaryotes such as dinoflagellates (Dinophyceae, Syndiniales), radiolarians (Acantharea, Phaeodarea, Spumellarida), or MAST (incl. diatoms, Chlorophyta, Chrysophyceae)11,23,24, and bacterial groups such as Alpha- and Gamma-proteobacteria, Bacteroidetes and
Cyanobacteria25–27.
Most of the metazoans shared among sediment and water samples displayed benthopelagic life cycles with a benthic adult and a pelagic larva (hydrozoans, gastropods, demosponges, polychaetes), indicating that the detection of benthic taxa in water samples may predominantly reflect the occurrence of dispersal phases of those organisms10. Other metazoan OTUs shared across sediment and water belonged to Copepoda (incl. Cyclopoida
and Harpacticoida), Polychaeta, and Nematoda, confirming that active dispersal and/or resuspension of benthic taxa can also occur9. Similarly, benthic protists (e.g. filosans, labyrinthuleans), and bacteria known to occur at
the sediment–water interface (e.g., Bacteroidetes, Planctomycetes)14,28, were also predominant in this shared
fraction, supporting the existence of sediment resuspension dynamics. Finally, the presence of pelagic taxa such as Actinopteri, scyphozoans, cephalopods, diatoms (Bacillariophyta), and dinoflagellates (Dinophyceae and parasitic Syndiniales) in both sediment and water samples supports the fact that dead material, detritus, or faecal pellets can sink to the deep seafloor29.
Overall, our results confirm previous findings showing that sample nature strongly affects the type of organ-isms targeted by eDNA metabarcoding30,31, and underline that eDNA from water samples cannot be used to
comprehensively survey benthic communities16,32,33, even when large volumes of aboveground water are collected.
Sieving sediment is not essential for comprehensive benthic biodiversity surveys.
Studies investigating the effect of size-sorting in macroinvertebrates showed that sorting organisms by size and pooling them proportionately according to their abundance led to a more equal amplification of taxa, the sorted samples recovering 30% more taxa than the unsorted samples at the same sequencing depth34. The size fractions used inthis study were specifically aiming to concentrate the meiofauna (32 µm–1 mm) compartment, which is known to be important in deep-sea sediments, both in terms of abundance and biomass2,35,36. Meiofauna taxa, best
cap-tured by 18S V1–V2, were more numerous in sieved than unsieved sediment samples, and total recovered OTU numbers were higher in sieved than in unsieved samples for two cores with this marker (Fig. 1). These differ-ences were however not significant. It could be that the equimolar pooling performed with DNA extracts from each different size fraction maintained biases in abundance, as larger organisms contributed more DNA mol-ecules within each size fraction. Alternatively, some individual size fractions having yielded low DNA concentra-tions, their equimolar pool effectively diluted the size fractions that generated most of the DNA. Indeed, highest DNA recovery was observed in the 20–40 µm and the 40–250 µm size fractions for all cores, while the larger size fractions had DNA concentrations < 1 ng/µL. This problem was particularly severe for PL11, explaining why this core performed so poorly in the sieved treatment for both 18S markers (Fig. 1). Proportional pooling may be a better approach, but is feasible only if relative abundance of organisms in each size class can be calculated (e.g.,
using dry sample and specimen weights). A more accurate approach would be to sequence each size fraction separately, which would likely result in many more ASVs/OTUs due to increased sequencing depth. This how-ever would also increase sequencing costs five-fold. An alternative to sequencing each size fraction separately could be the pooling of the size fractions after PCR, which would reduce size related biomass biases during PCR amplification, without increasing sequencing costs. However, the fact that more diversity was detected when sieving than when not sieving at the same sequencing depth for the 18S marker (Supplementary Fig. S4 online), indicates that sieving effectively reduces biomass biases, thus allowing the detection of more diversity at the same sampling depth. Alternatively, new technologies affording much higher sequencing depths37 might circumvent
the need for size-class sorting in the future.
The advantage provided by sieving observed in this study for some phyla may also result from the fact that sieved samples were based on more starting material, as five DNA extractions were performed for the sieved treatment (one for each size fraction), when only one was performed for non-sieved sediment. Sample volume can however not fully explain differences in recovered diversity, as the latter varied considerably within each method, and samples based on larger sediment volumes did not consistently yield more OTUs/ASVs (Fig. 1, Supplementary Fig. S3 online).
Elutriation (i.e. resuspension of organisms and pouring of supernatant on a 32-µm sieve) or density extraction techniques are other methods traditionally used to study meiofauna38,39. These allow to process whole sediment
layers more rapidly than sieving, and effectively concentrate metazoan organisms38. However, if the retention
of organisms is achieved using only a single mesh size marking the lower size boundary of meiofauna, this also maintains abundance biases. Thus, whether sieving, elutriating, or density extracting, mesh sizes for size-class sorting have to be carefully chosen in order to reach the best compromise between processing time and biomass biases. As underlined by Elbrecht et al. (2017)34, sorting is most useful when samples contain specimens
with biomasses spanning several orders of magnitude. Given that deep-sea sediments contain large numbers of small organisms, and given the high detection capacity of metabarcoding, implementing five mesh sizes for sorting metazoans may be excessive. Instead, separating organisms into small, medium, and large size categories, as performed by Elbrecht et al. (2017)34 for freshwater macroinvertebrates and by Leray & Knowlton (2015)40 for
coastal benthic communities may be sufficient to maximize metazoan species detection.
However, the rationale behind size sorting should be carefully considered when implementing an eDNA metabarcoding study on the deep seafloor. Indeed, for general biodiversity studies not targeting rare of invasive species, the proportion of abundant taxa is most relevant to reach accurate conclusions, and it may thus not be necessary to detect all small and rare taxa in such studies. Moreover, effects of size sorting on other taxonomic compartments have to be taken into consideration. For microbial organisms, sieving down to a 20-µm mesh size is very likely to result in the loss of most small and/or free-living taxa. This idea is supported by the fact that metazoan OTUs shared between sieved and unsieved sediment were mainly assigned to macrofauna (> 1 mm), indicating that small taxa predominantly explain the differences obtained between both methods. For protists and prokaryotes, although sieved and unsieved sediment uncovered comparable alpha diversity levels (Fig. 1), and resolved similar taxonomic compositions at phylum level (Fig. 3), ordinations indicated that communities segregated with processing method for protists (Fig. 4 18S V4). Many sediment microorganisms are living within biofilms (e.g., Bacteroidetes, Archeae), attached to sediment particles (e.g., Planctomycetes) or as symbionts of larger taxa (e.g., Syndiniales, some Dinophyceae and Proteobacteria), making their retention on a 20-µm sieve possible. Our results support this idea, as microbial ASVs shared among sieved and unsieved sediment were mostly belonging to those groups or to taxa larger than 20 µm (e.g. ciliates), possibly explaining the non-significant difference we obtained in PERMANOVA (Table 1).
Finally, sieving is associated to higher contamination risks, as sieves need to be carefully washed between samples and water used for sieving (or elutriation) needs to be ultra-filtered (which can be problematic for the large volumes needed). Considering the limited improvement gained by sieving on metazoan communities, the logistic inconvenience, and the risk of bias for other taxonomic compartments, DNA extractions performed directly on 10 g of sediment appear as a satisfactory approach for large-scale biodiversity surveys targeting multiple life compartments.
Adjusting water sample volume and filter mesh size to target organisms.
Numerous aquatic metabarcoding studies have highlighted that sampled water volume is a key factor affecting species detection rates with eDNA, and has to be adapted to the target ecosystem41. Positive relationships between increased watervolume and increased detection rate have been reported for macroinvertebrates and amphibians42,43, and
stud-ies in freshwater ecosystems have shown that 20 l to 30–68 l of water are necessary to detect entire metazoan communities12,44,45. While 1 L may be appropriate for macroinvertebrate detection in rivers42 or marine surface
waters46, the results presented here clearly show that 7.5 L of deep-sea water are not sufficient to accurately detect
metazoan fauna. The sampling boxes detected less metazoan diversity than the in situ pump (Fig. 1), and failed to detect many phyla with 18S V1-V2 (Fig. 2). Overall, 21% (COI) to 39% (18S V1–V2) of metazoan diversity detected in water was recovered by the sampling box, compared to 89% (COI) and 71% (18S V1–V2) by the in situ pump. This reflects the low abundance and biomass of large organisms in deep waters, combined with the very limited lifetime of extracellular DNA in seawater47–50.
Water sampling methods for eDNA metabarcoding relying on on-board filtration or precipitation are intrin-sically limited by the amount of water that can be processed. Although purpose-built sampling equipment has been developed for increased efficiency and standardization, filtration flow rates rarely exceed 1 L/min51. New
developments allowing the processing of thousands of litres of water, such as the SALSA in situ pump presented here, its equivalent single-sample version52, or tow net methods developed for lentic ecosystems53, improve the
detection sensitivity for metazoan taxa in low biomass environments and will allow for more comprehensive and reliable surveys.
With protists and bacteria, taxonomic structures recovered by each sampling method clearly changed with targeted size class (Fig. 3, Supplementary Fig. S2 online). Most protistan micro- to mesoplankton were better detected by the in situ pump (e.g., diatoms, phaeodareans, Acantharea, Ciliophora), while pico- to nanoplankton were preferentially targeted by the sampling box (e.g., Haptophyta, Telonemia), with many groups identified mostly by the smallest size fraction (0.2–2 µm, Chlorophyta, Choanoflagellida, Picozoa, Chrysophyceae, MAST). For bacteria, groups known to occur in aggregates, on larger particles, or as symbionts of larger organisms were better recovered by the in situ pump (e.g., Actinobacteria, Bacteroidetes, Delta-, Gammaproteobacteria, Lentisphaerae, Firmicutes, Tenericutes), while other, likely free-living, bacterioplankton were predominant in the sampling box samples (e.g., Cyanobacteria, Marinimicrobia). This differential taxon recovery of water col-lection methods has already been reported in shallower studies24, and highlights the importance of targeting the
0.2–2 µm for accurately surveying microbial diversity.
Although the SALSA prototype presented here (Supplementary Fig. S1 online) has since been improved to pump through a 5-µm nylon mesh, in situ filtration techniques are inherently limited by mesh size in order to filter large volumes of water. Thus, although targeting large volumes such as the ones allowed by SALSA represents the most suitable strategy for assessing metazoan diversity in deep-sea waters, its limitation in terms of mesh size leads to the detection of only a fraction of microbial diversity, i.e. mostly larger planktonic groups or taxa fixed on larger faunal specimens or mineral particles. On board filtration of smaller volumes of water remains necessary to access the pico- and nanoplankton, highlighting that both sampling methods are complementary and should be deployed in parallel for integrative biodiversity surveys across the tree of life.
Overall, this comparative study contributes to more comprehensive and more reliable assessments of meta-zoan and microbial deep-sea communities based on eDNA metabarcoding. First, only sediment samples can allow the characterization of benthic taxa and aboveground water samples do not provide a good alternative. Second, sieving sediment leads to an improvement in taxon detection for metazoans, but as expected, also modifies the retrieved community composition for protists and prokaryotes. Thus, for studies targeting only metazoans, it is advisable to first separate the organisms from the sediment particles using sieving, elutriation, or density extraction techniques as recommended by Brannock & Halanych38. If both metazoan and microbial
communities are targeted, and provided sample volume is large enough, an ideal sampling design would be to use multiple sub-samples for microbial taxa and size-sort the remaining sediment for detecting metazoans, as suggested by Nascimento et al.54. Alternatively, as shown here, using sufficient volumes of unsorted sediment
seems to be satisfactory for integrative biodiversity studies across taxonomic compartments. Finally, water sample volume and mesh size need to be carefully chosen depending on taxa of interest, and while volumes collected by sampling boxes (or Niskin bottles) allow the surveying of microbial diversity, much larger volumes are needed to detect deep-sea metazoans.
Methods
Sample collection.
Sediment cores and water samples were collected from a continental slope site during the EssNaut16 cruise in the Mediterranean in April 2016 (Supplementary Table S1 online). Sampling was carried out with a human operated vehicle (Nautile, Ifremer). Triplicate tube cores were collected at the sampling site, and the upper first centimetre sediment layer was used to compare two sediment sampling methods. The sedi-ment samples were either (1) transferred into zip-lock bags and frozen at − 80 °C on board or (2) sieved through five different mesh sizes (1000 µm, 500 µm, 250 µm, 40 µm, and 20 µm) in order to concentrate organisms and separate them by size-class. Sieving was performed with cold surface water filtered at 0.2 µm. Each mesh con-centrate was subsequently stored in a separate zip-lock bag and frozen at − 80 °C. All samples were shipped on dry ice to the laboratory.Two different aboveground water-sampling methods were evaluated during EssNaut16 to target microbial and metazoan taxa. All water samples were collected at most 1 m above the seafloor. Water was collected with a newly developed in situ pump, the Serial Autonomous Larval Sampler (SALSA), i.e. a McLane WTS-LV sampler adapted by Ifremer, Brest, France to allow replicated sampling. SALSA has a rosette holding five 2.8 L sampling bowls mounted underneath a rotator plate that allows the alignment of each sampling bowl with the water intake, in a pre-programmed sequential fashion (Supplementary Fig. S1 online). The pump is placed downstream the sampling bowls and the outlet of each bowl is equipped with a 20-µm nylon mesh, retaining particles larger than 20 µm within the bowl while the water passes through the outlet. SALSA thus allows to obtain a time-series of five samples, each resulting from a 4 h filtration event that concentrates particles from ~ 6000 L of water (depending on the filtration rate applied) at the exact same location. Here, 2 samples of each time series were used while the remaining samples were sorted for classical morphological diversity assessments. Two SALSA deployments were performed at the study site (PL07, PL11) and one deployment within the same habitat but at shallower depth due to technical reasons impeding deployment at the original site (PL09). Analyses were performed with and without PL09, and as results were comparable, PL09 was included in the study. For each SALSA deployment, particles retained in every sample (i.e. 2.8 L sampling bowl containing > 20 µm particles retained during in situ filtration) were concentrated on board on a polycarbonate filter membrane with 2-µm mesh size (Millipore, Burlington, MA, USA, ref. TTTP04700). Water was also collected using two 7.5 L Nautile-deployed sterile and watertight sampling boxes30. These samples were filtered on board successively through membrane filters with 20 µm, 2 µm,
and 0.2 µm mesh size (Millipore, Burlington, MA, USA, refs. NY2004700, TTTP04700, GTTP04700), generating three size fractions (> 20 µm, 2–20 µm, and 0.2–2 µm). Each water filter was stored in an individual Petri dish, frozen at − 80 °C, and shipped on dry ice to the laboratory.
Nucleic acid extractions.
For sediment, DNA extractions were performed using 2–10 g of sediment (Sup-plementary Table S1 online) with the PowerMax Soil DNA Isolation Kit (MOBIO Laboratories Inc.; Qiagen, Hilden, Germany). All DNA extracts were stored at − 80 °C. For the non-sieved method, DNA was extracted directly from 2 to 5 g of sediment, the volume varying with the amount of sediment available. For the sieved method, DNA was extracted from each size fraction separately (from 1 to 10 g of sediment per size fraction), and for each of the three cores, an equimolar pool of the DNA extracts of each size fraction was prepared for PCR and sequencing. Thus, for the sieved method, the samples, were based on 3–6 times more sediment than the unsieved raw extracts, however, as some size fractions yielded low DNA concentrations in each core, the sieved samples were at a lower DNA concentration than the unsieved samples (Supplementary Table S1 online). Water DNA extractions were carried out by Genoscope (Évry, France) using the same protocol as described by Alberti et al. (2017)55 for Tara Oceans water samples. The protocol is based on cryogenic grinding of membrane filters,followed by nucleic acid extraction with NucleoSpin RNA kits combined with the NucleoSpin DNA buffer set (Macherey–Nagel, Düren, Germany). A negative extraction control was performed alongside sample extractions for both water and sediment samples, adding nothing in the place of sample in the first extraction step.
PCR amplification and sequencing.
DNA extracts were normalised to 0.25 ng/µL and 10 µL of standard-ized sample were used for PCR. Four primer pairs were used to amplify one mitochondrial and three ribosomal RNA (rRNA) barcode loci. The cytochrome c oxidase I (COI)56,57 and 18S V1-V2 rRNA8 barcodes were used totarget metazoans, while 18S V458 was used for unicellular eukaryotes, and 16S V4–V559 for prokaryotes
(Sup-plementary Table S2 online). PCR amplifications for each locus (see supplemental information for amplification and purification details) were carried out in triplicate in order to level-off intra-sample variance while obtaining sufficient amounts of amplicons for Illumina sequencing. PCR triplicates were pooled, purified, quality checked and quantified, and 100 ng of amplicons were directly end-repaired, A-tailed, and ligated to Illumina adapters on a Biomek FX Laboratory Automation Workstation (Beckman Coulter, Brea, CA, USA). Library amplifica-tion was performed using a Kapa Hifi HotStart NGS library Amplificaamplifica-tion kit (Kapa Biosystems, Wilmington, MA, USA), with the same cycling conditions applied for all metagenomic libraries, and libraries were puri-fied using 1X AMPure XP beads (Beckman Coulter, Brea, CA, USA). They were then quantipuri-fied by Quant-iT dsDNA HS assay kits using a Fluoroskan Ascent microplate fluorometer (Thermo Fisher Scientific, Waltham, MA, USA) and sample amplicon libraries were pooled equimolarly. The pools were then quantified by qPCR with the KAPA Library Quantification Kit for Illumina Libraries (Kapa Biosystems, Wilmington, MA, USA) on an MxPro instrument (Agilent Technologies, Santa Clara, CA, USA). Library profiles were assessed using a high-throughput microfluidic capillary electrophoresis system (LabChip GX, Perkin Elmer, Waltham, MA, USA). , Libraries normalised to 8–9 pM and containing a 20% PhiX spike-in were sequenced individually on HiSeq2500 (System User Guide Part # 15035786) instruments in a 250 bp paired-end mode. For sediment, this procedure was carried out on two DNA aliquots of each sample (for each core, 2 aliquots of not sieved extract and 2 aliquots of “sieved pool”), leading to two amplicon libraries per sample. For water collected with the sampling box, we targeted and sequenced microbial loci in the 0.2–2 and 2–20 µm fractions, and targeted metazoans in the 2–20 and > 20 µm fractions. The size fractions were processed separately but sequencing failed for the > 20 µm frac-tions with microbial loci, possibly due to the low DNA concentrafrac-tions of these samples.
Bioinformatic analyses.
All bioinformatic analyses were performed using a Unix shell script, available on Gitlab (https:// gitlab. ifrem er. fr/ abyss- proje ct/), on a home-based cluster (DATARMOR, Ifremer), and the samples of the present study were analysed in parallel with 12 to 28 other deep-sea water samples for more accu-rate error correction and LULU filtering. The details of the pipeline, along with specific parameters used for all metabarcoding markers, are given in Supplementary Table S3 online.Illumina read pairs were corrected with DADA2 v.1.1060, following the online tutorial for paired-end
data (https:// benjj neb. github. io/ dada2/ tutor ial. html), delivering inventories of Amplicon Sequence Variants (ASVs). We chose to evaluate unicellular eukaryote and prokaryote diversity at the ASV level due to their lower intraspecific diversity, making ASVs appropriate to study species-level biodiversity patterns in these microbial taxa. Intraspecific diversity being much more pronounced in metazoans than unicellular organisms due to the extremely varying numbers of cells, organelles, pseudogenes (e.g. numts for COI), or ribosomal repeats in their genomes, ASVs reflect metazoan diversity at the intra-species level, which is dependent on the level of intraspe-cific variation in the genome, known to vary widely among taxa61,62. As we were interested in species-level
diversity, we chose to cluster metazoan data. ASVs from COI and 18S V1-V2 were clustered into Operational Taxonomic Units (OTUs) with swarm v263 using the FROGS pipeline64. Swarm v2 is a single-linkage clustering
algorithm that aggregates sequences iteratively and locally around seed sequences based on d, the number of nucleotide differences, to determine coherent groups of sequences. This avoids a universal clustering threshold, which is particularly useful in highly biodiverse samples such as those analysed in this study. Metazoan ASVs were swarm-clustered at d = 3 for 18S V1–V2 (~ 99%) and d = 6 for COI (~ 98%), which has been shown to be appropriate for evaluating species diversity in samples65.
Clusters were taxonomically assigned with BLAST + (v2.6.0) based on minimum similarity (70%) and mini-mum coverage (80%). For ASVs, sequences obtained with DADA2 were subsequently assigned with blastn. For OTUs, BLAST assignment was performed in FROGS using the affiliation_OTU.py command. The Silva132 refer-ence database was used for taxonomic assignment of the 16S V4–V5 and 18S V1–V2 rRNA marker genes66, PR2
v4.1167 was used for 18S V4, and MIDORI-UNIQUE68 reduced to marine taxa only was used for COI. An initial
test implementing BLAST + to assign taxonomy only to the COI dataset using a 96% percent identity threshold led to the exclusion of the majority of the clusters. Indeed, it is not uncommon for deep-sea taxa to have closest relatives in databases (even congenerics) exhibiting nucleotide divergences of 20%69,70.Considering our interest in
diverse and poorly characterized communities, more stringent BLAST thresholds were not implemented at this stage. However, additional filters were performed during downstream bioinformatic processing described below.
Molecular inventories were refined in R v.3.5.171. A blank correction was made using the decontam
pack-age v.1.2.172, removing all clusters that were more prevalent in negative control samples (PCR and extraction
controls) than in true samples. After comparison, results from the technical duplicates produced for sediment samples were merged and read counts were summed for identical OTUs. Fully unassigned clusters were removed (COI: 63%, 18S V1–V2: 20%, 18S V4: 17%, 16S: 5%). When present, non-target clusters were removed (protists or fungi in 18S V1–V2: 60%; metazoans or plants in 18S V4: 10.5%). Additionally, for COI and 18S V1–V2, all metazoan OTUs with a terrestrial assignment (groups known to be terrestrial-only) were removed (COI: 1.5%, 18S: 0.15%). Samples were checked to ensure they had more than 10,000 target reads. Metazoan OTU tables were further curated with LULU v.0.173 to limit bias due to intraspecific variation and pseudogenes, using a minimum
co-occurrence of 0.95, a minimum match at 84%, and a minimum ratio at 1000, which is more appropriate for sample-poor datasets62.
Statistical analyses.
Data were analysed using R with the packages phyloseq v1.22.374, followingguide-lines in online tutorials (http:// joey7 11. github. io/ phylo seq/ tutor ials- index. html), and vegan v2.5.275. Read and
cluster abundances were evaluated via analyses of variance (ANOVA) on generalised linear models using qua-sipoisson distributions. Pairwise post-hoc comparisons were performed via Tukey HSD tests using the emmeans package. Alpha and beta diversity were compared among sampling methods using datasets rarefied to the min-imum sequencing depth (COI: 62,660; 18S V1: 127,044; 18S V4: 37,000; 16S: 100,952). For comparisons by phylum, paired Welch’s t-tests were performed for comparing both sediment methods, and unpaired t-tests were performed for other comparisons. If normality was not verified (Shapiro–Wilk normality test), Wilcoxon (paired) rank tests were performed. Differences in community composition among methods were assessed with Venn diagrams (computed using the venn function in the venn package) and with permutational multivariate analysis of variance (PERMANOVA), using the adonis2 function (vegan) with significance evaluated using 1000 permutations. Incidence-based Jaccard dissimilarities were used for metazoans, while Bray–Curtis dissimilari-ties were used for prokaryotes and unicellular eukaryotes. The rationale behind this choice is that metazoans are multicellular organisms of extremely varying numbers of cells, organelles, or ribosomal repeats in their genomes, and can also be detected through a diversity of remains. The number of reads can thus not be expected to reliably reflect the abundance of detected OTUs. Pairwise PERMANOVAs among sampling methods were performed with the pairwiseAdonis package. Differences in community structures among samples were visual-ized via detrended correspondence analyses on rarefied incidence datasets. Finally, taxonomic compositions in terms of cluster abundance were compared among processing methods only using clusters reliably assigned at phylum-level. Phylum-level reliability thresholds were chosen based on Stefanni et al.76 and were set at
mini-mum hit identity of 86% for rRNA loci and 80% for COI.
Data availability
The raw data for this work can be accessed in the European Nucleotide Archive database (Study accession numbers: PRJEB37673 for water, PRJEB33873 for sediment). Please refer to the metadata excel file for ENA file names. The dataset, including raw sequences, databases, as well as raw and refined ASV/OTU tables are available on https:// doi. org/ 10. 12770/ 2deb7 85a- 74c5- 4b9d- 84d6- 82a81 e0dda 6d. Bioinformatic scripts can be accessed following the Gitlab link.
Received: 18 November 2020; Accepted: 15 March 2021
References
1. Taberlet, P., Coissac, E., Hajibabaei, M. & Rieseberg, L. H. Environmental DNA. Mol. Ecol. 21, 1789–1793 (2012).
2. Rex, M. A. et al. Global bathymetric patterns of standing stock and body size in the deep-sea benthos. Mar. Ecol. Prog. Ser. 317, 1–8 (2006).
3. Snelgrove, P. V. R. Getting to the bottom of Marine biodiversity: sedimentary habitats. Bioscience 49, 129 (1999).
4. Carugati, L., Corinaldesi, C., Dell’Anno, A. & Danovaro, R. Metagenetic tools for the census of marine meiofaunal biodiversity: an overview. Mar. Genom. 24, 11–20 (2015).
5. Grassle, J. F. & Maciolek, N. J. Deep-sea species richness: regional and local diversity estimates from quantitative bottom samples.
Am. Nat. 139, 313–341 (1992).
6. Smith, C. R. & Snelgrove, P. V. R. A Riot of Species in an Environmental Calm in 311–342 (CRC Press, 2002). https:// doi. org/ 10. 1201/ 97802 03180 594. ch6.
7. Hauquier, F. et al. Distribution of free-living marine nematodes in the clarion-clipperton zone: implications for future deep-sea mining scenarios. Biogeosciences 16, 3475–3489 (2019).
8. Sinniger, F. et al. Worldwide analysis of sedimentary DNA reveals major gaps in taxonomic knowledge of deep-sea benthos. Front.
Mar. Sci. 3, 92 (2016).
9. Boeckner, M. J., Sharma, J. & Proctor, H. C. Revisiting the meiofauna paradox: dispersal and colonization of nematodes and other meiofaunal organisms in low- and high-energy environments. Hydrobiologia 624, 91–106 (2009).
10. Klunder, L. et al. A molecular approach to explore the background Benthic Fauna around a hydrothermal vent and their Larvae: implications for future mining of deep-sea SMS deposits. Front. Mar. Sci. 7, 1–12 (2020).
11. Zhao, F., Filker, S., Xu, K., Huang, P. & Zheng, S. Microeukaryote communities exhibit phyla-specific distance-decay patterns and an intimate link between seawater and sediment habitats in the Western Pacific Ocean. Deep Res. Part I Oceanogr. Res. Pap. 160, 103279 (2020).
12. Cantera, I. et al. Optimizing environmental DNA sampling effort for fish inventories in tropical streams and rivers. Sci. Rep. 9, 1–11 (2019).
14. Probandt, D. et al. Permeability shapes bacterial communities in sublittoral surface sediments. Environ. Microbiol. 19, 1584–1599 (2017).
15. Zinger, L. et al. Global patterns of bacterial beta-diversity in seafloor and seawater ecosystems. PLoS ONE 6, e24570 (2011). 16. Antich, A. et al. Marine biomonitoring with eDNA: can metabarcoding of water samples cut it as a tool for surveying benthic
communities?. Mol. Ecol. https:// doi. org/ 10. 1111/ mec. 15641 (2020).
17. Liao, L. et al. Microbial diversity in deep-sea sediment from the cobalt-rich crust deposit region in the Pacific Ocean. FEMS
Microbiol. Ecol. 78, 565–585 (2011).
18. Bienhold, C., Zinger, L., Boetius, A. & Ramette, A. Diversity and biogeography of bathyal and abyssal seafloor bacteria. PLoS ONE 11, e0148016 (2016).
19. Zhang, J., Sun, Q. L., Zeng, Z. G., Chen, S. & Sun, L. Microbial diversity in the deep-sea sediments of Iheya North and Iheya Ridge, Okinawa Trough. Microbiol. Res. 177, 43–52 (2015).
20. Zhang, L. et al. Bacterial and archaeal communities in the deep-sea sediments of inactive hydrothermal vents in the Southwest India Ridge. Sci. Rep. 6, 1–11 (2016).
21. Zhao, F., Filker, S., Stoeck, T. & Xu, K. Ciliate diversity and distribution patterns in the sediments of a seamount and adjacent abyssal plains in the tropical Western Pacific Ocean. BMC Microbiol. 17, 192 (2017).
22. Rodríguez-Martínez, R. et al. Controlled sampling of ribosomally active protistan diversity in sediment-surface layers identifies putative players in the marine carbon sink. ISME J. 14, 984–998 (2020).
23. Pernice, M. C. et al. Global abundance of planktonic heterotrophic protists in the deep ocean. Isme J. 9, 782–792 (2015). 24. Massana, R. R. et al. Marine protist diversity in European coastal waters and sediments as revealed by high-throughput sequencing.
Environ. Microbiol. 17, 4035–4049 (2015).
25. Salazar, G. et al. Global diversity and biogeography of deep-sea pelagic prokaryotes. Isme J. 10, 596–608 (2016).
26. Díez-Vives, C. et al. Delineation of ecologically distinct units of marine Bacteroidetes in the Northwestern Mediterranean Sea.
Mol. Ecol. 28, 2846–2859 (2019).
27. Lochte, K. & Turley, C. M. Bacteria and cyanobacteria associated with phytodetritus in the deep sea. Nature 333, 67–69 (1988). 28. Stokke, R. et al. Functional interactions among filamentous epsilonproteobacteria and bacteroidetes in a deep-sea hydrothermal
vent biofilm. Environ. Microbiol. 17, 4063–4077 (2015).
29. Agusti, S. et al. Ubiquitous healthy diatoms in the deep sea confirm deep carbon injection by the biological pump. Nat. Commun. 6, 1–8 (2015).
30. Roussel, E. et al. Comparison of microbial communities associated with three Atlantic ultramafic hydrothermal systems. FEMS
Microbiol. Ecol. 77, 647–665 (2011).
31. Koziol, A. et al. Environmental DNA metabarcoding studies are critically affected by substrate selection. Mol. Ecol. Resour. 19, 366–376 (2019).
32. Hajibabaei, M. et al. Watered-down biodiversity? A comparison of metabarcoding results from DNA extracted from matched water and bulk tissue biomonitoring samples. PLoS ONE 14, 1–16 (2019).
33. Gleason, J. E., Elbrecht, V., Braukmann, T. W. A., Hanner, R. H. & Cottenie, K. Assessment of stream macroinvertebrate communi-ties with eDNA is not congruent with tissue-based metabarcoding. Mol. Ecol. https:// doi. org/ 10. 1111/ mec. 15597 (2020). 34. Elbrecht, V., Peinert, B. & Leese, F. Sorting things out: assessing effects of unequal specimen biomass on DNA metabarcoding.
Ecol. Evol. 7, 6918–6926 (2017).
35. Thiel, H. Meiobenthos and nanobenthos of the deep-sea. In The Sea 8 (ed. Rowe, G. T.) 167–230 (Wiley, 1983). 36. Zeppilli, D. et al. Characteristics of meiofauna in extreme marine ecosystems: a review. Mar. Biodivers. 48, 35–71 (2018). 37. Singer, G. A. C., Fahner, N. A., Barnes, J. G., McCarthy, A. & Hajibabaei, M. Comprehensive biodiversity analysis via ultra-deep
patterned flow cell technology: a case study of eDNA metabarcoding seawater. Sci. Rep. 9, 1–12 (2019).
38. Brannock, P. M. & Halanych, K. M. Meiofaunal community analysis by high-throughput sequencing: comparison of extraction, quality filtering, and clustering methods. Mar. Genom. 23, 67–75 (2015).
39. Burgess, R. An improved protocol for separating meiofauna from sediments using colloidal silica sols. Mar. Ecol. Prog. Ser. 214, 161–165 (2001).
40. Leray, M. & Knowlton, N. DNA barcoding and metabarcoding of standardized samples reveal patterns of marine benthic diversity.
Proc. Natl. Acad. Sci. USA 112, 2076–2081 (2015).
41. Goldberg, C. S. et al. Critical considerations for the application of environmental DNA methods to detect aquatic species. Methods
Ecol. Evol. 7, 1299–1307 (2016).
42. Mächler, E., Deiner, K., Spahn, F. & Altermatt, F. Fishing in the water: effect of sampled water volume on environmental DNA-based detection of macroinvertebrates. Environ. Sci. Technol. 50, 305–312 (2016).
43. Lopes, C. M. et al. eDNA metabarcoding: a promising method for anuran surveys in highly diverse tropical forests. Mol. Ecol.
Resour. 17, 904–914 (2017).
44. Hänfling, B. et al. Environmental DNA metabarcoding of lake fish communities reflects long-term data from established survey methods. Mol. Ecol. 25, 3101–3119 (2016).
45. Evans, N. T. et al. Fish community assessment with eDNA metabarcoding: effects of sampling design and bioinformatic filtering.
Can. J. Fish. Aquat. Sci. 74, 1362–1374 (2017).
46. Grey, E. K. et al. Effects of sampling effort on biodiversity patterns estimated from environmental DNA metabarcoding surveys.
Sci. Rep. 8, 8843 (2018).
47. Andruszkiewicz, E. A., Sassoubre, L. M. & Boehm, A. B. Persistence of marine fish environmental DNA and the influence of sunlight. PLoS ONE 12, e0185043 (2017).
48. Dejean, T. et al. Persistence of environmental DNA in freshwater ecosystems. PLoS ONE 6, e23398 (2011). 49. Collins, R. A. et al. Persistence of environmental DNA in marine systems. Commun. Biol. 1, 185 (2018).
50. Sassoubre, L. M., Yamahara, K. M., Gardner, L. D., Block, B. A. & Boehm, A. B. Quantification of environmental DNA (eDNA) shedding and decay rates for three marine fish. Environ. Sci. Technol. 50, 10456–10464 (2016).
51. Thomas, A. C., Howard, J., Nguyen, P. L., Seimon, T. A. & Goldberg, C. S. ANDeTM: a fully integrated environmental DNA sampling
system. Methods Ecol. Evol. 9, 1379–1385 (2018).
52. Kersten, O., Vetter, E. W., Jungbluth, M. J., Smith, C. R. & Goetze, E. Larval assemblages over the abyssal plain in the Pacific are highly diverse and spatially patchy. PeerJ 2019, e7691 (2019).
53. Schabacker, J. C. et al. Increased eDNA detection sensitivity using a novel high‐volume water sampling method. Environ. DNA edn3.63 (2020). https:// doi. org/ 10. 1002/ edn3. 63.
54. Nascimento, F. J. A., Lallias, D., Bik, H. M. & Creer, S. Sample size effects on the assessment of eukaryotic diversity and community structure in aquatic sediments using high-throughput sequencing. Sci. Rep. 8, 1–12 (2018).
55. Alberti, A. et al. Viral to metazoan marine plankton nucleotide sequences from the Tara Oceans expedition. Sci. Data 4, 1–20 (2017).
56. Geller, J., Meyer, C., Parker, M. & Hawk, H. Redesign of PCR primers for mitochondrial cytochrome c oxidase subunit I for marine invertebrates and application in all-taxa biotic surveys. Mol. Ecol. Resour. 13, 851–861 (2013).
57. Leray, M. et al. A new versatile primer set targeting a short fragment of the mitochondrial COI region for metabarcoding metazoan diversity: application for characterizing coral reef fish gut contents. Front Zool 10, 34 (2013).