OATAO is an open access repository that collects the work of Toulouse
researchers and makes it freely available over the web where possible
Any correspondence concerning this service should be sent
to the repository administrator:
[email protected]
This is an author’s version published in:
http://oatao.univ-toulouse.fr/23932
To cite this version:
Benabdelkader, Amine
and Taleb, Amina and Probst,
Jean-Luc
and Belaidi, Nouria and Probst, Anne
Origin,
distribution, and behaviour of rare earth elements in river bed
sediments from a carbonate semi-arid basin (Tafna River,
Algeria). (2019) Applied Geochemistry, 106. 96-111. ISSN
0883-2927
Official URL:
https://doi.org/10.1016/j.apgeochem.2019.05.005
Origin, distribution, and behaviour of rare earth elements in river bed
sediments from a carbonate semi-arid basin (Tafna River, Algeria)
A. Benabdelkader
a,b, A. Taleb
b, J.L. Probst
a, N. Belaidi
b, A. Probst
a,∗ aEcoLab, Université de Toulouse, CNRS, Toulouse, FrancebLEcGEN, Université de Tlemcen, Tlemcen, Algeria
Editorial handling by Dr. D. Gooddy
Keywords:
Rare earth elements Bottom sediments Hydrological conditions Dams Erosion Contamination A B S T R A C T
The behaviour and sources of rare earth elements (REE) in river sediments were investigated at ten stations and two dams of the Tafna basin (Northern Algeria) during contrasting hydrological conditions and using a com-bination of normalisation procedures, REE anomalies, various REE ratios, and multivariate statistical analysis. The ranking and REE concentrations were in the range of other carbonated areas. The classical fractionation of the heavy REE(HREE) erosion pattern, evidenced from upstream to downstream by the La/Yb or Sm/Yb ratios, was disturbed by the presence of dams, which retained the light REE (LREE) in particular. The hydrological conditions, particle size, and geochemical characteristics controlled the REE patterns. The LREE were associated with clay minerals and HREE with coarse silts, whereas carbonate and particulate organic carbon (POC) did not influence the transport downstream. The total concentration of REE in sediments was not strongly affected by anthropogenic inputs from various sources (industrial activities, and domestic or medical wastes). Indeed, some LREE enrichment and anomalies were detected at a few stations and locally for Gd, Tb, and Yb. However, the anthropogenic contribution can partially be hidden by dilution due to particle erosion. High flow increased the LREE and MREE enrichment and LREE/HREE fractionation in some places due to erosion processes and an-thropic influences (dam releases and local wastes inputs). Middle REE (MREE) and HREE were the most ex-tractable elements unlike LREE (which are the most concentrated), particularly during high water conditions. Finally, the REE demonstrated the impact of natural processes (hydrological, geochemical, and physical) and some anthropogenic disturbances (waste inputs, fertilisers, and dams). This might inspire to develop such in-vestigations in other similar semi-arid basins undergoing various pressures. The use of local bedrock as a re-ference and a set of geochemical and statistical tools, is recommended.
1. Introduction
Rare earth elements (REE), from the lightest lanthanum (La) to the heaviest lutetium (Lu) and Ytterbium (Yb), are characterised by similar chemical properties. They have been commonly used as input prove-nance markers, to investigate weathering and meteorisation processes in drainage basins, as tracers of changes in environmental conditions in
water and sediments (Sholkovitz, 1995; Borrego et al., 2004), or to
reconstruct REE dispersal patterns (Depetris et al., 2003; Lee et al.,
2008;Xu et al., 2009). Indeed, they are known for their high affinity for
fine grain size fractions in soils or sediments (Cullers et al., 1975;
Ramesh et al., 2000;Caetano et al., 2013;Bayon et al., 2015), and also
for their association with several chemical fractions (Zhang et al., 1998;
Gu et al., 2001;Aubert et al., 2004;Davranche et al., 2008). Carbo-nates, iron oxides, and organic matter are thought to be among the
more important controlling factors of REE (Leybourne and
Johannesson, 2008;Zhang et al., 2014). The grain size, mineralogy, and carbonate content of sediments could thus contribute to the significant
differences in the distribution and fractionation of REE (Yang et al.,
2002;Feng, 2010;Suja et al., 2017). However, such investigations are still poorly documented for sediments under carbonated conditions and
according toLeybourne and Johannesson (2008), there is a need for
more data from eroded material from around the rivers of the world. Parameters such as pH, redox conditions, aqueous and complex
surface reactions (Song and Li, 1998; Zhang et al., 1998), as well as
other environmental conditions, can strongly control or influence the processes of adsorption, desorption, complexation, and co-precipitation
of the REE in the various sediment chemical fractions o (Song and Li,
1998;Aubert et al., 2004), i.e., the fractionation of REE in the leachable
fraction (Zhang et al., 1998;Yang et al., 2002;Leleyter et al., 2012).
∗Corresponding author.
E-mail address:[email protected](A. Probst). https://doi.org/10.1016/j.apgeochem.2019.05.005
River bottom sediments constitute storage material for con-taminants that can be removed and transported downstream with
successive storm flow events (Probst et al., 1999; N'Guessan et al.,
2009;Leleyter et al., 2012;Roussiez et al., 2013). Recognised
world-wide as emerging micro pollutants in aquatic systems (Gonzalez et al.,
2014;Hissler et al., 2014), the high REE concentration in sediments can be attributed to higher inputs from sources such as terrestrial
weath-ering and anthropogenic activities (Ramesh et al., 1999). Indeed, REE
have been frequently used to evaluate anthropogenic influences and
sources for river waters or sediments (Bau and Dulski, 1996;Fuganti
et al., 1996; Xu et al., 2012; Gallello et al., 2013). The natural dis-tribution of REE in water, soil, and sediment from densely in-dustrialised and populated regions can be altered by anthropogenic
influences (Nozaki et al., 2000;Elbaz-Poulichet et al., 2002;Oliveira
et al., 2003;Kulaksiz and Bau, 2007;Di Leonardo et al., 2009;Rabiet et al., 2009). The widespread and growing relevance of REE in a number of industrial, agricultural, and medical technologies and
pro-cedures (Bau and Dulski, 1996) has become evident in the last decades
(United States Environmental Protection Agency (USEPA), 2012) since they are used in various applications, such as permanent magnets (Pr, Nd, Sm), catalysts for petroleum refining (La, Ce), polishing powders (Ce), and LCD screens (Eu) among other high technological products;
they can be also incorporated to fertilisers (Baba et al., 2011;Xie et al.,
2014;Diehl et al., 2018). Gd and some other REE are heavily used. The
growing medical use of REE over the last decades (Lerat-Hardy et al.,
2019) together with their high-tech applications, should demonstrate
the urgent need for investigations into these elements (Gwenzi et al.,
2018). Even if Gd is mainly transported as a dissolved fraction (Kulaksiz
and Bau, 2013), according to Migaszewski and Gałuszka (2015) the origin and mechanisms of controlling the LREE, MREE, or HREE en-richment in soluble and solid fractions are still unknown. It is parti-cularly unclear whether the REE patterns are linked to the aqueous
processes or are related to the source of these elements (Ebrahimi and
Barbieri, 2019). In recent reviews,Rogowska et al. (2018)reported the scarcity of information on the level of Gd in aquatic sediments and the lack of any speciation analysis (China, Australia, Europe) and
Migaszewski and Gałuszka et al. (2015) highlighted the need to im-prove our knowledge about behaviour and origin of REE in the en-vironment.
REE thus have a great potential as geochemical tracers in soils or river sediments due to their strong binding capacity, low natural background, low mobility, chemical stability, and the availability of a
range of these elements with similar properties (Zhu et al., 2011). REE
have been characterised neither as essential elements for life nor as
strongly toxic elements in the environment (Hu et al., 2006). Although
the environmental toxicity of REE is largely unknown, environmental contamination has already been found in some mineralised areas, as well as in soils that are affected by the long-term application of sludge.
Several negative effects of REE on organisms have been reported (Wang
and Liang, 2015).Gonzalez et al. (2014)reviewed the scarce knowledge about the ecotoxicity of these emerging micro contaminants for a proper risk assessment of the REE in aquatic and terrestrial systems.
Indeed, as a first step in adding to the total concentration data, it is necessary to investigate the distribution of REE in non-residual frac-tions of sediments from rivers receiving anthropogenic inputs. This step is of importance since it enables us to appreciate the potential of REE that could end up in river water if physico-chemical conditions change, and therefore could become potentially available and a risk to living
organisms (Gwenzi et al., 2018).
The alternance of river flow conditions is responsible for the transport, storage, and remobilisation of river sediments, and thus of REE linked to solid material. The behaviour of most metals in sediments according to river flow conditions has been quite frequently
in-vestigated in the literature (e.g.Roussiez et al., 2013;Martinez-Santos
et al., 2015). However, REE patterns have been less investigated in southern countries where dams are constructed with an increasing
frequency and flood events are more severe. Dams are known to retain sediments and the associated metals transported during high flow (Audry et al., 2004). However, few data exist for the REE patterns in
dam sediments (Franklin et al., 2016) and for the role of dams in the
transfer of these elements downstream (Yang et al., 2002).
In North Africa, the high degree of climatic fluctuations, intense flood events, low vegetation cover, and excessive soil exploitation have a big impact on erosion, yield sediment, fluvial transport, and dam sedimentation issues, and consequently, on the socio-economic
para-meters of the countries in this region (Lahlou, 1994). Some studies have
investigated the behaviour of REE in river sediments around the world (Sholkovitz, 1995;Leleyter et al., 1999; Yang et al., 2002;Ma et al.,
2011) and especially in the estuaries of Mediterranean Rivers (Borrego
et al., 2004;Roussiez et al., 2013), however, there are very few along
river channels (Bounouira et al., 2013) in Northern Africa. In addition,
the potential anthropogenic sources, the role of anthropogenic influ-ences such as the presence of dams along the river channels, and the role of hydrological conditions on the REE extractability, were not in-vestigated considering those hydroclimatic conditions. The Tafna basin was investigated in this study as one of the major contributing rivers to the Mediterranean Sea. The contamination of bed sediments by trace
metals from various sources has been evidenced (Taleb et al., 2004;
Benabdelkader et al., 2018). However, the REE distribution and their origin, as well as the influence of hydrological conditions, anthro-pogenic inputs, and management structures on REE transport dow-stream the river channel have not yet been studied.
In this study we hypothesise that: (i) the composition of REE in sediment evolved along the river channel as a consequence of various natural or anthropogenic inputs, the presence of dams, and erosion processes; and (ii) hydrological conditions influence the patterns and extractability of REE in sediment.
To verify these assumptions, the objectives of this study were to: 1) quantify REE and evaluate their patterns in river bed sediments from upstream to downstream in the Tafna basin in contrasting hydrological conditions; 2) identify REE anomalies, fractionation ratios, and con-trolling parameters such as texture, carbonate, organic matter, and oxides contents; 3) evaluate the influence of constructed dams on REE transfer downstream; and 4) determine the main extractable fraction of REE in sediments.
2. Material and method 2.1. Description of the study area
The Tafna watershed is located in the Northwest of the Algerian territory, extending into Morocco (27% of the total area of the basin i.e.
7245 km2). The basin is delimited to the north by the mountains of
Traras, to the south by the mountains of Tlemcen, to the west by the Beni-Snassen Mountains in Morocco (BS Mountains), and to the east by
the Sebaa-Chioukh Mountains (SC Mountains) (Fig. 1). The main stream
is the Tafna wadi, whose source is at an altitude of 1100 m on the southern slope of the Tlemcen Mountains at the level of Ghar Boumaaza (GB Source). It flows 170 km along an average slope of 6.5% and empties into the Mediterranean Sea. The Isser wadi is the main right-end tributary of the Tafna wadi, originating at an altitude of 900 m. With a slope of 6.9%, it flows into the Tafna with a confluence at 80 m
of altitude in the plain close to the Tafna outlet (Fig. 1).
For the whole Tafna basin, the slope ranges from < 5% to > 30%. In the Mouillah sub-catchment, the slope is estimated to be < 5%, with
an erosion rate of 400 t km−2yr−1. In the upstream Tafna basin, the
slope is > 25% and it exceeds 30% in the Isser sub-catchment with an
erosion rate of 1000 t km−2yr−1(Tidjani et al., 2006;Zettam et al.,
2017).
The climate of the Tafna basin is of Mediterranean type with a sub-arid tendency; the average precipitation ranges between 183 and 474 mm and the mean annual temperature is 18 °C (period 2000–2015).
The daily temperature can reach up to 47° (2009), which increases the rate of evapotranspiration. The hydrological regime is Mediterranean, alternating heavy storm events and severe drought periods; the mean
annual flow over the last fifteen years varies between 0.11 m3s−1
(2008) and 10.95 m3s−1(2014) at the downstream station (National
Agency of Hydrologic Resources (ANRH), 2016).
The agricultural land is mainly used for cereals, which cover
1699 km2(23.6% of the total area), 342 km2for horticulture (4.75% of
the total area), and 263 km2for arboriculture (3.65% of the total area)
(Algerian Ministry of Agriculture, 2011). Some forests, sparse vegeta-tion, and pasture occupy mainly the upper basin, whereas irrigated
crops cover the rest (Benabadji and Bouazza, 2001).
The Tafna basin is divided into two zones of bedrock types: the upstream part where the river runs in a canyon through Jurassic rocks rich in limestone and dolomite, and the downstream part where it drains a tertiary basin characterised by Miocene marls covered by
re-cent alluvium belonging to the quaternary (Guardia, 1975;Taleb et al.,
2004).
Calcareous soils dominate the upper part of the basin, whereas salt
soils are encountered in the middle course of the Tafna Wadi (Khaldi,
2005). Approximately 50 quarries that exploit clays or limestone to
make aggregates are distributed in the Tafna basin.
The Tafna watershed is thus characterised by a semi-arid climate, limestone dominant lithology, strong erosion due to erratic storm events, and a degraded vegetation cover, in addition to the presence of dams. These characteristics are similar to those of large river basins in the Maghreb region and consequently, the Tafna can be considered a
representative of other basins in Morocco (Moulouya Basin,Tekken and
Kropp, 2012;Tovar-Sanchez et al., 2016); Algeria (Chelif Riber Basin,
Saint-Martin et al., 1992;Taibi et al., 2015; Wadi Rhumel-Boumerzoug,
Bentellis-Mosbah et al., 2003); and Tunisia (Medjerda Basin,Bouraoui et al., 2005).
2.2. Sampling strategy and anthropic activities
In this study, ten river stations (T1, T3, T5, MG, M2, T6, T7, S2, I5,
and T8) and two dams (DamS and DamB) were sampled (Fig. 1). These
stations were chosen on the basis of preliminary survey results and as
described inBenabdelkader et al. (2018), due to the presence of several
anthropic activity sources (industrial and agricultural) and also to the hydrology of the basin from upstream to downstream to the
Medi-terranean Sea (Fig. 1). The stations are located as follows: downstream
industrial units and villages, with a textile industry (T1); ENOF
(ben-tonite business: 600 m3day−1), ENCG (fats business: 528 m3day−1),
ERIAD (corn mill 1 600 m3day−1), and effluents from Maghnia town
including hospital waste (MG); downstream from the industrial unit
CERTAF (ceramics: 130 m3day) (T5) (Tidjani et al., 2006); at the outlet
of the Mouillah tributary (M2), T5 and M2 being located at the DamB entrance; at DamB outlet (T6), and downstream of a large flat agri-cultural area with a lot of river meanders between (T7); downstream of a public dump, urban effluents including hospital waste from the eastern part of Tlemcen city, and industrial effluents (S2); at the outlet of the main downstream tributary Isser wadi, immediately downstream
of the ceramic industry (CERAMIR) (I5) (Ministry of Energy and Mining
of Algeria, 2007); and at the outlet of the whole Tafna basin for (T8) outside of any seawater influence.
In this basin, several main dams were constructed, including DamB—Boughrara Dam—the largest one in the basin with a capacity of
177 million m3, DamE—Beni Bahdel—with a capacity of 66 million m3,
and DamS with a capacity of 27 million m3(National Agency for Dams
and Transfers (ANBT), 2015). In the upstream part of the Tafna basin there is a textile industry and 5 main dams (among which are DamB and DamS), ensuring water supplies along the river course. These dams, after filling, are sparsely emptied during high water flow periods, leading to the transfer of accumulated sediments downstream.
2.3. Physical and chemical sample treatment
River bed surface sediments (the top 3 cm) were manually collected in polyethylene containers at each sampling site from the river bank where they had accumulated, under running water conditions. The samples were stored in a box and transported the same day to the la-boratory. The sampling was performed during four sampling campaigns in recession periods: June 2014 (low water flow), October 2014 (high water flow, corresponding to the first rainfalls after the dry season), February 2015 (high water flow), and August 2015 (low water flow). At each station, bedrock was also sampled from outcroppings of the dominant drainage bedrock in the location. Bottom sediments from two Fig. 1. Study area, elevation, and sediment sampling sites in the Tafna river basin (northwestern Algeria) (treated map of digital elevation data source, deFerranti, 2014(http://www.viewfinderpanoramas.org). N
~~
7
t,jai
Mediterranean Seadissolution of sediment. The extraction process was only performed for sediments from the two campaigns in 2014. Note that Sm was not de-tected during the analytical process since at pH 7.5, it is the most
re-tained REE during an EDTA extraction (Fernandez and Alonso, 2008).
The particulate organic carbon (POC) was analysed with an NA 2100 Protein (Thermo Fisher) at EcoLab laboratory. Every sediment sample was decarbonated with HCl (2N). Usually the addition of HCl lasts 48 h by drips, however, for the Tafna sediment which is much enriched in carbonates, the 48 h period was exceeded until the dis-appearance of effervescence was observed. Subsequently, 5 mg of each sample was analysed.
2.4. Data treatment
To investigate REE patterns along the Tafna river, for some results, the basin was divided into two groups of stations: the stations from the upper basin (T1, T3, T5, MG, M2, DamB, T6, and T7) and those from the main right-hand tributaries joining the Tafna river in its lower part upstream of the estuary of the basin (stations S2, I5, T7, and T8).
As usually performed in the literature (Sholkovitz, 1995;
Romero-Freire et al., 2018), the REE were divided into three sub-groups: LREE (from La to Nd), MREE (from Sm to Gd), and HREE (from Tb to Lu).
2.4.1. Normalisation and element ratio
The relative abundance of REE was normalised to the local bedrock to assess the enrichment or depletion of sediments from their bedrock origin, which is more representative than a distant or global reference (Inguaggiato et al., 2017), as has been observed for other metals (N'Guessan et al., 2009;Benabdelkader et al., 2018). Nevertheless, we used also the normalisation to Post Archean Australian Shale (PAAS,
Taylor and Mclennan, 1985), since this composition has been most frequently used in normalisation procedures, facilitating the
compar-ison with data in the literature (McLennan et al., 1980;Moller et al.,
2002;Tranchida et al., 2011).
Variations and the behaviour across the REE series were indicated by the proportion of enriched light rare earth elements (LREE) with respect to medium rare element (MREE) and to heavy rare earth ele-ments (HREE). This was illustrated by the (La/Yb)n ratio (re-presentative of LREE/HREE), (La/Sm)n ratio (re(re-presentative of LREE/ MREE), and (Sm/Yb)n ratio (representative of MREE/HREE),
respec-tively (Condie, 1993;Mao et al., 2014;Inguaggiato et al., 2017), where
n = every element concentration in sediment normalised to its con-centration in bedrock.
2.4.2. REE anomalies calculations
Anomalies in the normalised REE trends have been frequently used to identify sources of some elements and particular processes such as
fractionation (Sholkovitz, 1995;Moller et al., 2002) In this study, the
anomalies were calculated for Eu and Gd using three equations.
The calculation of the Eu positive or negative anomaly (Eun/Eun*)
according to its neighbouring pairs of elements was proposed (Eq.(1))
and has been used by several authors (Elderfield and Greaves, 1982;
Taylor and Mclennan, 1985;Bau and Dulski, 1996).
Eun/Eun* = (Eu)n/[(Smn× 0.67)+(Tbn× 0.33)] (Eq. 1)
The Ce, Yb, and Tb anomalies were calculated respectively, as
fol-lows (De Baar et al., 1985;Sholkovitz, 1995):
Ce/Ce* = 3(Ce)n/[2(Lan)n+(Nd)n] (Eq. 2)
Yb/Yb* = (Yb)n/[1/2(Tmn+ Lun)] (Eq. 3)
The gadolinium anomaly (Gdn/Gdn*) was estimated according to
(Eq.(2)) (Bau and Dulski, 1996).
Gdn/Gdn* = (Gd)n/(0.33(Sm)n+ 0.67(Tb)) (Eq.4)
The subscript (n) denotes normalisation to the bedrock, and the dams (DamB and DamS) were taken during the low water period
(August 2015) from the centre area using an Ekman grab (Ekman, 1911;
Blomqvist, 1990). The grab was lowered to the sediment surface at 35 m depth and approximately a 10 cm depth of sediment was sampled
over a surface of 0.1 m2.
2.3.1. Physical treatment
In the laboratory, the samples were air dried, carefully homogenised with an agate mortar and quartered, then sieved (with nylon sieve) to obtain three fractions (a fine fraction < 63 μm), a coarse fraction (63 μm–2 mm), and the fraction > 2 mm and each fraction was weighed.
To determine precisely the texture of the sediment (percentage of clay (< 2 μm), silt (2–63 μm), and sand (63–2000 μm), a micro-granulometric analysis was carried out (from 0.01 μm to 3000 μm) using a Horiba LA 950 microgranulometry laser at the EcoLab labora-tory. Each sample was treated with a solution of sodium hexa-meta-phosphate to increase the particle dispersion of the solution. The ac-curacy and precision were 0.6% and 0.1%, respectively.
2.3.2. Chemical treatments and analysis
Mineralisation was performed on the < 63 μm fraction due to its
dominance and affinity for metals (Probst et al., 1999).
Each sediment sample was dissolved in a chemical mixture of HF/
HNO3/H2O2 following a well calibrated procedure of several steps
(Marin, 1998; N'Guessan et al., 2009). In the EcoLab clean room, firstly
100 mg of sediment was digested in a Teflon cup with 0.6 mL HNO3
(suprapure) and 0.5 mL HF at 90 °C for 17 h, then another 0.6 mL HNO3
was added and incubated overnight at 85 °C, and finally the solution
was evaporated. In a second step, to remove the organic matter, H2O2
(0.5 mL) was added at three times in an ultrasonic bath (Branson 1510) at 15 min intervals of until the effervescence has disappeared when the solution was stirred. Finally, after a complete evaporation, the residue
was recovered with 2 mL HNO3 2%. Blanks and the standard sediments
SUD-1, WQB-1, and STSD-3 were prepared following the same dis-solution procedure.
After the dilution process, the concentration of the major elements Ca, Al, Fe, S, P, and Mn were first a nalysed o n a n o ptical emission spectrometer (ICP-OES Thermo IRIS Intrepid II XDL) at EcoLab (Toulouse, France). Secondly, the concentration of trace elements, REE, Th, Y, Sc, and U were analysed using an inductively coupled plasma-mass spectrometry (ICP-MS Quad AGILENT 7500ce) at OMP (Observatoire Midi-Pyrénées analytical platform, Toulouse, France). The trace elements and major elements are presented in the paper by
Benabdelkader et al. (2018) and detailed data can be found in SM
Table 1. For the trace metals, the yielded recovery rates for the stan-dards SUD-1, WQB-1, and STSD-3 were between 85% and 110%, and the blank samples used to test for solvent contamination were below the
detection limit. The detection limit varies around 0.5 mg L−1 for
ICP-OES, and for ICP-MS, the detection limits (DL) was 10−2 μg L−1.
The major and rare earth elements in the bedrock samples were
analysed using an ICP-MS in Center for Petrographic and Geochemical
Research (CRPG, 2017 Nancy, France) (http://www.crpg.cnrs-nancy. fr/index.php) after alkaline fusion with lithium metaborate (Govindaraju and Mevelle, 1987; Garzanti et al., 2010), using a well
calibrated dissolution procedure (Carignan et al., 2001), as for
sedi-ment.
Many metal extraction protocols have been used in the literature, however, since in sediments the majority of anthropogenic metals (in-cluding REE) are linked to organic matter and oxide compounds, EDTA extraction was frequently used due to its greater ability to extract such
element fractions (Beckett, 1989; Leleyter et al., 2012). Such a simple
chemical extraction was thus used to determine the available fraction of REE in the sediments: 1 g of sediment was leached with 10 mL of
0.05 mol L−1 EDTA at ambient temperature (20°) and filtered using a
0.22 μm porosity filter (Ghestem and Bermond, 1998). After dilution,
Gd* = Gdnn* × Gdbedrock (Eq. 5)
Gdanth= Gdmeasured- Gd* (Eq. 6)
= Gd anth ×
Gd measured
Gdanth(%) 100 (Eq. 7)
Where Gdmeasured was the Gd concentration in sediment and
Gdbedrockwas the concentration of Gd in the local bedrock (Lawrence
et al., 2009).
A value of 1 means that the element was not fractionated relative to the crustal composition, whereas a depletion relative to its neigh-bouring REE yields values > 1 (positive anomalies) or < 1(negative
anomalies) (Sholkovitz, 1995).
2.5. Statistical analysis
The statistical investigation was carried out using Excel (2010,
Microsoft®) and STATISTICA (StatSoft, Inc., Dell Software, France)
software version 8.0.306.0 (2007). R software (R Foundation for Statistical Computing, Vienne) version 3.3.1 was used for the Principal Component Analysis (PCA), which was performed on raw data trans-formed with log-ratio data using the rgr package. The exception was for grain size, which was not measured in the same units as the elements.
3. Results
3.1. Particle size distribution of the sediment samples
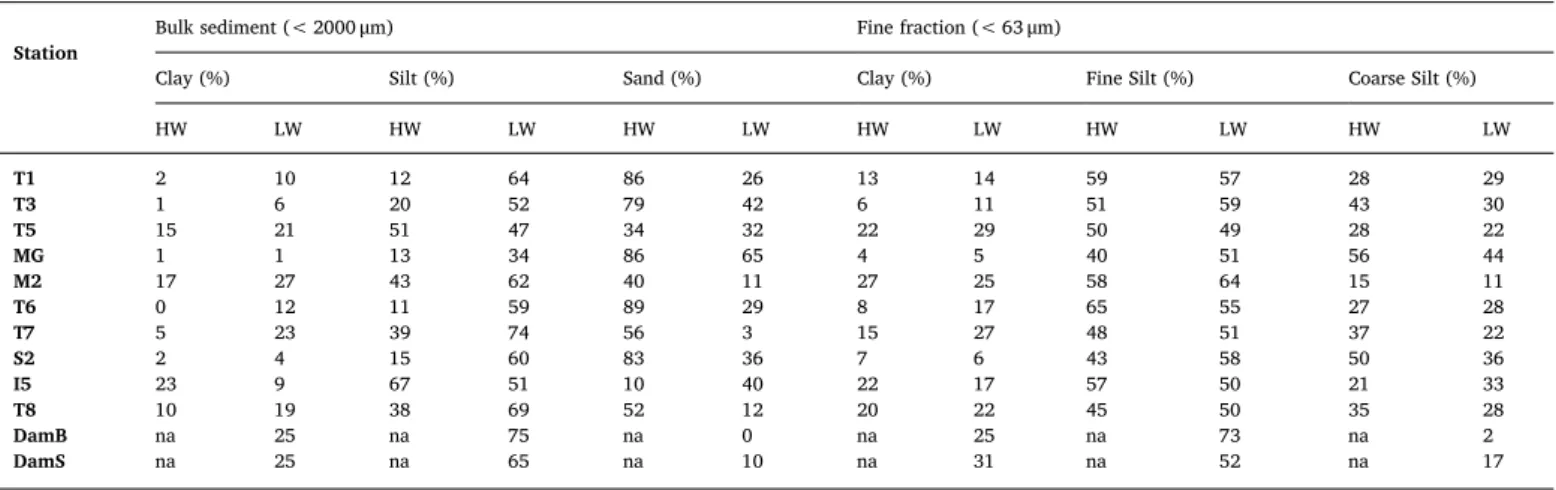
The grain size distribution was assessed in the bulk fraction (< 2000 μm) and the fine fraction (< 63 μm) of sediment from the different stations during two contrasting hydrological conditions (high water and low water). The fine fraction was used in the REE
in-vestigations (Table 1).
3.1.1. Bulk fraction
In the bulk fraction, the clay and silt relative content was higher (silt dominant) in low water conditions than high water conditions for every station, except I5 (for clay and silt) and T5 (for silt). In contrast, the sand content was higher during high water conditions, except at the I5 station. During low and high water conditions, the highest percentages of clay were observed in M2, T7, and T5 with (27–21%) and in I5, M2,
and T5 (23–15%), respectively, and of silt in T7, T8, and T1 (74–64%) and in I5, T5, and M2 (67–43%), respectively.
The sediments from the two dams, which were only collected during low water conditions in 2015, have roughly the same texture, domi-nated by silts, with a 10% sand composition for DamS.
3.1.2. Fine fraction
In the fine fraction, the percentage of clay was between 4 and 29%; the clay content was higher in the low water condition than the high water condition for all stations, except I5, and to a lesser extent in M2 and S2, where it was approximately equivalent. The fine silt was the main fraction in LW conditions and in most of the stations during high flow conditions, except at MG and S2. This fraction was also higher in LW than HW, except at T6 and I5, and to a lesser extent T1 and T5. The coarse silt fraction ranged between 11 and 56% and was found to be higher in HW, except at I5, and to a lesser extent at T1 and T6.
In the dams, fine silt was also the dominant fraction. Clay and coarse silts were found to be higher in DamS (31% and 17%, respectively) than in DamB (25% and 2%, respectively). In contrast, fine silt was higher in DamB (73%) than DamS.
3.2. REE concentrations and other reference elements in sediment
Table 2 Presents the average concentration of REE and trace ele-ments (Th, Y, Sc, and U) in the Tafna River bed sediele-ments collected during four campaigns at ten sites and two dams (DamB and DamS), as well as in local bedrock (BR) and bedrocks taken as a reference (PAAS,
McLennan, 2001; and carbonates,Turekian and Wedepohl, 1961). The average ranking of concentrations was as follows: Ce > La > Nd > Pr > Sm > Gd > Dy > Yb > Er > Eu > Ho > Tb >
Tm=Lu, from 42.22 to 0.21 μg g−1for Ce and Tm=Lu, respectively.
These concentrations are in the vicinity of the concentrations found in
other carbonate rivers, such as the Sebou River (NW Morocco;Leleyter,
1998) and the Gascogne Rivers (N'Guessan, 2008), although they are
higher in the Sebou (except Pr and Ce). The REE concentrations fol-lowed the same order of classification as in the Tafna, however, the HREE are less concentrated in the sediments from the Gascogne area, whereas the opposite is true for LREE and MREE (except Gd). A reverse pattern was observed for the Sebou River. Moreover, the CaO
con-centration in the Tafna sediments (8.13–34.50%,Benabdelkader et al.,
2018) was higher than in the Sebou River (9.14 and 19.10%,Leleyter,
1998) and in the Gascogne Rivers (0.28 and 14.62%,N'Guessan et al.,
2009).
The concentrations of REE from the Tafna sediments are much
lower than the values (104 and 0.58 μg g-1) observed in sediments from
Table 1
Mean relative texture composition (in %) of the bulk sediment (< 2000 μm) and of the fine fraction (< 63 μm, used to determine REE concentrations), during two contrasting hydrological conditions (LW: low water and HW: high water) in the 2014 and 2015 campaigns (except for the dams which were only sampled in LW in 2015) at the sampled stations (seeFig. 1). Clay: < 2 μm; fine silt: 2–20 μm; coarse silt: 20–63 μm; silt: 2–63 μm; sand: 63–2000 μm; na: no data.
Station Bulk sediment (< 2000 μm) Fine fraction (< 63 μm)
Clay (%) Silt (%) Sand (%) Clay (%) Fine Silt (%) Coarse Silt (%)
HW LW HW LW HW LW HW LW HW LW HW LW T1 2 10 12 64 86 26 13 14 59 57 28 29 T3 1 6 20 52 79 42 6 11 51 59 43 30 T5 15 21 51 47 34 32 22 29 50 49 28 22 MG 1 1 13 34 86 65 4 5 40 51 56 44 M2 17 27 43 62 40 11 27 25 58 64 15 11 T6 0 12 11 59 89 29 8 17 65 55 27 28 T7 5 23 39 74 56 3 15 27 48 51 37 22 S2 2 4 15 60 83 36 7 6 43 58 50 36 I5 23 9 67 51 10 40 22 17 57 50 21 33 T8 10 19 38 69 52 12 20 22 45 50 35 28 DamB na 25 na 75 na 0 na 25 na 73 na 2 DamS na 25 na 65 na 10 na 31 na 52 na 17
superscript (*) denotes the geogenic background (extrapolated/
inter-polated) (Kulaksiz and Bau, 2013).
The anthropogenic fraction of Gd (Gdanth) was calculated using the
the Bouregreg silicate basin (Morocco,Bounouira et al., 2008), but in the range of two basins draining mining waste from southern Spain
(45.79 for Ce and 0.17 μg g−1for Lu for the Odiel and Tinto Rivers in
Spain (Borrego et al., 2004)). Only the concentrations of La and Yb
slightly exceeded those of the Tafna.
The average ΣREE in the Tafna sediments was 102 μg g−1 and
varied between 153.39 μg g−1and 90.27 μg g−1in DamB and T3,
re-spectively. Based on ∑REE, the stations ranked as follows: DamB > I5 > DamS > T5 > T7 > M2 > T8 > MG > T6 > T1 > S2 > T3. The I5 station, at the outlet of the Isser tributary, had the highest concentrations of LREE, MREE, and HREE. The most concentrated
element was Ce (54.36 μg g−1) for LREE, Sm (4.69 μg g−1) for MREE
and Dy (1.15 μg g−1) for HREE. The REE in sediment from the I5 station
were even more concentrated than in DamS. Among all the stations from the Tafna River course, the highest REE concentrations were found in sediments from the T5 station, whereas the lowest ones were found in the upstream part of the Tafna (T1 and T3 stations). Indeed, REE in the sediments from DamB and I5 were 1.6 and 1.3 times higher than in
those from the other sites, respectively (Table 2).
The REE in the bedrocks collected from the Tafna basin ranged from
15.26 μg g−1to 0.15 μg g−1with ΣREE = 41.21 μg g−1(Table 2). These
concentrations were low compared to the Tafna river sediments and to
the PAAS reference bedrock (184.77 μg g−1, McLennan, 2001),
how-ever, they were in the range of or even higher than other carbonate
bedrocks (ranging from 11.50 to 0.04 μg g−1, for Ce and Tm,
respec-tively (Turekian and Wedepohl, 1961).
The analysed trace element concentrations (Th, Y, Sc, and U) ranked as follows: Y > Sc > Th > U on average for the Tafna sediments. The highest concentrations of Th, Y, and U were found for the I5 station, which is consistent with the levels of REE and DamB, and contrary to Scandium, which was found at the lowest concentration in I5
(9.84 μg g−1) and the highest in the upstream station T1 (17.18 μg g−1).
The trace elements (Th, Y, Sc, and U) in Tafna bedrock followed the same ranking as in the Tafna sediments, and varied between 10.40 and
2.20 μg g−1for Y and U, respectively. The concentration of Th and Sc in
the local bedrock was higher than in other carbonate bedrocks, and the
opposite was observed for Y (Turekian and Wedepohl, 1961;Olivarez
et al., 1991).
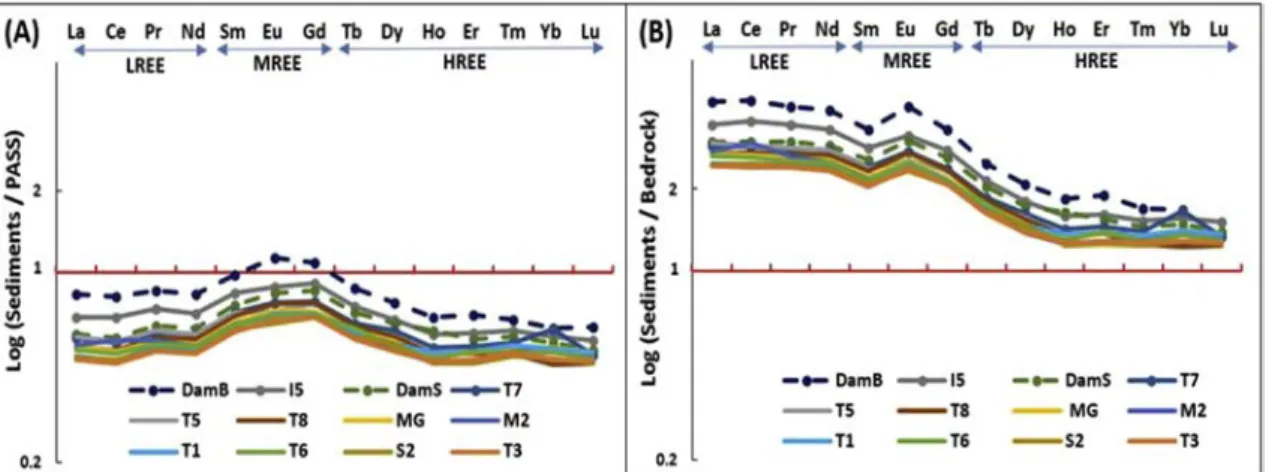
3.3. Rare earth element normalisation
3.3.1. General patterns and elemental fractionation
The average of REE concentrations in sediments from the different studied stations for the four sampling campaigns were normalised using
two bedrock references, the PAAS (McLennan, 2001) (Fig. 2A) and the
mean local bedrock (Fig. 2B). For the two normalisations, a different
general pattern and enrichment was observed, however, the ranking of the stations was similar. The highest patterns were in the order DamB > I5 > DamS > T7 > T8 and the lowest one was for T3 station irrespective of the normalisation method.
REE in the Tafna sediments were impoverished relative to PAAS,
particularly LREE and HREE (Fig. 2A), however, there was a relative
enrichment of MREE. When using the mean Tafna bedrock (Fig. 2B), a
general enrichment was observed, which was more obvious for LREE and MREE, with a relative impoverishment of HREE for some stations. The fractionation ratio was calculated as the mean for high water
and for low water conditions (Table 3). The (La/Yb)nratio varied in
between 1.14 and 2.95 in T7 and T6, respectively, for high water conditions. This ratio was higher in high water flow conditions than in low water conditions, except at the T3, S2, T5, T6, and T7 stations in 2015. Moreover, during high water conditions, the ratio was higher in 2014 (X̅ = 2.47, ranging from 2.19 to 2.95) than in 2015 (X̅ = 1.96, Table 2
Rare earth element and trace element (Th, Y, Sc, and U) concentrations in sediments from each sampling sites (mean (x̅), standard deviation (σ)) collected during the four sampling periods, except for the dams (DamB and DamS), which were only sampled once in LW in 2015. The mean value for the Tafna sediment (this study, mean Tafna sed, n = 40) was the average of the river stations, except the dams. The REE composition of other carbonate rivers is indicated: the Sebou River1from the Maghreb area (Morocco,Leleyter, 1998) and the Gascogne Rivers2(SW France,N’Guessan, 2008). The REE concentration in the local Tafna bedrock (mean value, n = 10), the PAAS3(McLennan, 2001) and the carbonate bedrocks4(Turekian and Wedepohl, 1961) are shown. (−): not determined. R = river, BR = bedrock.
μg.g−1 Station La Ce Pr Nd Sm Eu Gd Tb Dy Ho Er Tm Yb Lu ∑ REE Th Y Sc U Sediment T1 x¯ 18.76 37.64 4.71 17.71 3.54 0.76 3.30 0.46 2.56 0.50 1.46 0.22 1.48 0.22 93.32 5.56 13.73 17.18 1.44 σ 2.65 5.31 0.72 2.75 0.62 0.13 0.63 0.09 0.57 0.11 0.33 0.05 0.39 0.04 10.81 0.99 3.21 4.44 0.27 T3 x¯ 18.28 36.72 4.53 16.99 3.37 0.78 3.18 0.44 2.40 0.47 1.36 0.2 1.35 0.20 90.27 5.01 12.69 15.75 1.40 σ 2.24 4.64 0.50 1.83 0.35 0.08 0.38 0.04 0.18 0.03 0.05 0.02 0.11 0.01 10.53 0.58 0.74 1.46 0.09 T5 x¯ 22.24 44.46 5.38 20.09 3.94 0.78 3.57 0.48 2.75 0.49 1.45 0.21 1.46 0.21 107.51 6.22 14.13 12.81 1.49 σ 4.77 9.13 1.14 3.99 0.87 0.21 0.91 0.14 0.83 0.16 0.50 0.08 0.62 0.07 12.77 1.64 4.97 3.13 0.52 MG x¯ 20.34 40.67 4.92 18.56 3.66 0.78 3.36 0.47 2.60 0.48 1.44 0.21 1.49 0.22 99.20 6.23 13.67 12.65 1.55 σ 3.06 6.45 0.78 3.00 0.58 0.13 0.54 0.06 0.38 0.08 0.28 0.04 0.38 0.03 11.67 1.36 2.51 3.87 0.41 M2 x¯ 20.73 45.00 4.96 18.19 3.56 0.75 3.24 0.45 2.42 0.46 1.35 0.21 1.45 0.21 102.98 6.69 12.25 14.17 1.47 σ 4.57 10.44 1.14 4.26 0.94 0.20 0.79 0.11 0.68 0.12 0.40 0.06 0.46 0.05 12.67 2.47 4.10 4.45 0.45 T6 x¯ 19.88 39.98 4.80 18.15 3.54 0.76 3.25 0.48 2.51 0.48 1.47 0.20 1.43 0.21 97.14 5.40 13.66 11.18 1.50 σ 1.02 1.71 0.29 1.21 0.24 0.11 0.39 0.09 0.45 0.10 0.30 0.05 0.32 0.05 11.46 0.62 2.66 1.80 0.33 T7 x¯ 21.84 44.02 5.31 20.16 3.95 0.84 3.65 0.50 2.86 0.52 1.53 0.22 1.75 0.21 107.36 6.07 15.28 11.88 1.59 σ 4.48 9.72 0.96 3.48 0.45 0.07 0.35 0.04 0.27 0.05 0.15 0.03 0.35 0.03 12.62 1.13 1.96 1.66 0.31 S2 x¯ 18.56 37.96 4.59 17.28 3.41 0.71 3.18 0.45 2.55 0.46 1.32 0.20 1.35 0.20 92.22 5.07 13.08 16.18 1.38 σ 2.79 6.32 0.81 3.28 0.58 0.12 0.55 0.08 0.63 0.10 0.29 0.05 0.38 0.05 10.85 1.01 3.02 3.75 0.43 I5 x¯ 26.17 54.36 6.52 24.06 4.69 0.95 4.27 0.58 3.15 0.58 1.70 0.24 1.64 0.24 129.15 7.45 16.39 9.84 1.70 σ 5.49 11.71 1.25 4.68 0.84 0.14 0.73 0.10 0.52 0.09 0.29 0.03 0.31 0.03 15.51 1.37 2.94 1.14 0.30 T8 x¯ 20.23 41.44 5.10 19.17 3.86 0.83 3.61 0.49 2.71 0.50 1.43 0.20 1.30 0.20 101.07 5.63 13.95 10.06 1.32 σ 1.39 2.71 0.32 1.50 0.31 0.09 0.29 0.04 0.27 0.05 0.14 0.01 0.10 0.01 11.87 0.18 1.19 1.62 0.08 Mean Tafna R x¯ 20.70 42.22 5.08 19.05 3.75 0.79 3.46 0.48 2.65 0.49 1.45 0.21 1.47 0.21 102.01 5.93 13.88 13.17 1.48 σ 2.33 5.17 0.58 2.07 0.39 0.07 0.34 0.04 0.22 0.04 0.11 0.01 0.14 0.01 12.07 0.78 1.21 2.57 0.11 Sebou1R x¯ 21.29 41.84 5.03 19.44 3.98 0.89 3.62 0.59 3.16 0.67 1.70 0.28 1.72 0.27 104.47 - - - -Gascogne2R x¯ 25.34 55.58 6.09 23.46 4.57 0.89 3.15 0.44 2.44 0.47 1.30 0.19 1.25 0.18 125.35 - - - -DamS 22.65 45.60 5.63 21.05 4.23 0.91 4.02 0.55 3.03 0.60 1.62 0.23 1.56 0.22 111.90 5.89 15.81 12.13 1.72 DamB 31.72 64.73 7.61 28.27 5.47 1.22 5.08 0.67 3.64 0.68 2.00 0.27 1.76 0.27 153.39 8.21 18.21 15.81 1.79 Bedrock BR Tafna x¯ 7.53 15.26 1.89 7.24 1.65 0.30 1.53 0.27 1.75 0.37 1.05 0.16 1.05 0.16 40.21 3.30 10.40 5.90 2.20 PAAS3 x¯ 38.20 79.60 8.83 33.90 5.55 1.08 4.66 0.77 4.68 0.99 2.85 0.41 2.82 0.43 184.77 - - - -Carbonate BR4 x¯ - 11.50 1.10 4.70 1.30 0.20 1.30 0.20 0.90 0.30 0.50 0.04 0.50 0.20 24.54 1.70 30.00 1.00 2.20
ranging from 1.14 to 2.43), and it was generally the reverse for low water flow conditions (X̅ = 1.68, ranging from 1.42 to 2.06 in 2014 and X̅ = 2.01, ranging from 1.72 to 2.56, in 2015). In the dams only sam-pled in 2015, the ratio exceeded 2 and was the highest in DamB (2.52). Irrespective of the year of sampling, in HW, stations I5, T8, and T5
always had the highest (La/Yb)n(> 2) and T6 and T7 the biggest
dif-ference between the two years of sampling. T5 and S2 exhibited the highest ratio in LW in 2015, whereas T5, T7, T6, and I5 exceeded 2.5 in HW in 2014. The (La/Yb)n ratio increased from upstream to down-stream in the upper Tafna (T1 < T3 < T5), except in high water con-ditions in 2015. At the outlet of the Mouillah and Ourdeffou Rivers (stations M2 and MG, respectively), which contributed to DamB inputs, the ratio was lower than at the Tafna station (T5). Indeed, the (La/Yb)n ratio in DamB during LW conditions was similar to T5 and was higher than in DamS.
The (La/Sm)n and (Sm/Yb)n ratios were lower than the (La/Yb)n ratio for all the stations (1.08–1.56 in T1 and M2, 1.03–2.22 in T5 and T7, respectively). The (La/Sm)n was quite similar (even slightly higher
during HW) for the two hydrological conditions (X̅ = 1.23, ranging from 1.11 to 1.56 in HW and X̅ = 1.18 ranging from 1.08 to 1.23 in LW, respectively). The exception was a higher value during high water flow in T1, I5, and T6, T7 in 2014 as well as T1 and M2 in 2015. In low water conditions, the (Sm/Yb)n was higher in 2015 than in 2014 and was higher for high water conditions in 2014 than for low water conditions, and the reverse was found for 2015 (except for T1, MG and I5). This pattern was similar to the (La/Yb)n ratio, except for the M2 station in 2015, as well as for the dams. The (La/Sm)n was similar in T5, MG, and M2, and was higher in DamB than in DamS. Similarly to (La/Yb)n, the (La/Sm)n ratio tends to be higher in the upper Tafna basin, except in high water conditions.
3.3.2. Individual REE patterns and main pattern anomalies
The sediment REE patterns normalised to the local bedrock are shown for each station during each sampling condition (HW and LW in 2014 and 2015), except DamB and DamS, which were only sampled in
LW in 2015 (Fig. 3). The data were separated in two sets of stations: (i)
those of the upper Tafna river course (Tafna +Mouillah) down to the
T7 station (T1 T3, T5, M2, MG, DamB, T6, and T7) (Fig. 3A, B, i.e. 2015
low and high water campaigns, respectively, andFig. 3C, D, i.e. 2014
low and high water campaigns, respectively, andFig. 1); (ii) the
sta-tions from the main right hand tributary of the Tafna (Isser) to the basin outlet (S2, DamS, I5, and T8, with T7 for the Tafna upstream reference) (Fig. 3A′, B′, i.e. 2015 low and high water campaigns, respectively, and
Fig. 3C′, D’, i.e. 2014 low and high water campaigns, respectively, and
Fig. 1) for the two hydrological conditions.
The general mean pattern of fractionation for each station was evaluated using the La/Yb ratio. Similarly to the mean value, on the whole, the REE patterns were consistent, irrespective of the hydro-logical condition, with the LREE being more enriched than HREE, however, this relative enrichment depended on the station and on the
discharge condition (Table 3;Fig. 3). HREE were also generally slightly
enriched relatively to bedrock, but some impoverishment was observed for some stations, such as M2, T6, and T5 (HW 2014), S2 (LW 2015), T1
(HW 2015) (Fig. 3D). Generally, the ranking of stations driven by LREE
was as a whole conservative for MREE and to a less extent for HREE.
During high water flow conditions in 2015 (Fig. 3B, B′), a higher
enrichment (particularly obvious for LREE) was observed for some stations such as MG, M2 (Mouillah river), I5, and S2 (Isser tributary). The highest fractionation between LREE and HREE was for I5 (from 1.7 Tm to 4.5 Ce). In contrast, other stations such as T3 and T8 showed rather stable patterns regardless of the conditions. Compared to low water conditions, this fractionation was decreased for the upstream
station T1 and most obviously for T5 (Fig. 3A, B; A′, B′); this was also
observed in HW in 2014 (Fig. 3C, D; C′, D′). During LW conditions in
2015 (Fig. A′), the pattern of REE enrichment for the outlet station T8 Fig. 2. Normalised REE patterns for each Tafna site (mean for the four sampling periods) using PAAS (A) and the mean local bedrock (B) as normalisers. Table 3
REE ratios (La/Yb, La/Sm, Sm/Yb) and REE anomaly (Eu/Eu*) during four campaigns (in 2014 and 2015) associated with two contrasting hydrological conditions (HW: high water; LW: low water), normalised to mean local bedrock.
Station (La/Yb)n (La/Sm)n (Sm/Yb)n Eun/Eun*
2014 2015 2014 2015 2014 2015 2014 2015 HW T1 2.19 1.99 1.18 1.24 1.86 1.61 1.19 1.29 T3 2.29 1.80 1.21 1.15 1.89 1.57 1.23 1.22 T5 2.68 2.21 1.20 1.28 2.22 1.73 1.07 1.22 MG 2.16 2.10 1.19 1.23 1.81 1.70 1.23 1.18 M2 2.28 2.18 1.18 1.56 1.92 1.40 1.14 1.24 T6 2.95 1.64 1.35 1.18 2.18 1.39 1.13 1.22 T7 2.71 1.14 1.37 1.11 1.98 1.03 1.14 1.28 S2 2.22 1.87 1.21 1.20 1.83 1.56 1.22 1.06 I5 2.85 2.43 1.29 1.24 2.20 1.95 1.19 1.13 T8 2.42 2.24 1.14 1.14 2.12 1.97 1.25 1.20 LW T1 1.42 1.72 1.08 1.17 1.31 1.47 1.27 1.27 T3 1.52 2.02 1.18 1.19 1.29 1.69 1.27 1.28 T5 1.63 2.56 1.21 1.25 1.35 2.06 1.21 1.14 MG 1.67 1.87 1.20 1.23 1.39 1.52 1.28 1.28 M2 1.79 1.94 1.17 1.23 1.53 1.57 1.24 1.29 T6 1.66 1.95 1.17 1.21 1.42 1.61 1.29 1.26 T7 1.54 1.95 1.16 1.17 1.33 1.67 1.30 1.25 S2 1.64 2.18 1.13 1.21 1.33 1.80 1.27 1.27 I5 1.89 1.88 1.18 1.14 1.61 1.64 1.25 1.25 T8 2.06 2.04 1.18 1.13 1.74 1.80 1.26 1.32 DamB 2.52 1.27 1.99 1.32 DamS 2.03 1.17 1.74 1.25
(A)
La Ce Pr Nd Sm Eu Gd Tb Dy Ho Er Tm Yb Lu(B)
La Ce Pr Nd Sm Eu Gd Tb Dy Ho Er Tm Yb LuLREE MREE HREE LREE MREE HREE
..
..
:i' vi' u IllE
ct.,,
e:.
2 al QI"'
...
..
C"'
QIc
E 1e
1 'c!
'c QI ~ ~..,
~- -
D•mB
-
15
- -
D•mS
-
T7
..,
- -
DamB
-
1s
- -
Dams
- T7-
rs
- -TS MG - -MZ-
rs
- -TS MG - -MZ - -Tl - -T6- -
sz
- T3 Tl - -T6-
s2
-
n
0.2 0.2remained similar to that of Dam S, T7, and I5. For HREE, in high flow conditions, except at I5, the patterns were more or less the same. For some stations (MG, M2, I5, and S2), the enrichment increased in 2015 (Fig. 3A, A′, B, B′). In 2014 this was observed for I5, T3, T7, and T8, whereas for the other stations such as T5, M2, MG, T6, and S2, the
enrichment decreased (Fig. 3C, C’; D, D’).
Sampling of the dams during low water conditions in 2015
indicated, as a whole, the highest REE enrichment in DamB, particu-larly for LREE and MREE.
For almost all the stations, MREE exhibited an enrichment for Eu (Fig. 3; Table 3). Based on the mean hydrological conditions (high
water and low water; Eq.(1), Eun/Eun* exceeded 1 for all stations, with
the highest values for MG, T6, M2, and T8 (1.28–1.32) in low water and the lowest values for T5 and S2 (HW 2014 and HW 2015; respectively). Fig. 3. Normalised REE patterns for each Tafna site and for the four sampling periods using the mean local bedrock as a normaliser (A, A’: low water (LW) in February
2015; B, B’: high water (HW) in February 2015; C, C’: low water (LW) in June 2014; D, D’: high water (HW) in October 2014), calculated by dividing the basin into two parts: A, B, C, D the Tafna river with T1, T3, T5, MG, M2, T6, and T7 stations; A′, B′, C′, D′ the right hand tributary including the Isser River with S2, DamS, and I5 and the Tafna downstream part T8 and T7 (the T7 station was included also in this group to evaluate its influence on the outlet station).
-
n
-
n
-
rs
MG - M2 - -Tl - -T3 - -TS MG - -M2 - -T6- -
TT
- -TS - T6-
TT
-
rs
- • -oamB 4.5..
4.5-
...
...
~ 3.9...
,
,
8
(A) 2015 LW -.; 3.9 (B) 2015 HW -.;'
.,
:: 3.3 ~'
,
"'
-
~3.3 w a: w ~ 2.7 7 ~2.7 'c:.,
e
2.1 ~ ~2.1 '6.,
.,
-·
"'
::: 1.5 ~1.5 w a: a: 0.9 0.9 7 T La Ce Pr Nd Sm Eu Gd Tb Dy Ho Er Tm Yb Lu La Ce Pr Nd Sm Eu Gd Tb Dy Ho Er Tm Yb Lu-
TT
- s2 _ ,5-
rs
- • -DamS-
TT
- s2-
,s
-
rs
4.5...
4.5 ~ 3.9 u (A'}2015 LW ~3.9(B') 2015 HW
-.;
.,
:: 3.3"'
w 3.3 w...
w a: ~2.7 ~2.7 'c:.,
.,
~
2.1 E 2.1 '6.,
.,
"'
::!
1.5 ~1.5 w a: a:•
0.9 ~ 0.9 La Ce Pr Nd Sm Eu Gd Tb Dy Ho Er Tm Yb Lu La Ce Pr Nd Sm Eu Gd Tb Dy Ho Er Tm Yb Lu-
n
-
n
-
rs
- MG - M2 - T6 - T7-
rs
- -
n
- -
n
- -
rs
MG - -M2 - -T6- -
TT
- -
rs
4.5 4.5...
u...
~ -9 !:! 3.9,,
(D) 2014 HW.,
(C} 2014 LW.,
:!:
3.3"'
w ::,a.3 a: a: ';J-2.7E'l
.
7
C.,
.,
~.,
2.1 '51..1 E.,
"'
"'
~ 1.5 ~1.5 a: a: 0.9 0.9 La Ce Pr Nd Sm Eu Gd Tb Dy Ho Er Tm Yb Lu La Ce Pr Nd Sm Eu Gd Tb Dy Ho Er Tm Yb Lu- -
n
- -s2--
,s
- -
rs
-
r1
- s2 - 15-
rs
4.5 4.5-...
...
2
3.9 u,,
~3.9 (D') 2014 HW.,
(C'} 2014 LW.,
"'
"'
~ 3.3 w3.3 -w a: a: ":::-2.7 ~2.7 C.,
.,
~.,
2.1 ~2.,
.1-"'
"'
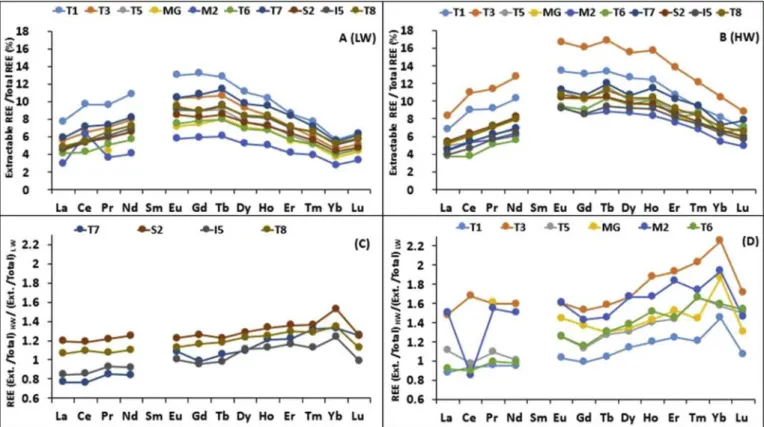
~1.5 ~1.5 -a: a: 0.9 0.9 - - - , La Ce Pr Nd Sm Eu Gd Tb Dy Ho Er Tm Yb Lu La Ce Pr Nd Sm Eu Gd Tb Dy Ho Er Tm Yb Luleast extractable element (0–8%). For MREE, Eu (6 and 17%) and Gd (6 and 16%) were the most extractable elements. For HREE, the most ex-tractable REE were in the order Tb > Ho > Dy > Er > Tm > Yb > Lu
(between 17% (Tb) and 3% (Yb=Lu)). FromFig. 4C, D, it is obvious that
for all stations, HREE were the more extractable during high water flow conditions than low water flow conditions. In contrast, no difference between the flow conditions was observed for LREE (T5, T6, and T1) or LREE were more extractable in low water conditions (I5, T7, and Ce in M2). For high water conditions, the highest extractability was observed at stations T3 and M2 (1.4–2.2 times), and to a lesser extent at MG, T6, and S2, particularly for MREE and HREE. Note also that Yb was the most extractable REE during high water flow relative to the low water con-dition, for all the stations except T6.
4. Discussion
4.1. Origin and fractionation of REE
As a whole, the REE concentrations in the Tafna sediments (Table 2)
were in the range of other rivers draining carbonates (Leleyter, 1998;
N'Guessan, 2008), even if the sediments had a higher content of car-bonates. However, the REE concentrations in the river sediments were higher than that of the mean Tafna bedrock, which itself was in the range of other carbonate rocks. The highest REE concentrations were observed at the I5 and DamB stations, and the lowest ones in the upper Tafna (T1, T3) were outliers compared to the other stations. The REE concentrations in sediments and the normalisation to PAAS were not
too dissimilar to those found in rivers draining mining waste (Delgado
et al., 2012) and were consistent with other sediments draining
car-bonates normalised to PAAS (Sebou River,Leleyter et al., 1999;
Gas-cogne Rivers,N’Guessan, 2008). However, the normalisation to local
bedrock (Figs. 2 and 3) particularly indicated a high LREE enrichment
and to a lesser extent an enrichment of MREE, and a strong fractiona-tion between LREE, MREE, and HREE. The influence of the bedrock composition on the REE pattern was thus obvious, indicating that PAAS was not convenient as a reference, since except for MREE, it over-estimated the sediment REE depletion. The normalisation pattern to local bedrock was indeed in agreement with the processes classically observed for river transport downstream and erosion (relative
im-poverishment of HREE) (Mao et al., 2014;Fiket et al., 2017). The LREE
Table 4
Concentrations of EDTA extractable REE (except Sm and La, Ce, and Nd in MG, which were below the detection limit) in Tafna River bed sediments (% of total content) from the sampling stations during two contrasting hydrological conditions (high water, HW, October 2014) and (low water, LW, June 2014).
2014 Station Extractable REE (μg.g−1)
La Ce Pr Nd Sm Eu Gd Tb Dy Ho Er Tm Yb Lu HW T1 1.40 3.70 0.46 1.95 - 0.10 0.46 0.07 0.33 0.06 0.15 0.02 0.11 0.02 T3 1.73 4.50 0.58 2.42 - 0.13 0.58 0.08 0.40 0.07 0.18 0.02 0.13 0.02 T5 0.80 1.80 0.25 1.04 - 0.06 0.24 0.04 0.17 0.03 0.08 0.01 0.05 0.01 MG 0.93 2.20 0.31 1.29 - 0.07 0.31 0.05 0.22 0.04 0.10 0.01 0.08 0.01 M2 0.71 1.77 0.22 0.92 - 0.05 0.23 0.03 0.16 0.03 0.07 0.01 0.05 0.01 T6 0.77 1.54 0.24 0.97 - 0.06 0.25 0.04 0.18 0.03 0.08 0.01 0.06 0.01 T7 1.26 3.12 0.41 1.69 - 0.10 0.41 0.06 0.31 0.06 0.15 0.02 0.11 0.02 S2 0.85 2.02 0.28 1.16 - 0.06 0.27 0.04 0.19 0.03 0.09 0.01 0.07 0.01 I5 1.08 2.60 0.37 1.54 - 0.09 0.36 0.05 0.26 0.05 0.12 0.02 0.09 0.01 T8 1.14 2.73 0.39 1.69 - 0.09 0.40 0.06 0.28 0.05 0.13 0.02 0.09 0.01 LW T1 1.54 3.81 0.50 2.15 - 0.12 0.50 0.07 0.35 0.06 0.16 0.02 0.11 0.02 T3 0.92 2.13 0.29 1.24 - 0.07 0.30 0.04 0.21 0.04 0.10 0.01 0.07 0.01 T5 1.20 3.00 0.38 1.63 - 0.09 0.40 0.06 0.29 0.05 0.13 0.02 0.09 0.01 MG - - 0.26 - - 0.07 0.31 0.04 0.22 0.04 0.10 0.01 0.07 0.01 M2 0.78 3.64 0.24 1.00 - 0.06 0.26 0.04 0.18 0.03 0.08 0.01 0.06 0.01 T6 0.84 1.76 0.26 1.12 - 0.06 0.28 0.04 0.20 0.04 0.09 0.01 0.07 0.01 T7 1.28 3.16 0.41 1.73 - 0.10 0.42 0.06 0.31 0.06 0.15 0.02 0.11 0.02 S2 0.93 2.30 0.31 1.31 - 0.07 0.31 0.05 0.23 0.04 0.10 0.01 0.08 0.01 I5 1.23 2.96 0.41 1.74 - 0.10 0.41 0.06 0.30 0.05 0.14 0.02 0.10 0.01 T8 0.93 2.17 0.31 1.30 - 0.07 0.30 0.04 0.22 0.04 0.10 0.01 0.07 0.01
The Eu anomaly was higher during LW than HW for all stations, except for T1, T5, T6, and T7 during the 2015 campaign. For HW conditions, this anomaly was lower in 2014 than in 2015 (except for MG, S2, I5, and T8), whereas similar values were observed for the two years during
LW conditions, except for T5, T7, and T8. The Eun/Eun* in DamB was
similar to T8 (LW 2015) and higher than the DamS value.
Positive anomalies were also observed but to a lesser extent for
some other REE: Tb at T6 (Tbsed/Tbbedrock = 2.10; Fig. 3 B); Dy* at S2 in
high water in 2015 (Dysed/Dybedrock = 1.80; Fig. 3 B′); Ce* at M2 with a
value between 1.03 and 1.15 (Fig. 3 A, B, C; Eq. (2), except in HW 2014,
to a lesser extent at I5 with a value between 1.02 and 1.06 (Fig. 3 B′,
D′), and at the T7 station, it was only detected in the high water
con-dition in 2014 (Ce* = 1.04; Fig. 3 D′); Yb* at T7 in HW in 2015
(Yb* = 1.61; Fig. 3 B’; Eq. (3), M2 in LW in 2015 (Yb* = 1.11; Fig. 3A),
and for most stations in LW in 2014 (Fig. 3 B, B′, C, C′); and Tb* at T6 in
HW in 2015 (Fig. 3 B’). The positive Gd anomaly (Eq. (4) detected at
stations MG and S2 ranged between 1.11 and 1.19 (Gdanth 10% and
16%; Eq. (7) and 1.13 and 1.19 (Gdanth 12% and 16%), respectively.
3.4. EDTA extractable fraction of REE
The concentrations of REE extracted from the sediment with EDTA
mentioned in Table 4 were in the order LREE > MREE > HREE.
The pattern of the percentage of extractable REE fractions relatively to the total concentration in sediments was calculated for the two
hy-drological conditions in 2014 (Fig. 4 A, B), and the ratio of these
per-centage is presented in Fig. 4 C, D for the various stations. Note that due
to analytical detection limit, Sm is not mentioned.
Considering all the stations, the percentage of REE in the non-re-sidual fraction was rather low (mean 8% of the total REE, range 0–17%)
and quite homogenous (Fig. 4 A, B). The ranges of the extractable
fraction did not have the same ranking as the concentrations, and was as follows: MREE > HREE > LREE. This is consistent with the
ob-servations of Leleyter et al. (1999) for the carbonated Sebou River. The
highest values were observed during high flow conditions (except for LREE for some stations: T1, T6, T7, and I5). The highest proportion of extractable REE was found for T3 and T1 (Tafna upstream stations,
Fig. 1), whereas the lowest was found for MG, T6, and M2 (Fig. 4 A, B). The proportion of extractable LREE varied (0–13%), with Nd being the most extractable element (13%) in T3, except Ce in M2, and La the
and MREE enrichments were rather homogenous and not very high,
which argued for a main natural weathering origin (McLennan and
Taylor, 2012). However, the strongest LREE and MREE enrichment for some stations might not exclude a contribution by local pollution (Borrego et al., 2004;Brito et al., 2018). An MREE enrichment has also
been observed in a case of acid mine drainage contribution (Delgado
et al., 2012). In the Tafna basin, no obvious mining exploration has been performed, however, some dust from Moroccan mines has been identified to be a source of atmospheric lead deposition in the basin (Benabdelkader et al., 2018). Therefore, the origin of REE from dust deposition in river sediments and the products of soil erosion could not be completely excluded.
On the whole, without considering hydrological conditions, the stations with the highest LREE and MREE enrichment were MG, M2,
DamB, T5, and I5 (Fig. 3), and these stations also exhibited an
en-richment of other metals, such as Pb, Cd, and Zn (Benabdelkader et al.,
2018). Surprisingly, T6, which was a highly enriched station for most
metals, presented only a mean REE enrichment compared to other stations, whereas station MG (in LW in 2014 and HW in 2015) was one
of the most enriched station for LREE and MREE (Fig. 3B, C). For MG,
this was consistent with the high contamination of Pb, Zn, Cu, and Cd already evidenced as a result of the Maghnia industrial unit upstream (Taleb et al., 2004;Benabdelkader et al., 2018, Fig. 1) and potential
agricultural inputs (namely phosphate fertilisers,Benabdelkader et al.,
2018). The variety of industries drained by the tributaries Ourdeffou
and El Abbes, with the punctual discharge of ores processing and wastewater into the watercourses, could be one of the origins of LREE and MREE enrichment, as already mentioned for other metals (Benabdelkader et al., 2018).
The similar REE pattern and enrichment intensity of REE in M2 and MG sediments (even slightly lower for M2, except in LW in 2014;
Fig. 3), was expected, since station M2 receives the inputs of MG (Figs. 3and1).
The very high enrichment of LREE and MREE in LW at the T5
sta-tion (Fig. 3A, C) and in both hydrological conditions at I5 (to a lesser
extent in LW 2015;Fig. 3A’) was questionable. Indeed, these stations
were located close to the CERTAF and CERAMIR ceramic factories, respectively, with the punctual release of industrial wastes into the rivers. The ceramic factories used kaolin, which is enriched in REE and
Yttrium (Höhn et al., 2014), and also in pure colourants containing REE
(Preinfalk and Morteani, 1989). The high concentration of Y observed
in I5 and T5 (Table 2), as well as the highest proportion of
anthro-pogenic Gd (between 16 and 18%,Di Leonardo et al., 2009), also
ar-gues for an anthropogenic contribution. This latter finding might
ori-ginate from the release of waste waters (Bau et al., 2006;Mao et al.,
2014), especially in the rivers flowing through densely populated and
industrial areas (Tlemcen, Maghnia, and Oujda). Indeed, the increase in Gd in river water downstream of big cities was shown to come in particular from hospital medical waste due to its use as a contrasting
agent in magnetic resonance imaging (Bau and Dulski, 1996; Moller
et al., 2002), which is the case in Tlemcen and Maghnia (the regional centre for this instrumentation). As already mentioned, Gd was known
to be transported mainly as a dissolved fraction in river water (Kulaksiz
and Bau, 2013); the low enrichment attested to the low affinity of the solid fraction. Nevertheless, particularly at the stations receiving med-ical waste (MG and S2), the positive anomalies and the Gd anthropic contribution (reaching up to 16%) attest to some anthropic influence, in
agreement with other authors (Di Leonardo et al., 2009). The high S
and P concentrations, especially in MG and S2 (5.75 and 2.98 mg g−1,
1.51 and 2.27 mg g−1respectively, SMTable 1), might also attest to
domestic waste influences or phosphogypsum waste contamination (Tranchida et al., 2011), which could have favoured Gd release. Otherwise, on the whole, sediment contamination by Gd remains low, as indicated by the rather low concentrations compared to those of
other stream sediments from Europe (Migaszewski and Gałuszka,
2015). If any anthropogenic waste inputs contribute Gd, there is only a
Fig. 4. A, B: Ratio between EDTA extractable REE (except Sm) and the total REE in the Tafna River bed sediments (expressed in %) during low water conditions (low
water, LW, June 2014) and high water conditions (HW, October 2014), respectively; C, D: ratio of the above ratio (high water condition to low water condition) for right hand tributaries and major course stations of the Tafna, respectively. Ext. Means extractable. Note that due to the analytical detection limit, Sm was not detected. 18 i 16
...
~14 !! 12 ~10...
~ 8:I
,.
6 ,, 4 I! ] 2 0!
2.2 ::, I! 2 0I::;
1.8j
1.6...
~ 1.4 a 1.2~ 1
~ 0.8 A(LW) La Ce Pr Nd Sm Eu Gd Tb Dy Ho Er Tm Yb Lu (C).__.,__._.
...
·--~ 0.6 4----,---,---.--,---,---,--,----,-....---,---,----,--,---, La Ce Pr Nd Sm Eu Gd Tb Dy Ho Er Tm Yb Lu :i18 !;°16 ; 14"
i9
12 ';:;10...
.. 8 Jl ~ 6 ti 4!
... 2 0 + Tl + T3 + TS MG • M2 • T6 + T7 + S2 + 15 • TS La Ce Pr Nd Sm Eu Gd Tb Dy Ho Er Tm Yb Lu La Ce Pr Nd Sm Eu Gd Tb Dy Ho Er Tm Yb Lucomposition of DamB than the tributary Mouillah (M2 station), as has
already been observed for other trace metals (Benabdelkader et al.,
2018).
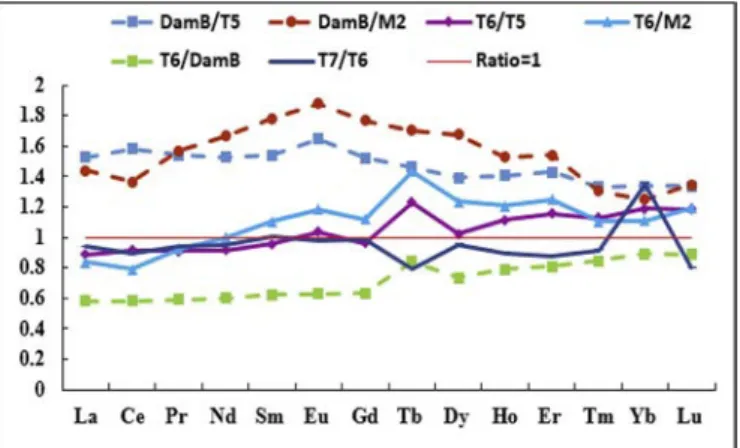
The ratio between the REE concentrations in sediments from the T6 station (located immediately downstream) and those of the upper sta-tions (T5, M2) and DamB evidenced the influence of DamB on the REE pattern downstream the Tafna river. The three patterns of ratios in-dicated a slight (T6/T5 and T6/M2) and a more pronounced depletion of LREE (T6/DamB). For MREE and HREE, the enrichment patterns relative to LREE were consistent, however, although T6 was strongly depleted compared to DamB, it was enriched compared to T5 and M2 (ratio > 1). Consistent with the above observations, the enrichment was more pronounced relatively to M2. We can thus conclude that DamB accumulated LREE, and to a lesser extent MREE, originating in the upper Tafna (T5). Moreover, M2 was diluted by the inputs of the Mouillah basin. This contributed to the maintenance of the REE com-position after the Dam, not too far from the upper river inputs (ratios T6/T5 and T6/M2 around 1). In contrast, from Gd to Lu (and even Sm and Eu for the T6/M2 ratio), a ratio higher than 1 -or increasing in a similar way (likeT6/DamB compared with T6/T5 and T6/M2)- in-dicated a removal of REE (by mechanical erosion or resuspension with dam releases) previously accumulated in the dam, which enriched the station T6 downstream. This has already been observed for other dams
for REE (LREE retention, as noticed byAudry et al., 2004) or other
metals (Varol, 2013;Coynel et al., 2007;Benabdelkader et al., 2018).
Finally, downstream the Tafna course, the ratio between the T7 and T6 stations indicated that the LREE did not change (ratio close to 1, no extra inputs), contrary to the HREE (from Tb to Lu), which continued to be depleted following erosion processes. The positive ratio (T6/DamB,
T6/T5, and T6/M2,Fig. 5) indicated that the enrichment observed for
Tb at the T6 station (§3.3.2) did not resulting from an input from the dam and the upstream stations (T5 or M2). Without any other identified sources, a local contamination by electronic waste between DamB and the T6 station cannot be excluded, since, for example, Tb was used in the manufacture of screen and electronic products. The negative anomaly at T7 indicates a dilution downstream. In contrast, the en-richment of Yb observed at T7, as indicated by the positive T7/T6 ratio (Fig. 5), might be due to fertiliser inputs (Kabata-Pendias, 2010), as already mentioned for the Cd and Cu enrichment in this area (Benabdelkader et al., 2018).
Without any hydrological breakdown along rivers, the (La/Yb)n
ratio usually increases from upstream to downstream (Mao et al.,
2014), illustrating the relative depletion of HREE. In the Tafna basin,
this was the case in the upper Tafna, however, DamB led to a decrease
in this ratio (as shown at T6, except in HW in 2014,Table 3). LREE
Fig. 5. REE concentration ratios between downstream and upstream stations of
the Tafna River surrounded by DamB (seeFig. 1) in HW conditions (February 2015). DamB sediment was sampled in low water conditions. Dotted line in-dicates the stations influenced by (or influencing) the dam.
weak retention of Gd in river bed sediment of the whole basin. Nevertheless, during the high flow conditions, the (La/Yb)n ratio
was always higher than 2 (Table 3) for this group of stations (MG, M2,
T5, and I5) which indicates that erosion was probably one of the main causes of the relative LREE and MREE enrichment. These stations are the outlets of the upper main Tafna course and of the main tributaries,
where the slopes and erosion rates are the most important (Tidjani
et al., 2006; Bouanani et al., 2013). The absence of a significant cor-relation between the REE and most of the trace metals having an
an-thropogenic source (Benabdelkader et al., 2018) suggests that the high
erosion processes occurring in the upper catchments might have “hidden” the pollution influence, as already mentioned for the I5
sta-tion for metals (Benabdelkader et al., 2018). Only Ni and Co were
strongly linearly related with LREE and MREE (the lighter the REE, the stronger the relationship) in the 2014 campaigns, suggesting a common
control by clay minerals (McLennan, 2001).
The positive Eu-anomaly observed at all Tafna sampling sites (Table 3, Fig. 3) could be associated with the presence of feldspars (Ramesh et al., 2000; Aubert et al., 2001; Sow et al., 2018), which were
enriched in the Tafna basin (Boukhedimi, 2009). The highest
Eu-anomaly most frequently observed at upstream stations (Table 3) was
consistent with the presence of less weathered material such as feldspar (Nyakairu and Koeberl, 2001), and was also related to the higher
car-bonate content than downstream (SM Table 1). Indeed, the Eu anomaly
in sedimentary rocks was usually interpreted as being inherited from
igneous source rocks (Taylor and Mclennan, 1985; McLennan and
Taylor, 1991; Awwiller, 1994) and has already been observed in
car-bonated sediments (Leleyter et al., 1999).
The Ce* anomaly observed at M2, and to a lesser extent I5, could be explained by a complexation by Mn and Fe oxides at these stations (Braun et al., 1990; see SM Table 1) in combination with a higher pH (data not shown, Benabdelkader, PhD in process) and carbonate con-tent. Moreover, during low water conditions in 2014, at M2, a high alga
development associated with a silty/clayey sediment (Table 1) could
also explain the Ce trapped in sediment.
The elevated concentration of LREE indicates their affinity for solid
fractions (Ramesh et al., 1999). However, for all stations, the MREE and
the lightest HREE (Eu, Gd, Tb, Dy, and Ho, Fig. 4, B) were the most
extractable REE i.e. the fraction of REE leachable from sediments, re-lative to the total REE. Indeed, the most extractable REE rere-lative to the total content (i.e. MREE and HREE) were generally complexed with Fe–Mn oxides, contrary to LREE, which were preferentially bound to
the residue (see Leleyter et al., 1999 for a similar carbonated basin).
Despite a weak enrichment, the highest REE extractability detected for
the upper Tafna stations (T1, T3; Figs. 3 and 4 A, B) compared to M2,
MG, and T6 was consistent with previous results for metal trace
ele-ments (Benabdelkader et al., 2018). It confirmed the idea that the
ex-tractability of these elements was not proportionally linked to their relative enrichment. Consequently, the stations with a high proportion of extractable REE (i.e. potentially available) might be more hazardous in term of metal accessibility for living organisms than more con-taminated ones with less extractable metals.
4.2. Influence of anthropogenic and natural factors on REE patterns along the river
4.2.1. Role of dams
The ratio between the REE concentrations in the sediments from downstream and upstream stations surrounded by DamB and the two river inputs to the dam (T5 and M2) enabled us to evaluate the role of
the dam in REE distributions (Fig. 5). This was not possible to do for
DamS. The ratios (DamB/M2 and DamB/T5) indicated the most en-riched pattern (in decreasing order, except La, Ce and Yb) in the dam mainly for MREE and LREE, and particularly for MREE in the dam re-latively to the M2 station. Consequently, despite a lower discharge, the upper Tafna River (T5 station) had a greater influence o n t he REE
2 1.8 1.6 1.4 1.2 I 0.8 0.6 0.4 0.2 0 - -DamB/TS - -DamB/M2 - T6/TS - -T6/DamB - -T7/T6 - -Ratio=l
..
A',..,
A"'.,a....
-.._
-e,a- _._ .,..._ • - r ...,._ -. - •