HAL Id: hal-00330287
https://hal.archives-ouvertes.fr/hal-00330287
Submitted on 14 Oct 2008HAL is a multi-disciplinary open access
archive for the deposit and dissemination of sci-entific research documents, whether they are pub-lished or not. The documents may come from teaching and research institutions in France or abroad, or from public or private research centers.
L’archive ouverte pluridisciplinaire HAL, est destinée au dépôt et à la diffusion de documents scientifiques de niveau recherche, publiés ou non, émanant des établissements d’enseignement et de recherche français ou étrangers, des laboratoires publics ou privés.
A mathematical modelling of bloom of the
coccolithophore Emiliania huxleyi in a mesocosm
experiment
P. Joassin, B. Delille, K. Soetaert, A. V. Borges, L. Chou, A. Engel,
Jean-Pierre Gattuso, J. Harlay, U. Riebesell, K. Suykens, et al.
To cite this version:
P. Joassin, B. Delille, K. Soetaert, A. V. Borges, L. Chou, et al.. A mathematical modelling of bloom of the coccolithophore Emiliania huxleyi in a mesocosm experiment. Biogeosciences Discussions, European Geosciences Union, 2008, 5 (1), pp.787-840. �hal-00330287�
BGD
5, 787–840, 2008 Modelling of an Emiliania huxleyi bloom P. Joassin et al. Title Page Abstract Introduction Conclusions References Tables Figures ◭ ◮ ◭ ◮ Back Close Full Screen / EscPrinter-friendly Version Interactive Discussion
EGU
Biogeosciences Discuss., 5, 787–840, 2008 www.biogeosciences-discuss.net/5/787/2008/ © Author(s) 2008. This work is licensed under a Creative Commons License.
Biogeosciences Discussions
Biogeosciences Discussions is the access reviewed discussion forum of Biogeosciences
A mathematical modelling of bloom of the
coccolithophore Emiliania huxleyi in a
mesocosm experiment
P. Joassin1, B. Delille2, K. Soetaert3, A. V. Borges2, L. Chou4, A. Engel5, J.-P. Gattuso7, J. Harlay4, U. Riebesell6, K. Suykens2, and M. Gregoire1
1
Oceanology Laboratory, Interfacultary Centre for Marine Research, Universite de Liege, Institut de Chimie (B6c), 4000 Liege, Belgium
2
Unite d’Oceanographie Chimique, Interfacultary Centre for Marine Research, Universite de Liege, Institut de Physique (B5), 4000 Liege, Belgium
3
Centre for Estuarine and Marine Ecology, Netherlands Institute of Ecology, Yerseke, The Netherlands
4
Laboratoire d’Oceanographie Chimique et Geochimie des Eaux, Universite Libre de Bruxelles, Campus de la Plaine, Brussels, Belgium
5
Alfred Wegener Institute for Polar and Marine Research, Bremerhaven, Germany 6
Leibniz Institute of Marine Sciences, IFM-GEOMAR, Kiel, Germany 7
Observatoire oceanologique de Villefranche-sur-mer, Villefranche-sur-mer, France
Received: 6 December 2007 – Accepted: 20 December 2007 – Published: 15 February 2008 Correspondence to: P. Joassin (pascal.joassin@student.ulg.ac.be)
BGD
5, 787–840, 2008 Modelling of an Emiliania huxleyi bloom P. Joassin et al. Title Page Abstract Introduction Conclusions References Tables Figures ◭ ◮ ◭ ◮ Back Close Full Screen / EscPrinter-friendly Version Interactive Discussion
Abstract
A dynamic model has been developed to represent biogeochemical variables and pro-cesses observed during a bloom of Emiliania huxleyi coccolithophore. This bloom was induced in a mesocosm experiment during which the ecosystem development was fol-lowed over a period of 23-days through changes in various biogeochemical parameters
5
such as inorganic nutrients (nitrate, ammonium and phosphate), total alkalinity (TA), dissolved inorganic carbon (DIC), partial pressure of CO2 (pCO2), dissolved oxygen (O2), photosynthetic pigments, particulate organic carbon (POC), dissolved organic carbon (DOC), Transparent Exopolymer Particles (TEP), primary production, and cal-cification. This dynamic model is based on unbalanced algal growth and balanced
10
bacterial growth. In order to adequately reproduce the observations, the model in-cludes an explicit description of phosphorus cycling, calcification, TEP production and an enhanced mortality due to viral lysis. The model represented carbon, nitrogen and phosphorus fluxes observed in the mesocosms. Modelled profiles of algal biomass and final concentrations of DIC and nutrients are in agreement with the experimental
15
observations.
1 Introduction
Past records reveal the presence of the coccolithophore species Emiliania huxleyi for 270 000 years. During the last 70 000 years, it has become the most numerically im-portant species of coccolithophores. It is abundant in most seas except for the Arctic
20
and Antarctic oceans (Paasche,2002). In addition to its worldwide distribution and its permanency through the ages, Emiliania huxleyi populations are remarkable in their capacity to produce large blooms. A significant action on DIC dynamics during these blooms is related to primary production. As calcifying algae, coccolithophores also affect DIC dynamics through the mobilisation of carbonate ions during the production
25
BGD
5, 787–840, 2008 Modelling of an Emiliania huxleyi bloom P. Joassin et al. Title Page Abstract Introduction Conclusions References Tables Figures ◭ ◮ ◭ ◮ Back Close Full Screen / EscPrinter-friendly Version Interactive Discussion
EGU
production of Transparent Exopolymer Particles (TEP), an organic substance mainly composed of carbon, recalcitrant to microbial regeneration, and supporting aggregat-ing properties (Passow,2002). The convergence of these biological features renders
Emiliania huxleyi one of the major actors involved in the oceanic carbon export (
Buiten-huis et al.,2001). For these reasons, the understanding of the impact of the Emiliania
5
huxleyi blooms on oceanic biogeochemical cycles, and their ecological interactions
with other trophic levels, has been a challenge for several investigations or mathemati-cal descriptions.
Models including coccolithophores usually focus on one particular aspect of their bio-geochemical interactions with the environment and promote an isolated approach for
10
each specific process like calcification or TEP production. For instance, the calcification process during nitrate sustained blooms has been represented by several models to appreciate the balance between photosynthesis and calcification concerning the mobi-lization of atmospheric carbon dioxide (Buitenhuis et al.,2001). Other models focus on particular processes involving fixed organic carbon such as carbon overconsumption
15
(Obernosterer and Herndl,1995). These models require an accurate simulation of the
microbial loop as well as a fine representation of the uptakes of DIC and the limiting nutrients (Van Den Meersche et al.,2004). The cellular exudates resulting from the car-bon overconsumption may induce or support chemical transformations leading to the production of TEP (Engel et al.,2004b). Some models describe this TEP production
20
through the coagulation of acidic polysaccharides issued from the cellular exudates, as applied inSchartau et al.(2007) for a mesocosm diatom bloom. In the frame of larger biogeochemical scales, some models investigate the implication of coccolithophores in a global ecological environment where other phytoplankton species are also repre-sented. These models focus on factors triggering blooms and/or controlling seasonal
25
cycles as applied inAksnes et al.(1994),Tyrrell and Taylor(1996),Merico et al.(2004)
andOguz and Merico (2006). They emphasize nitrogen cycling and the dynamics of
coccolithophores is modelled using a balanced growth model. This approach does not allow simulating temporal decoupling between carbon and nitrogen uptakes. However,
BGD
5, 787–840, 2008 Modelling of an Emiliania huxleyi bloom P. Joassin et al. Title Page Abstract Introduction Conclusions References Tables Figures ◭ ◮ ◭ ◮ Back Close Full Screen / EscPrinter-friendly Version Interactive Discussion this decoupling has been reported in declining bloom conditions (Engel et al.,2005)
and is manifested in the temporal accumulation of carbon-rich dissolved organic mat-ter causing the formation of carbon-rich TEP (Alldredge et al.,1995). Such a process was observed during the bloom of Emiliania huxleyi studied in the mesocosm experi-ment conducted in 2001 in Bergen (Delille et al.,2005;Engel et al.,2005). In parallel, a
5
thorough representation of calcification requires the simulation of carbon flows through coccolithophores. Indeed, absorbed DIC must be correctly represented flowing through two pathways: one dedicated to biosynthesis and the other dedicated to the calcite production. Therefore the above-mentioned mathematical models do not address the impact of coccolithophores development, and in particular that of calcification, on the
10
DIC cycling.
Our modelling approach combines the unbalanced algal growth and the balanced bacterial growth model developed and calibrated byVan Den Meersche et al.(2004). This model has been extended to represent coccolithophores specific processes such as calcification and TEP production linked to carbon overconsumption, reproducing
15
carbon fluxes from DIC to microbial loop. Our model explicitly simulates carbon (in-organic and (in-organic) cycling including the exchanges of CO2 at the air-sea interface and DIC chemistry. TEP production is added as described inEngel et al.(2004b). The present model has been developed and calibrated to represent the Emiliania huxleyi blooms occurring in the framework of the Bergen mesocosm experiment. Observations
20
performed during this experiment offer an ideal data set for calibration and validation. Consequently, the present model considers also contingencies affecting typically an enclosed space experiment such as the potential action of viruses. Enhanced algal mortality due to viral lysis is therefore explicitly represented. The model offers a tool to simulate the development and the interactions between biogeochemical processes
25
that characterize a bloom of Emiliania huxleyi: unbalanced algal growth leading to de-pletion of the limiting nutrient, exudation of carbon-rich dissolved organic matter (DOM) under nutrient limitation and production of TEP induced by accumulation of carbon-rich DOM exudates.
BGD
5, 787–840, 2008 Modelling of an Emiliania huxleyi bloom P. Joassin et al. Title Page Abstract Introduction Conclusions References Tables Figures ◭ ◮ ◭ ◮ Back Close Full Screen / EscPrinter-friendly Version Interactive Discussion
EGU
2 Materials and methods
2.1 Experimental data set
The study was conducted between 31 May and 25 June 2001 at the European Union Large Scale Facility (LSF) in Bergen, Norway. Nine outdoor polyethylene enclosures (≃11 m3, 4.5 m water depth) were moored to a raft in the Raunefjorden (60.38◦N,
5
5.28◦E; for more details, see Engel et al., 2005, and Delille et al., 2005). The en-closures were filled with unfiltered, nutrient-poor, post-bloom fjord water, which was pumped from 2 m depth adjacent to the raft. The enclosures were covered by gas-tight tents which allowed for 95% light transmission of the complete spectrum of sunlight, including ultraviolet A and B. The physical context (temperature, light irradiance, water
10
turbulence) was similar in the nine mesocosms. As the impact of increased atmo-spheric pCO2 on calcification and primary production were the main objects of the experimental protocol, the pCO2inside the mesocosm enclosed atmosphere was fixed by an active aerating system. The triplicate mesocosm treatments represented glacial (≃190 parts per million by volume (ppmV) CO2), present (≃410 ppmV CO2), and future
15
(≃710 ppmV CO2) conditions of atmospheric pCO2. After initial fertilization with nitrate and phosphate, a bloom dominated by the coccolithophore Emiliania huxleyi occurred simultaneously in all of the nine mesocosms; it was monitored over a 23-day period. The present model has been calibrated to represent present-day pCO2 values and thus validation is based on the measurements made in 3 mesocosms (numbered n◦4,
20
5, 6) as summarized in Fig.1. All parameters were measured daily except for the light irradiance which had an hourly temporal resolution.
BGD
5, 787–840, 2008 Modelling of an Emiliania huxleyi bloom P. Joassin et al. Title Page Abstract Introduction Conclusions References Tables Figures ◭ ◮ ◭ ◮ Back Close Full Screen / EscPrinter-friendly Version Interactive Discussion 2.2 Mathematical model
2.2.1 Model structure
Because all the mesocosms were actively mixed during the experiment (see Delille
et al.,2005, andEngel et al.,2005, for details), vertical gradients were neglected and a zero-dimensional model was implemented. The grazing of phytoplankton cells by
5
zooplankton was negligible in comparison to the export of phytoplankton cells due to sedimentation. Consequently, the model does not include any grazing term. The de-velopment of phytoplankton groups other than Emiliania huxleyi only occurred in the beginning of the experiment in some mesocosms but had minor impact on nutrients consumption (Delille et al., 2005; Engel et al., 2005). Therefore, the model will
ig-10
nore the representation of groups other than Emiliania huxleyi. The model describes carbon, nitrogen, and phosphorus cycling through Emiliania huxleyi biomass and the microbial loop which includes bacterial community and dissolved organic matter. The dissolved organic matter (in carbon, nitrogen and phosphorus) has been divided into two pools: labile and semi-labile. Nitrate and ammonium are explicitly modelled as well
15
as phosphate in order to assess which nutrient, phosphorus or nitrogen, was the most limiting in the experiment. The explicit modelling of phosphorus cycling is also required to take into account the well-known capacity of coccolithophores to consume dissolved organic phosphorus (DOP) as well as phosphates (Shaked et al.,2006;Xu et al.,2006;
Zondervan,2007). Total alkalinity and DIC (gathering aqueous carbon dioxide,
carbon-20
ates and bicarbonates ions) are explicitly represented in order to obtain a description of DIC cycling and to assess the impact of calcification on total alkalinity. The model computes the pH and the concentration of dissolved CO2from DIC and total alkalinity. Two forms of particulate inorganic carbon (PIC) are considered: the calcite pool made of attached coccoliths and the free calcite composed of detached coccoliths.
Addition-25
ally, the model includes TEP dynamics similar as represented inSchartau et al.(2007) for a mesocosm diatom bloom. Dissolved oxygen has been added as a validation variable for primary production (oxygen measurements have been recorded during the
BGD
5, 787–840, 2008 Modelling of an Emiliania huxleyi bloom P. Joassin et al. Title Page Abstract Introduction Conclusions References Tables Figures ◭ ◮ ◭ ◮ Back Close Full Screen / EscPrinter-friendly Version Interactive Discussion
EGU
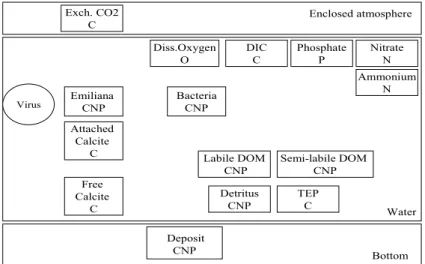
entire experiment). The model also includes a representation of photosynthetic pig-ments whose concentration is computed using the cellular C:N molar ratio. Finally, the model includes a marginal compartment: the pool of Emiliania huxleyi pathogen viruses, which however does not sustain a mass flux with the other biogeochemical variables of the model. A schematic representation of the ecosystem model,
indicat-5
ing the different compartments related to the state variables, is shown in Fig.2. The model state variables, the ordinary variables, the state equations, the equations of the biogeochemical processes, and the parameters used in these formulations are listed respectively in Tables A1, A2, A3, A4 and A5 of Appendix A.
2.2.2 Description of biogeochemical processes
10
Mathematical modelling of most biogeochemical processes is based on the model of
Van Den Meersche et al.(2004) but includes a number of extensions to describe the
specific dynamics of coccolithophores. In this subsection, we first describe the basis of the model and then we focus on the mathematical formulation of specific processes linked to coccolithophore properties observed during the experiment (e.g. TEP
forma-15
tion, viral attack). The algal growth, given as changes in carbon and nitrogen, is de-scribed following an unbalanced growth model. The cellular C:N molar ratio is variable within a certain range (see parameters MinNCr and MaxNCr in Table A5), affecting nu-trients uptakes as inTett and Wilson(2000). Algal carbon uptake is limited by dissolved CO2 (see Eqs.R24andR26 in Table A4). Uptake of nitrate is inhibited following
am-20
monium availability (see Eqs.R29andR32), so ammonium is consumed preferentially to nitrate. On the other hand, algae may release ammonium in case of a too low C:N cellular ratio. Phosphate uptake is computed from total nitrogen uptake following the cellular P:N Redfield ratio (see Eq.R43). The present model considers the possibility for coccolithophores to use DOP (see Eqs.R38andR39). Labile and semi-labile
frac-25
tions of DOP are both usable by algae. As suggested inShaked et al.(2006) andXu
et al. (2006), DIP is assimilated preferentially to DOP (labile and semi-labile) using an inhibition factor (see Eq.R37). Algal respiration consists of two terms: metabolic
res-BGD
5, 787–840, 2008 Modelling of an Emiliania huxleyi bloom P. Joassin et al. Title Page Abstract Introduction Conclusions References Tables Figures ◭ ◮ ◭ ◮ Back Close Full Screen / EscPrinter-friendly Version Interactive Discussion piration and the respiration required by cellular activity, proportional to carbon uptake
(see Eq.R28). Algal mortality, caused by cellular senescence, is described propor-tional to algal biomass with a constant rate. As inAnderson and Williams(1998) and
inVan Den Meersche et al.(2004), bacteria dynamics is formulated using a balanced
growth model in carbon and nitrogen. Bacteria growth is only sustained by the labile
5
fraction of DOM gathering labile DOC, labile DON, and labile DOP. Bacteria are also able to take up ammonium and phosphate. If the C:N or C:P ratios of assimilated labile DOM are lower than the cellular ratios prevailing for bacteria, the excessive nitrogen or phosphorus will be released as ammonium or phosphate. If the C:N or C:P ratios of assimilated labile DOM are higher than the bacterial cellular ratios, a supplementary
10
consumption of nitrogen or phosphorus will occur as ammonium or phosphate (see Eqs.R91toR96).
DIC and total alkalinity are state variables in the model. Concentrations of carbon species (CO2, HCO3−, CO
32−) as well as pH are then calculated using dissociation constants afterMehrbach et al. (1973) and determined following Millero (1995). The
15
thermodynamic solubility of CO2at the prevailing temperature and salinity is calculated afterMillero(1995).
Carbon exudation and TEP formation. Coccolithophores species release DOM. Part
of that cellular release is a passive leakage consisting of labile material and is mod-elled as inVan Den Meersche et al.(2004). The second fraction of cellular release is
20
linked to carbon overconsumption and consists of high molecular weight substances (polysaccharides). This release of organic carbon takes into account that not all the products of photosynthesis can be used by the Emiliania huxleyi cells in the case of low nitrogen or phosphorus nutrients availability conditions. As described inEngel et al.
(2004b), TEP production is strongly linked to extracellular release of DOC: a fraction
25
of which consists of acidic polysaccharides, which are able to coagulate, making the precursor of TEP. Coagulation of acidic polysaccharides from the DOC extracellular release is modelled following equations adapted from the parameterisation of PCHO coagulation as inSchartau et al.(2007).
BGD
5, 787–840, 2008 Modelling of an Emiliania huxleyi bloom P. Joassin et al. Title Page Abstract Introduction Conclusions References Tables Figures ◭ ◮ ◭ ◮ Back Close Full Screen / EscPrinter-friendly Version Interactive Discussion
EGU
Calcification. The model will assume that the calcifying activity of the Emiliania hux-leyi cells, as observed during the Bergen mesocosm experiment, is a structural cellular
requirement induced by the normal growth of the cell. Following this assumption, the model describes the calcification as the combination of two processes. The major cal-cifying process is based on the primary production. In addition, the model considers
5
also a minor process which is based on the algal carbon biomass (see Eq.R56).
Viral lysis. In addition to natural lysis of algal cells, the model also considers
ly-sis caused by viruses. The incidence of interaction between cellular hosts and viral agents is strongly increased when experiments are conducted in enclosed spaces like mesocosms. Observations performed in this experiment showed indeed that in
sev-10
eral mesocosms blooms were suddenly terminated in parallel with a sharp increase of viral abundance (Delille et al., 2005). Viruses have no self-capabilities of multipli-cation. They are only produced by infected algal cells and spread when infected cells die. Hence, the model considers that the growth of the viral population is driven by the fraction of algal mortality caused by viral infection. A constant spread-out coefficient is
15
applied to compute the number of new born viruses spread out by dying infected cells
(Jacquet et al.,2002). Once produced, the viruses keep their infecting potential for a
limited time. The structural proteins of viruses are continuously degenerating, making an infection impossible after a certain time. This process is similar to a mortality af-fecting the viral population at a constant rate. The viral induced mortality of algal cells
20
appears as a complementary term added to the natural mortality of Emiliania huxleyi cells. The mortality caused by viruses is determined by a threshold function based on the proximity between viral agents and algal hosts (see Eqs.R65andR66).
Sedimentation. Despite of a permanent mixing applied to the mesocosms during
the whole experiment, deposits were observed at the bottom of the bags. This was
25
corroborated by the computation of the carbon losses in the water column (Delille et al.,
2005). Although it is a zero-dimensional model, a constant sinking speed is applied with three specific values for algal cells, TEP, and detritus (see Table A5). The sinking speeds are obtained from literature for algal cells (Paasche,2002) or calibrated from
BGD
5, 787–840, 2008 Modelling of an Emiliania huxleyi bloom P. Joassin et al. Title Page Abstract Introduction Conclusions References Tables Figures ◭ ◮ ◭ ◮ Back Close Full Screen / EscPrinter-friendly Version Interactive Discussion the experimental measurements for TEP and detritus. Although TEP does not sink
gravitationally (Engel and Schartau, 1999), it becomes attached to sinking particles and settle within aggregates. On the other hand, the model does not consider the degradation of the organic sediment, i.e. there is no flux from deposit to water column. At the experimental time scale of one month, the dynamics of CO2 is mostly
deter-5
mined by biological processes rather than by gas exchange at the air-sea interface. The absence of wind stress on the water surface reduces the diffusion rate across the air-sea interface. The model however represents air-water CO2molecular diffusion followingWanninkhof(1992). The same diffusion model is also applied to oxygen. 2.2.3 Model implementation
10
Initial conditions were directly obtained from the experimental data: bacterial enumera-tion, DOC, POC, TEP, total alkalinity, DIC, enclosed atmosphere pCO2, dissolved oxy-gen, nitrate, ammonium, phosphate, algal enumeration, and virus enumeration. Initial detritus biomass is computed as the difference between the measured POC and the sum of TEP and algal biomass. Algal carbon biomass and nitrogen bacterial biomass
15
were converted from their respective enumeration using conversion factors listed in Table A5. Biomass of Emiliania huxleyi is obtained from the measured abundances assuming that one cell of Emiliania huxleyi contains 2.7×10⁻⁹mmolC. This conversion factor was determined from experimental measurements of POC and coccolithophores abundance and is in agreement with literature values (Merico et al.,2004). This
con-20
version factor is used during the entire simulation in order to convert the measured abundance in carbon biomass. The Redfield C:N ratio of 6.6 was used to compute the initial nitrogen content for coccolithophores, detritus and DOM. The initial N:P molar ratio for inorganic nutrients was 17. The initial DOC concentration was measured but no information was available concerning its partition into the three pools of labile,
semi-25
labile, and refractory DOC. In order to correctly represent bacterial dynamics, most of the DOC (85%) belongs to the refractory pool. For the partitioning between the labile and semi-labile fractions, we considered that only 15% of the non-refractory DOC is
BGD
5, 787–840, 2008 Modelling of an Emiliania huxleyi bloom P. Joassin et al. Title Page Abstract Introduction Conclusions References Tables Figures ◭ ◮ ◭ ◮ Back Close Full Screen / EscPrinter-friendly Version Interactive Discussion
EGU
labile, which is within the range of values found in the literature (Carlson et al.,2002). The same initial partitioning was also applied to the dissolved organic nitrogen pool. The initial value of free calcite is determined from data on particular inorganic carbon (PIC) from which we subtracted the initial amount of attached calcite computed from the initial algal carbon biomass using the molar calcite to cellular carbon ratio of 0.61
5
given byPaasche(2002).
Irradiance and other forcing functions. Measurements concerning the
photosynthet-ically active radiation (PAR) are available each hour for each mesocosm at the surface and at the bottom. In this zero dimensional model, a depth-averaged light availability for photosynthesis was computed as follows: using an exponentially decreasing intensity
10
formulation for the light penetration in the water column and the concentrations of PIC, POC and chlorophyll, we computed vertical profiles of light and we calibrated three specific extinction coefficients for these three types of suspended matter. A depth-averaged value of light is then able to be calculated at each time when PAR data are also available. Other forcing variables, measured hourly during the experiment, are
15
temperature, salinity and pCO2in the enclosed atmosphere.
The model was implemented in FEMME (Flexible Environment for Mathematically Modelling the Environment, http://www.nioo.knaw.nl/CEME/FEMME/, Soetaert et al.,
2002). This is a Fortran-based simulation environment designed for implementing, solving and analyzing mathematical models in ecology. It contains many functional
20
units, such as a diversity of integration routines, steady-state solvers, fitting routines, input and output facilities and allows running Monte Carlo or sensitivity analyzes or performing food web analyzes. The biogeochemical model is integrated over the whole duration of the experiment (i.e. 23 days). Time stepping is done using explicit Euler integration with a time step of 14 min. Model result output is given each hour.
25
2.2.4 Model calibration
In order to fine-tune model parameters, model calibration and sensitivity analyses were performed according to the iterative procedure as explained inBrun et al.(2002). The
BGD
5, 787–840, 2008 Modelling of an Emiliania huxleyi bloom P. Joassin et al. Title Page Abstract Introduction Conclusions References Tables Figures ◭ ◮ ◭ ◮ Back Close Full Screen / EscPrinter-friendly Version Interactive Discussion most sensitive parameters are selected first and then the near-linear dependence
(so-called co-linearity) of all possible parameter combinations is calculated. Parameter sets for which co-linearity exceeds the value of 20 cannot be jointly estimated from the data, i.e. because the effect of changing one parameter may be overruled by changes in the other parameters (Brun et al., 2002). A parameter set that is identifiable from
5
the available data is then selected; these parameters are calibrated and the proce-dure is repeated till convergence (seeBrun et al.,2002, for more details). We use the Levenberg-Marquardt calibration algorithm to minimize the sum of squared residuals between model and data (Soetaert et al.,2002). Range of variation for parameters val-ues was fixed to 20% or 50% of their nominal valval-ues following the uncertainty affecting
10
the parameter. Resulting from this analysis, the model was found to be most sensitive to the inorganic carbon phytoplankton uptake rate (CuptakeR), the light half-saturation constant (KsPAR), the Emiliania huxleyi sinking speed (PHYsinkS), and the thresh-old value of virus-cell proximity (VirDensTh). Afterwards, the parameter set (consisting of: NituptakeR, CaCrPHY, pDONtoMono, bactMortR, VirMortmax, PhyMortR, VirDensth,
15
PhySinkS, CuptakeR, and KsPAR) was calibrated using the automatic procedure. The results of the method led to calibrated values which remain well within ranges reported from the literature or other models.
As mentioned above, although the mesocosms were continuously mixed, sedimen-tation of coccolithophores, detritus and TEP was observed during the experiment.
Re-20
sulting from the automatic calibration, a sinking speed of 0.0147 m h−1 was applied to the coccolithophore cells, which is close to the value of 0.011 proposed byPaasche
(2002) in his review on coccolithophores. For detritus and TEP, the sinking speed was linearly fitted in order to reproduce experimental observations of the carbon losses in the mesocosms. The rates are 0.02 m h−1and 0.002 m h−1respectively for detritus and
25
TEP.
Parameters specific to Emiliania huxleyi dynamics. Maximum carbon uptake rate
in Emiliania huxleyi is fixed by calibration to 0.114 h−1 at 20◦C, which is in the range of values found in the literature between 0.09 and 0.12 h−1 (Paasche, 2002; Merico
BGD
5, 787–840, 2008 Modelling of an Emiliania huxleyi bloom P. Joassin et al. Title Page Abstract Introduction Conclusions References Tables Figures ◭ ◮ ◭ ◮ Back Close Full Screen / EscPrinter-friendly Version Interactive Discussion
EGU
et al., 2004). A growth limitation factor based on CO2 concentration was introduced with a half-saturation constant of 2 mmolC m−3. The parameter controlling the calcifi-cation based on the primary production is the molar calcite to organic carbon ratio of a mature algal cell (noted CaCrPHY) and the parameter controlling the fraction of the calcification based on the algal carbon biomass is the constant rate noted BasalCalcif.
5
That parameter BasalCalcif is obtained by fitting during the nutrient depleted phase of the bloom, giving a value of 0.001 h−1. The molar calcite to organic carbon ratio of a mature algal cell is obtained from the experimental data with a value of 0.58 which is similar to values found in the literature (Paasche, 2002). Table 1 summarizes the parameters specific to Emiliania huxleyi in the framework of the Bergen mesoscosm
10
experiment and used in the model.
3 Results
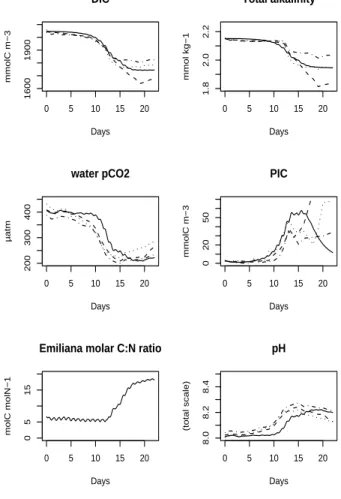
Figures3,4and5compare model results with available observations collected in the three mesocosms exposed to present-day atmospheric pCO2. In all graphs, the model outputs and the observed temporal developments are superimposed.
15
The simulated Emiliania huxleyi carbon biomass is in the range of observations re-lated to the three mesocosm blooms during the whole experiment (Fig.3): modelled and experimental data are fairly well time-phased, starting to increase on day 9, reach-ing the same maximum value of carbon biomass around day 14, and then decreasreach-ing sharply due to viral lysis on day 16. The simulated chlorophyll concentration is also in
20
the range of the observations although it peaks one day earlier. The model does not reproduce the observed slight increase of the chlorophyll concentration during the first 5 days of the experiment. As suggested byDelille et al.(2005), the mesocosm is ini-tially dominated by Synechococcus and the nanoflagellate Micromonas which produce a slight efflorescence.
25
The modelled nitrate and phosphate are also in accordance with the experimen-tal observations (Fig.3). At the beginning of the experiment, ammonium decreased
BGD
5, 787–840, 2008 Modelling of an Emiliania huxleyi bloom P. Joassin et al. Title Page Abstract Introduction Conclusions References Tables Figures ◭ ◮ ◭ ◮ Back Close Full Screen / EscPrinter-friendly Version Interactive Discussion rapidly to a quasi null concentration and the absence of ammonium prevailed till the
end of the experiment. The rate of ammonium production by bacterial remineralisa-tion being largely below the growth of algal nitrogen biomass, it appears that the main source of nitrogen for coccolithophores is nitrate. Around day 12, nitrate is almost en-tirely consumed by coccolithophores: nitrogen becomes the limiting element for algal
5
growth. On the other hand, phosphate remains available during the entire experiment. Observed bacterial nitrogen biomasses are fairly constant but the model tends to slightly overestimate their values (Fig.3). Bacterial growth depends highly on the avail-ability of labile organic matter. The sharp growth of algal population during the bloom increased the amount of DOC in the water column causing a high rise of modelled
bac-10
terial biomass. Observations show a quasi constant value for the DOC concentration (Fig.5). In accordance to the observations, the modelled DOC concentration remains fairly constant until day 15, but afterwards becomes increasing and tends to diverge from the observations at the end of the experiment.
The model reproduces the multiplication of virus as well as the increased mortality
15
affecting coccolithophores due to viral lysis very well (Fig. 3). In accordance to the observations, the decline of the coccolithophore bloom is characterised by a sudden and sharp decrease of the cellular carbon biomass. The modelled viral abundance also remains fairly well within the range of the observations. Viruses are quasi undetectable until the increased cellular population establishes a sufficient contact rate between
20
cellular hosts and viral agents. That contact rate is then able to cause an epidemic multiplication of viruses. The model represents rightly that mechanism, leaving the viral abundance at a quasi zero level until algal biomass reaches a certain value. The viral abundance then rises suddenly, reaching the measured high values. The moment of the viral multiplication is well time-phased with the observations: the maximum viral
25
abundance corresponds fairly well to the observations. As soon as the cellular density drops due to the enhanced mortality, the viral abundance also decreases quickly. The presence of viruses in the water environment is restricted to a narrow period, between day 15 and day 18. However, in the model, viruses are maintained slightly longer
BGD
5, 787–840, 2008 Modelling of an Emiliania huxleyi bloom P. Joassin et al. Title Page Abstract Introduction Conclusions References Tables Figures ◭ ◮ ◭ ◮ Back Close Full Screen / EscPrinter-friendly Version Interactive Discussion
EGU
compared to the observations.
The modelled DIC concentration remains within the range of values observed during the mesocosm experiment (Fig.4). The decrease of DIC is clearly enhanced around day 10 which is the beginning of the coccolithophore bloom. The model shows indeed that the slope of the DIC time-series shifts from a value of −0.09 mmolC m−3h−1before
5
day 10 to a value of −0.38 mmolC m−3h−1after day 10. The model succeeds fairly well to represent the final concentration of DIC, after the termination of the bloom. The time-phasing between the modelled and observed DIC concentrations exhibits however a slight sidestep. Indeed, within the pre-bloom phase of the experiment, the modelled DIC remains too high compared to the observations. On the other hand, during the
10
senescent phase of the bloom, the modelled DIC is maintained decreasing while the observed DIC concentrations are slightly rising.
The evolution of total alkalinity reflects the calcifying activity by coccolithophores (Fig.4). The drop of modelled total alkalinity remains within the range of the experi-mental observations even if there is a great variation between the mesocosms. The
15
model respects also the phases of the calcification process. Total alkalinity decreases from day 11, indicating the onset of calcification. Hence, the calcifying activity starts thus with a delay of at least one day after the onset of the coccolithophore bloom. The observed calcification is only sustained during the growing phase of the bloom and is not maintained in the senescent phase, even if the coccolithophore biomass
20
remains significant at that moment (80 mmolC m−3 at day 16). The modelled calcifi-cation seems to start slightly too soon in comparison with the observations. However during the bloom phase, the modelled calcification appears well time-phased with the experimental observations as it is shown by the total alkalinity outputs. The intensity of the modelled calcification is also correctly represented, as the simulated total alkalinity
25
values tend to reach the same final stable level as the observed data.
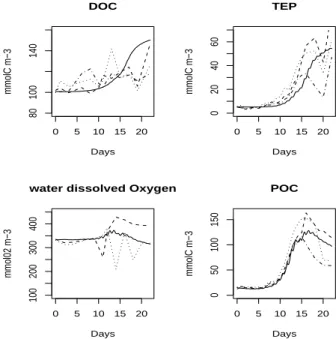
The model reproduces the global evolution of TEP concentration correctly (Fig.5). From the beginning of the experiment until day 10, TEP concentration increases slightly but continuously, doubling its value. In fact, the main production of TEP is sustained
BGD
5, 787–840, 2008 Modelling of an Emiliania huxleyi bloom P. Joassin et al. Title Page Abstract Introduction Conclusions References Tables Figures ◭ ◮ ◭ ◮ Back Close Full Screen / EscPrinter-friendly Version Interactive Discussion during the senescent phase of the bloom, as confirmed by the observations when
ni-trogen is limiting. Modelled TEP reaches a similar final concentration to that observed in the experiment. However, modelled and observed TEP exhibit different behaviours at the end of the experiment. In the observations, TEP concentration increases with a high rate till a maximum value after which the concentration drops rapidly. In contrast,
5
the model represents the TEP production increasing with a lower rate than the one observed and without a dropping phase at the end of the simulation. Measurements concerning dissolved oxygen were only available for mesocosms 4 and 5 (Fig.5). The observations show a large variability for the concentration of the dissolved oxygen, especially during the bloom phase, while the model shows a relative stable
concentra-10
tion which remains well within the range of the observations. The modelled dissolved oxygen is characterised by a significant increase between day 10 and day 15, notable also in the observations, reflecting the enhanced photosynthetic activity of the bloom phase. The modelled POC comprises the variables of algal carbon biomass, carbon detritus matter, and TEP (Fig.5). The modelled POC follows the overall tendency of
15
the observed time-series which shows a sharp increase after day 10 and a slight de-crease from day 16 till the end of the experiment. The final value of POC is not null, in the observations as well as in the model, attesting that most of the particulate matter remains in the water column at the end of the experiment.
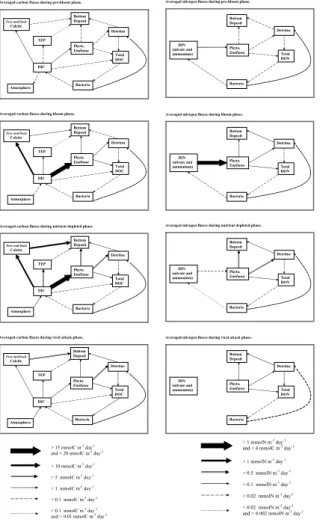
Analyse of modelled carbon and nitrogen fluxes. The development of Emiliania
hux-20
leyi can be divided into four phases. The first phase (pre-bloom) extends from day 4
until a significant increase of the Emiliania huxleyi biomass is reached on day 8. The second phase (bloom) extends from day 8 until the complete depletion of nitrate (day 12). The nutrient depleted phase extends from day 12 until the collapse of the
Emil-iania huxleyi biomass due to the enhanced mortality caused by viral attack (day 16).
25
The last phase extends from day 16 until the end of virus multiplication (day 21) caused by an excessively low algal density. Carbon and nitrogen fluxes between the modelled compartments, averaged over these four phases, have been calculated and are shown in Fig. 6. It must be noted that the Emiliania huxleyi box represents only its cellular
BGD
5, 787–840, 2008 Modelling of an Emiliania huxleyi bloom P. Joassin et al. Title Page Abstract Introduction Conclusions References Tables Figures ◭ ◮ ◭ ◮ Back Close Full Screen / EscPrinter-friendly Version Interactive Discussion
EGU
organic carbon, without including the attached calcite. That is why there is a direct flux from DIC to the calcite box, gathering free as well as attached calcite. A direct flux is also represented between DIC and TEP because TEP originates from organic carbon not assimilated by the Emiliania huxleyi cells.
During the pre-bloom phase, carbon fluxes from DIC to calcite pools (free
5
and fixed) and to Emiliania huxleyi biomass remains at a very low level, around 2 mmolC m−3day−1. The modelled mesocosm environment behaves as a very slight CO2source as it is shown by the carbon flux directed from DIC towards the mesocosm atmosphere compartment. This may be caused by the bacterial respiration which has a larger influence on DIC dynamics than the algal growth during the pre-bloom phase.
10
This behavior characterises the pre-bloom phase while the mesocosms behave as a sink for CO2 during the rest of the experiment. During the pre-bloom phase, TEP pro-duction is almost absent. Nitrogen fluxes reflects the general pattern of carbon fluxes following the Redfield molar C:N ratio.
The bloom phase is notable by a sharp increase of the carbon fluxes from DIC to
cal-15
cite and the Emiliania huxleyi biomass compartments, at respective values of 11 and 18 mmolC m−3day−1. The mesocosm is now drawing CO
2 from the enclosed atmo-sphere with a flux of 1.1 mmolC m−2day−1. The intense growth of the Emiliania huxleyi population starts enhancing fluxes from Emiliania huxleyi biomass to the detritus and total DOC compartments. During this phase, the molar C:N ratio between flux from
20
DIN to algal nitrogen biomass and flux from DIC to algal carbon biomass reaches its lowest value (around 5.9).
Around day 12, nitrate is depleted and the Emiliania huxleyi growth shifts to limited nutrient conditions. The flux from DIN to algal nitrogen biomass decreases sharply while the flux from DIC to algal carbon biomass remains at a quasi unchanged level.
25
This transition phase from the previous situation suggests a decoupling between the uptakes of carbon and nitrogen, manifesting carbon overconsumption. The excretion of ammonium by bacteria has significantly decreased, caused by the increase of the DOM molar C:N ratio. This third phase is also notable by the increase of TEP
pro-BGD
5, 787–840, 2008 Modelling of an Emiliania huxleyi bloom P. Joassin et al. Title Page Abstract Introduction Conclusions References Tables Figures ◭ ◮ ◭ ◮ Back Close Full Screen / EscPrinter-friendly Version Interactive Discussion duction. The carbon flux between DIC and TEP compartments shifts from a value
of 1.8 during the bloom phase to a value of 6.2 mmolC m−3day−1 during this nutrient depleted phase. The flux from DIC to calcite slightly increased (passing from 11.2 to 11.9 mmolC m−3day−1) while the flux from DIC to Emiliania huxleyi biomass dropped from 18 to 16.9 mmolC m−3day−1. During this third phase, it must be noted that the
ex-5
port to sediment of carbon under calcite form has become superior to carbon exports under organic forms (phytoplankton sinking combined with detritus sinking) i.e. the PIC to POC rain ratio becomes larger than 1.
The sudden multiplication of viruses is responsible for a sharp decrease in the
Emil-iania huxleyi cell abundance which characterises the final phase of the experiment.
10
Nitrogen fluxes involving the DIN compartment are close to zero. The TEP production, driven by the coagulation kernel, remains an active cellular process but the reduction of the Emiliania huxleyi biomass lowers the intensity of the flux from DIC toward the TEP compartment. On the other hand, the enhanced algal mortality, caused by viruses, increases the carbon flux toward dead organic matter compartments, i.e. detritus and
15
DOC. Consequently, the final phase is characterised by an increase of the pool of DOC and a development of the microbial loop. Indeed, the flux between the DOC pool and the bacterial biomass increases by 300% shifting from 0.3 during the bloom phase to 1.0 mmolC m−3day−1during the final phase.
4 Discussion
20
4.1 Phytoplankton biomass
The model represents the Emiliania huxleyi carbon biomass as well as the consump-tion of the limiting nutrient, i.e. nitrate. As suggested by the evoluconsump-tion of cellular C:N ratio shown in Fig.4, an unbalanced growth model appears to be adapted to represent the development of Emiliania huxleyi. Indeed, the evolution of the Emiliania huxleyi
25
vary-BGD
5, 787–840, 2008 Modelling of an Emiliania huxleyi bloom P. Joassin et al. Title Page Abstract Introduction Conclusions References Tables Figures ◭ ◮ ◭ ◮ Back Close Full Screen / EscPrinter-friendly Version Interactive Discussion
EGU
ing cellular C:N ratio of the Emiliania huxleyi cells. Nitrogen being the limiting nutrient in all mesocosms, its depletion leads the cellular C:N ratio to a critical increase due to the continuation of the DIC uptake. In this unbalanced growth model, the DIC up-take is maintained until a maximum cellular C:N ratio is reached. This is confirmed by the observed time-series after the nitrate depletion: DIC continues to decrease with a
5
quasi unchanged rate and the algal abundance keeps increasing. During the senes-cent phase of the bloom, the model tends however to sustain the DIC decrease for too long compared to the observations. This may be caused by the slight delay of the onset of the modelled viral attack. Indeed, observations clearly show that the decline of the bloom is the result of an enhanced mortality caused by viral attack. Any delay
10
affecting the increase of viruses leads to an overestimation of the algal biomass as well as the primary production at the end of the experiment, and consequently an overesti-mation of the DIC consumption. After day 17, observed DIC concentrations appear to be increasing slightly, as well as the water pCO2, while the model does not reproduce this final increasing evolution of DIC. In fact, the model does not consider any
dia-15
genetic processes within the particulate organic matter accumulated in the sediment. Processes producing CO2, such as the bacterial respiration, are only represented in the mesocosm water column. This may explain the divergence in DIC concentration and water pCO2between the model and the observations from day 17 until the end of the experiment.
20
4.2 Calcification
The calcification causes the total alkalinity to drop induced by the incorporation of car-bonate ions into calcite. The drop of total alkalinity is well reproduced, from its initial level prior to the start of the bloom until its final level after the collapse of the algal biomass. Nevertheless, the timing of the total alkalinity drop is different between the
25
model and the observations. Indeed, in the mesocosm observations, the total alkalinity drop takes place within a narrow time window, starting significantly 3 days before the bloom peak (day 11) and ending one day after the bloom peak (day 15). In the
observa-BGD
5, 787–840, 2008 Modelling of an Emiliania huxleyi bloom P. Joassin et al. Title Page Abstract Introduction Conclusions References Tables Figures ◭ ◮ ◭ ◮ Back Close Full Screen / EscPrinter-friendly Version Interactive Discussion tions, the most of calcite production occurs during only 4 days, necessitating a very high
calcification rate. On the contrary, the modelled calcite production occurs over a larger time window: the decrease of total alkalinity starts on day 9 and does never completely stop. The model compensates this long calcifying duration by a calcite production rate which is lower than the observed one. The reason of the extended calcifying activity
5
is that the model considers the production of calcite by the coccolithophore cells as a need to build their coccospheres. This consideration leads to formulate the calcifi-cation with a major term which is proportional to primary production (computed as the difference between algal DIC uptake and respiration) using a constant calcite to cellular carbon molar ratio. As already said, the model may maintain that primary production
10
during the final phase of the bloom if the bloom is terminated by an extracellular event (e.g. viral attack) which suffers a delay. In parallel, the model adds to this structural calcification a second minor term proportional to biomass and proceeding also with a constant rate (see Eq. R56). This second term also contributes to a prolongation of calcification, even after the cessation of primary production.
15
In the model, the calcification dynamics appear mainly to be a function of the algal assimilation of carbon. Following this formulation, calcification is not extended dur-ing phases where algal cells are senescent or do not sustain any primary production. Figure7 compares two scenarios of the modelled calcification (through the decrease of total alkalinity) to the observed calcification when a) only proportional to the algal
20
biomass and b) mainly proportional to the algal primary production. On the one hand, a calcification only based on the algal biomass tends to be underestimated during the bloom phase. On the other hand, with that formulation based on the algal biomass, the production of calcite appears to be overestimated at the end of the nutrient depleted phase. Consequently, using a calcification rate proportional to algal biomass, as
usu-25
ally done in former models, the general shape of the total alkalinity time-series deviates from the observed data especially during intermediate and final phases of the bloom. These sidesteps become greatly moderated when the modelling of the calcification is mainly based on the primary production, allowing the model to better reproduce the
BGD
5, 787–840, 2008 Modelling of an Emiliania huxleyi bloom P. Joassin et al. Title Page Abstract Introduction Conclusions References Tables Figures ◭ ◮ ◭ ◮ Back Close Full Screen / EscPrinter-friendly Version Interactive Discussion
EGU
variation of DIC and total alkalinity induced by the calcifying activity. 4.3 DOC extracellular release and TEP
Modelled TEP and DOC time-series are both close to the observations (Fig.5). How-ever, around day 16, during the senescent phase of the bloom, modelled DOC shows a sudden rising inflexion. The model tends afterward to stabilize the DOC
concen-5
tration at a level slightly too high compared to the observations. Output shows that this event is mainly attributed to an increase of the semi-labile DOC pool during the senescent phase of the bloom. This could be due to the viral attack raising the al-gal mortality around day 16 and enhancing the increase of semi-labile DOC. As the different categories of DOC were not experimentally determined, it is difficult to
vali-10
date the specific labile and semi-labile DOC concentrations given by the model. At the end of the experiment (around day 20), the observations show a sudden decrease of TEP concentration, which is not reproduced by the model. That decreasing observed TEP may result of a massive aggregating event and an export of TEP by an enhanced sedimentation. However, the model does not consider any aggregating process
involv-15
ing TEP and applies a constant and specific sinking speed to all organic particulate compartments, i.e. Emiliania huxleyi cells, detritus as well as TEP.
The DOC produced by extracellular release acts as the precursor of TEP (see Eqs.R63 andR64). The TEP production dynamics is strongly determined by the dy-namics of DOC extracellular release. The evolution of TEP is therefore conditioned
20
by the accurate representation of DOC extracellular release dynamics. This feature emphasizes the importance of an accurate qualitative modelling of DOC extracellular release (time-phasing and general feature) as well as a representation of the absolute quantity of matter resulting by the process. The correctness of modelled DOC extracel-lular release may be appreciated by analyzing the percentage of extracelextracel-lular release
25
(PER), consisting of the ratio between the DOC excreted by phytoplankton (passive leakage and extracellular excretion) and the total organic carbon produced by phyto-plankton, as defined inAnderson and Williams(1998). Figure8 shows that values of
BGD
5, 787–840, 2008 Modelling of an Emiliania huxleyi bloom P. Joassin et al. Title Page Abstract Introduction Conclusions References Tables Figures ◭ ◮ ◭ ◮ Back Close Full Screen / EscPrinter-friendly Version Interactive Discussion PER are between 15 to 10 % in the beginning of the experiment, shifting to 30% during
the bloom and ranging between 60 to 70% at the end of the bloom. These values for modelled PER are in good agreement with values reported inVan Den Meersche et al.
(2004) and inAnderson and Williams(1998). 4.4 Virus
5
Prior to any viral action, the algal biomass is mainly determined by the difference be-tween the algal productivity and the constant algal mortality due to senescence. Ob-servations show that viruses are produced within a very narrow period of time (from day 15 to day 17). During this period, algal cells are still metabolically active which is attested by their capacity to be infected and to produce new born viruses (Fig.3).
10
From the observations, it appears that virus multiplication suddenly stops after day 18: the virus multiplication rate becomes inferior to the viral degeneracy rate. The reason is that the quantity of cellular hosts drops below the minimal value able to sustain the viral production required to compensate the high viral degeneration rate.
The model reproduces a viral abundance close to the observations and,
conse-15
quently, the effective collapse of the algal bloom at the end of the experiment. However, the viral degeneration rate seems slightly too low: newly produced viruses remain ac-tive in the environment for too long. This discrepancy does not really affect the collapse of modelled algal biomass but may cause a temporary unrealistic situation consisting of a massive persistence of viruses without enough cellular hosts. In any case, the
20
modelled virus multiplication remains very sensitive to the threshold value of proxim-ity between viruses and cellular hosts. If the threshold value is too high, the gain of mortality due to viral lysis will affect the algal population with a significant delay. That delay will compromise the cessation of the algal bloom at the right moment, causing an algal biomass maintained at its maximal level for an excessively long time. When
25
an experimentally induced bloom is terminated by a viral attack, the most important aspect of the modelled viral multiplication seems to be its correct time-phasing with the observations. Parallel to the proximity threshold value, the modelled virus
multi-BGD
5, 787–840, 2008 Modelling of an Emiliania huxleyi bloom P. Joassin et al. Title Page Abstract Introduction Conclusions References Tables Figures ◭ ◮ ◭ ◮ Back Close Full Screen / EscPrinter-friendly Version Interactive Discussion
EGU
plication is also very sensitive to the algal cell abundance. It must be noted that the triggering of viral multiplication is related to cell abundance and not to cellular biomass. The accuracy of the cellular carbon content coefficient appears to be very important to represent correctly the collapse of the bloom due to viral lysis. If the cellular carbon content coefficient is overestimated, with a similar algal biomass, the gain of mortality
5
due to viruses will be delayed and decreased.
5 Conclusions
Experimental blooms of Emiliania huxleyi and their associated biogeochemical pro-cesses were studied using a mechanistic model describing carbon, nitrogen and phos-phorus cycling. The aim of the study is to extend a mathematical model in order to
de-10
scribe the dynamics of Emiliania huxleyi as well as the associated specific processes such as calcification, DOP uptake, DOC extracellular release and the TEP formation. A comparison of model results with observations performed during the mesocosm ex-periment shows that the model correctly represents the overall pattern of the different variables as well as the dynamics of specialized biogeochemical activities such as
cal-15
cification and TEP production. The correct representation of these two processes is tightly dependent on an accurate representation of Emiliania huxleyi primary produc-tion and the DOC extracellular release. These processes are both determined by the variability of the molar C:N ratio of Emiliania huxleyi. Therefore, as already found in past studies (Tett and Wilson,2000), an unbalanced growth model in carbon and
nitro-20
gen was necessary to describe Emiliania huxleyi growth and the dynamics of DOC in agreement with the observations. The TEP dynamics have been found tightly linked to the organic carbon overproduction (Engel et al.,2004a). This process is represented through the extracellular release of DOC which produces the TEP precursors, able to coagulate as represented inSchartau et al. (2007). An accurate representation of
25
the calcification, as appraised by the decrease of total alkalinity and DIC, is obtained when formulating this process as a function of algal primary production rather than
BGD
5, 787–840, 2008 Modelling of an Emiliania huxleyi bloom P. Joassin et al. Title Page Abstract Introduction Conclusions References Tables Figures ◭ ◮ ◭ ◮ Back Close Full Screen / EscPrinter-friendly Version Interactive Discussion biomass as usually formulated in other models. With the combination of three major
cellular processes affecting DIC dynamics (primary production, organic carbon over-production, and calcification), the model is a convenient tool to study the implication of coccolithophore blooms in carbon export. The model finally succeeds in considering the interaction between phytoplankton cells and viruses as the most probable cause of
5
an enhanced mortality responsible of the termination of blooms in a confined environ-ment. An explicit representation of cellular lysis due to virus attack was satisfactorily tested in the model.
Acknowledgements. All the scientists involved in the Pelagic Ecosystem CO2 Enrichment
Study (PeECE) 2001 mescosm experiment are gratefully acknowledged for providing the data
10
used in the present work. The staff at the Marine Biological Station, University of Bergen, in particular T. Sorlie and A. Aadnesen, and the Bergen Marine Research infrastructure are gratefully acknowledged for support in mesocosm logistics. We would also like to thank all other participants of the PEACE-I experiment for their valuable technical assistance, data ac-quisition, and discussions. This contributes to the Belgian Federal Science Policy Office PEACE
15
project (SD/CS/03A), to the EU IP CARBOOCEAN (GOCE-511176) and to the EU IP SESAME (GOCE-2006-036949). Ma. Gregoire and A. V. Borges are research associates at the FNRS.
References
Aksnes, D. L., Egge, J. K., Rosland, R., and Heimdal, B. R.: Representation of Emiliania huxleyi in phytoplankton simulation models. A first approach, Sarsia, 79, 291–300, 1994. 789 20
Alldredge, A. L., Gotschalk, C., Passow, U., and Riebesell, U.: Mass aggregation of diatom blooms: Insights from a mesocosm study, Deep Sea Res. Part II, 42, 9–27, 1995.790
Anderson, T. R. and Williams, B.: Modelling the seasonal cycle of dissolved organic carbon at Station E1 in the English Channel, Estuar. Coast. Shelf S., 46, 93–109, 1998.794,807,808
Brun, R., Kuhni, M., Siegrist, H., Gujer, W., and Reichert, P.: Practical identitfiability of ASM2d
25
parameters systematic selection and tuning of parameter subsets, Water Res., 36, 4113– 4127, 2002. 797,798
atmo-BGD
5, 787–840, 2008 Modelling of an Emiliania huxleyi bloom P. Joassin et al. Title Page Abstract Introduction Conclusions References Tables Figures ◭ ◮ ◭ ◮ Back Close Full Screen / EscPrinter-friendly Version Interactive Discussion
EGU
spheric carbon dioxide : a field and mesocosm study derived simulation, Global Biogeochem. Cy., 15, 577–587, 2001. 789
Carlson, C., Giovanni, S., Hansell, D., Goldberg, S., Parsons, R., Otero, M., Vergin, K., and Wheeler, B.: Effect of nutrient amendments on bacterioplankton production, community structure, and DOC utilization in the northwestern Sargasso Sea, Aquat. Microb. Ecol., 30,
5
19–36, 2002. 797
Delille, B., Harlay, J., Zondervan, I., Jacquet, S., Chou, L., Wollast, R., Bellerby, R., Frankig-noulle, M., Vieira Borges, A., Riebesell, U., and Gattuso, J.-P.: Response of primary produc-tion and calcificaproduc-tion to changes of pCO2 during experimental blooms of the coccolithophorid Emiliania huxleyi, Global Biogeochem. Cy., 19, GB2023, doi:10.1029/2004GB002318, 2005.
10
790,791,792,795,799
Engel, A. and Schartau, M.: Influence of transparent exopolymer particles (TEP) on sinking velocity of Nitzschia closterium aggregates, Mar. Ecol.-Prog. Ser., 182, 69–76, 1999. 796
Engel, A., Delille, B., Jacquet, S., Riebesell, U., Rochelle-Newall, E., Terbrueggen, A., and Zondervan, I.: Transparent exopolymer particles and dissolved organic carbon production by
15
Emiliania huxleyi exposed to different CO2 concentrations: a mesocosm experiment, Aquat. Microb. Ecol., 34, 93–104, 2004a. 809
Engel, A., Thoms, S., Riebesell, U., Rochelle-Newall, E., and Zondervan, I.: Polysaccharide aggregation as a potential sink of marine dissolved organic carbon, Nature, 428, 929–932, doi:10.1038/nature02453, 2004b. 789,790,794
20
Engel, A., Zondervan, I., Aerts, K., Beaufort, L., Benthien, A., Chou, L., Delille, B., Gattuso, J.-P., Harlay, J., Heemann, C., Hoffmann, L., Jacquet, S., Nejstgaard, J., Pizay, M.-D., Rochelle-Newall, E., Schneider, U., and Terbrueggen, A., and Riebesell, U.: Testing the direct effect of CO2 Concentration on a bloom of the coccolithophorid Emiliania huxleyi in mesocosm experiments, Limnol. Oceanogr., 50(2), 493–507, 2005.790,791,792
25
Jacquet, S., Heldal, M., Iglesias-Rodriguez, D., Larsen, A., Wilson, W., and Bratbak, G.: Flow cytometric analysis of an Emiliana huxleyi bloom terminated by viral infection, Aquat. Microb. Ecol., 27, 111–124, 2002. 795
Mehrbach, C., Culberson, C., Hawley, J., and Pytkowicz, R.: Measurement of the apparent dis-sociation constants of carbonic acid in seawater at atmospheric pressure, Limnol. Oceanogr.,
30
18, 897–907, 1973.794
Merico, A., Tyrrell, T., Lessard, E., Oguz, T., Stabeno, P., Zeeman, S., and Whitledge, T.: Modelling phytoplankton succession on the Bering Sea shelf: role of the climate influences
BGD
5, 787–840, 2008 Modelling of an Emiliania huxleyi bloom P. Joassin et al. Title Page Abstract Introduction Conclusions References Tables Figures ◭ ◮ ◭ ◮ Back Close Full Screen / EscPrinter-friendly Version Interactive Discussion and trophic interactions in generating Emiliania huxleyi blooms 1997–2000, Deep-Sea Res.
Part I, 51(12), 1803–1826, doi:10.1016/j.dsr.2004.07.003, 2004. 789,796,798
Millero, F.: Thermodynamics of the carbon dioxide system in the oceans, Geochim. Cos-mochim. Ac., 59(4), 661–677, 1995.794
Obernosterer, I. and Herndl, G.: Phytoplankton extracellular release and bacterial growth:
de-5
pendence on inorganic N:P ratio, Mar. Ecol.-Prog. Ser., 116, 247–257, 1995. 789
Oguz, T. and Merico, A.: Factors controlling the summer Emiliania huxleyi bloom in the Black Sea: a modelling study, J. Marine Syst., 59, 173–188, doi:10.1016/j.jmarsys.2005.08.002, 2006. 789
Paasche, E.: Review of the coccolithophorid Emiliania huxleyi (Prymnesiophyceae), with a
par-10
ticular reference to growth, coccolith formation, and calcification-photosynthesis interactions, Phycologia, 40(6), 503–529, 2002. 788,795,797,798,799
Passow, U.: Transparent exopolymer particles (TEP) in aquatic environments, Prog. Oceanogr., 55, 287–333, 2002.789
Schartau, M., Engel, A., Schr ¨oter, J., Thoms, S., V ¨olker, C., and Wolf-Gladrow, D.: Modelling
15
carbon overconsumption and the formation of extracellular particulate organic carbon, Bio-geosciences, 4, 433–454, 2007,
http://www.biogeosciences.net/4/433/2007/. 789,792,794,809
Shaked, Y., Xu, Y., Leblanc, K., and Morel, F.: Zinc availability and alkaline phosphatase activity in Emiliania Huxleyi: Implications for Zn-P co-limitation in the ocean, Limnol. Oceanogr.,
20
51(1), 299–309, 2006. 792,793
Soetaert, K., deClippele, V., and Herman, P.: Femme, a flexible environment for mathematically modelling the environment, Ecol. Model., 151, 177–193, 2002. 797,798
Tett, P. and Wilson, H.: From biochemical to ecological models of marine phytoplankton, J. Marine Syst., 25, 431–446, 2000. 793,809
25
Tyrrell, T. and Taylor, A.: A modelling study of Emiliania huxleyi in the NE Atlantic, J. Marine Syst., 9, 83–112, 1996.789
Van Den Meersche, K., Middelburg, J., Soetaert, K., Van Rijswijk, P., Boschker, H., and Heip, C.: Carbon-nitrogen coupling and algal-bacterial interactions during an experimental bloom: modelling a 13C tracer experiment, Limnol. Oceanogr., 49, 862–878, 2004. 789,790,793,
30
794,808
Wanninkhof, R.: Relationship between wind speed and gas exchange over the ocean, J. Geo-phys. Res., 97, 7373–7382, 1992. 796
BGD
5, 787–840, 2008 Modelling of an Emiliania huxleyi bloom P. Joassin et al. Title Page Abstract Introduction Conclusions References Tables Figures ◭ ◮ ◭ ◮ Back Close Full Screen / EscPrinter-friendly Version Interactive Discussion
EGU
Xu, Y., Wahlund, T., Feng, L., Shaked, Y., and Morel, F.: A novel alkaline phosphatase in the coccolithophore Emiliania huxleyi (prymnesiophyceae) and its regulation by phosphorus, J. Phycol., 42(4), 835–844, 2006. 792,793
Zondervan, I.: The effects of light, macronutrients, trace metals and CO2on the production of calcium carbonate and organic carbon in coccolithophores, Deep-Sea Res. Part II, 54(5–7),
5
BGD
5, 787–840, 2008 Modelling of an Emiliania huxleyi bloom P. Joassin et al. Title Page Abstract Introduction Conclusions References Tables Figures ◭ ◮ ◭ ◮ Back Close Full Screen / EscPrinter-friendly Version Interactive Discussion
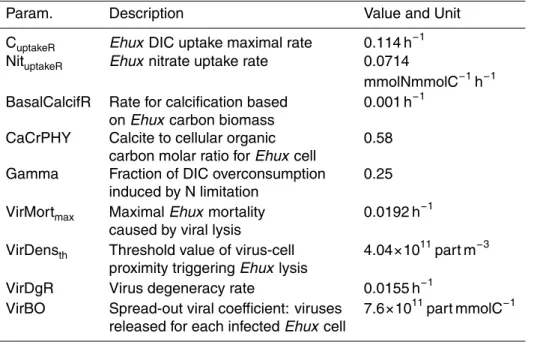
Table 1. List of parameters specific to Emiliania huxleyi dynamics.
Param. Description Value and Unit
CuptakeR Ehux DIC uptake maximal rate 0.114 h−1 NituptakeR Ehux nitrate uptake rate 0.0714
mmolNmmolC−1h−1 BasalCalcifR Rate for calcification based 0.001 h−1
on Ehux carbon biomass
CaCrPHY Calcite to cellular organic 0.58 carbon molar ratio for Ehux cell
Gamma Fraction of DIC overconsumption 0.25 induced by N limitation
VirMortmax Maximal Ehux mortality 0.0192 h−1 caused by viral lysis
VirDensth Threshold value of virus-cell 4.04×10¹¹part m−3 proximity triggering Ehux lysis
VirDgR Virus degeneracy rate 0.0155 h−1
VirBO Spread-out viral coefficient: viruses 7.6×10¹¹part mmolC−1 released for each infected Ehux cell
BGD
5, 787–840, 2008 Modelling of an Emiliania huxleyi bloom P. Joassin et al. Title Page Abstract Introduction Conclusions References Tables Figures ◭ ◮ ◭ ◮ Back Close Full Screen / EscPrinter-friendly Version Interactive Discussion
EGU
Appendix A
Mathematical formulation of the model
Table A1. List of biogeochemical state variables, description, and units.
State Variables Description Units
EmilianiaC Emiliania huxleyi carbon biomass mmolC m−3 EmilianiaN Emiliania huxleyi nitrogen biomass mmolN m−3 BacteriaN Bacterial nitrogen biomass mmolN m−3
Virus Virus enumeration particle m−3
TEP TEP concentration mmolC m−3
Nitrate Nitrate mmolN m−3
Ammonium Ammonium mmolN m−3
Phosphate Phosphate mmolP m−3
DIC Dissolved inorganic carbon mmolC m−3
Oxygen Dissolved oxygen concentration mmol02 m−3
Alkalinity Corrected alkalinity mmol m−3
LabDOC, SemDOC Labile and Semilabile dissolved organic carbon mmolC m−3 LabDON, SemDON Labile and Semilabile dissolved organic nitrogen mmolN m−3 LabDOP, SemDOP Labile and Semilabile dissolved organic phosphorus mmolP m−3 FixedCalc Attached calcite on coccolithophorid cells mmolC m−3