HAL Id: hal-00697491
https://hal.archives-ouvertes.fr/hal-00697491
Submitted on 4 Jan 2016
HAL is a multi-disciplinary open access
archive for the deposit and dissemination of
sci-entific research documents, whether they are
pub-lished or not. The documents may come from
teaching and research institutions in France or
abroad, or from public or private research centers.
L’archive ouverte pluridisciplinaire HAL, est
destinée au dépôt et à la diffusion de documents
scientifiques de niveau recherche, publiés ou non,
émanant des établissements d’enseignement et de
recherche français ou étrangers, des laboratoires
publics ou privés.
during the summer 2010 fires over western Russia
V. Huijnen, J. Flemming, J. W. Kaiser, A. Inness, J. Leitão, A. Heil, H. J.
Eskes, M. G. Schultz, A. Benedetti, Juliette Hadji-Lazaro, et al.
To cite this version:
V. Huijnen, J. Flemming, J. W. Kaiser, A. Inness, J. Leitão, et al.. Hindcast experiments of
tro-pospheric composition during the summer 2010 fires over western Russia. Atmospheric Chemistry
and Physics, European Geosciences Union, 2012, 12 (9), pp.4341-4364. �10.5194/acp-12-4341-2012�.
�hal-00697491�
www.atmos-chem-phys.net/12/4341/2012/ doi:10.5194/acp-12-4341-2012
© Author(s) 2012. CC Attribution 3.0 License.
Chemistry
and Physics
Hindcast experiments of tropospheric composition during the
summer 2010 fires over western Russia
V. Huijnen1, J. Flemming2, J. W. Kaiser2, A. Inness2, J. Leit˜ao3, A. Heil4, H. J. Eskes1, M. G. Schultz4, A. Benedetti2, J. Hadji-Lazaro5, G. Dufour6, and M. Eremenko6
1Royal Netherlands Meteorological Institute, De Bilt, The Netherlands
2European Centre for Medium-Range Weather Forecasts (ECMWF), Reading, UK 3Institute of Environmental Physics, University of Bremen, Bremen, Germany 4Forschungszentrum J¨ulich, Germany
5UPMC Univ. Paris 06; Universit´e Versailles St.-Quentin; CNRS/INSU, LATMOS-IPSL, Paris, France
6Laboratoire Inter-universitaire des Syst`emes Atmosph´eriques (LISA), UMR7583, CNRS/INSU – Universit´es Paris Est
Cr´eteil et Paris Diderot, Cr´eteil, France
Correspondence to: V. Huijnen (huijnen@knmi.nl)
Received: 10 November 2011 – Published in Atmos. Chem. Phys. Discuss.: 5 December 2011 Revised: 5 April 2012 – Accepted: 1 May 2012 – Published: 15 May 2012
Abstract. The severe wildfires in western Russia during
July–August 2010 coincided with a strong heat wave and led to large emissions of aerosols and trace gases such as carbon monoxide (CO), hydrocarbons and nitrogen oxides into the troposphere. This extreme event is used to evaluate the ability of the global MACC (Monitoring Atmospheric Composition and Climate) atmospheric composition forecasting system to provide analyses of large-scale pollution episodes and to test the respective influence of a priori emission information and data assimilation on the results. Daily 4-day hindcasts were conducted using assimilated aerosol optical depth (AOD), CO, nitrogen dioxide (NO2) and ozone (O3) data from a
range of satellite instruments. Daily fire emissions were used from the Global Fire Assimilation System (GFAS) version 1.0, derived from satellite fire radiative power retrievals.
The impact of accurate wildfire emissions is dominant on the composition in the boundary layer, whereas the assimi-lation system influences concentrations throughout the tro-posphere, reflecting the vertical sensitivity of the satellite instruments. The application of the daily fire emissions re-duces the area-average mean bias by 63 % (for CO), 60 % (O3) and 75 % (NO2) during the first 24 h with respect to
independent satellite observations, compared to a reference simulation with a multi-annual mean climatology of biomass burning emissions. When initial tracer concentrations are fur-ther constrained by data assimilation, biases are reduced by
87, 67 and 90 %. The forecast accuracy, quantified by the mean bias up to 96 h lead time, was best for all compounds when using both the GFAS emissions and assimilation. The model simulations suggest an indirect positive impact of O3
and CO assimilation on hindcasts of NO2via changes in the
oxidizing capacity.
However, the quality of local hindcasts was strongly de-pendent on the assumptions made for forecasted fire emis-sions. This was well visible from a relatively poor forecast accuracy quantified by the root mean square error, as well as the temporal correlation with respect to ground-based CO total column data and AOD. This calls for a more advanced method to forecast fire emissions than the currently adopted persistency approach.
The combined analysis of fire radiative power observa-tions, multiple trace gas and aerosol satellite observaobserva-tions, as provided by the MACC system, results in a detailed quanti-tative description of the impact of major fires on atmospheric composition, and demonstrate the capabilities for the real-time analysis and forecasts of large-scale fire events.
1 Introduction
In summer 2010, western Russia experienced a long at-mospheric blocking period (Matsueda, 2011, Dole et al., 2011) resulting in a strong heat wave, which started around
27 June and lasted until 14 August. Within a region of 1000×1000 km2 around Moscow, temperatures were ap-proximately 5–10◦C warmer and relative humidity was 20– 40 % lower than normal (Dole et al., 2011; Witte et al., 2011). The combination of high temperatures and drought made the vegetation vulnerable to fires, including the peat soil deposits that are common in this region. The Moderate Resolution Imaging Spectroradiometer (MODIS) instrument observed increased intensities of fire radiative power (FRP) over west-ern Russia from 20 July onwards, and these fires resulted in periods of high pollution levels in Moscow and its vicinity. The combination of hot temperatures and pollutants emitted from the fires was estimated to have led to a significant in-crease in deaths in Moscow (van Donkelaar et al., 2011).
A range of observations were used in various studies to characterize the tropospheric composition during this episode, including in-situ data for fine and coarse aerosol mass (PM2.5 and PM10, van Donkelaar et al., 2011), aerosol
optical thickness (Chubarova et al., 2012) ozone (O3) and
carbon monoxide (CO) (Konovalov et al., 2011; Elansky et al., 2011), CO total columns (Yurganov et al., 2011), as well as space-based information of CO total columns from Atmo-spheric Infrared Sounder (AIRS), and aerosol optical depth (AOD) and single-scattering albedo from Ozone Monitoring Instrument (OMI) (Witte et al., 2011; Mei et al., 2011).
In addition, it had been shown before that fire episodes can be analyzed by the Infrared Atmospheric Sounding Interfer-ometer (IASI) CO (Turquety et al., 2009) as well as nitrogen dioxide (NO2) and formaldehyde (HCHO) observations from
the OMI and Scanning Imaging Absorption SpectroMeter for Atmospheric ChartographY (SCIAMACHY) instruments (e.g., Mebust et al., 2011; Stavrakou et al., 2009). Model studies assessing estimates of emissions for CO (Konovalov et al., 2011, Yurganov et al., 2011, Fokeeva et al., 2011), and aerosol (van Donkelaar et al., 2011; Kaiser et al., 2012) have been reported for the 2010 Russian fires.
The pollution levels by aerosol, CO and O3 in Moscow
varied greatly during the period, both due to changing wind directions, and due to variations in fire emissions. Mete-orological conditions during a heat wave are well known to affect tropospheric composition (Ord´o˜nez et al., 2010). Changes in land surface parameters can alter dry deposition over vegetation (Vautard et al., 2005), and biogenic emis-sions (Lee et al., 2006, Solberg et al., 2008). Apart from these direct effects, trace gas concentrations vary due to perturba-tions of the chemical production and loss rates (e.g., Duncan et al., 2003). Additionally, depending on the optical proper-ties of emitted aerosol, O3and NO2photolysis rates can be
reduced (Real et al., 2007).
All these factors demand a comprehensive modeling framework in order to produce a realistic analysis and fore-cast of all aspects influencing tropospheric composition. This includes the use of data assimilation of meteorology and chemical composition, as well as accurate time- and space
resolved near real-time (NRT) emission estimates (Hodzic et al., 2007, Menut and Bessagnet, 2010).
Several systems exist that aim to combine various obser-vational data sources to obtain a complete and consistent view of the atmospheric composition. In the United States, an assimilation system for atmospheric composition is devel-oped at the National Aeronautics and Space Administration (NASA)/Global Modeling and Assimilation Office (GMAO; see http://gmao.gsfc.nasa.gov). Also the National Oceanic and Atmospheric Administration (NOAA)/National Weather Service (NWS) in collaboration with the US Environmen-tal Protection Agency (EPA) developed a data assimilation system that is used for operational air quality forecasting. Other examples of chemical data assimilation strategies are described in Sandu and Chai (2011).
In this context the MACC (Monitoring Atmospheric Composition and Climate, http://www.gmes-atmosphere.eu) project is a European initiative to achieve a complete and consistent view of the atmospheric composition, and to establish connections between chemical composition and weather forecasts, which in future may improve weather forecasts (Zhang, 2008; Grell and Baklanov, 2011).
In MACC, analyses and forecasts of atmospheric compo-sition are routinely produced based on the coupled system CTM-IFS (Chemistry Transport Model – Integrated Forecast System, Flemming et al., 2009), extended with an aerosol model within the IFS (Morcrette et al., 2009, Benedetti et al., 2009). This data assimilation system makes use of analyses of both meteorology and chemical composition (Hollingsworth et al., 2008). Thus, it is able to monitor vari-ations in chemical composition due to varying meteorology, such as episodes of increased ozone levels caused by heat waves (Ord´o˜nez et al., 2010), or the onset of the ozone hole (Flemming et al., 2011).
The impact of fire emissions on atmospheric composition is long recognized (e.g., Duncan et al., 2003). Various sys-tems for the generation of up-to-date, or even NRT global fire emission estimates have been reported (van der Werf et al., 2010; Wiedinmyer et al., 2010). Chemical composition in fire plumes is assessed using a range of satellite instru-ments as well as model results from various systems, some of them including chemical data assimilation (Verma et al., 2009; Dupont et al., 2012; Val Martin et al., 2006; Real et al., 2007). Uncertainties in fire inventories on the modeling of atmospheric composition, e.g., Williams et al. (2012), and long-range transport (Miller et al., 2011; McMillan et al., 2010; Elguindi et al., 2010) have previously been quantified. Within MACC, a NRT daily fire emission estimate based on FRP observations from MODIS was developed: the Global Fire Assimilation System (GFAS, Kaiser et al., 2012). In this study we assess the capability of the MACC system using NRT fire emission estimates to forecast chemical com-position a few days in advance. These forecasts are relevant to serve as boundary conditions to regional air quality mod-els, as distant emissions can potentially influence air quality
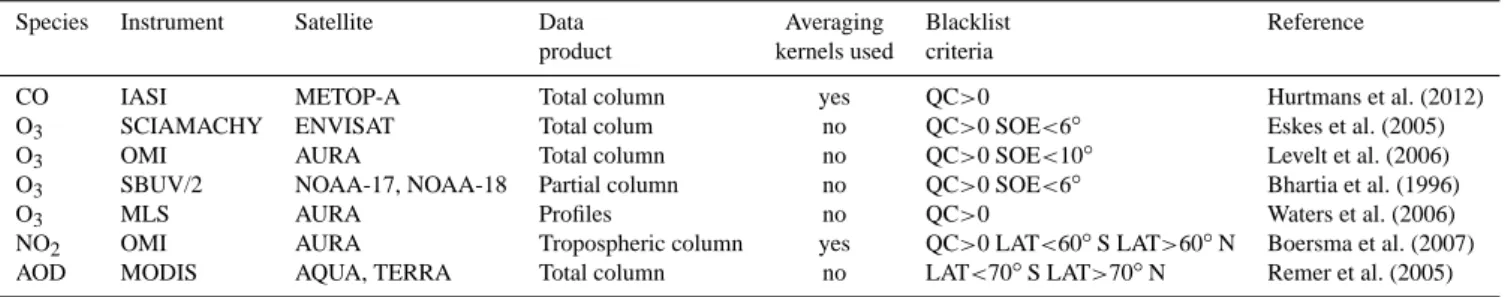
Table 1. Summary of satellite data used in the assimilation. Blacklist criteria: variational quality control (QC), Solar Elevation (SOE) and
latitude (LAT).
Species Instrument Satellite Data Averaging Blacklist Reference
product kernels used criteria
CO IASI METOP-A Total column yes QC>0 Hurtmans et al. (2012)
O3 SCIAMACHY ENVISAT Total colum no QC>0 SOE<6◦ Eskes et al. (2005)
O3 OMI AURA Total column no QC>0 SOE<10◦ Levelt et al. (2006)
O3 SBUV/2 NOAA-17, NOAA-18 Partial column no QC>0 SOE<6◦ Bhartia et al. (1996)
O3 MLS AURA Profiles no QC>0 Waters et al. (2006)
NO2 OMI AURA Tropospheric column yes QC>0 LAT<60◦S LAT>60◦N Boersma et al. (2007)
AOD MODIS AQUA, TERRA Total column no LAT<70◦S LAT>70◦N Remer et al. (2005)
(Hodzic et al., 2007; Pfister et al., 2011). For instance, for the 2010 Russian fires smoke particles have been reported over Finland (Kaiser et al., 2012).
The summer 2010 wildfires over western Russia provide an opportunity for a comprehensive assessment of the MACC assimilation/forecast system for this type of extreme pollu-tion event. In this paper, we focus on the following quespollu-tions: What is the relative importance of (1) the chemical data as-similation and (2) the NRT fire emission estimates on the accuracy of forecasts of tropospheric composition? What are direct effects, and which effects can be attributed to chemical interaction within the system, e.g. by persistent changes in the oxidative capacity? These questions may help to identify causes of variations in forecast accuracy from the perspective of both the modeling and the observing framework and can provide guidelines to improve them. For this purpose several hindcast (i.e. retrospective forecast) experiments with differ-ent model settings have been evaluated against independdiffer-ent satellite and ground-based observations. We focus on an as-sessment of the model in the free troposphere, for which the MACC global system is mainly designed for.
The paper is structured as follows: We describe the as-similation and forecast framework, together with the GFAS system in Sect. 2. In Sect. 3 various hindcast experiments are evaluated against independent observations for the heat wave period in western Russia. The interactions of the dif-ferent modeling components with each other are explicitly discussed in Sect. 4. We end this paper with a summary and conclusions from the analysis performed.
2 The MACC system and experiment setup 2.1 The global assimilation and forecast system
The MACC system (Hollingsworth et al., 2008) is used to perform assimilation and hindcast experiments of the chem-ical composition of the troposphere and stratosphere on a global scale. Daily analyses and forecasts of greenhouse gases, reactive gases and aerosols, as well as a comprehen-sive reanalysis of atmospheric composition data over the pe-riod 2003-2010 are available via the MACC project
web-portal (http://www.gmes-atmosphere.eu/data/). Aerosols are modeled within the IFS (Morcrette et al. 2009). The istry of reactive gases is calculated by a separate chem-istry transport model. For this study we use the TM5 model (Huijnen et al., 2010a), which is coupled to the IFS via the OASIS4 coupler (Redler et al., 2010), as described in Flem-ming et al. (2009). At the moment no interaction between aerosols and trace gas concentrations is considered.
The ECMWF 4D-Var meteorological assimilation system has been extended to assimilate chemically reactive trace gas concentrations and AOD from satellite retrievals (Inness et al., 2009; Benedetti et al., 2009). In the daily analyses for 2010, 7 retrieval products from 7 satellite instruments were routinely assimilated, see Table 1. The observational data are thinned to 1◦×1◦resolution. Background error statistics for reactive gases have been derived using the NMC method (Parish and Derber, 1992), which currently does not account for high variability in emissions or the correlation between different trace gases. Variational quality control (Andersson and J¨arvinen, 1999) and first guess checks are switched off for CO and NO2, to avoid that observations with high values
that are very different from the background values would be given only little weight in the analysis or even be rejected. As an example, the mean averaging kernel for the IASI CO prod-uct over western Russia, between 20 July and 15 August, is given in Fig. 1. It shows that the instrument is sensitive down to the surface (for daytime observations), but the largest sen-sitivity to CO is at an altitude of approx. 400 hPa. By con-straining both the ozone total column, using SCIAMACHY, OMI and SBUV, and the partial ozone column in the strato-sphere, using MLS data, tropospheric O3is directly affected
by the assimilation procedure (Flemming et al., 2011). The 4D-Var system runs on T159L60 resolution, and minimizes the difference between the observation and the background fields during a 12 hour assimilation window.
The hindcast experiments use meteorology initialized by the ECMWF operational analyses. For the analysis of chemical composition the assimilation window is 12 h, start-ing at 21:00 and 09:00 UTC. Every day at 00:00 UTC a 4-day (96 h) hindcast is started with the same system. The hindcasts use either the optimized initial concentration fields based on the data assimilation system, or the first day hindcasts for
0.0 0.5 1.0 1.5 2.0 AK 1000 800 600 400 200 Pres[hPa]
Fig. 1. Mean averaging kernel for IASI CO total columns over
west-ern Russia for 20 July–15 August 2010.
aerosol, O3, CO and NOx(=NO+NO2) of the previous day
for the reference hindcast runs. The four hindcast days are referred to as D+0 to D+3.
The TM5 model uses the tropospheric gas-phase chem-istry version TM5-chem-v3.0 (Huijnen et al., 2010a), which is based on CBM-IV chemistry. It applies the same 60 level vertical discretization as the IFS, but the horizontal resolu-tion is 3◦ lon×2◦lat, globally. The standard biomass burn-ing emissions in the TM5 reference hindcast experiments are based on GFEDv2 (van der Werf et al., 2006) monthly mean ‘climatological’ emissions calculated from the years 2001– 2006. The injection height of the reactive gases is assumed to extend up to 2 km (distributed as 20 % in layers 0–100 m, 100–500 m and 500–1000 m, respectively, and 40 % in 1000– 2000 m), in line with the study from Val Martin et al. (2010).
2.2 The GFAS emissions
Numerous systems for the derivation of fire emission esti-mates have been developed. They are traditionally based on burned area, e.g. Andreae and Merlet (2001), van der Werf et al. (2006, 2010), Wiedinmyer et al. (2011). Several recent developments have instead used Fire Radiative Power (FRP) observations, e.g., Kaiser et al. (2009), Sofiev et al. (2009), Konovalov et al., (2011), because FRP has been shown to be directly proportional to the combustion and aerosol emis-sion rates (Wooster et al., 2005; Ichoku and Kaufman, 2005; Heil et al., 2010). Common sources of uncertainty for all approaches are the land cover (and corresponding fire) type as well as the corresponding emission factors (Andreae and Merlet, 2001; Wiedinmyer et al., 2011; van der Werf et al., 2010; Mebust et al., 2011; Akagi et al., 2011). In the MACC project a NRT Global Fire Assimilation System (GFAS) was developed to estimate daily fire emission rates. The latest ver-sion (GFASv1.0), described in Kaiser et al. (2012), is based on FRP observations derived from the MODIS satellite in-struments, and provides emission estimates on a daily basis with global coverage on a 0.5◦×0.5◦spatial grid.
Table 2. Definition of model configurations.
Configuration Initial conditions Biomass burning from assimilation emissions
CNT No GFEDv2-clim
GFAS No GFASv1.0
Assim Yes GFEDv2-clim Assim-GFAS Yes GFASv1.0
The amount of trace gases released from the fires strongly depends on the predominant land cover type classification. The emission rate fsfor species s is calculated as:
fs=ραβs. (1)
where α denotes a biome-dependent factor for the conversion of FRP observations ρ to the rate of dry matter burned and βs are the biome-dependent emission factors from Andreae
and Merlet (2001) with updates, which are of similar mag-nitude as those specified for GFEDv3.1 (van der Werf et al., 2010). In GFASv1.0 the conversion factor α was derived with a linear regression between the observed fire radiative energy and the dry matter burned in the GFEDv3.1 inventory. Spe-cific conversion factors have been derived for eight dominant fire type classes (Heil et al., 2010; Kaiser et al., 2012). We note that an earlier attempt to generate emissions during the 2010 Russian fires episode yielded far lower CO emissions, partly because the biome distribution originally did not con-tain peat soils in the area around Moscow. The dominant fire type map was derived from the historic distribution of fire types in GFEDv3.1. For Russia, peat (histosols) and peaty soil areas were added in GFASv1.0, using information from Stolbovoi and Savin (2002) and (FAO 2003). GFASv1.0 is consistent with GFED3.1 within its accuracy limits and cap-tures many small fires that are missing in the GFEDv3.1 in-ventory. Specifically, on a global, multi-annual average, the CO emissions of GFASv1.0 are 6 % larger than GFEDv3.1, on a continental scale differences are typically 20 %. For aerosol emissions a global enhancement factor of 3.4 is in-troduced to compensate the under-estimation of bottom-up compared to top-down fire emissions at a regional to global scale (Kaiser et al., 2012). With this correction factor, the GFASv1.0 aerosol emissions of the western Russian fires of 2010 are consistent with eastern European AERONET ob-servations (Kaiser et al., 2012).
The GFASv1.0 emissions for aerosols and all relevant re-active trace gases, including the non-methane volatile or-ganic carbons (NMVOC’s), are applied to the MACC sys-tem globally. A constant emission rate during the day is ap-plied, which is a reasonable assumption for this case study where nighttime fire activity almost equaled daytime burning (Kaiser et al., 2012). The D+0 fire emissions are assumed to be constant during the full hindcast period.
Table 3. Emission totals over western Russia for daily GFASv1.0, GFEDv3.1 monthly emissions, the GFEDv2 climatological emissions, as
well as anthropogenic and biogenic emissions as used in the hindcast runs. Anthropogenic emissions are from RETRO (Schultz et al., 2007) and biogenic emissions from GEIA (Guenter et al., 2005) for CO and from ORCHIDEE (Lati`ere et al., 2006) for NOx and HCHO.
period 1–15/7 16–31/7 1–15/8 16-31/8 BC (Gg C) GFASv1.0 2.4 5.4 7.9 1.6 GFEDv3.1 3.8 4.0 6.4 6.8 GFEDv2 clim 3.2 3.5 4.1 4.4 Anthropogenic 2.4 2.6 2.7 2.9 CO (Tg CO) GFASv1.0 0.45 5.2 7.0 0.67 GFEDv3.1 0.65 0.69 1.1 1.2 GFEDv2 clim 0.50 0.53 0.60 0.64 Anthropogenic 0.29 0.31 0.33 0.36 Biogenic 0.43 0.46 0.38 0.40 NOx(Gg NO) GFASv1.0 8 29 42 6 GFEDv3.1 19 20 35 38 GFEDv2 clim 17 18 21 22 Anthropogenic 47 50 52 55 Soil 22 24 22 23
HCHO (Gg HCHO) GFASv1.0 5.3 43.7 60.6 7.3 GFEDv3.1 9.9 10.6 18.8 20.1
GFEDv2 clim – – – –
Anthropogenic 11 12 11 12
2.3 Set-up of the model experiments
To investigate the impact of both the assimilation system and the fire emissions, we performed four different 4-day hind-cast runs, namely with and without initializing aerosol, CO, O3 and NOx from assimilated fields, and using either the
GFASv1.0 fire product or the GFEDv2 climatological emis-sions, see Table 2. All runs lasted up to 31 August, while the free runs started on 1 July, and the runs including assim-ilation on 15 July. In this study we will primarily focus on the evaluation of trace gas concentrations in the free tropo-sphere, on a sub-continental scale (∼1000×1000 km), hav-ing in mind the relatively coarse resolution of our chemistry model.
3 Results
3.1 Meteorology and fire emissions
Figure 2 illustrates the meteorological situation for the July– August time period over western Russia, here defined as the region 35◦E–70◦E, 45◦N–65◦N (see also Fig. 3). The heat wave started around 27 June and lasted until 14 Au-gust. Temperatures reached maximum values of 39◦C, at the end of July, at individual locations (Matsueda, 2011), and were on average 5–10◦C higher than normal (Dole et al., 2011). No significant precipitation was recorded during this period, which resulted in relative humidity levels 20–40 % lower than normal (Witte et al., 2011). According to the
me-teorological analyses, from mid-July onwards the soil wet-ness was below the critical level of 23 %, i.e. half the volu-metric soil moisture at saturation, where water stress in veg-etation is assumed to take place. From this period onwards the FRP of GFASv1.0 starts to increase, with extreme mag-nitudes on 29–30 July. On the evening of 10 August thun-derstorms cleared the air over Moscow. After this date the recorded number of fires, and hence the fire emissions, were reduced. On 13 August the heat wave ended with heavy rain in Moscow and nearby areas.
Time series of the modeled CO emissions for the four dominating soil types over western Russia are also given in Fig. 2. They illustrate that the largest contribution to to-tal CO emissions can be attributed to fires over agricultural land, which indeed covers the largest area within this region. However, on 29 and 30 July, approximately half of the to-tal emissions were originating from peat fires. A snapshot of the CO emission map for 29 July (Fig. 3) shows that the re-gion with large emissions is very localized at about 150 km east of Moscow and partly includes a region where fires were burning in dense peat deposits (Kaiser et al., 2012). Note that emission totals for 30 July were very similar to 29 July, be-cause the quality control has removed the FRP observations for that day (Kaiser et al., 2012).
The total black carbon (BC), CO, NOxand HCHO
emis-sions from GFASv1.0 over western Russia, during 4 peri-ods in July–August 2010, are given in Table 3. As a refer-ence for GFASv1.0, the GFEDv3.1 emissions for the corre-sponding time period in 2010 are given. Also the GFEDv2
Fig. 2. Time series of (a) 2 meter daily maximum (solid) and
min-imum (dashed) temperature, and (b) soil wetness at a location east of Moscow (42◦E, 55◦N) from ERA-Interim meteorology. The dashed line indicates the critical soil wetness level below which wa-ter stress is assumed to take place. Also shown are the c) GFASv1.0 FRP product averaged over western Russia, and (d) GFASv1.0 CO emissions over western Russia aggregated per fuel type. Only emis-sions from the four dominant fuel types are shown: AG: Agriculture, PEAT: Peat soils (histosols), SA: Savanna, EFOS: Extratropical for-est (with partial burning of organic soil matter).
climatological (2001–2006) emissions, which are used in the reference hindcast experiments, are listed. The total GFASv1.0 emissions of CO between 16 July and 15 August are estimated as 12.2 Tg, of which ∼20 % is attributed to peat burning. The CO emission totals are about 11 times larger than the GFEDv2 climatological emissions. Furthermore, the CO and HCHO emissions are much higher than the monthly-mean GFEDv3.1 emissions. This is because GFEDv3.1 rep-resents organic soil content in parts of Russia but only for the calculation of the dry matter combustion rate; the emis-sion factors for peat are not applied outside tropical peat re-gions (van der Werf et al., 2010). GFASv1.0 applies emis-sion factors for peat across all tropical and Russian peat land cover types. The finding of larger CO and HCHO emis-sions and lower NOx and BC emissions in GFAS than in
GFEDv3.1 is consistent with the differences in respective emission factors for peat and agricultural fires. Finally, we note that the GFEDv3.1 average emissions over 2001–2006 for this region are considerably lower than those based on GFEDv2, as explained by van der Werf et al. (2010). For in-stance, CO emissions in GFEDv3.1 are lower by ∼40 % than GFEDv2.
The corresponding anthropogenic and biogenic emissions used in the hindcast runs are also given. They illustrate that,
Fig. 3. Snapshot of CO emissions from GFASv1.0 on 29 July 2010.
The white boxes indicate areas with peat soil as the dominant land cover type. Also indicated is the western Russia region (35◦E– 70◦E×45◦N–65◦N).
specifically for CO and HCHO, the GFASv1.0 biomass burn-ing emissions contribute 90 % and 82 % of the total emis-sions, respectively, during the fire period. The CO emissions are ∼25 % higher than Konovalov et al. (2011), who based their estimate on an optimization of FRP emission estima-tions using assimilated surface CO concentraestima-tions. Their es-timated contribution from peat fires was ∼30 %.
During 29 and 30 July, the release of CO in GFASv1.0 is estimated as ∼3.6 Tg, contributing more than 30 % of the total wildfire emissions over western Russia during July and August 2010. Fire emissions for NOx have almost doubled
compared to the climatology and contribute 32 % to the total emissions during this period.
3.2 Evaluation of tropospheric composition
The hindcast experiments (see Table 2) have been compared against various observations that were not used in the as-similation, as will be described in the corresponding subsec-tions. For modeled AOD, ground-based observations done at the Moscow AERONET station (37.5◦E, 55.7◦N) are used. In the case of CO, O3, NO2 and HCHO, retrievals
from MOPITT, IASI and SCIAMACHY are used. CO total columns are further compared to ground-based observations at Moscow and Zvenigorod.
Forecast accuracy is quantified in terms of mean bias and Root Mean Square Error (RMSE), which have been cal-culated on a daily basis for each hindcast day and model grid-box. These were then averaged over the western Russia
Moscow
22 01 11 21
days in July / August 0 1 2 3 4 5 Total AOD at 550 nm [-] AERONET CNT GFAS Assim Assim-GF Moscow 22 01 11 21
days in July / August 0 20 40 60 80 100 120 140
Sea salt, Dust and Sulphate Aerosol [ug/kg]
CNT GFAS Assim Assim-GF Moscow 22 01 11 21 days in July / August 0 500 1000 1500 OM + BC Aerosol [ug/kg] CNT GFAS Assim Assim-GF
Fig. 4. Left) modeled total aerosol optical depth at D+0, compared to daily average AERONET observations at the Moscow station (black).
The error bars reflect the daily variance in the available observations. Middle) total of seasalt, dust and sulphate aerosol, Right) total of organic matter and black carbon aerosol.
Table 4. Mean bias and RMSE of modeled AOD compared to the measurements from AERONET station at Moscow, between 20 July and
15 August, as function of the hindcast day.
Model Mean bias RMSE
D+0 D+1 D+2 D+3 D+0 D+1 D+2 D+3 CNT −0.83 −0.79 −0.78 −0.73 0.85 0.81 0.79 0.75 GFAS −0.10 −0.28 −0.14 0.12 0.56 0.45 0.64 0.74 Assim −0.41 −0.51 −0.51 −0.48 0.45 0.54 0.55 0.52 Assim-GFAS 0.08 −0.05 0.02 0.27 0.43 0.41 0.54 0.77
region and for the time frame of 20 July–15 August. For the AOD hindcasts, error measures are computed based on bias and RMSE with respect to the Moscow station only. Model AOD is interpolated to the time of the individual observa-tions, and equal weight is given to all separate days in the time series. A similar procedure was followed for the evalu-ation of ground-based CO total columns.
3.2.1 Aerosol optical depth and aerosol composition
In Fig. 4, the modeled total AOD at 550nm from the four configurations is compared to AERONET observations at the Moscow station. Prior to the fire event (15–25 July) all model configurations tend to underestimate the AOD, although the configurations including initialization from assimilated AOD provide the best results. During the fire period, the run As-sim captures a substantial part of the individual events, but frequently underestimates the magnitudes of the AODs. The run GFAS performs better, capturing most of the individ-ual events. For instance, on 7 August, the very high levels of modeled AOD are in agreement with the observed daily mean AOD, with a value of 3.3 in GFAS compared to 3.6 in the observations.
Despite the similarity in AOD in the assimilation runs with/without GFASv1.0, the aerosol composition in these runs is very different, see Fig. 4. In the assimilation runs excluding GFASv1.0 emissions the increase in AOD is largely attributed to sulphate, dust and sea salt aerosols. In the other runs the organic matter and black carbon aerosols, which are the dominant aerosol types in smoke, are most enhanced. Therefore, realistic fire smoke emissions are es-sential for the ability to identify elevated aerosol levels as smoke. This behavior is expected as the aerosol assimilation scheme does not contain information of the aerosol composi-tion but it relies on a realistic first guess estimacomposi-tion of emis-sion (Benedetti et al., 2009).
The mean bias for run GFAS on D+0 is improved by 88 % compared to run CNT and by 75 % compared to run Assim, see Table 4. It remains better than for runs CNT and Assim throughout the hindcast period. This shows that the GFAS aerosol emissions also yield information on the total aerosol load that is more accurate than a climatology and even the MODIS AOD observations in this particular case. However, the information of GFAS and MODIS AOD is complemen-tary and the mean bias of run Assim-GFAS is consequently the lowest of all runs up to D+2. The two runs with GFAS
40 80 120 160 40 80 120 160 15 30 45 60 15 30 45 60 MOPITT mean CO - TC 0.7 1.0 1.2 1.4 1.6 1.8 2.0 2.3 2.6 3.0 5.0 CO column [1018 molec/cm2] 40 80 120 160 40 80 120 160 15 30 45 60 15 30 45 60
Model mean CO - TC, FC day 1 TM5-IFS exp. CNT
0.7 1.0 1.2 1.4 1.6 1.8 2.0 2.3 2.6 3.0 5.0 CO column [1018 molec/cm2] 40 80 120 160 40 80 120 160 15 30 45 60 15 30 45 60
Model mean CO - TC, FC day 1 TM5-IFS exp. GFAS
0.7 1.0 1.2 1.4 1.6 1.8 2.0 2.3 2.6 3.0 5.0 CO column [1018 molec/cm2] 40 80 120 160 40 80 120 160 15 30 45 60 15 30 45 60
Model mean CO - TC, FC day 1 TM5-IFS exp. Assim-GFAS
0.7 1.0 1.2 1.4 1.6 1.8 2.0 2.3 2.6 3.0 5.0 CO column [1018 molec/cm2]
Fig. 5. Maps of mean CO columns from MOPITT-V4 for the time period 20 July–15 August 2010 compared to the kernel-weighted D+0 CO
columns from the runs CNT, GFAS and Assim-GFAS.
Table 5. Temporal correlation of modeled AOD compared to the
measurements from AERONET station at Moscow, between 20 July and 15 August (n = 27), as function of the hindcast day.
Model r2 D+0 D+1 D+2 D+3 CNT 0.09 0.09 0.15 0.04 GFAS 0.32 0.57 0.28 0.26 Assim 0.72 0.77 0.74 0.78 Assim-GFAS 0.50 0.68 0.48 0.26
emissions show an increase in mean bias for D+3. We inter-pret this as a symptom of a false alarm due to the assumption of persistence of the emissions from D+0, in particular per-sistence of the extreme emission rates on 29–30 July. This false alarm is visible around 3 August in the AOD time se-ries for D+3 in the top right panel of Fig. 12 in Kaiser et al. (2012).
The RMSE for run GFAS shows the positive impact of the GFAS emissions up to D+3 compared to run CNT. Run Assim-GFAS is better than the runs GFAS and Assim up to D+2, once again showing the complementary positive im-pacts of the assimilation and the emissions. The RMSE for D+3 in run Assim-GFAS is worse than the one in run Assim. This is a consequence of the strong sensitivity of this error metric to the actual variability in the emissions, which was very large between 28 July and 14 August. The RMSE is negatively affected by the emission persistency assumption made within each hindcast. A detailed interpretation is, how-ever, beyond the scope of the present study because RMSE also becomes sensitive to the activity of the forecast at longer lead times.
The correlation of the modeled AOD with respect to the AERONET observations is given in Table 5. Best perfor-mance is obtained with run Assim (r2=0.72, n=27) for hind-cast D+0 and remains fairly constant at this level up to D+3. For runs GFAS (r2=0.32 at D+0) and Assim-GFAS (r2=0.50 at D+0) the correlation degrades to r2=0.26 at
western Russia
22 01 11 21 31
days in July / August 1.0 1.5 2.0 2.5 3.0 3.5 4.0 CO [10 18 molec/cm 2] MOPITT CNT GFAS Assim Assim-GF
Fig. 6. Evolution of average kernel-weighted total columns over
western Russia compared to MOPITT, for D+0 hindcasts.
D+3, as a consequence of the high variability in the daily emissions.
In summary, the composition of the smoke aerosol plume is only realistic when GFAS emissions are used, the mean bias of AOD are improved by using the GFAS emissions throughout the AOD forecasts and the RMSE up to D+2. The RMSE and r2 illustrate that the day-to-day variability in the emissions, and also AOD at the individual sites, are very high.
3.2.2 Carbon monoxide
For the evaluation of CO, daytime total column observations from the MOPITT-V4 product (Deeter et al., 2010) have been used. Biases in the retrievals are on average below 5 %. We apply the MOPITT averaging kernels to the logarithm of the modeled profile. The average total CO columns over west-ern Russia for run GFAS during the time of the fires show a strong improvement compared to the control run (Fig. 5). A similar pattern as that from MOPITT can be observed, al-though with an overall negative bias. A better agreement is found with run Assim-GFAS, which, on average, captured the observed magnitude well. The impacted region spans an area from the western border of Russia, 35◦E, up to 80◦E and from 40◦N to 65◦N, as a consequence of the relatively long CO lifetime.
The evolution of the area-average total columns over west-ern Russia is presented in Fig. 6. Run GFAS accurately follows the observed area-average increase and decrease, but with a fairly constant negative offset during the whole sim-ulation period. This suggests that the bias is not directly re-lated to the GFAS CO emissions but rather to a general bias in CO over the northern hemisphere, see also Huijnen et al. (2010a).
When using assimilated IASI CO observations for the hindcast initialization, the average model total columns are low by ∼ 1017 molec cm−2(∼6 %) compared to
MOPITT-V4 during the initial phase, i.e., before 3 August. This bias is of the same magnitude as for the average over the extra-tropical Northern Hemisphere (30◦N–90◦N). However, dur-ing the period of the highest CO columns (4–14 August), a positive bias of up to 0.5×10¹⁸molec cm−2 was found. These differences could be related to differences between IASI and MOPITT CO retrieval algorithms during this par-ticular case, as discussed in Turquety et al. (2009) and George et al. (2009).
The assimilation runs with and without GFAS emissions do not show a significant difference for D+0 hindcasts, illus-trating the dominating impact of the initialization by assimi-lation of IASI observations.
A quantitative analysis of the forecast error as function of the hindcast day is given in Table 6. For the D+0 hindcasts the mean bias in run GFAS is −0.29×10¹⁸molec cm−2. This remains fairly constant for the next three hindcast days and is less than half the bias obtained for run CNT.
It is interesting to consider the differences in the evolu-tion of bias and RMSE at increasing forecast lengths between runs Assim and Assim-GFAS. Initially, for D+0, these num-bers are similar, but while in run Assim a negative bias de-velops quickly, this happens to a lesser extent in run Assim-GFAS, with an improvement of the mean bias relative to run Assim of 84 % at D+3. This demonstrates that the total amount of CO emissions, which is for this event much lower in run Assim (climatological) than in Assim-GFAS (persis-tency of D+0 emissions), is important to obtain a good fore-cast accuracy.
On the other hand, the values for RMSE increase consid-erably when including the GFAS emissions. This reflects the poor forecast accuracy of the precise emission pattern based on the persistency assumption in the fire emissions, as found before in the AOD analysis.
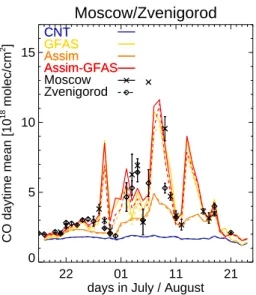
Additional to the space-based observations, we evaluate the model runs against ground-based CO total column obser-vations based on spectrometers at the Moscow and Zvenig-orod stations, as reported in Yurganov et al. (2011), Fig. 7. The Zvenigorod observation station is located 53 km west of the Moscow station. For this evaluation the modeled day-time CO profile has been spatially interpolated to the sta-tion locasta-tion and convoluted with the averaging kernel corre-sponding to the observations. The magnitude of the total col-umn observations from the two stations at the same day are always less than 1018molec cm−2, except for 6 and 9 August,
when the observations at Moscow are about two times larger than the ones at Zvenigorod. The model columns interpolated at the two stations are always very similar. This illustrates that very local events, causing differences in observations cannot be resolved at the current model resolution.
Different to the evaluation against space-based columns, a distinct difference between the runs with/without
Table 6. Mean bias and RMSE of modeled total CO columns (units 1018molec cm−2) compared to MOPITT V4 observations over western Russia between 20 July and 15 August, as function of the hindcast day.
Model Bias RMSE
D+0 D+1 D+2 D+3 D+0 D+1 D+2 D+3 CNT −0.79 −0.78 −0.78 −0.77 0.91 0.91 0.90 0.90 GFAS −0.29 −0.27 −0.26 −0.22 0.52 0.53 0.57 0.64 Assim 0.13 −0.04 −0.20 −0.31 0.38 0.39 0.43 0.51 Assim-GFAS 0.10 0.04 −0.02 −0.05 0.40 0.46 0.54 0.62
Table 7. Mean bias and RMSE of modeled total CO columns (units 1018molec cm−2) compared to ground-based CO total column observa-tions at the Moscow and Zvenigorod staobserva-tions between 20 July and 15 August, as function of the hindcast day.
Model Bias RMSE
D+0 D+1 D+2 D+3 D+0 D+1 D+2 D+3 CNT −2.0 −2.0 −2.0 −2.0 2.9 2.9 2.9 2.9 GFAS −0.2 −0.7 −0.8 −0.7 2.0 1.9 1.7 1.9 Assim −1.2 −1.4 −1.5 −1.5 2.1 2.3 2.3 2.4 Assim-GFAS 0.0 −0.2 −0.5 −0.3 1.9 1.6 1.5 1.8 Moscow/Zvenigorod 22 01 11 21
days in July / August 0 5 10 15 CO daytime mean [10 18 molec/cm 2 ] Moscow Zvenigorod CNT GFAS Assim Assim-GFAS CNT GFAS Assim Assim-GFAS
Fig. 7. Modeled daytime mean total CO column at D+0, compared
to daily average ground-based column observations at the Moscow and Zvenigorod stations. The error bars reflect the daily variance in the available observations. Solid lines are model results interpolated to the Moscow station (55.7◦N. 37.6◦E). dashed lines correspond to Zvenigorod (55.7◦N, 36.8◦E).
assimilation is clear, while both runs that apply GFAS emis-sions are now relatively similar. The rather modest increase in run Assim compared to CNT can be explained by the low sensitivity of IASI near the surface, as illustrated by the av-eraging kernel in Fig. 1, and because the a-priori profiles do not contain the high surface concentrations for this particular event.
The model versions with GFAS emissions capture the in-crease in CO columns during the first 10 days of August, but over-estimate concentrations on 29 July, related to the esti-mated high peat fire emissions close to Moscow on that day (Fig. 3). This is in contrast to AOD model results in Moscow for this day (see Fig. 4) and suggests that this model bias is caused by the lower resolution of the chemistry model com-pared to the aerosol model in IFS.
Model mean bias and RMSE during the period of the fires is presented in Table 7. For this evaluation the observations (and model results) from Moscow and Zvenigorod have been combined for the day that both stations delivered data.
The mean bias of D+0 hindcasts improve with application of data assimilation (a reduction by 40 %) but more effec-tively when using GFAS emissions (90 % reduction). Best performance is obtained in runs Assim-GFAS, with a negli-gible mean bias. For hindcast days D+1 to D+3 the degrada-tion in performance compared to D+0 is relatively moderate for all runs. Run Assim-GFAS remains best up to D+3, which is again different from the evaluation of ground-based AOD. Especially the fact that the RMSE does not degrade for the runs with GFAS could indicate that the available observa-tions do not fully constrain the model performance. Unfor-tunately, for specific days with large discrepancies between D+0 and D+3 forecasts (e.g. on 7–8 August, not shown) there are no observations.
Table 8 provides the temporal correlation of the hind-casts with respect to these observations. This is best for run Assim (r2=0.68, n = 21 for hindcast D+0), while the correlation for the runs with GFAS emissions is worse (D+0) or marginally better (D+1 to D+3) compared to CNT. Note that the limited number of observations and the observational
western Russia 100 150 200 250 300 CO daily max [ppbv] 1000 800 600 400 200 Pres [hPa] CNT GFAS Assim Assim-GFAS
Fig. 8. Averaged daily maximum CO profiles for the four hindcast
runs, at D+0 over western Russia, for the time period 20 July–15 August.
Table 8. Temporal correlation (r2) of modeled total CO columns (units 1018molec cm−2) with respect to ground-based CO total col-umn observations at the Moscow and Zvenigorod stations between 20 July and 15 August (n = 21), as function of the hindcast day.
Model r2 D+0 D+1 D+2 D+3 CNT 0.32 0.26 0.28 0.33 GFAS 0.25 0.37 0.53 0.43 Assim 0.68 0.51 0.62 0.57 Assim-GFAS 0.31 0.48 0.59 0.48
data gaps during this event degrade the representativeness of this score. This may also explain the atypical results of the higher r2 for hindcasts D+1 to D+3 compared to D+0 for runs with GFAS.
The difference in performance against ground-based and space based observations is illustrated by the area-average vertical model profiles (Fig. 8). The impact of the CO as-similation in run Assim is visible throughout the full tro-posphere, up to 200hPa, with the largest increase in CO concentrations at around 700 hPa. In contrast, the runs with GFAS show high CO concentrations up to ∼800 hPa, corresponding to the injection height distribution of the CO emissions. Switching on the assimilation in run Assim-GFAS results in a marginal increase of the high concentrations in the boundary layer, and hence a little difference in CO to-tal column with respect to ground-based observations, where the sensitivity of these instruments is maximal. But a more effective increase compared to run GFAS is found between 800 and 400 hPa, which explains the removal of the negative bias with respect to MOPITT.
3.2.3 Tropospheric ozone
We use IASI O3partial tropospheric columns (0–6 km) from
LISA (Dufour et al., 2012) to evaluate hindcasts of tropo-spheric O3concentrations. The O3data consist of a profile
re-trieval using the radiative transfer model KOPRA (Karlsruhe Optimised and Precise Radiative transfer Algorithm, (Stiller et al., 2000)) and its inversion module KOPRAFIT (Ere-menko et al., 2008). Note that the IASI observations are fil-tered for cloud contamination before the retrieval. This filter should allow also screening for the worst aerosol contami-nated pixels. However, the retrieval algorithm does not ac-count for aerosol concentrations, and moderate aerosol load-ing can potentially introduce significant biases in the ozone retrieval depending on the type, size, altitude and amount of aerosols. For this study we have added an additional filter that corresponds to a noise level of about 70 nW/(cm2cm−1sr) on
the radiance measured by IASI in order to discard the data with too poor fit quality. Compared to the standard measure-ment noise level of about 20 nW/(cm2cm−1sr) this signifi-cantly reduced spurious high tropospheric O3columns over
Kazakhstan, while it did not change columns elsewhere. The product used here was available for Europe and western Rus-sia up to 58◦E. The retrieval error is estimated in the range of 10–20 % (Dufour et al., 2012). In the validation procedure we map spatially and temporally interpolated model profiles to the instantaneous IASI observations at approx. 10:30 local time and then apply the averaging kernels.
In Fig. 9 we present maps of mean tropospheric O3
par-tial columns. On average the model runs are all well in line with IASI over western Europe, and show a slightly high bias over the Mediterranean region. All runs show lower ozone columns south-east of Moscow and particularly over western Kazakhstan than observed by IASI. The reasons for this are not fully understood. Although no strong wildfires took place here, the heat wave extended into this region, with daytime maximum temperatures reaching 40◦C in the first two weeks of August. This resulted in a reduction in ozone dry deposition flux due to low soil wetness levels. The model might additionally suffer from the same shortcomings as suggested in the evaluation of the 2003 heat wave over western Europe (Ord´o˜nez et al., 2010), i.e., the impact of high temperatures and increased solar radiation on the bio-genic emissions (e.g. Lee et al., 2006; Solberg et al., 2008), which, together with moderately high NOxconcentrations,
can increase O3 production. On the other hand, an
assess-ment of the local climatological biogenic VOC and soil NOx
emissions as applied in current runs (Lathi`ere et al., 2006) show that these are significantly larger in comparison to cli-matological emissions derived from MEGANv2 (Guenther et al., 2006), which constrains the possibility of an under-estimation of ozone precursor emissions. Furthermore, a pos-sible positive bias in the IASI retrieval could also contribute to the discrepancy between the model and observations. This bias could be caused by spectral interferences between ozone
20 40 20 40 40 60 40 60
IASI O3 - trop. column 0-6km IASI
Moscow 14. 16. 18. 20. 22. 24. 26. 28. 30. 32. 34. 36. O3 column [DU] 20 40 20 40 40 60 40 60
Model O3 - trop. column 0-6km exp. CNT
Moscow 14. 16. 18. 20. 22. 24. 26. 28. 30. 32. 34. 36. O3 column [DU] 20 40 20 40 40 60 40 60
Model O3 - trop. column 0-6km exp. Assim
Moscow 14. 16. 18. 20. 22. 24. 26. 28. 30. 32. 34. 36. O3 column [DU] 20 40 20 40 40 60 40 60
Model O3 - trop. column 0-6km exp. Assim-GFAS
Moscow
14. 16. 18. 20. 22. 24. 26. 28. 30. 32. 34. 36.
O3 column [DU]
Fig. 9. Maps of mean O3tropospheric partial columns (0-6 km) as observed from IASI between 20 July and 15 August 2010 compared to
the kernel-weighted D+0 columns from the runs CNT, Assim and Assim-GFAS.
Table 9. Mean bias and RMSE of modeled O3partial columns (0-6km) in DU, compared to IASI O3observations over western Russia
between 20 July and 15 August, as function of the hindcast day.
Model Bias RMSE
D+0 D+1 D+2 D+3 D+0 D+1 D+2 D+3 CNT −1.5 −1.5 −1.5 −1.6 1.8 1.8 1.8 1.8 GFAS −0.6 −0.6 −0.7 −0.7 1.7 1.7 1.7 1.7 Assim −1.0 −1.1 −1.2 −1.3 1.7 1.7 1.7 1.8 Assim-GFAS −0.5 −0.6 −0.7 −0.8 1.7 1.7 1.7 1.7
and aerosols and/or water vapor. We note that the positive bias in IASI was reduced by applying a more strict error cri-terion as discussed above.
Nevertheless, the large-scale spatial patterns are captured by the model, including the north-south gradient in O3
columns over western Russia. Local differences between the runs are less than approx. 2 DU.
Figure 10 shows the time evolution of the corresponding area-mean tropospheric O3 columns for hindcasts D+0. It
illustrates that all model runs are able to capture the increase in O3 columns at the beginning of August, as well as the
62 1
Figure 10. Time series of modeled tropospheric O3 columns (hindcast D+0) with averaging
2
kernel against IASI O3 columns (0-6km). Data are smoothed over a 3-day time window to
3
filter out variations in spatial coverage. 4
5
Fig. 10. Time series of modeled tropospheric O3 columns (hind-cast D+0) with averaging kernel against IASI O3columns (0–6 km).
Data are smoothed over a 3-day time window to filter out variations in spatial coverage.
western Russia
22 01 11 21
days in July / August 30 40 50 60 70 O3 daily max [ppbv] CNT GFAS Assim Assim-GFAS western Russia 40 60 80 100 O3 daily max [ppbv] 1000 800 600 400 200 Pres [hPa] CNT GFAS Assim Assim-GFAS
Fig. 11. (left) Maximum area-average surface O3 concentrations
over western Russia for the four model settings, hindcast D+0. (right) corresponding time averaged profile of ozone daily maxi-mum concentrations between 20 July and 15 August.
strong decrease between 10 and 21 August, the end of the heat wave. However, all model runs show a negative bias of approx. 1–3 DU with respect to IASI during the heat wave. It is largest for run CNT, and lowest for the runs that apply the GFAS emissions, indicating its positive impact on the ozone chemistry in the model.
The spatial variability in the instantaneous ozone columns is significantly larger for the IASI retrieval than in the model. While the daily average standard deviation of the IASI O3
observations over western Russia between 20 July and 15 August is 3.1 DU, it is only between 1.2 and 1.3 DU for the different hindcast runs. Part of this larger standard de-viation in IASI columns can be explained by retrieval er-rors, estimated to be ∼2.5 DU for the given time period and region. A lack of variability in the modeled O3
concentra-tions in the free troposphere additionally explains this dis-crepancy. These two factors contribute to the RMSE of the model against the IASI observations, which is about 1.7 DU, see Table 9. Although the use of assimilation helps to reduce the model bias, the largest improvement is a result of the use of the GFAS emissions, with a reduction of the mean bias by approx. 60 % compared to the control run for D+0. The relative difference between the mean biases of the different hindcast runs is similar for all hindcast days, indicating the lasting effect of both initialization by assimilated fields as well as the use of GFAS emissions.
Despite the rather similar results for tropospheric O3
columns from the various runs, there are significant dif-ferences in the planetary boundary layer (PBL). Figure 11 shows that surface O3 concentrations are only slightly
af-fected by the initialization from assimilation, while they are enhanced by ∼15 % when using the GFAS emissions dur-ing the time of the fires. Moreover the figure illustrates that hindcasts using the GFAS emissions lead to elevated O3
lev-els throughout the troposphere while the assimilation has the largest impact at altitude levels between 600 and 300 hPa, and the smallest in the PBL, similar to what was found for CO. Irrespective of the missing effects of the aerosols, which would presumably lead to a reduction in surface ozone con-centrations (Konovalov et al. 2011), this shows the relevance of the NRT emission estimates on the modeling of ozone con-centrations in the PBL, compared to the impact of ozone as-similation.
3.2.4 Tropospheric nitrogen dioxide
We compare hindcasts of tropospheric NO2columns against
the IUP Bremen SCIAMACHY NO2product. Airmass
fac-tors determined from radiative transfer calculations are used to convert slant to vertical columns (Richter et al., 2005). NO2tropospheric columns are only determined for clear sky
pixels, a selection performed according to FRESCO data (Koelemeijer et al., 2001, 2002) for cloud fractions smaller than 20 %. Model data coinciding in time and space with SCIAMACHY measurements are used. The hindcasts are further compared to the DOMINO product v2.0 (Boersma et al., 2011), applying the same selection criteria as for SCIAMACHY, see also Huijnen et al. (2010b). The un-certainty in individual retrievals due to spectral fitting is 0.7×10¹⁵molecules cm−2(Boersma et al., 2007). Note that the same OMI NO2column data over Eurasia were also used
in the assimilation system, to provide initial conditions for the runs Assim and Assim-GFAS. Leitao et al. (2010) show that the sensitivity of NO2satellite measurements can be
in-creased or dein-creased, depending on the amount and optical properties of the aerosols, and its vertical distribution rela-tive to that of NO2. Thus, it is difficult to estimate precisely
the uncertainties associated with the retrieved tropospheric NO2 columns from SCIAMACHY measurements for this
Fig. 12. Maps of mean tropospheric NO2columns as observed from SCIAMACHY between 20 July and 15 August compared to the D+0 columns from the runs CNT, GFAS and Assim-GFAS.
Western Russia
22 27 01 06 11 16
days in July / August 0.0 0.5 1.0 1.5 2.0 2.5 3.0 NO 2 [10 15 molec/cm 2] SCIA CNT GFAS Assim Assim-GFAS western Russia 22 27 01 06 11 16
days in July / August 0.0 0.5 1.0 1.5 2.0 2.5 3.0 NO 2 [10 15 molec/cm 2] OMI CNT GFAS Assim Assim-GFAS
Fig. 13. Time series of modeled tropospheric NO2columns
(hind-cast D+0) against SCIAMACHY (left) and with averaging kernel against OMI NO2from DOMINO v2.0 (right).
western Russia 0 1 2 3 4 5 SCIA NO2 [10 15 molec/cm2 ] 0 1 2 3 4 5 TM5-IFS CNT GFAS Assim Assim-GF western Russia 0 1 2 3 4 5 OMI NO2 [10 15 molec/cm2 ] 0 1 2 3 4 5 TM5-IFS CNT GFAS Assim Assim-GF
Fig. 14. Scatter plots of mean tropospheric NO2for model runs at
D+0 with respect to observations from SCIAMACHY and OMI, for the period 20 July to 15 August 2010.
DOMINO v2.0 and Bremen SCIAMACHY NO2 retrieval
products. This includes, for example, the different overpass time (SCIAMACHY in the morning, OMI in the afternoon), and the fact that for the comparison to OMI NO2we apply
averaging kernels to the model, while these are not used for the comparison to SCIAMACHY. Also, differences in the coverage (better for OMI) and resolution (better for OMI) result in more observations per model gridbox for OMI.
In general, the various model runs compare well with the SCIAMACHY measurements over western Russia, see Fig. 12. A hot-spot of high NO2columns is observed within
the gridbox containing Moscow, which can mainly be at-tributed to anthropogenic emissions. Both the SCIAMACHY and OMI instruments detect a large region of intensified NO2
spreading east of Moscow that is not simulated by any of the hindcast runs. Considering the size of this region this defi-ciency in the model simulations could point at uncertainties in the soil NOxemissions. In the current inventory these
con-tribute to ∼20 % of the total emissions in run GFAS (see Ta-ble 3).
In the surroundings of Moscow both SCIAMACHY and OMI show enhanced NO2columns that may be attributed to
fire emissions. The hindcast run GFAS has on average higher columns compared to CNT within this region. However, run GFAS shows the spots of high NO2columns at different
lo-cations than observed from the satellite instruments. When switching on the initialization from assimilation, the NO2
columns over western Russia increase on average, thereby reducing the negative model bias. This is most visible in the region extending south and east of Moscow.
Figure 13 shows the time evolution of the model versions compared to the SCIAMACHY and OMI NO2
prod-ucts. As we evaluate tropospheric NO2 columns over the
relatively large western Russia region the daily average increase in columns during the time of the fires is lim-ited. SCIAMACHY shows enhanced columns during the beginning of August, while for OMI high NO2 columns
during the first days of August over the fires region are compensated by relatively low columns elsewhere. In both figures the increase in daily average NO2 columns
with GFAS emissions and assimilation is well visible, with both aspects resulting in better average agreement to the observations. Nevertheless, the correlation between the area-mean observations and corresponding model columns is limited. The variability in magnitude, both in the model columns and the retrieval, is larger with respect to SCIAMACHY data than to OMI data (see, e.g., the high model concentrations in the evaluation against SCIAMACHY on 10 August). This is a direct consequence of the lower data volume in SCIAMACHY compared to OMI.
The scatter plots presented in Fig. 14 reveal in more de-tail the spatial correlation between the different runs and the observations over western Russia. The corresponding cor-relations and slopes as derived from a linear regression are
Table 10. Slope and spatial correlation (r2) of modeled tropospheric NO2columns for hindcast D+0 with respect to SCIAMACHY and
OMI observations over western Russia between 20 July and 15 Au-gust.
model Slope r2
SCIA OMI SCIA OMI CNT 0.58 0.42 0.68 0.89 GFAS 0.80 0.47 0.37 0.78 Assim 0.65 0.53 0.72 0.93 Assim-GFAS 0.85 0.56 0.43 0.87
given in Table 10. The best correlations are obtained for the simulations with climatological emissions, indicating that the spatial distribution of the GFAS emissions indeed does not accurately reflect the actually observed variability in NO2
columns.
The largest outlier in the scatter plot against SCIA-MACHY was obtained for the runs that use GFAS emissions and can be traced back to the model hindcast for 30 July. For this particular day emissions due to peat fires were extreme in a small region east of Moscow (see Fig. 2). Actual emissions for that day are highly uncertain as these were kept identical to the ones from the previous day (see Sect. 3.1).
The mean bias and RMSE for all hindcast days with re-spect to the SCIAMACHY and OMI NO2products are given
in Tables 11 and 12. As expected, the mean bias decreases by 75 % (29 %) against SCIAMACHY (OMI) when using the GFAS emissions, but the RMSE significantly increases for the comparison with SCIAMACHY, while it hardly changed for OMI. Note that differences in the coverage and resolu-tion result in more daily observaresolu-tions per model gridbox for OMI data. Therefore the model RMSE with respect to SCIA-MACHY, as calculated from daily mean observed fields at the model grid resolution, is more influenced by retrieval er-rors than with respect to OMI (Boersma et al., 2007). The remaining contribution to the RMSE can be attributed to a mismatch of the local emissions.
A reduction in the bias of 28 % (47 %) compared to SCIA-MACHY (OMI) is achieved when including the assimilation of O3, CO and NO2 observations for initialization. The
as-similation also leads to a slight decrease of the RMSE, which can be explained by the improved mean bias. Considering the short lifetime of NO2, we cannot exclude that most of the
impact of the assimilation on NO2is indirect, via
assimila-tion of CO and O3. This is also consistent with the persisting
lower bias with increasing forecast length in the assimilation runs. The enhanced CO causes a reduced abundance of OH radicals in the troposphere (e.g., Duncan et al., 2003). This in turn inhibits the formation of nitric acid (HNO3) by
oxida-tion of NO2. More tropospheric O3would furthermore lead
to higher NO titration in favour of NO2production. Indeed
Table 11. Mean bias and RMSE of modeled tropospheric NO2columns (units 1015molec cm−2), compared to SCIAMACHY observations
over western Russia between 20 July and 15 August, as function of the hindcast day.
Model Bias RMSE
D+0 D+1 D+2 D+3 D+0 D+1 D+2 D+3 CNT −0.40 −0.40 −0.40 −0.39 0.58 0.59 0.59 0.60 GFAS −0.10 −0.15 −0.15 −0.12 0.94 0.89 0.91 0.99 Assim −0.29 −0.33 −0.35 −0.36 0.56 0.57 0.58 0.59 Assim-GFAS −0.04 −0.09 −0.11 −0.08 0.90 0.89 0.93 1.02
Table 12. Mean bias and RMSE of modeled tropospheric NO2 columns (units 1015 molec cm−2), compared to OMI observations over
western Russia between 20 July and 15 August, as function of the hindcast day.
Run Bias RMSE
D+0 D+1 D+2 D+3 D+0 D+1 D+2 D+3 CNT −0.34 −0.34 −0.34 −0.32 0.44 0.43 0.43 0.44 GFAS −0.24 −0.25 −0.23 −0.22 0.43 0.43 0.43 0.43 Assim −0.18 −0.23 −0.26 −0.27 0.40 0.41 0.42 0.42 Assim-GFAS −0.16 −0.20 −0.21 −0.21 0.40 0.41 0.42 0.43
first 10 days in August decrease by approx. 5 % in the free troposphere in run Assim-GFAS versus run GFAS. Yet, the actual numbers vary considerably depending on the hindcast day, altitude level and location. Further work is needed to quantify and validate the indirect effects of the assimilation on the chemical composition.
3.2.5 Formaldehyde
The retrieval of HCHO columns from the SCIAMACHY in-strument follows a similar approach as described in the pre-vious subsection for NO2, and is further detailed in
Witt-rock (2006) and WittWitt-rock et al. (2006). Offsets introduced by the solar reference measurements are compensated by nor-malizing the retrieved slant columns with a mean value of 3.5×10¹⁵molec cm−2 in the region between 180◦–200◦E. Airmass factors are used to convert the slant to vertical columns. These are taken from pre-calculated values that assumed a variable tropospheric aerosol loading. However, these scenarios do not necessarily represent the conditions of the fire event analyzed in this study. This means that a more precise correction of aerosol effect could lead to higher HCHO columns retrieved from SCIAMACHY observations (Wittrock, 2006). One other aspect to consider is that the low coverage of satellite pixels for SCIAMACHY data (com-bined with the short period of the analysis) implies a small number of measurements available per model grid box. This leads to a relatively large uncertainty in the averaged data due to the noise in the individual measurements, which in com-bination with the offset correction for some cases results in negative HCHO columns. Considering the low coverage also no cloud screening is performed for HCHO retrievals. The
uncertainty in the mean of the observations is estimated of the order 1016molec cm−2(Wittrock, 2006).
Figure 15 presents the modeled tropospheric HCHO columns and observations from SCIAMACHY. The SCIA-MACHY data show significant scatter, as a direct conse-quence of the large uncertainty in the HCHO retrieval. All model versions show somewhat higher HCHO background concentrations than observed from SCIAMACHY, which may partly be related to the offset correction in SCIA-MACHY. On the other hand, the SCIAMACHY HCHO columns show a distinct region of high HCHO columns east of Moscow. A similar hot-spot, although higher, is only identified in the model simulations where the updated GFAS emissions were considered. The indirect impact of the assimilation is marginal: HCHO columns are on aver-age ∼0.3×10¹⁵molec cm−2lower compared to runs without initialization from assimilation. This could be explained by the change in oxidative capacity in the model, related to the higher tropospheric NOx, CO and O3. Still, a large
differ-ence between the model runs that use the GFAS emissions and satellite data can be perceived, with the model having both higher background values as well as a different mag-nitude and shape of the region with elevated HCHO levels. This difference can be explained by uncertainties in both the model and the observations.
Time series of daily mean HCHO columns as well as an evaluation of mean bias and RMSE between model and ob-servations are in this case strongly influenced by the scat-ter in the observations and the outliers, due to the sparse amount of data and high uncertainty of individual observa-tions. Therefore such an analysis does not lead to significant results. Here, we focus on the spatial correlation between
Fig. 15. Maps of mean tropospheric HCHO columns as observed from SCIAMACHY between 20 July and 15 August compared to the D+0
columns from the runs CNT and GFAS.
the model results and the SCIAMACHY observations. The HCHO scatter plot (Fig. 16) illustrates that, for the back-ground concentrations, i.e., SCIAMACHY observations be-low 1016molec cm−2, the model shows approximately
con-stant HCHO columns of 1016molec cm−2. Very similar
re-sults for the runs with/without assimilation are obtained. The presence of the region with high HCHO in the model runs with GFAS leads to a significant improvement in the slope of the regression and the correlation between the model and the SCIAMACHY observations, Table 13. This demonstrates the positive impact of the GFAS emissions on modeled HCHO columns. The large outlier in these runs with an average model column of 6.7×10¹⁶molec cm−2is related to the peat fire emissions east of Moscow on 30 July, and corresponds to the outlier in the SCIAMACHY NO2scatter plot.
Table 13. Slope and correlation (r2) of modeled HCHO columns for hindcast D+0 with respect to SCIAMACHY and OMI observations over western Russia between 20 July and 15 August.
model Slope r2
CNT 0.08 0.10 GFAS 0.68 0.47 Assim 0.07 0.08 Assim-GFAS 0.65 0.44
4 Integral assessment of GFAS emissions and assimilation on hindcasts
In this section we assess the integral impact of both the GFASv1.0 emissions and initialization by assimilated trace gases on the atmospheric composition at D+0, focusing on
western Russia
0 20 40 60
SCIA HCHO [1015 molec/cm2]
0 20 40 60 TM5-IFS CNT GFAS Assim Assim-GF
Fig. 16. Scatter plots of mean HCHO columns for model runs at
D+0 with respect to observations from SCIAMACHY, for the pe-riod 20 July to 15 August 2010.
the chemical interactions between the various trace gases. Also the implications of different start-conditions and emis-sion estimates for the D+1 to D+3 hindcasts are analyzed.
4.1 Impact of fire emissions on chemical production and loss budgets
The impact on local production/loss budgets and the respec-tive total masses (burdens) resulting from the application of the GFASv1.0 fire emissions as compared to the climatolog-ical emissions is given in Table 14. Note that the emission budgets include all contributing emission types in this region. The modeled HCHO burden in run GFAS increases by 56 %, mainly due to the enhanced local HCHO emissions from GFASv1.0, but also because of enhanced oxidation of other hydrocarbons. Although the chemical production of CO, which is mainly driven by HCHO oxidation, increases by 22 % in run GFAS, the absolute contribution to the CO production remains small. About 4 % of the extra CO produc-tion in run GFAS can be attributed to GFASv1.0 emissions of HCHO and other higher hydrocarbons. Thus, 96 % of the increase in CO burden is attributed to the direct CO fire emis-sions. An indirect effect of the large GFASv1.0 emissions is an increase of 19 % in the local CO lifetime, calculated as the local burden over the chemical loss. This corresponds to a lifetime of 1.5 month in run GFAS, and is hence a signifi-cant contributor to enhanced CO concentrations in the tropo-sphere. The increase in CO lifetime is due to a reduction of the hydroxyl radical (OH) concentration, which also explains the reduced CH4oxidation budget. This is related to an
in-creased scavenging of OH by the larger CO concentrations, as was discussed earlier by Duncan et al. (2003).
Additionally, the ozone chemical production and loss terms increase, related to larger NOxand NMVOC emissions
due to the fires. Overall a net increase in tropospheric O3
bur-den of 4 % is found. O3concentrations are mostly enhanced
in the PBL, see also Sect. 3.2. The dry deposition velocities in the two runs are identical, as they depend on meteorology only. Therefore the increase in O3concentrations in the PBL
explains the comparatively larger increase in O3 dry
depo-sition flux by 10 %. As discussed earlier, the increase in the O3burden is insufficient compared to the IASI observations,
suggesting an under-estimation of ozone precursor gas emis-sions.
The mean biases in NO2 columns with respect to both
SCIAMACHY and OMI, for the runs using the GFASv1.0 fire emissions, have improved significantly compared to the hindcast results with climatological emissions. This im-provement suggests a general positive impact of higher NOx
emissions on the model results. Nevertheless, the evaluation still indicates an under-estimation of NOxemissions, which
could contribute to the low bias in O3.
Several authors suggested that an excess of aerosol con-centrations will have an impact on chemical and photolysis rates, depending on aerosol microphysical and optical prop-erties (e.g., Hodzic et al. 2007, Real et al., 2007, Verma et al., 2009). Konovalov et al. (2011) estimated that the neglect of shielding by an aerosol plume leads to a positive bias of ∼20–50 % in O3 at the surface layer over Moscow, during
most days in the intense fire period. This was explained by an overestimation of the ozone production by NO2
photoly-sis.
Overall we find that the increase in O3 burden and the
larger NOx-recycling are insufficient to counterbalance the
larger OH scavenging by CO. As we do not account for aerosol effects, the O3 production is likely over-estimated,
as well as primary OH production due to the ozone photol-ysis. Correspondingly, this implies an over-estimation of the local CH4 and CO loss by oxidation. However, the
magni-tude of this effect is highly uncertain, depending on the ac-tual aerosol optical parameters and the spatial and vertical distribution (Real et al., 2007). Also, while the effects can be very important on a local scale, as shown by Konovalov et al. (2011), their impact on the chemical budgets on a sub-continental scale is unclear, but likely small.
4.2 Impact of assimilation on chemical composition
The application of assimilation helps in most cases to re-duce model biases. A small negative bias in CO with respect to MOPITT-V4 before and after the fire episode was found, whereas for days with the largest CO columns the hindcasts initialized with assimilated IASI CO show a high bias of ap-prox. 0.5×10¹⁸molec cm−2.These biases are in line with an earlier evaluation for summer 2007 Greek fires (Turquety et al., 2009).
When switching on the assimilation of O3total and partial
stratospheric columns the negative O3bias decreases by 33 %