Designing Systems for Many Possible Futures:
The RSC-based Method for Affordable Concept Selection
(RMACS), with Multi-Era Analysis
by
Michael Andrew Schaffner B.S. Systems Engineering University of Arizona, 2012
Submitted to the Department of Aeronautics and Astronautics in Partial Fulfillment of the Requirements for the Degree of
Master of Science in Aeronautics and Astronautics at the
Massachusetts Institute of Technology
June 2014
@ 2014 Massachusetts Institute of Technology All rights reserved
Signature of A uthor... MASSACHUSETrr 5gIMtrE, OF TECHNOLOGY
JUN
16
2014
LIBRARIES
Signature redacted
Department of Aeronautics and Astronautics May 22, 2014
Signature redacted
A ccepted by... ... Adam M. Ross Research Scientist, Engineering Systems Lead Research Scientist, Systems Engineering Advancement Research Initiative
a Thesis Co-Advisor
Signature redacted
Certifiedby...-Donna H. Rhodes Principal Research Scientist and Senior Lecturer, Engineering Systems Director, Systems Engineering Advancement Research Initiative
_^ Thesis Supervisor A ccepted by... A ccepted by...
Signature redacted
... (Aleborahjightingale Professor of Aeronautics and Astronautics and Engineering Systems Aeronautics and Astronautics Academic AdvisorSignature
redacted-Faulo Lozano Professor fAeronautics and Astronautics Chair, Graduate Program Committee
Abstract
The current downward trend in funding for U.S. defense systems seems to be on a collision course with the state of the practice in systems engineering, which typically results in the increased pace and scale of capabilities and resultantly increased cost of complex national defense systems. Recent advances in the state of the art in systems engineering methodology can be leveraged to address this growing challenge. The present work leverages advanced constructs and methods for early-phase conceptual design of complex systems, when committed costs are still low and management influence is still high. First, a literature review is presented of the topics relevant to this work, including approaches to the design of affordable systems, assumptions and methods of exploratory modeling, and enabling techniques to help mitigate the computational challenges involved. The types, purposes, and limits of early-phase, exploratory models are then elucidated. The RSC-based Method for Affordable Concept Selection (RMACS) is described, which comprises nine processes in the three main thrusts of information gathering, evaluation, and analysis. The method is then applied to a naval ship case example, described as the Next-Generation Combat Ship, with representational information outputs and discussions of affordability with respect to each process. The ninth process, Multi-Era Analysis (MERA), is introduced and explicated, including required and optional informational components, temporal and change-related considerations, required and optional activities involved, and the potential types of outputs from the process. The MERA process is then applied to a naval ship case example similar to that of the RMACS application, but with discrete change options added to enable a tradespace network. The seven activities of the MERA process are demonstrated, with the salient outputs of each given and discussed. Additional thoughts are presented on MERA and RMACS, and 8 distinct areas are identified for further research in the MERA process, along with a brief description of the directions that such research might take. It is concluded that the affordability of complex systems can be better enabled through a conceptual design method that incorporates MERA as well as metrics such as Multi-Attribute Expense, Max Expense, and Expense Stability. It is also found that affordability of changeable systems can be better enabled through the use of existing path-planning algorithms in efficient evaluation and analysis of long-term strategies. Finally, it is found that MERA enables the identification and analysis of path-dependent considerations related to designs, epochs, strategies, and change options, in many possible futures. Thesis Supervisor: Dr. Donna H. Rhodes
Title: Principal Research Scientist and Senior Lecturer, Engineering Systems Director, Systems Engineering Advancement Research Initiative
Thesis Co-Advisor: Dr. Adam M. Ross
Acknowledgements
"Selecting the one moment that changed your life, or the person that set you on the right or wrong track, is creating a story by selecting a memorable and interesting starting point... This can go back indefinitely, and any starting point would be exactly as relevant.. .There is no one person or event that completely changed my ife. There are a few that stick out in memory... because they just made the best stories."
-Peter Welch, And Then I Thoiugh/ I Was a Fish
From a starting point of most recent memory:
I owe a great debt to my wife, Rachel, who has been a light to me in dark places, when all other lights went out. Though she could never carry my (academic) burdens for me, she did carry me. Rachel, I remain always yours and ever grateful for your support these past 6 years. My lab- and classmates provided much of the value of the past 2 years. I hope to see all of you in the future less productive and less stressed, but perhaps wealthier (not necessarily monetarily). In no particular order: Marcus W, Nico R, Matt F, Brian M, Nirav S, Paul G, Hunter Z, Mike C, Paul L, Matt S, Pedro S, Margaret S, Caleb W, David S, Robbie H, Steven A, Brandon K, Johannes B, and Mark G, this includes you.
Kelvin and Pavan, your physical and virtual support and encouragement were always highly appreciated, even (especially?) when they were unexpected. Thanks.
Debbie, Donna, and Adam, I am grateful to you all for allowing me to join SEAri. Thank you for mentoring me and teaching me how to conduct research, and for supporting me even during my very confused moments. It has truly been a pleasure.
From slightly less recent memory:
Dr. Larry Head is truly inspirational, and I am quite confident I would be worse off having never met him. Dr. William Boynton and his team of planetary scientists provided an exceptional internship experience, without which I am sure my recent years would have taken a less stellar route. It is most assuredly a privilege to know Dr. Ricardo Valerdi. In memoriam of Dr. Jerry Droege, whose optimism and enthusiasm were contagious. Michael McKay's direct encouragement was a singular factor in my (rather late) decision to enter the academy; and Dan Hohn provided valuable mentorship in business and engineering. Dan Klein's tutelage prepared me to tilt at so many mathematical windmills. And really stretching back:
Tim Barsuhn's singular influence saved this thesis from a host of vague antecedents. Aaron and Megan were role models wise beyond their years. Could I ask for better siblings? This thesis is dedicated to my parents, who taught me "to act justly...and to walk humbly" (Micah 6:8), and who always taught me to love knowledge, but to love wisdom more, "to do this, above all, to grasp what human will and human reason can do, and what they cannot"
Biographical Note
"The best laid plans of mike [sic] and men..."
-Aaron Schaffner, quoting Robert Burns' "To a Mouse"
Michael Schaffner was born in a paradisal seaside town on the west coast of Florida, where he was generally supremely happy for 8 years of his life. During that time he became fascinated with human space exploration, especially the International Space Station (ISS). In addition, he severely misinterpreted then-current technological capabilities from the movies Short Circuit and Not Quite Human, and as a result fixed his attentions from ages 4
through 6 on building a robot that could think on its own. Unfortunately, it was the 198os.
Since that time, his life can perhaps best be
summed up visually (see right; State 1, Florida, State 3
is not shown). Most of the travel in his life has State 4
been due to his love of seeing friends and State 6
family, who all apparently love living far from State 8
him. In more stationary years, he earned an Time
-Associates of Arts in Biblical Studies, started two technical support businesses, and met Rachel, by whom he was able to answer the age-old question, "Who can find a virtuous wife?" He also learned to play the saxophone and piano, nurtured a form of modernist Anglophilia, and dabbled in non-profit service, philosophy, soccer, ping pong, chess, hiking, fishing, and computer arts.
Eventually Michael came to study Systems Engineering at University of Arizona, during which time he worked as a summer intern in a simulation group at Raytheon and as a year-long NASA Space Grant Intern, where he contributed to a paper published in JGR: Planets. He also led a team in an international simulation competition, worked with BAE systems on the architecture for a cooperative unmanned vehicle software, and attended academic conferences, including presentation of a research poster to lawmakers in Washington, D.C. Upon graduation, he received the Wayne Wymore Award for Excellence in Systems Engineering and began work at Sandia National Laboratories, who enabled him to attend graduate school. In MIT's AeroAstro S.M. program, he took classes from EECS, Sloan, Technology and Policy, and Harvard Computer Science. His thesis represents somewhere
between 16 hours' of work and i,8oo years2 of work, depending on the assumptions made.
Michael's fondest memories of MIT will include (remotely) taking part in a test session aboard the ISS, as well as watching a mobile robot use his code to successfully navigate a
CSAIL obstacle test bed. One could almost say that the robot was thinking on its own.
An old proverb (Proverbs 16:9, to be specific) says that a man's heart plans his way, but his
steps are directed by someone else. As a result, another proverb (20:24) asks, "Who can
understand his own way?" While Michael has come to understand many things, he is delightedly mystified by the way in which life develops, and he thoroughly enjoys the people alongside whom his steps are found. While these things all could be rather accidental, he quite firmly believes in an underlying purpose, even if he cannot see it.
'Assuming a typing speed of one word per second.
Table of Contents
ABSTRACT ... 3 ACKNOW LEDGEMENTS ... 5 BIOGRAPHICAL NOTE ... 7 TABLE OF CONTENTS ... 9 LIST OF FIGURES ... 13 LIST OF TABLES...19 1 INTRODUCTION ... 21 1.1 M otiv atio n ... 2 1 1 .1 .1 Sy ste m s E n g in eerin g ... 2 1 1.1.2 Present Need for Affordability in Complex Defense Systems ... 231 .1 .3 S c o p e ... 2 4 1.1.4 Recent Advances in Early-Phase Systems Engineering ... 25
1.2 Research Questions and Methodology ... 27
1.3 T h esis O verview ... 27
2 LITERATURE REVIEW ... 29
2.1 Affordability Concepts and Definition... 29
2.2 M odeling Considerations... 30
2.2.1 U se of M odels in System D esign ... 3 1 2.2.2 Accuracy of Models for Complex Future Systems ... 32
2.2.3 Use of Exploratory Models in System Design ... 32
2.3 Computational Considerations... 32
2.3.1 Search Algorithms for Discrete Networks ... 33
2.3.2 Rapidly Exploring Random Trees for Continuous Spaces ... 34
2.3.3 Spatial Complexity of Combinatorial Problems ... 35
2.4 Case Stu dies ... 3 6 2 .4 .1 S p a ce T u g ... 3 6
2.4.2 X-Terrestrial Observer Swarm (X-TOS)... 37
2.4 .3 N ext G eneration Com bat Ship ... 3 7 3 METHODOLOGY FOR THE EARLY-PHASE DESIGN METHOD ... 39
3.1 Exploratory Models in Design ... 39
3.1.1 C om p lexity an d p erception ... 39
3 .1 .2 T h e D e sig n L o o p ... 4 0 3.1.3 Models Used in Present Design Method ... 45
3.2 Proposed Method based upon Epoch-Era Analysis... 48
3.3 Description of the RSC-based Method for Affordable Concept Selection (RMACS)... 49
4 APPLICATION OF RMACS TO THE NEXT GENERATION COMBAT SHIP... 53
4.1 Process 1: Value-Driving Context Definition... 53
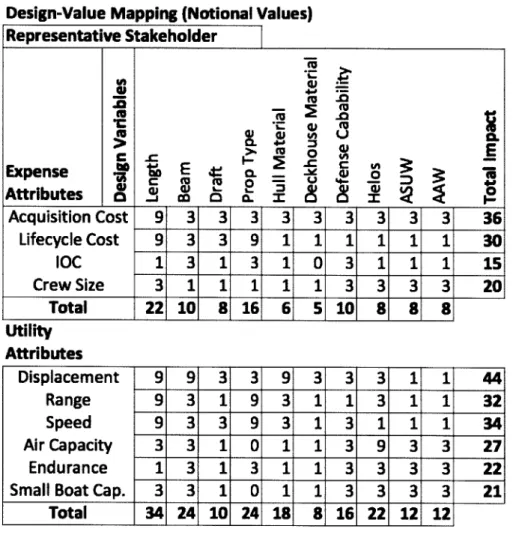
4.2 Process 2: Value-Driven Design Formulation ... 54
4.3 Process 3: Epoch Characterization ... 57
4.4 Process 4: Design-Epoch Tradespaces Evaluation ... 59
4.5 Process 5: Single-Epoch Analyses ... 63
4.6 Process 6: Multi-Epoch Analysis... 68
4 .6 .1 A sp ects of ch an geab ility ... 7 0 4.6.2 A dditional aspects of affordability ... 71
4.7 Process 7: Era Construction... 72
4.8 Process 8: Single-Era Analyses... 73
4.9 Process 9: Multi-Era Analysis... 77
5 MULTI-ERA ANALYSIS: AN EXPLORATION FOR PATH DEPENDENCIES OF EPOCHS AND DESIGNS ACROSS ALL MODELED FUTURES... 79
5.1 Goals of Multi-Era Analysis ... 79
5.2 Inputs to Multi-Era Analysis ... 81
5.3 Components of and Considerations in Multi-Era Analysis... 83
5.3.1 Consideration of Changes to Designs through Eras... 84
5.3.3 Consideration of Era-Level Strategies, Trajectories, and Path Analysis... 89
5.4 Activities in Multi-Era Analysis...106
5.4.1 Activity 1: Identify Desired Variant ... 109
5.4.2 Activity 2: Select designs and epoch-level metrics of interest...109
5.4.3 Activity 3: Create era-level strategies...109
5.4.4 Activity 4: Identify design-strategy pairs of interest ... 112
5 .4 .5 A ctiv ity 5 : C reate eras ... 1 1 2 5.4.6 Activity 6: Design-Strategy-Era Evaluation...118
5.4.7 Activity 7: Results Analysis...118
5.5 Outputs and Results of Multi-Era Analysis...119
5.5.1 Identification of Troubling Perturbations and Eras ... 120
5.5.2 W ithout Change Options: Epoch- and Era-Level Metrics...120
5.5.3 W ith Change Options: Metrics on Design-Strategy Pairs ... 121
6 APPLICATION OF MULTI-ERA ANALYSIS TO NGCS SYSTEM ... 125
6.1 Inform ation Inputs to the Process...125
6 .1 .1 S e ts o f D a ta ... 1 2 5 6.1.2 Generation of Change Options ... 126
6.1.3 Epoch-Dependent Change Options ... 128
6.1.4 On "changeability" provided by change options: the Full Accessibility Matrix...129
6.2 Activities of Multi-Era Analysis...133
6.2.1 Activity 1: Identify Desired Multi-Era Analysis Variant...134
6.2.2 Activity 2: Select designs and epoch-level metrics of interest...134
6.2.3 Activity 3: Create era-level strategies...136
6.2.4 Activity 4: Identify design-strategy pairs of interest ... 140
6 .2 .5 A ctiv ity 5 : C reate era s ... 1 4 1 6.2.6 Activity 6: Design-Strategy-Era Evaluation...143
6.2.7 Activity 7: Results Analysis...143
7 DISCUSSIO N ... 153
7.1 Discussion of Process 9, Multi-Era Analysis ... 153
7.2 Discussion of the RSC-based Method for Affordable Concept Selection (RMACS)...154
7.2.1 The Importance of Feedback and Iteration...154
7.2.2 Integration with Existing Practices...154
7.3 Future Research ... 155
7.3.1 Identification of Additional Types of Relevant Path Dependence...155
7 .3 .2 E ra -L e v e l M etrics ... 1 5 6 7.3.3 Creation of Era-Level Strategies for Continuous-Range Change Options...157
7.3.4 Methods for Analysis of Design Families and Epoch Networks ... 158
7.3.6 Pruning the Era Trees for Era Creation...159
7.3.7 Sam pling Techniques for Era Creation...160
7.3.8 Prescriptive Information from Autonomous Planner ... 161
8 CONCLUSION ... 163
8.1 Answer to Research Question #1...163
8.2 Answer to Research Question #2...164
8.3 Answer to Research Question #3 ... 165
8.4 On the Challenges and Benefits Associated with Discretization of Futures...168
8.5 Final T houghts ... 169
GLOSSARY AND ACRONYMS...171
REFERENCES... 175
List of Figures
Figure 1-1. Historical costs of fighter aircraft for the USAF, in 2o dollars...22 Figure 1-2. Historical drawdowns of military spending in post-war periods. ("Defense D raw dow ns Com pared," 2012) ... 23 Figure 1-3. Qualitative description of system phases and associated factors
(Blanchard & Fabrycky 2006)...25 Figure 2-1. Depth-First Search (DFS) vs. Breadth-First Search (BFS). Courtesy (W, n.d.) ... 33 Figure 2-2. The nodes (i.e., colored squares) searched by the A* algorithm operating on a discrete grid, starting in the red square (upper left) with the goal node being the blue square (lower right). The heuristic (i.e., estimate of distance to the goal) for each searched square is represented by a color that represents its straight-line distance to the goal region. Courtesy (Patel, n.d.) ...-....- 34
Figure 3-1. Illustration of the design-performance-value loop...40 Figure 3-2. Partitioning short run and long run into epochs and eras (Ross & Rhodes,
2 0 0 8 ) ... 4 6
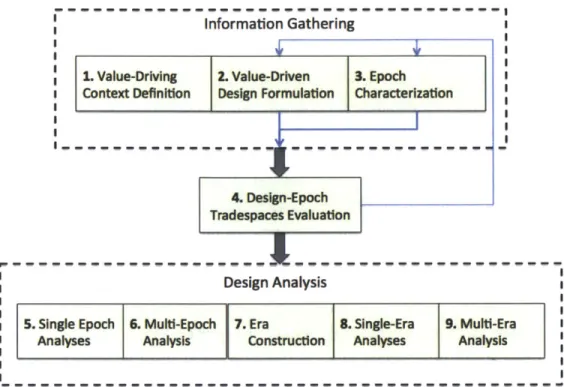
Figure 3-3. A graphical overview of the Gather-Evaluate-Analyze structure of the m eth o d ... 50 Figure 4-1. Single Attribute Utility (SAU) curves on each system attribute. The leveling off of stakeholder satisfaction/dissatisfaction occurs around levels established by previous system s ... 6o Figure 4-2. SAE functions for the expense attributes of the NGCS, where a value of i
represents complete dissatisfaction. The "knees" in the curves represent anchoring from sim ilar expenses of previous system s...61 Figure 4-3. One of the results of attribute evaluation through the Math Model, epoch variable impacts, and Single- and Multi-Attribute Utilities: a tradespace (MAU vs
MAE) of 6 NGCS designs operating in the Baseline Epoch...62 Figure 4-4. The 6 potential NGCS designs in the Mothership epoch. (One design is below minimum acceptable utility, leaving the 5 feasible designs.) ... 64 Figure 4-5. The 4 feasible NGCS designs in the Sea Support epoch. ... 66 Figure 4-6. The 5 feasible potential NGCS designs in the Sojourner epoch. ... 67
Figure 4-7. The four epochs of Era #1 and their durations. Stakeholder preferences remain constant; as a result, MAU and MAE values can be directly compared across epochs. ...---... 73 Figure 4-8. Left: the MAU values of each design during Era #1. Right: the MAE values
of each design in Era #1. ... 74
Figure 4-9. The four epochs of Era #2. The MAU and MAE values cannot be compared between epochs due to changing stakeholder preferences...76 Figure 4-10. Left: the MAU of each design through Era #2. Right, the MAE of each design during the same ten-year period. Note that stakeholder preferences change betw een ep och s...76
Figure 5-1. Sets of information potentially present as inputs to Multi-Era Analysis. ... 8 3 Figure 5-2. Results of A* search on problem with small branching factor. (Russell & N orvig, 2009), Sect. 3.6, Fig. 3.29...96
Figure 5-3. Four example paths of the development of a MOI over an era, exemplifying the time-related variations in values... 101 Figure 5-4. The four example paths of Figure 5-3, depicting developments of a MOI ov er tim e ... 10 5 Figure 5-5. The outputs of Activity 7 from each type of input modeled. ... 19 Figure 6-1. Sparsity plot of the transition matrix for Add Engine, alongside the corresponding force-directed network plot. The spatial position of each colored cell in the matrix on the left indicates which design numbers correspond to a transition, while spatial positions of each node on the right indicate a design's relation to other designs. Nodes in the central portion of the connected cluster may have a high degree of betweenness (Freeman, 1977) relative to nodes on the outer portion of the
con n ected clu ster...127
Figure 6-2. Sparsity plot of the transition matrix for Upgrade Payload, alongside a force-directed network plot. The spatial position of each colored cell in the matrix on the left indicates which design numbers correspond to a transition, while spatial positions of each node on the right indicate a design's relation to other designs. 127 Figure 6-3. Sparsity plot of the transition matrix for Increase Length, alongside a depiction of the network created. The spatial position of each colored cell in the matrix on the left indicates which design numbers correspond to a transition, while spatial positions of each node on the right only indicate a design's relation to other
designs. For example, Design 127 may have a high degree of betweenness relative to the other designs (Freem an, 1977)...128 Figure 6-4. A full accessibility matrix of the NGCS-like system (left), with the associated force-directed network visualization (right). The nodes in the bottom left of the network depiction are those designs which cannot reach the central cluster of designs (all edges are directed, but directionality is not indicated by this particular v isu alizatio n ). ... 131 Figure 6-5. A full accessibility matrix of Space Tug (left), with the corresponding force-directed network visualization (right). Many designs have a FAO of 7 to 9, while many more have much higher FAO values. ... 132 Figure 6-6. A full accessibility matrix of the first 500 designs of X-TOS (left), with the corresponding force-directed network visualization of the 5oo designs (right). Gray areas imply many edges connecting the clusters of designs (blue dots)...133 Figure 6-7. Construction of an admissible heuristic for the A* implementation of the era-level Survive strategy. An admissible heuristic optimistically estimates the cost of a design. The penalty applied for a time unit of infeasibility is iooox more than the base unit of financial cost of change options...137 Figure 6-8. The path of the MAU of design 32 paired with the era-level Survive strategy, in a sample 3-frame clip of length 42 months (X axis). Time spent changing is shown as the gray shaded area under the line; in this case, equal to i month. (Only one change executed in this era, from 32 to 44.)...138 Figure 6-9. The path of the MAU of design 32 paired with the epoch-level Survive tactic, in the sample 3-frame clip of length 42 months (X axis). Time spent changing is shown as the gray shaded areas under each line. (Three changes executed in this
era: 32 to 22, 22 to 94, and 94 to 1.)...138 Figure 6-io. Estimated number of total nodes in the design-tradespace meta-network (exponential line in blue) compared with the number of nodes considered by the A* implementation (constant-slope line in green), in 3- to 20- frame eras, average of iooo sam ples in each era length. ... 140 Figure 6-1. Percentage (along the Y axis) of the yield of the 97 epochs (each a bar alo n g th e X axis)...141
Figure 6-12. Change options (Y axis, descending order: Add Engine, Upgrade Payload, Increase Length) across all epochs (X axis), with cost multiplier indicated by shading. (Multiplier of o indicates no availability of a change option in that ep o ch .) ... 14 2
Figure 6-13. Resulting networks from the Full Accessibility calculation of Section 6.1.4.2, Epoch-level Survive tactic, and Era-level Survive strategy. (Tactic and strategy evaluated on ioo designs of the tradespace through all 3-frame clips.)... .144
Figure 6-14. The distribution of time spent in each design, when Design 14 is paired with epoch- and era-level Survive strategies and evaluated in all 3-frame clips
(around 14,000 total clips)...145 Figure 6-15. A parallel sets visualization of Design 14 paired with the era-level Survive strategy in all 14,000 clips of length 3 frames, effectively conveying different aspects of the same data as Figure 6-14. Color indicates which design number the strategy uses in frame i (either 12, 14, or 128), while the size of each horizontal line reflects the proportion of clips in which the corresponding design number appears in that fra m e ... 14 6 Figure 6-16. A parallel sets view of the Multi-Attribute Utility paths produced by the trajectory of Design 14 paired with the Survive strategy in all 14,000 clips of length 3 fra m es...14 7 Figure 6-17. All MAU values in all 14,000 clips of 3-frame length for Design 14 paired with the Survive strategy. Darker color indicates more paths tracing that same route th rou gh th e clip ... 148
Figure 6-18. Usage of options (Y-axis: 1, 2, and 3) in all evaluated epochs (4, 5, 27, 28,
65, 72, 85, 95) by Design 14 paired with epoch- and era-level Survive strategies in all
14,000 clips of length 3 fram es. ... 149 Figure 6-19. The usage of change options by each design in all 3-frame clips, from the trajectory of Design 14 paired with the epoch- and era-level Survive strategies.
... 15 0 Figure 6-20. A parallel sets visualization of the epoch numbers in each frame involved in the trajectory of Design 14 paired with the Survive strategy, considering only the clips where Design 14 changes to Design 128 in the first frame. (Epochi corresponds to the EpochlD in fram e i, etc.) ... 151 Figure 8-1. An overview of the RMACS method. ... 164
Figure 8-2. Design trajectory resulting from the A*-based era-level Survive strategy implementation (left), compared with the results from the epoch-level Survive strategy in the sam e era (right)...164 Figure 8-3. Full Accessibility network visualizations resulting from the implementation of Djikstra's algorithm to include all arcs (Left: Space Tug design study, Right: NGCS-like case study)... 165
Figure 8-4. The four example paths from Figure 5-3 of the development of a MOI o v er tim e ... 16 6 Figure 8-5. One of the methods proposed and demonstrated for era creation in M u lti-E ra A n alysis...167
Figure 8-6. Some of the visualizations used in the Results Analysis portion of Multi-E ra A n aly sis. ... 16 8
List of Tables
Table 2-1. Worst-case complexities for simple search algorithms on a network, where b=branching factor of the network, and d=depth of the "goal" node in the network.
...- --- --- -- -- - -- ---- ---- --- --- -- -- --...34 Table 3-1. Matrix illustrating different kinds of models... 42
Table 4-1. Decomposition of mission statement into attributes ... 55
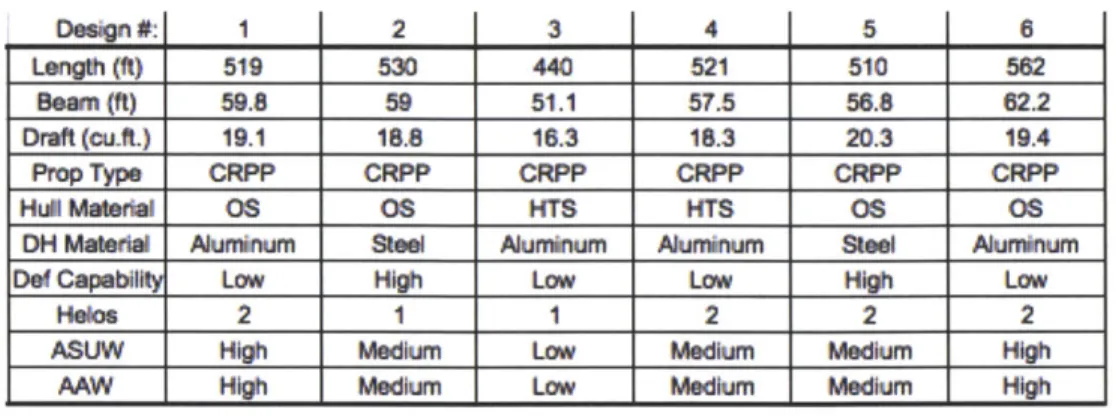
Table 4-2. A Design-Value Mapping, reflecting the notional impact of design variables on attributes. ... ... 56 Table 4-3. A list of the epoch variables modeled for the NGCS context and needs. 57 Table 4-4. An Epoch Descriptor Impact Matrix, reflecting the notional impact of epoch variables on design variables, utility attributes and expense attributes. --- 58 Table 4-5. The six representative designs (with corresponding design variable levels) for the initial concept selection of the NGCS. ... 62
Table 4-6. The evaluated attributes of the six representative designs in the Baseline Epoch, with aggregated MAE and MAU values. (See Table 4-1 for units of m easu rem en t.) ... 62
Table 4-7. The six representative epochs constructed for the NGCS study (of io8 p o ssib le )...6 3 Table 4-8. The evaluated attributes of the 6 representative NGCS designs in the Mothership epoch. (See Table 4-1 for units of measurement; negative attribute values are treated as o.)... 64 Table 4-9. The evaluated attributes of each design in the Sea Support epoch. (See Table 4-1 for units of measurement; negative attribute values are treated as o.) ....66
Table 4-10. The evaluated attributes of each design in the Sojourner epoch. (See Table 4-1 for units of measurement; negative attribute values are treated as zero.) ... 6 7 Table 4-11. The NPTs for the 6 NGCS designs across the 6 representative epochs. 68 Table 4-12. The fuzzy NPTs of the 6 NGCS designs for several levels of fuzziness. A value of i represents fuzzy Pareto efficiency in ioo% of the epochs...69 Table 4-13. The eNPTs for the NGCS designs with the change strategy "Maximize E fficien cy ". ... 70
Table 4-14. The highest levels of Lifecycle Cost and Crew Size across all epochs. ... 71 Table 4-15. The standard deviation of Lifecycle Cost for each design across all epochs.
... 7 2 Table 4-16. Calculation of the net present value ($ millions) of designs' operations
costs for E ra #1...74
Table 4-17. The maximum yearly operations cost of each design throughout Era #1, compared with the NPV maximum operations cost ... 75
Table 4-18. The standard deviation of each design's operations costs throughout Era
#1...--- --... 75
Table 4-19. Calculation of the NPV operations costs of each design in the 10-year Era
# 2 ... 7 6 Table 4-20. The maximum operations cost incurred by each design throughout Era #2, compared with the maximum NPV operations cost... 77 Table 4-21. The standard deviation of operations cost throughout the io years of Era
# 2 ... 7 7 Table 5-1. Multi-Era Analysis (MERA) variants and their constituent components.
... 8 4 Table 5-2. The six meta-metrics evaluated for each of the 4 example MOI paths shown in Figure 5-4. --- ... 105 Table 5-3. The activities of the MERA process, with inputs, description, and outputs. Activities 3 and 4 are shaded to indicate optional nature, only included when change options are included as inputs to the MERA process. ... io8 Table 6-1. The design variable levels of the NGCS-like designs of interest A, B, and C for the MERA process. Lower payload levels indicate higher levels of capability..135 Table 8-1. Six example meta-metrics resulting from the current work... 166
1
Introduction
"Because not everything happens as one expects or with the smoothness of a parade."
-Leo Tolstoy, [ar and Peace
1.1 Motivation
The motivation for the present work stems from the confluence of several factors. The first factor is the state of the practice of systems engineering for large-scale systems, especially defense systems that are ever increasing in pace and scale, and resultantly cost. Another factor is the current downward trend of federal funding for such systems, resulting from the termination of military operations in the Middle East and the rise of other higher-priority considerations in the national budget. Finally, the third factor is recent improvements in state of the art systems engineering methodology as captured in much of the literature from relatively recent years. The present research attempts to leverage these recent advances in systems engineering to address the growing challenges resulting from the first two factors.
1.1.1 Systems Engineering
According to the NASA Systems Engineering handbook, systems engineering is "a methodical, disciplined approach for the design, realization, technical management, operations, and retirement of a system" (Kapurch, 2010). Many systems may not need this type of methodical systems engineering effort to succeed, if they require low resource investment and their range of functionality, inputs, and outputs is very limited. Larger systems, however, especially those that involve more open and
non-obvious interactions among components that are both technical and social, require much more effort in integration of the various subsystems in order to best serve the broader purpose of the system. The behavior of the overall system can be modified not only through modification of its constituent subsystems, but also through adding and removing entire subsystems, as well as adding, removing, and modifying relationships between the subsystems. Because the behavior of the system as a whole differs from that of the parts and must be treated accordingly, the methods of systems engineering prove to be valuable in many different disciplines where these properties emerge (Hall, 1962).
One of the early areas where such properties were identified was in the development of the missiles and missile-defense systems of the 1940s, which is when the use of
systems engineering by the U.S. Department of Defense (DoD) began (Goode, Machol, & Teichmann, 1957). Since that time, defense systems of all kinds have often exhibited the large-scale, open properties that require a high degree of systems engineering for successful mission completion, whether in land, sea, air, space, or virtual environments. These types of defense systems all require much up-front work on problem definition, exploratory planning, integration of subsystems, and plans for system testing and retirement. This extra effort is required due to several factors, including the many different domains involved (e.g., electrical, mechanical, software, social, political), potentially hazardous and varied operating environments, and significant investment of resources required for acquisition and operation (sometimes for even a single copy of a system).
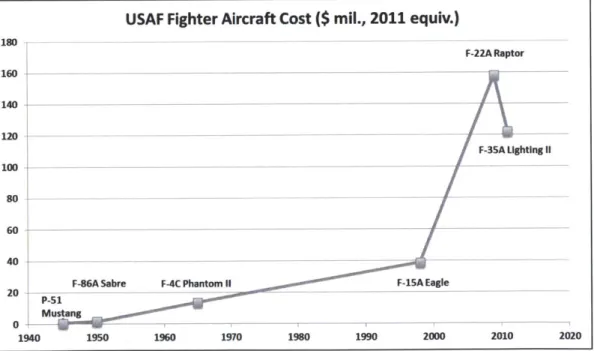
The resource investments required for defense systems have been growing due to the advanced technology and the enlarged scale of operations, resulting in ever-increasing costs for defense systems, regardless of their domain. One of the examples of this increase is the cost of fighter aircraft for the US Air Force (USAF). The historical costs of several fighter aircraft are shown below in Figure i-1, which
adjusts the costs to near-present-day (2011) dollars.
USAF Fighter Aircraft Cost
($
mil., 2011 equiv.)180 ---F-22A Raptor 160 - ~ --- _________ 140 120 - - - -F-35A Ughting 1I 100 A---- ----4o - - --- --40 ___ __ _ _
F-86A Sabre F-4C Phantom 11 F-ISA Eagle
20 - ______ _ _ __
P-S21201 20
1940 1950 1960 1970 1980 1990 2000 210 22
Figure 1-1. Historical costs of fighter aircraft for the USAF, in 2011 dollars.
While the costs of fighter aircraft have historically experienced an annual increase of roughly io% per year, the US Navy's (USN's) increase in cost for naval ships such as "amphibious ships, surface combatants, attack submarines, and nuclear aircraft carriers have ranged from 7 to ii percent in recent decades" (Arena, Blickstein, Younossi, & Grammich, 2006). It is certainly the case that today's air and naval
defense systems have capabilities far beyond their historical counterparts, but the budget-related concerns about costs of acquisition and operation are beginning to take widespread precedence over the concerns for higher performance.
1.1.2 Present Need for Affordability in Complex Defense Systems
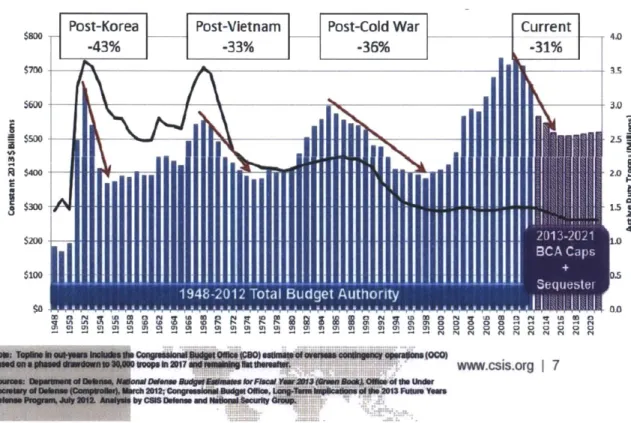
As demonstrated by the historical data on air, naval, and other defense systems, the complexity and cost of acquisitions and operations are ever increasing; as a result, there is an emergent need for the US Department of Defense (DoD) to ensure the overall success of a system within established resource and schedule constraints. This need is exacerbated by the present conditions of the US winding down military operations in the Middle East, after which budgets are projected to be drastically reduced for multiple years and relatively flat afterward. A historical chart of the post-war periods in the US is shown below in Figure 1-2.
Post-Korea Post-Vietnam Post-Cold War Current
-43% -33% -36% -31% $7M0 -_ 3.5 $500 25_L R $400 2.0 $3001. $200 .0 $100 $0 U 0 0 0 a0 0A.000 '.a www.csis.org I 7 2St2 tuq~ndU r~Owh 14 MO Ft_ msG1 Go in i~mI W01 i O a
Figure 1-2. Historical drawdowns of military spending in post-war periods. ("Defense Drawdowns Compared," 2012)
With recent budget cuts and the prospect of relatively flat defense budgets in coming years (Schwenn et al., 2011), the DoD is seeking ways to yield better returns on its weapon system investments as well as methods to deliver defense capabilities for less than it has in the past. It is well understood that mitigating uncertainty in estimating cost and schedule parameters that plague the early phases of program formulation would help to identify the true costs of a weapons system or program
from the beginning, and resultantly reduce overruns. This idea is also in consonance with the advent of capability-based planning, which aims to counter external threats with the best warfighter capabilities deliverable under constrained economic
conditions and uncertainty (Patterson, 2012).
Buying strategies are continuously evolving to place more emphasis on cost in the decision process. With the launch of the Better Buying Power (BBP) initiatives and Weapon Systems Acquisition Reform Act (WSARA), affordability has been mandated as a requirement at all milestone decision points of program development (Carter, 2oioa, 2010b). Designing for affordability is thus imperative to early phase decision-making in the development of weapons systems and programs. Various interpretations of and approaches to designing for affordability are reviewed in the next chapter, and the definition of affordability for the purpose of this thesis is identified.
Efforts to improve cost and schedule estimation are ongoing, but there has been relatively little progress in addressing uncertainties related to costs stemming from alternative futures the system may face. The research described in this thesis is motivated by this latter aspect of uncertainty in the increasingly urgent need of designing for affordability.
1.1.3 Scope
Since the Carter memorandums of 2010, many definitions of affordability have been proposed along with methods intended for use in various phases of the system lifecycle. It is certainly the case that the affordability of any complex system is determined over its entire lifecycle, and its affordability directly depends on many uncontrollable factors as well as the many decisions made during every phase, including design, development, operations, and retirement. This thesis deals exclusively with the early lifecycle phase of conceptual development, what (Hall,
1962) deems the "exploratory planning" phase, in which the problem is defined, objectives are selected, and analysis on potential systems can be performed. In this conceptual development stage, the level of system knowledge (often including knowledge of the operating environment) is very low, but committed costs are low as well, and management leverage over the system is still high. A graphical depiction of these factors taken from (Blanchard & Fabrycky, 2006) is shown below in Figure
100% Management Leverage Cs Committed Knovledge Cost Incurred
Concept Detail Production Use Development Design
Figure 1-3. Qualitative description of system phases and associated factors (Blanchard & Fabrycky 2006).
By designing for affordability from the earliest system phases, architects can set a system up for success in the goal of more affordable solutions. For the purposes of the present work, this goal includes the ability of a system to provide value over its lifecycle, regardless of changing needs and changing operational environments.
1.1.4 Recent Advances in Early-Phase Systems Engineering
Since the early phases of systems design provide the most leverage over the resulting cost and performance of a system, it is only logical that improving the methods used in these stages will result in more favorable system outcomes. The Systems Engineering Advancement Research Initiative (SEAri) at the Massachusetts Institute of Technology (MIT) has been tackling this challenge for over a decade, providing definitions, methods, and metrics to enable more expedited system knowledge, retained leverage of management over system decisions, and potentially lower costs throughout the lifecycle. One of the core concepts in SEAri research is Multi-Attribute Tradespace Exploration (MATE), which results in consideration of overall benefit versus cost for each system concept alternative in a tradespace (Ross &
Hastings, 2004; Ross, 2003). Visually representing the overall aggregate benefit
significantly reduces the cognitive burden associated with decisions over attributes in many dimensions. Perhaps more importantly, though, it provides a foundation
for exploring the tradespace with respect to the assumptions present in the modeling
of systems' performance and costs, as well as assumptions present in stakeholder descriptions of value. Details of the contributors to benefit are still tracked and can be interrogated on demand. By avoiding a single metric to automate the selection of an "optimal" system and by not hiding the tradeoffs of concept alternatives, MATE allows analysts and stakeholders to quickly become acquainted with the traits of a
particular tradespace of enumerated system concepts - or even quickly locate features of a model that do not correspond to features of real systems. Preferences on benefits can be modified and real-time effects displayed on the tradespace, with no additional simulation or model execution required (Ricci, Schaffner, Ross, Rhodes, & Fitzgerald, 2014). All of these features help those who are conducting a conceptual design study to better understand the relationships between perceptions of, and values present in, complex problems and potentially complex system concepts.
Another key benefit of using MATE is that exogenous uncertainties in future system environments can be incorporated relatively easily into the design study, through the implementation of Epoch-Era Analysis (Ross & Rhodes, 2008). Epoch-Era Analysis (EEA) discretizes a system's lifecycle according to value-centric considerations rather than according to traditional system milestones. An epoch is then considered to be any period of fixed operating context and fixed stakeholder needs. An era is an ordered sequence of finite-duration epochs that make up an entire system lifecycle. These constructs allow clearer understanding of the relevant perturbations in the uncertain future that a system may encounter throughout its lifecycle, whether those perturbations impact stakeholder needs (and therefore the perceived value delivery) or the performance of the system (and therefore the value delivery).
Any discussion of a system's uncertain future, of course, inevitably leads to the questions surrounding a system's ability to change in some way. Previous research has examined the topic of changeability in the face of uncertain futures (Fitzgerald, 2012). The Valuation Approach for Strategic Changeability (VASC) method was developed specifically for valuing the future changeability of a system while still in the early design (i.e., conceptual development) phase. It enables this valuation through the use of change-related metrics and the creation of change strategies, which allow automated simulation of changeable designs in many different epochs (periods of fixed context and needs). Two key areas for further research identified in the VASC study include considerations of computational complexity as well as long-term considerations of the use of change options.
The VASC method, along with MATE and Epoch-Era Analysis, all provide activities, products, and analysis for system architects who desire to make more informed design choices early in the lifecycle. All of these methods and constructs for enhanced early-stage conceptual design can greatly aid in tackling the challenge of designing changeably affordable systems, making extensions of these a natural area of research and forming the third factor in the motivation for the present research.
1.2 Research Questions and Methodology
Motivated by the context and factors described in the preceding section, the questions addressed by this research are as follows:
i) Can the affordability of complex systems be better enabled through an early-phase design method that incorporates Multi-Attribute Tradespace Exploration and Epoch-Era Analysis?
2) Can the affordability of changeable systems be better enabled by leveraging
existing path planning approaches to efficiently evaluate long-term change strategies for systems in many possible futures?
3) How can we better capture the considerations related to long-term, path-dependent properties of changeable systems in dynamic operating environments?
Several steps were involved throughout the course of this research over the two years in which it was conducted. The first step was a literature review of recent advances toward the design of affordable defense systems', of the background and purpose of exploratory design models2, and of path-planning approaches used in artificially intelligent systems. Next, preliminary research questions were identified representing areas for further investigation, and development began on the RSC-based Method for Affordable Concept Selection, which was intended to directly address the first research question. The next step included the development of related affordability metrics, and application of the method and metrics to a case study involving a handful of point designs of naval ship concepts. The results of the application of the first eight processes of the method were validated by peer-review, resulting in acceptance to conference proceedings. Finally, the ninth process is introduced in the present work with application to a similar system as the first 8 processes, and is intended to directly address the second and third research
questions.
1.3 Thesis Overview
The overview of the thesis is now described. Chapter 2 is a literature review,
beginning with various definitions of and approaches to affordability. After a brief introduction to some of the considerations with regard to modeling and computational complexity of the activities in the RMACS method, the chapter concludes with a review of the case applications encountered in the thesis. Chapter
'The author was privileged to work alongside Marcus Wu for most of this portion of the research.
3 continues with an in-depth discussion of the basic assumptions inherent in any early-stage predictive modeling effort, including the purposes and limitations of modeling the performance and value parameters of complex future systems. It then identifies the types of models used in the present method, and describes the nine processes in the RSC-based Method for Affordable Concept Selection (RMACS). Chapter 4 performs a case demonstration of the first eight processes of RMACS on the Next-Generation Combat Ship (NGCS) study of a small set of six point designs. Chapter 5 introduces the ninth and final process of RMACS, which is Multi-Era Analysis (MERA). The informational components, both required and optional, are outlined, and the nature of and activities in the process are described in depth. In Chapter 6, MERA is then demonstrated on an NGCS-like case application, adding in discrete change options that form a tradespace network. Chapter 7 discusses several issues arising in the application of the MERA process and the RMACS method, and also identifies many key areas for future work. Finally, Chapter 8 provides concluding thoughts with respect to the original research questions.
2 Literature Review
"Don't only practice your art, but force your way into its secrets."
-Ludwig van Beethoven
This chapter covers a portion of the literature essential to the terminology and to the various constructs and methods used in modern early-stage design of complex systems. The chapter begins with a review of the various interpretations of the concept of "affordability" with respect to defense systems. Issues arising in the use of early-phase system models are reviewed, and the models used in the present work are introduced, including Multi-Attribute Tradespace Exploration (MATE), Epoch-Era Analysis (EEA), and the Valuation Approach to Strategic Changeability (VASC). Enabling techniques used or recommended in this thesis are briefly discussed, including algorithms for multi-dimensional spaces, computational complexity analysis, and tradespace approximation techniques. Finally, the case studies encountered and used in application are covered.
2.1 Affordability Concepts and Definition
Because the word affordability has been frequently used without definition in various and sundry contexts, it is not surprising that several distinct definitions of affordability in defense systems have recently arisen, being proposed by various organizations. The 2010 Carter memorandum defines affordability as "conducting a program at a cost constrained by the maximum resources the Department can allocate for that capability" (Carter, 2oioa, 2010b). INCOSE defines affordability as "the balance of system performance, cost and schedule constraints over the system life while satisfying mission needs in concert with strategic investment and organizational needs" (Affordability Analyses: How do we do it?, 2012). NDIA defines affordability as "the practice of ensuring program success through the balancing of system performance (KPPs), total ownership cost, and schedule constraints while satisfying mission needs in concert with long-range investment, and force structure
plans of the DOD" (NDIA Status Report, 2011). The Defense Acquisition Guidebook
defines affordability as "the degree to which the life-cycle cost of an acquisition program is in consonance with the long-range modernization, force structure and manpower plans of the individual DoD Components, as well as for the Department
as a whole" (Department of Defense, 2011).
In addition to the definitions above, (Bobinis, Haimowitz, Tuttle, & Garrison, 2012) provide the result of development without consideration for affordability: a system
that has been designed as a point solution in isolation, to meet a specific need at a specific time, possibly requiring the procurement of an entirely new system when customer needs evolve.
With regard to helping define affordable decisions, (Tuttle & Bobinis, 2012) describe the Affordability Triangle, with required capabilities (determined by stakeholder needs) forming the base of the triangle, and the affordability decision criteria comprising cost, schedule, and performance. It is clear that examining each of these latter multi-criteria considerations in multi-year, billion-dollar weapons systems and programs adds several layers of complexity to a standard trade study. In addition, Tuttle and Bobinis note that an affordability trade study must "extend the time horizon" of the traditional analyses. In order to extend the time horizon of analysis, any study must address the contextual and capability developments over time, along with their potential impacts to the performance, cost, and schedule of the system (whether the impacts are objective or subjective). The ultimate goal is to design affordable systems that meet the needs of warfighters - and remain affordable
- regardless of future circumstances. This goal can be challenging due to in part to future events that are not trivial developments, but rather wild cards (Mendonea, e Cunha, Kaivo-Oja, & Ruff, 2004), leading to "deep uncertainty" regarding a system's future (Davis & Kahan, 2007). To achieve the goal of affordability in the face of such uncertainties, efforts toward affordability must begin in the earliest phases of system planning, when resource commitments and solution-constraining decisions are not yet present. Performing such analysis at this stage allows design engineers to "see, evaluate, accept and reject a large number of courses of action ...without actually committing resources" (Hall, 1989), potentially elevating system-specific knowledge to better inform the high-impact decisions made at the earliest stages of the system lifecycle. With specific attention to the idea of considering affordable alternatives that can change in response to future developments, Neches and Madni list several technological and modeling challenges, including characterizing changing operational environments in addition to performing tradespace analysis (Neches & Madni, 2013). To include the idea of adaptability, and for the purposes of early-lifecycle conceptual development of such systems, the affordability of a system is defined for this thesis as "the property of becoming or remaining feasible relative to resource needs and resource constraints over time" (Wu, Ross, &
Rhodes, 2014).
2.2 Modeling Considerations
Tradespace analysis, characterization of changing operational environments, and other early-phase design activities all require methods to represent the relevant
portions of reality. This section reviews the established thought on representing these portions of reality (i.e., modeling) and resultantly predicting the outcome of various design choices. First, the types and purposes of models are reviewed, along with more recent developments in modeling the traditionally less-emphasized aspects of complexity in system design. Next, the limitations of modeling unobservable systems are identified. Finally, ramifications of these limitations and recommended approaches are then discussed within the contexts of system design, scenario planning, and solving general complex problems.
2.2.1 Use of Models in System Design
(Ricci et al., 2014) describe the types and purposes of models used in early system design. Model purpose can include prediction of the performance or of the value delivery of a system, while model type is either mental or constructed, depending on where the model resides. (Hall, 1989) describes the choices involved in modeling the value that a system is expected to deliver, and emphasizes the importance of this choice to the overall success of the system design process. (Fischhoff et al., 1991)
describes the spectrum of alternate interpretations that can be assumed in attempting to model the value systems present in decision problems.
(Rhodes & Ross, 2010) describe five types of system complexity in present-day engineering systems that potentially hamper the ability to understand and model a system. Several methods have been proposed to help manage the contextual, temporal, and perceptual complexities in the early phases of system design. One is the use of a constructed value model for system performance attributes based on Multi-Attribute Utility (Keeney & Raiffa, 1976), proposed by (Ross, 2003) in the creation of Multi-Attribute Tradespace Exploration (MATE). Another is Epoch-Era Analysis (EEA), which involves the creation of epochs (periods of fixed context and needs for a system) and eras (an ordered sequence of finite-duration epochs), proposed by (Ross & Rhodes, 2008). A combined application of MATE and EEA was demonstrated with the Responsive Systems Comparison (RSC) method applied to the Satellite Radar System by (Ross, McManus, & Long, 2008; Ross, McManus, Rhodes, Hastings, & Long, 2009). (Richards, 2009), (Fulcoly, 2012), and (Fitzgerald, 2012) all build upon these models with methods and metrics designed to capture the contextual, temporal and behavioral complexities of systems over their lifetimes. (Diller, 2002) captures stakeholder preferences on expense attributes using the Multi-Attribute Expense (MAE) function, analogous to the Multi-Attribute Utility function. (Nickel, 2010) demonstrates the MAE applied to a MATE case study for the Chicago Express Rail.
2.2.2 Accuracy of Models for Complex Future Systems
In Systems Engineering and Analysis, (Blanchard & Fabrycky, 2006) discuss the
accuracy of models and simulations in early-phase complex systems. They emphasize that the models of these systems represent information that cannot be validated, since the system does not yet exist. As a result, the concept of accuracy cannot be invoked for these types of models and simulations, since there exists no referent by which to compare different models. In earlier work on modeling and simulation, (Law & Kelton, 1991) posit the same point, stating that it is impossible to completely validate models of future complex systems, as opposed to models of simple, presently observable processes (e.g., the frequency of arrivals to an existing storefront).
2.2.3 Use of Exploratory Models in System Design
The generation and use of data (that cannot be validated) from predictive models of complex systems cause (Bankes, 1993) to distinguish exploratory models (of complex
and future systems) from consolidative models (of data that can be validated by empirical observation). While consolidative models are intended to use external data to create and store (potentially new) relationships that can explain the data, exploratory models are intended to generate artificial data by creating and storing smaller (relative to the overall system), well-established relationships and allowing them to interact. These exploratory models and artificial data can inform modelers and decision-makers of the ramifications of various sets of assumptions, as well as provide consistent communication and expectations regarding the various aspects involved in the approach to a complex problem. Similarly, (Sarewitz & Pielke Jr, 1999) delineate between model prediction for scientific purposes (i.e., explaining empirical observations) and model prediction used to predict behavior of complex systems of the future. In work on computational scenario planning, (Abbass et al., 2008) point out that the goal of modeling complex systems is not the optimization of some overarching objective function, but rather a means to better understanding a complex problem and better understanding of the complex approaches to that problem. (Sch6n, 1993) describes how immersive experience in questioning assumptions and viewing a problem different ways can lead to sudden insights into problem solving, deeming the useful alternate views "generative metaphors".
2.3 Computational Considerations
The models used in modern system design often reach limits in the amount of information which they can represent and on which they can operate. This section reviews the computational complexities of various models used in the
representations of systems and their evaluations in alternative futures. The first topic reviewed is that of search algorithms for discrete networks, which are used later in the creation of eras of interest as well as era-level strategies. A type of search algorithm for continuous spaces is also reviewed, along with the complexities of several types of combinatorial problems related to computational scenario planning. Finally, methods are discussed to alleviate the computational challenges associated with fully-enumerated tradespaces in fully-enumerated sets of discrete futures.
2.3.1 Search Algorithms for Discrete Networks
In Artificial Intelligence: A Modern Approach, (Russell & Norvig, 2009) summarize
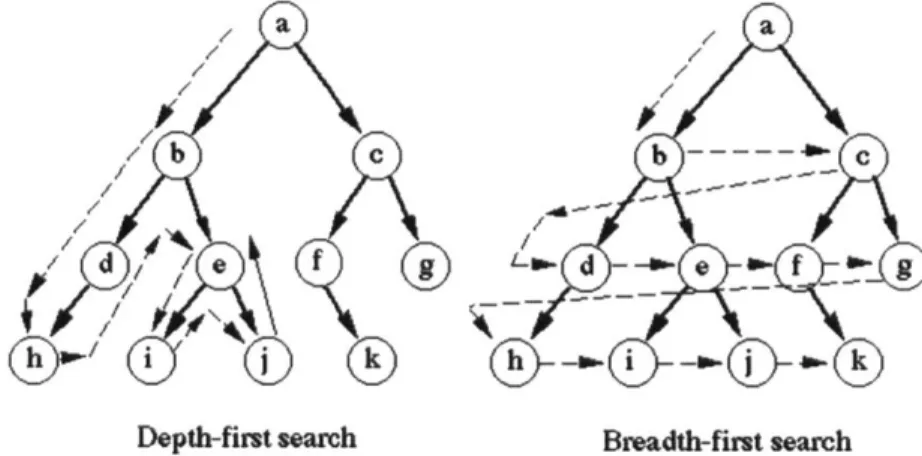
uninformed (or blind) search strategies such as breadth-first search (BFS) and depth-first search (DFS), comparing their worst-case time and spatial computational complexities. "Blind" (or "uninformed") algorithms simply operate on each node and edge in turn, with no knowledge of what might be a "good" direction to take next in the search for the goal node. The difference in order of operations of these two uninformed algorithms is depicted below in Figure 2-1, provided by www.cse.unsw.edu.au.
/a /a
b c b--- I
(d pddd f frnc
Depth-first search Breadth-first search
Figure 2-1. Depth-First Search (DFS) vs. Breadth-First Search (BFS). Courtesy (W, n.d.).
The network structure of the diagrams shown in Figure 2-1 is important to several topics in this thesis, including design changes throughout an era, as well as the temporal and spatial computational complexities of constructing eras. The worst-case complexities of each of the two blind search algorithms are the same, shown below in Table 2-1.
Table 2-1. Worst-case complexities for simple search algorithms on a network, where b=branching factor of the network, and d=depth of the "goal" node in the network.
Network Search Method Worst Time Complexity Worst Space Complexity
Blind (e.g. BFS or DFS) bd bd
Informed (e.g. A*) bd bd
In addition to those of the uninformed algorithms, the complexities of the (informed) best-first search algorithm A* are also shown. A best-first search algorithm has some estimate of distance to the goal (i.e., a heuristic) that it uses in evaluating which edge to traverse next in the search. For example, a common heuristic in physical path-planning of a robot is the straight-line distance to the goal region. This type of heuristic is shown below in Figure 2-2, where the value of the straight-line distance is represented by color. The A* algorithm keeps track of each
node's estimated distance to the goal, and explores first the nodes with the lowest estimates. Before deciding which edge to traverse next in the search, A* will add the heuristic cost of a node (its estimated distance to the goal) to the actual cost to reach that node, and will only traverse the edge if that sum is less than the shortest estimated path found so far. More information on the results from different heuristics operating in different environments can be found on theory.stanford.edu.
Figure 2-2. The nodes (i.e., colored squares) searched by the A* algorithm operating on a discrete grid, starting in the red square (upper left) with the goal node being the blue square (lower right). The heuristic (i.e., estimate of distance to the goal) for each searched square is represented by a color that represents its straight-line distance to the goal region. Courtesy (Patel, n.d.).
2.3.2 Rapidly Exploring Random Trees for Continuous Spaces
Probabilistic roadmaps (PRMs) were introduced in the mid-199o's as a method for path planning in high dimensional configuration spaces (Kavraki & Svestka, 1996).