HAL Id: hal-02635591
https://hal-amu.archives-ouvertes.fr/hal-02635591
Submitted on 2 Jun 2020
HAL is a multi-disciplinary open access archive for the deposit and dissemination of sci-entific research documents, whether they are pub-lished or not. The documents may come from teaching and research institutions in France or abroad, or from public or private research centers.
L’archive ouverte pluridisciplinaire HAL, est destinée au dépôt et à la diffusion de documents scientifiques de niveau recherche, publiés ou non, émanant des établissements d’enseignement et de recherche français ou étrangers, des laboratoires publics ou privés.
WNK-SPAK/OSR1 mediated phosphorylation of KCC2
and NKCC1
Jinwei Zhang, Antje Cordshagen, Igor Medina, Hans Gerd Nothwang, Jacek
Wisniewski, Michael Winklhofer, Anna-Maria Hartmann
To cite this version:
Jinwei Zhang, Antje Cordshagen, Igor Medina, Hans Gerd Nothwang, Jacek Wisniewski, et al.. Staurosporine and NEM mainly impair WNK-SPAK/OSR1 mediated phosphorylation of KCC2 and NKCC1. PLoS ONE, Public Library of Science, 2020, 15 (5), pp.e0232967. �10.1371/jour-nal.pone.0232967�. �hal-02635591�
RESEARCH ARTICLE
Staurosporine and NEM mainly impair
WNK-SPAK/OSR1 mediated phosphorylation of
KCC2 and NKCC1
Jinwei ZhangID1,2, Antje Cordshagen3, Igor Medina4, Hans Gerd Nothwang3,5,6, Jacek R. Wisniewski7, Michael WinklhoferID5,8, Anna-Maria HartmannID3,5*
1 Hatherly Laboratories, Medical School, College of Medicine and Health, Institute of Biomedical and Clinical
Sciences, University of Exeter, Exeter, United Kingdom, 2 Xiamen Cardiovascular Hospital, School of Medicine, Xiamen University, Xiamen, China, 3 Division of Neurogenetics, School of Medicine and Health Sciences, Carl von Ossietzky University Oldenburg, Oldenburg, Germany, 4 INSERM (Institut National de la Sante´ et de la Recherche Me´dicale) Unite´ 1249, INMED (Institut de Neurobiologie de la Me´diterrane´e), Aix-Marseille University UMR 1249, Aix-Marseille, France, 5 Research Center for Neurosensory Sciences, Carl von Ossietzky University Oldenburg, Oldenburg, Germany, 6 Center of Excellence Hearing4all, Carl von Ossietzky University Oldenburg, Oldenburg, Germany, 7 Department of Proteomics and Signal
Transduction, Biochemical Proteomics Group, Max-Planck-Institute of Biochemistry, Martinsried, Germany,
8 Institute for Biology and Environmental Sciences IBU, Carl von Ossietzky University of Oldenburg,
Oldenburg, Germany
*anna.maria.hartmann@uol.de
Abstract
The pivotal role of KCC2 and NKCC1 in development and maintenance of fast inhibitory neurotransmission and their implication in severe human diseases arouse interest in post-transcriptional regulatory mechanisms such as (de)phosphorylation. Staurosporine (broad kinase inhibitor) and N-ethylmalemide (NEM) that modulate kinase and phosphatase activi-ties enhance KCC2 and decrease NKCC1 activity. Here, we investigated the regulatory mechanism for this reciprocal regulation by mass spectrometry and immunoblot analyses using phospho-specific antibodies. Our analyses revealed that application of staurosporine or NEM dephosphorylates Thr1007of KCC2, and Thr203, Thr207and Thr212of NKCC1. Dephosphorylation of Thr1007of KCC2, and Thr207and Thr212of NKCC1 were previously demonstrated to activate KCC2 and to inactivate NKCC1. In addition, application of the two agents resulted in dephosphorylation of the T-loop and S-loop phosphorylation sites Thr233 and Ser373of SPAK, a critical kinase in the WNK-SPAK/OSR1 signaling module mediating phosphorylation of KCC2 and NKCC1. Taken together, these results suggest that reciprocal regulation of KCC2 and NKCC1 via staurosporine and NEM is based on WNK-SPAK/OSR1 signaling. The key regulatory phospho-site Ser940of KCC2 is not critically involved in the enhanced activation of KCC2 upon staurosporine and NEM treatment, as both agents have opposite effects on its phosphorylation status. Finally, NEM acts in a tissue-specific manner on Ser940, as shown by comparative analysis in HEK293 cells and immature cultured hippo-campal neurons. In summary, our analyses identified phospho-sites that are responsive to staurosporine or NEM application. This provides important information towards a better understanding of the cooperative interactions of different phospho-sites.
a1111111111 a1111111111 a1111111111 a1111111111 a1111111111 OPEN ACCESS
Citation: Zhang J, Cordshagen A, Medina I,
Nothwang HG, Wisniewski JR, Winklhofer M, et al. (2020) Staurosporine and NEM mainly impair WNK-SPAK/OSR1 mediated phosphorylation of KCC2 and NKCC1. PLoS ONE 15(5): e0232967. https://doi.org/10.1371/journal.pone.0232967
Editor: Jean-Claude Dussaule, Hopital Tenon,
FRANCE
Received: November 26, 2019 Accepted: April 24, 2020 Published: May 15, 2020
Copyright:© 2020 Zhang et al. This is an open access article distributed under the terms of the Creative Commons Attribution License, which permits unrestricted use, distribution, and reproduction in any medium, provided the original author and source are credited.
Data Availability Statement: All relevant data are
within the manuscript and its Supporting Information files.
Funding: This work was supported by the
Deutsche Forschungsgemeinschaft (grants NO428/14-1 to H.G.N; and HA 6338/2-1 to A.-M. H). The work was further funded by Max-Planck Society for the Advancement of Science by the German Research Foundation (DFG/Gottfried Wilhelm Leibniz Prize to J.R.W.) and the National Natural Science Foundation of China (No.
Introduction
The cation chloride cotransporter family (CCCs) consists of electroneutral secondary active cotransporters that mediate the symport of cations (Na+and K+) coupled with chloride ions (Cl-) across the plasma membrane. CCCs are divided into K+-Cl-outward cotransporters (KCC1-4), Na+, K+, Cl-inward cotransporters (NKCC1-2, NCCs), the polyamine transporter CCC9, and the CCC-interacting protein CIP1 [1–3]. These transporters play a crucial role in various physiological processes like regulation of cell volume, directional ion transport across epithelial cells, secretion of K+, and regulation of intracellular Cl−concentration ([Cl-]i) in
neu-rons [2,4–11].
In neurons, KCC2 and NKCC1 are involved in the development and maintenance of inhibitory neurotransmission. For instance, KCC2 generates a low [Cl-]irequired for fast
inhibitory neurotransmission. Binding ofγ-aminobutyric acid (GABA) or glycine to their receptors, which are ligand-gated Cl-channels, leads to a Cl-influx and therefore hyperpo-larization [8,12]. By contrast, NKCC1 is more prevalent in immature inhibitory neurons. There, its action results in a high [Cl-]icausing GABA or glycine to elicit a depolarizing
action that opens L-type voltage-gated Ca2+channels necessary for proper synapse forma-tion [13–18].
The physiological relevance of the two cotransporters is corroborated by the phenotypes present in knockout mice. Mice with disruption of the geneSlc12a5 encoding both KCC2
iso-forms (KCC2a and KCC2b), die shortly after birth due to motor deficits [19,20]. Furthermore, dysfunction of KCC2 is associated with neurological and psychiatric disorders including epi-lepsy, neuropathic pain, spasticity, ischemic insults, brain trauma, schizophrenia, and autism [21–32]. Mice with disruption ofSlc12a2 (NKCC1) are viable, but suffer from peripheral
deaf-ness, postnatal hyperexcitability and anti-convulsant, pain perception and male infertility [33–
36]. Inhibition of KCC2 promotes formation of pathological conditions whereas inhibition of NKCC1 seems to prevent or at least alleviate pathological phenotypes [37]. This renders these two transporters a prime pharmacotherapeutic target and fosters interest in understanding posttranslational mechanisms of their regulation [12,38–40]. The main focus is set on phos-pho-related mechanisms. The broad kinase inhibitor staurosporine was used to enhance KCC2 transport activity in immature auditory brainstem [41] and hippocampal cultured neu-rons [42], and to decrease NKCC1 activity [43–46]. Furthermore, N-ethylmaleimide (NEM), that likely modulates the activity of kinases and phosphatases, activates KCC2 [47–50] and inhibits NKCC1 [45,51]. Thus, both compounds reciprocally regulate KCC2 (activation) and NKCC1 (inhibition). Understanding their mode of action provides the basis for further phar-macological studies and important insight into the molecular mechanisms involved in physio-logical regulation of these two transporters.
Since KCC2 and NKCC1 are present in the same neuronal populations but transport K+ and Cl-in opposite direction [52–54], regulatory mechanisms are required to coordinate their activity [4,38,55–60]. Indeed, several kinases and phosphatases regulate their transport activ-ity.In vitro and in vivo analyses revealed that members of the with-no-lysine kinase (WNKs)
family in combination with their downstream targets STE20/SPS1-related proline/alanine rich kinase (SPAK) and oxidative stress response kinase (OSR1) are the most prominent kinases that regulate KCC2 and NKCC1 activity in a reciprocal way. SPAK/OSR1, activated by WNK1, phosphorylate Thr6and Thr1007of KCC2 [48,59,61–64]. WNKs also interact with a yet unknown kinase to phosphorylate Thr906of KCC2 [48,63]. Site-directed mutagenesis stud-ies indicate that simultaneous mutation of Thr906and Thr1007to alanine (mimicking the dephosphorylated state) activates KCC2 [61,65–67]. WNK/SPAK/OSR1 also phosphorylates the N-terminal residues Thr203, Thr207, Thr212and Thr217of NKCC1 [38,59,60,68–76]
81970238 to J.Z.). The funders had no role in study design, data collection and analysis, decision to publish, or preparation of the manuscript.
Competing interests: The authors have declared
thereby activating NKCC1 [72,75]. Thus dephosphorylation (KCC2) and phosphorylation (NKCC1) of WNK/SPAK/OSR1 specific phospho-sites enhance KCC2 and NKCC1 activity.
Phosphorylation can also enhance KCC2 activity. Phosphorylation of Ser932, Thr934, Ser937, or the protein kinase C (PKC) site Ser940, all residing in exon 22, increases its transport activity [47,68,77]. The multiplicity of phosphorylation/dephosphorylation sites on KCC2 offers a complex toolbox to gradually fine-regulate its activity and integrate different signaling path-ways [4,40,65,68].
Initially, both staurosporine and NEM were thought to act through a similar mechanism [47], but recent findings revealed that they act differentially on specific KCC2 phospho-sites [40]. Furthermore, staurosporine and NEM mediated effects involve both KCC2 phosphoryla-tion and dephosphorylaphosphoryla-tion [40,48]. To gain insight into their mode of action, we analyzed the impact of these compounds on phosphorylation of specific KCC2 and NKCC1 phospho-sites using large-scale phosphoproteomics studies and phospho-site specific antibodies in sta-bly transfected HEK293 cells and immature primary cultures of hippocampal neurons.
Material and methods
Cell culturing of HEK293 cells
For K+-Cl-cotransporter activity measurements, stably transfected rat KCC2b HEK293 cells (HEKrnKCC2b) [55] were plated in a 0.1 mg/ml poly-L-lysine coated black-well 96 well culture dish (Greiner Bio-One, Frickenhausen, Germany) at a concentration of 100,000 cells/well. The remaining cells were plated on a 0.1 mg/ml poly-L-lysine-coated class coverslip and ~18 h later analyzed by immunocytochemistry.
Primary cultures of rat hippocampal neuron
All animal procedures were carried out in accordance with the European Union Directive of 22 September (2010/63/EU). The protocol was approved by the INSERM Local committee (Number 0287.01, delivered by Ministère de l’Education et de la Recherche). Hippocampi from 18-day-old rat embryos were dissected and dissociated using trypsin (0.05%) and plated in 60-mm culture dishes at a density of 100,000 cells cm−2in minimal essential medium (MEM) supplemented with 10% NU serum (BD Biosciences, Le Pont de Claix, France), 10 mM glucose, 1 mM sodium pyruvate, 2 mM glutamine, and 100 U ml−1 penicillin–streptomy-cin as previously described [78]. On day 7 of culture incubation, half of the medium was changed to MEM with 2% B27 supplement (Invitrogen). 24 h prior to plating, dishes were coated with poly-ethylenimine (5μg/ml).
Immunocytochemistry
For immunocytochemistry, all steps were performed at room temperature. HEK293 cells grown on poly-L-lysine-coated coverslips were fixated for 10 min with 4% paraformaldehyde in 0.2 M phosphate buffer (PBS). After three washing steps in PBS, cells were incubated with blocking solution (2% bovine serum albumin, 10% goat serum in PBS) for 30 min. Primary antibody solution (anti-KCC2 N1-12; 1:1,000; Neuromab, Carlifornia, USA) was added in car-rier solution (0.3% Triton X-100, 1% bovine serum albumin, 1% goat serum in PBS) for 1 h. After washing three times in PBS, the secondary antibody, which was conjugated to a fluores-cent probe (Alexa Fluor 488 goat anti-mouse; 1:1,000; Thermo Fisher Scientific, Bremen, Ger-many) was incubated for 1 h. After three washes in PBS, cells were mounted onto glass slides with Mowiol (Roth, Karlsruhe, Germany) and DAPI (Roth; 1:1,000). Photomicrographs were
taken using Biozero BZ-8100E (Keyence, Neu-Isenburg Deutschland) fluorescence micro-scope (Leica, Wetzlar, Germany).
Determination of K
+-Cl
-cotransport
KCC2 transport activity was determined by Cl−dependent uptake of Tl+in HEK293 cells as previously described [47,79,80]. To initiate the flux measurement, the medium in the 96-well culture dish was replaced by 80μl preincubation buffer (100 mM N-methyl-D-glucamine-chloride, 5 mM HEPES, 5 mM KCl, 2 mM CaCl2, 0.8 mM MgSO4, 5 mM glucose, pH 7.4, 160
mmol / kg± 2,04 mmol/kg) supplemented with 2 μM FlouZin-2 AM dye (Thermo Scientific, Bremen, Germany) plus 0.2% (wt/vol) Pluronic F-127 (Thermo Scientific, Bremen, Germany) and incubated for 48 min at room temperature. Cells were then washed 3 times with 80μl pre-incubation buffer and incubated for 15 min with 80μl preincubation buffer plus 0.1 mM oua-bain to block Na+/K+ATPase activity. Three technical and five biological replicates were performed for each construct. Afterwards, the 96-well plate was placed into a fluorometer (Fluoroskan Accent, Thermo Scientific, Bremen, Germany) and each well was injected with 40μl 5 x Tl+stimulation buffer (12 mM Tl2SO4, 100 mM NMDG, 5 mM Hepes, 2 mM KCl, 2
mM CaCl2, 0.8 mM MgSO4, 5 mM glucose, pH 7.4; 175 mmol/kg± 2 mmol/kg). Fluorescence
was determined in a kinetic dependent manner (excitation 485 nm, emission 538 nm, 1 frame in 5 s in a 200 s time span) across the entire cell population in a single well. By using linear regression of the initial values of the slope of Tl+-stimulated fluorescence increase, transport activity was calculated [79,80].
To determine the dose-response profile, increasing concentration of staurosporine (8– 80μM) and NEM (25–3000 μM) were applied to the preincubation buffer 15 min prior flux measurement. This was done for three technical replicates and at least five independent mea-surements were performed.
Statistical analyses
The majority of data populations illustrated in Figs1,3and4showed non-normal distribu-tions (verified using Shapiro-Wilk normality test at 0.05 significance level). Therefore, a non-parametric test (Wilcoxon-Mann-Whitney rank sum test) was employed for the comparison between different groups of data. The resultingp-values were adjusted with the Bonferroni
correction for multiple testing. Note that onlyp-values < 0.01 were considered to reduce the
chances of false positives (type I errors). The sample size n always refers to the number of bio-logical replicates (independent preparations). The activity of each independent preparation was determined as mean over three technical replicates. The average scatter within technical replicates was 3 times smaller than the scatter across biological replicates for a given treatment.
For dose-response analyses, we used the nls function from the stats package in R (version 3.5.1) to model the data points with the Hill-Langmuir equation,
y x; EDð 50;n; ysatÞ ¼y0þysat
xn
ED50
nþxn; ð1Þ
wherey is the Tl+uptake of HEKrnKCC2bcells,y0is the Tl+independent-baseline activity (y0=
100%),ysatis the maximum activity (equivalent to Vmaxin reaction rate equation) relative to
baseline,x is the concentration of the agonist, n is the Hill coefficient, and ED50is the agonist
concentration that produces 50% of the saturation response. The 95% confidence intervals for the dose response curves were determined with the function NonlinearModelFit [“MeanPre-dictionBands”] in Wolfram Mathematica. For the boxplots, the box extends from the upper (Q1) to the lower (Q3) quartile. The line inside the box represents the median. The whiskers
extend to the outermost data point that falls within upper inner and lower inner Quartile fences [Q1+1.5(IQR)] and [Q3-1.5(IQR)], respectively, where IQR = Q1-Q3 is the interquar-tile range.
Treatment of stably transfected HEK
rnKCC2bcells and hippocampal
neurons
For mass spectrometry and immunoblot analyses, stably transfected HEKrnKCC2bcells [55] were grown in 75 cm2cell-culture flask. Cells were washed with 5 ml flux hypotonic preincu-bation buffer (100 mM N-methyl-D-glucamine-chloride, 5 mM HEPES, 5 mM KCl, 2 mM CaCl2, 0.8 mM MgSO4, 5 mM glucose, pH 7.4; 160 mmol/kg±2,04 mmol/kg) and then treated
with or without 8μM staurosporine or 1 mM NEM. Cells were centrifuged at 500 rpm for 3 min and the resulting pellets used for immunoblot analyses or mass spectrometry analyses.
For immunoblot analyses of immature (9 daysin vitro, (DIV)) rat hippocampal neurons,
half of the media from culture dishes containing neurons (2.5 ml from each dish) was collected to prepare samples including 16μM staurosporine (from 10 mM stock solution in DMSO), 1 mM NEM (by direct dissolving of the NEM powder) or DMSO (vehicle, same volume as for staurosporine), respectively. The samples were distributed dropwise into the culture dishes that gave final concentration of 8μM staurosporine or 0.5 mM NEM and cultures were incu-bated 15 min at 37 ˚C (5% CO2). After incubation, neurons were rinsed twice with Hanks’
Bal-anced Salt solution (HBSS, ThermoFisher Scientific) precooled to 4 ˚C. The rinsage solution was replaced with ice-cold HBSS containing a cocktail of protease and phosphatase inhibitors (ThermoFisher Scientific) and neurons rapidly scraped and centrifuged at 4 ˚C (10,000 g, 3 min). Pellets were frozen in liquid nitrogen and kept for future analyses at -80 ˚C.
Multi-Enzyme Digestion Filter Aided Sample preparation (MED FAS)
For mass spectrometry analyses, cell pellets of untreated, staurosporine or NEM treated HEKrnKCC2bcells were lysed in 2% SDS in 0.1 M Tris-HCl, pH 8.0, containing 0.1 M DTT as described previously [81]. Total protein was determined using WF-assay in micro-titer plate format [82]. Aliquots of the cell lysate containing 1–2 mg were processed in Amicon Ultra 15 Ultracel 30k (Merck Millipore, Darmstadt) devices as described previously [83] with several modifications using the MED FASP method [84]. Briefly, SDS and other low molecular weight material were removed by centrifugation at 4,000 xg in 5 consecutive washes with UA buffer
containing 8 M urea (ultrapure, Merck, Darmstadt) in 0.1 M Tris pH 8. Following two washes with 5 ml of 0.1M Tris-HCl, pH 8 (DB buffer), 20μg of LysC (Wako, Neuss) in 0.5 mL of DB was added to the filter. Samples were digested overnight at 37 ˚C and peptides were collected by centrifugation. Next, the material retained in the filter was cleaved with 10μg trypsin in 0.5 ml DB at 37 ˚C for 4 h and the peptides were eluted as previously. To increase the yield of pep-tides, filters were washed twice with 0.5 mL DB. Concentration of peptides was determined by WF-assay [82].
TiO
2-based enrichment of phosphopeptides
Phosphopeptides were enriched using TiO2-beads [85] with several modifications [83]. Briefly,
25 mg of ‘Titansphere TiO210μm’ (GL Sciences, Inc., Japan) were suspended in 50 μl of 3%
(m/v) dihydroxybenzoic acid in 80% (v/v) CH3CN, 0.1% CF3COOH and diluted 1:4 with
water before use. Ten microliters of this slurry (1 mg beads) were added and samples incu-bated under continuous agitation for 20 min. The mass ratio of the beads and peptides was 3:1. Then, the titanium beads were sedimented by centrifugation at 5,000 xg for 1 min and the
above. The bead-pellets were resuspended in 150μl of 30% (v/v) CH3CN containing 3% (v/v)
CF3COOH and transferred to a 200μl pipet tip plugged with one layer of glass microfiber filter
GFA (Whatman). The beads were washed three times with 30% (v/v) CH3CN, 3% CF3COOH
(v/v) solution and three times with 80% CH3CN (v/v), 0.3% CF3COOH (v/v) solution. Finally,
the peptides were eluted from the beads with 100μL of 40% CH3CN (v/v) containing 15%
NH4OH (m/v) and were vacuum-concentrated to *4μl.
Mass-spectrometric analysis
Analysis of peptide mixtures was conducted using a QExactive HF-X mass spectrometer (Thermo-Fisher Scientific, Palo Alto). Aliquots containing <1μg of total peptide were chro-matographed on a 50 cm column with 75μm inner diameter packed C18material. Peptide
separation occurred at 300 nl/min for 95 min using an acetonitrile gradient of 5–30%. The temperature of the column oven was 55˚C. The mass spectrometer operated in data-dependent mode with survey scans acquired at a resolution of 60,000. Up to the top 15 most abundant tope patterns with charge � +2 from the survey scan (300–1650 m/z) were selected with an iso-lation window of 1.4 m/z and fragmented by HCD with normalized collision energies of 25. The maximum ion injection times for the survey scan and the MS/MS scans were 20 and 28 ms, respectively. The ion target value for MS1 and MS2 scan modes was set to 3×10⁶and 105, respectively. The dynamic exclusion was 30 s. The MS spectra were searched using MaxQuant software. A maximum of two missed cleavages was allowed. The maximum false peptide and protein discovery rate was specified as 0.01. The whole mass spectrometry analyses were per-formed in three technical and two biological replicas per treatment.
Immunoblot and phospho-antibody immunoprecipitation analyses
Lysate protein samples were subjected to immunoblot and immunoprecipitation as previously described [63]. Protein samples (40μg) were boiled in sample buffer for 5 min, resolved by 7.5% sodium dodecyl sulfate polyacrylamide-gel electrophoresis and electrotransferred onto a polyvinylidene difluoride membrane. Membranes were incubated for 30 min with TBST (Tris-buffered saline, 0.05% Tween-20) containing 5% (w/v) skim milk. Blots were then washed six times with TBST and incubated for 1 h at room temperature with secondary HRP-conjugated antibodies diluted 5000-fold in 5% (w/v) skim milk in TBST. After repeating the washing steps, signals were detected with enhanced chemiluminescence reagent. Immunoblots were developed using ChemiDoc™ Imaging Systems (Bio-Rad, Feldkirchen). Figures were generated using Photoshop/Illustrator (Adobe). Band densities of bands were measured with ImageJ. Calculation of intensity ratios is based on (phospho-dimeric KCC2 + phospho-monomeric KCC2) / (total dimeric KCC2 + total monomeric KCC2), (total dimeric KCC2 + total mono-meric KCC2)/β-actin or tubulin, SPAK pThr233
/SPAK, SPAK pSer373/SPAK, SPAK/β-actin or tubulin, NKCC1 pThr203,207,212/NKCC1, NKCC1/β-actin or tubulin, as reported previously [66]. Mann–Whitney U-test was used for comparison between 2 independent groups and Wil-coxon matched pairs test was employed to compare paired data (GraphPad Prism 7.0, San Diego, CA, USA).
For phospho-antibody immunoprecipitation, KCC isoforms were immunoprecipitated from indicated cell extracts. 2 mg of the indicated clarified cell extract was mixed with 15μg of the indicated phospho-specific KCC antibody conjugated to 15μl of protein-G–Sepharose, in the added presence of 20μg of the dephosphorylated form of the phosphopeptide antigen, and incubated 2 hours at 4 ˚C with gentle shaking. Immunoprecipitates were washed three times with 1 ml of lysis buffer containing 0.15 M NaCl and twice with 1 ml of buffer A. Bound pro-teins were eluted with 1x LDS sample buffer.
Antibodies
The following antibodies were purchased from Division of Signal Transduction Therapy Unit at the University of Dundee: KCC2A phospho-Thr906(SAYTYER(T)LMMEQRSRR [residues 975–989 of human KCC3A] corresponding to SAYTYEK(T)LVMEQRSQI [resi-dues 899–915 of human KCC2A], S959C); KCC2A phospho-Thr1007(CYQEKVHM(T) WTKDKYM [residues 1032–1046 of human KCC3A] corresponding to TDPEKVHL(T) WTKDKSVA [residues 998–1014 of human KCC2A], S961C); SPAK/OSR1 (T-loop) phos-pho-Thr233/Thr185antibody (226–238 of human SPAK or residues 178–190 of human OSR1, TRNKVRKpTFVGTP, S204C); SPAK/OSR1 (S-motif) phospho-Ser373/Ser325antibody (367– 379 of human SPAK, RRVPGSpSGHLHKT, which is highly similar to residues 319–331 of human OSR1 in which the sequence is RRVPGSpSGRLHKT, S670B); SPAK (427–443 of human SPAK, QSLSVHDSQGPPVGTP, S849C); NKCC1 phospho-Thr203+Thr207+Thr212 (residues 198–217 of human NKCC1, HYYYDpTHTNpTYYLRpTFGHNT, S763B); NKCC1 phospho-Thr212/Thr217(residues 208–223 of human NKCC1, YYLRpTFGHNpTMDAVPR, S063D); NKCC1-total antibody (residues 1–260 of shark NKCC1, S841B). Pan-KCC2 anti-body (residues 932–1043 of human KCC2) was from NeuroMab (73–013). KCC2 phospho-Ser940 antibody was from ThermoFisher Scientific (PA5-95678). PKCδ phospho-Thr505
antibody (9374) andβ-Actin (D6A8) antibody (12620) were from Cell Signaling Technology. Anti (neuronal)-β-Tubulin III antibody was from Sigma-Aldrich (T8578). Secondary anti-bodies coupled to horseradish peroxidase used for immunoblotting were obtained from Pierce. IgG used in control immunoprecipitation experiments was affinity-purified from pre-immune serum using Protein G-Sepharose.
Results
Dose-response analyses of staurosporine and NEM in stably transfected
HEK
rnKCC2bcells
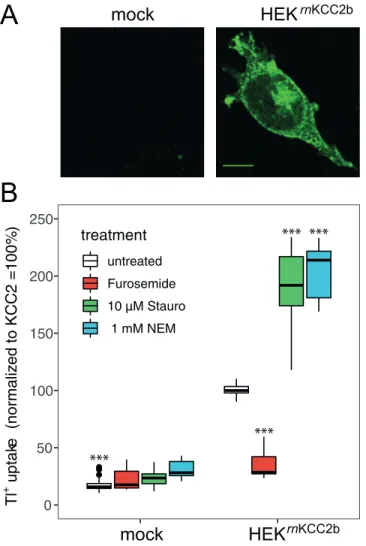
Staurosporine and NEM generally activate KCCs [40,47,86,87]. To closer characterize their mode of action, we used stably transfected HEKrnKCC2bcells, as high amount of the cotran-sporter is advantageous for subsequent biochemical analyses. Immunoreactivity of HEKrnKCC2bcells against KCC2 was detected in all cells with clear labeling at the cell mem-brane and cytosol (Fig 1A). This is in agreement with previous cell surface expression analyses that detected 11.8± 1.4% of total KCC2 in stably transfected rnKCC2b at the cell surface [79].
To quantify the impact of staurosporine and NEM onrnKCC2b transport activity, Tl+flux measurements were performed [79,80,88]. Transport activity in HEKrnKCC2bcells was 5.6 times higher compared to background (HEKrnKCC2b100%± 5.32%; mock; 17.7% ± 5.5%;
p = 4.3x10⁻⁵; n = 5) (Fig 1B). Here and elsewhere in the text, numbers indicate mean +/- SD,p
was determined using Wilcoxon-Mann-Whitney rank sum test. Treatment with 10μM staur-osporine or 1 mM NEM resulted in an approximately twofold increase ofrnKCC2b activity
compared to untreated HEKrnKCC2bcells (staurosporine: 187.5%± 37.1%, p = 3x10⁻³; NEM: 204%± 23.2%; p = 3x10⁻³). The loop diuretics furosemide, that specifically inhibits the func-tion of cafunc-tion chloride cotransporters [89,90], significantly inhibited the function ofrnKCC2b
(34.7± 12.2%, p = 4 x10⁻⁵).
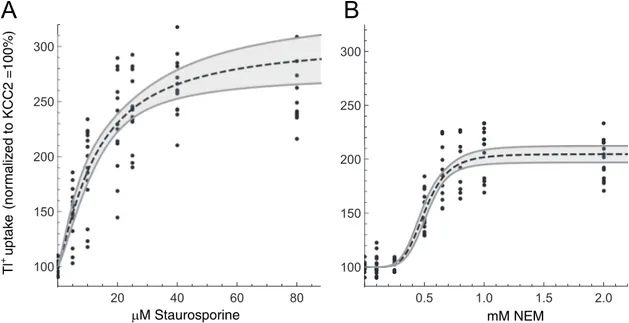
Next, we determined the dose-response relationships of staurosporine and NEM on
rnKCC2b transport activity by treating HEKrnKCC2bcells with different concentrations of staurosporine (5–80μM) or NEM (25–3,000 μM).Fig 2represents the dose-response curve for both agents. The dose-response curve for staurosporine (Fig 2A) was approximately a rectan-gular hyperbola (n � 1, not significantly different from unity). This reflects Michaelis-Menten
kinetics and suggests absence of cooperative effects. In contrast, the dose response curve for NEM (Fig 2B) had a pronounced sigmoidal shape (n � 5), which reflects cooperative binding
kinetics. The effective dose ED50(representing the potency) for staurosporine of stably
trans-fected HEKrnKCC2bwas 12.8± 4.9 μM and the maximal efficacy (Emax) was 205± 40%. The
ED50value for NEM was 0.5± 1.3 mM and Emaxwas 105± 6%. For further analyses, we used a
concentration of 8μM staurosporine and 1 mM NEM, if not indicated otherwise as these con-centrations significantly increase KCC2b transport activity.
Identification of CCC phosphorylation sites in stably transfected
HEK
rnKCC2bcells by mass spectrometry analyses upon treatment with
staurosporine or NEM
Phosphoproteomics by mass spectrometry has the advantage of providing an unbiased survey of phospho-sites. Therefore, we here used for the first time this technique to gain insight on Fig 1. Staurosporine and NEM increase KCC2 activity. A: Immunoreactivity of stably transfected HEKrnKCC2bcells was detected with labeling at the cell membrane and cytosol. Photomicrographs were taken with a confocal laser-scanning microscope. Scale bar, 10μm. B: Transport activity of rnKCC2b was determined by Tl+
flux measurements. Treatment with 10μM staurosporine or 1 mM NEM resulted in an approximately twofold increase of rnKCC2b activity. Application of the loop diuretics furosemide (2 mM) significantly inhibitedrnKCC2b function. The graph
represents the data of at least five independent measurements (each consisting of three technical replicates) normalized tornKCC2b. Statistical analyses:���,p < 0.001 versus HEKrnKCC2b; Error bars represent SD.
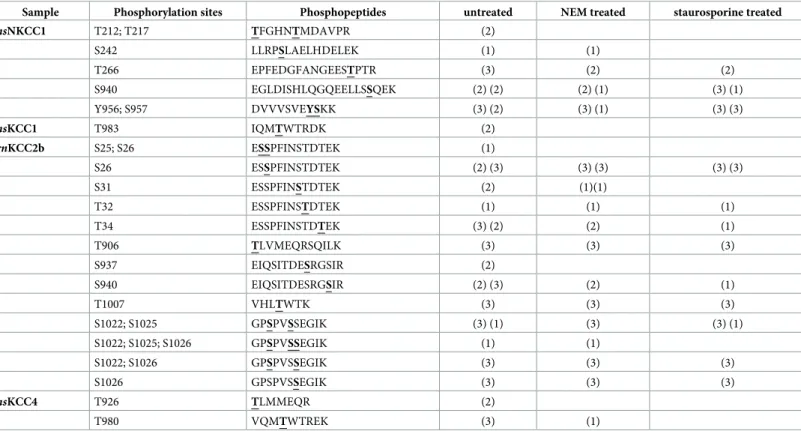
the impact of staurosporine and NEM onrnKCC2b phospho-sites in HEKrnKCC2b. For each condition, two biological and three technical replicas were performed. Phospho-sites detected in at least one technical experiment are listed inTable 1. We first mapped KCC2b phospho-sites in untreated HEKrnKCC2bcells. Twelve phospho-sites were identified: Ser25, Ser26, Ser31, Thr32, Thr34in the cytoplasmic N-terminus and Thr906, Ser937, Ser940, Thr1007, Ser1022, Ser1025, and Ser1026in the C-terminus (Table 1, untreated). These sites include all phospho-sites already present in PhosphositePlus (Table 2) [91]. Recently phosphoproteomic data deposited in Phosida and Phosphosite plus revealed that rat KCC2b tissue only harbors seven phospho-sites (Table 2). Thus, we here report five phospho-sites (Ser25, Thr32, Thr906, Ser937and Thr1007) that were so far only reported for mouse but not rat KCC2 tissue (Table 2). These sites most likely reflect different expression of kinases and phosphatases in different tissues (HEK293 vs. rat brain tissue) [69] or increased detection rate in stably transfected HEKrnKCC2b cells.
As KCC1, KCC4, and NKCC1 are endogenously expressed in HEK293 cells and as mass spectrometric analysis provides data on most proteins in a given sample, we also investigated phosphorylation sites of the following proteins:hsKCC1 (Thr893, analogous tornKCC2b
Thr1007),hsKCC4 (Thr926and Thr980, analogous tornKCC2b Thr906and Thr1007) and
hsNKCC1 (Thr212, Thr217, Ser242, Thr266, Thr268, Ser940, Tyr956, and Ser957). These phospho-sites were already previously deposited in PhosphositePlus and Phosida (S1–S3Tables). Over-all, we detected only a low proportion of all so far deposited phospho-sites for these three cotransporters. This might reflect low expression levels in HEK293 cells.
Next, we investigated the phosphorylation pattern ofrnKCC2b upon staurosporine and
NEM treatment. Phosphorylation at Ser26, Thr32, Thr34, Thr906, Ser940, Thr1007, Ser1022, Ser1025, Ser1026ofrnKCC2b were still present upon treatment with staurosporine or NEM, whereas
Fig 2. Dose-response relationship of staurosporine and NEM on KCC2 transport activity. HEKrnKCC2bcells were treated with
different concentrations of staurosporine (5–80μM; A) or NEM (25–3,000 μM; B) for 15 min. Transport activity of rnKCC2b was determined by Tl+flux measurements. Treatment with staurosporine resulted in a classical Michaelis-Menden curve, whereas NEM treatment showed a sigmoidal curve with a Hill coefficient of 5.2± 1.3 indicating a positive cooperative effect on rnKCC2b. The graph represents the data of at least five independent measurements (each consisting of three technical replicates) normalized to untreated HEKrnKCC2b.
phosphorylation of Ser25and Ser937was not detected anymore in either of the two conditions (Table 1). Additionally, no phosphorylation was detected for Ser31after treatment with staurosporine.
Regarding endogenously expressed CCCs, the phospho-site Thr983ofhsKCC1 (analogous
tornKCC2b Thr1007), Thr926ofhsKCC4 (analogous to rnKCC2b Thr906) and Thr212/217and Thr266/268ofhsNKCC1 could not be detected upon application of either of the two reagents.
Additionally, the phospho-sites Thr980ofhsKCC4 (analogous to rnKCC2b Thr906) and Ser242 ofhsNKCC1 were not detected anymore after staurosporine treatment. The phospho-sites
Thr266, Ser940and Tyr956/Ser957ofhsNKCC1 were still present upon treatment with
stauros-porine and NEM.
Several kinases were described to directly phosphorylate KCC2 and NKCC1. This includes kinases of the WNK-SPAK/OSR1 and PKC mediated phosphorylation pathways. To gain fur-ther insight into the regulatory phosphorylation mechanism, we explored their phosphoryla-tion pattern as well. We detected several phosphorylaphosphoryla-tion sites inhsWNK1, hsWNK2, and hsSPAK [69,93,94] (Table 3). Upon all, we observed phosphorylation of the activating T-loop residue Ser382ofhsWNK1 and the S-loop phosphorylation site of Ser372/373ofhsSPAK that is
phosphorylated by WNK1 [63,69,93]. Upon treatment with staurosporine or NEM, Ser382of
hsWNK1 and Ser372/373ofhsSPAK were not detected anymore (Table 4). We were not able to detect phosphorylation of Thr233that is located in the T-loop kinase domain ofhsSPAK.
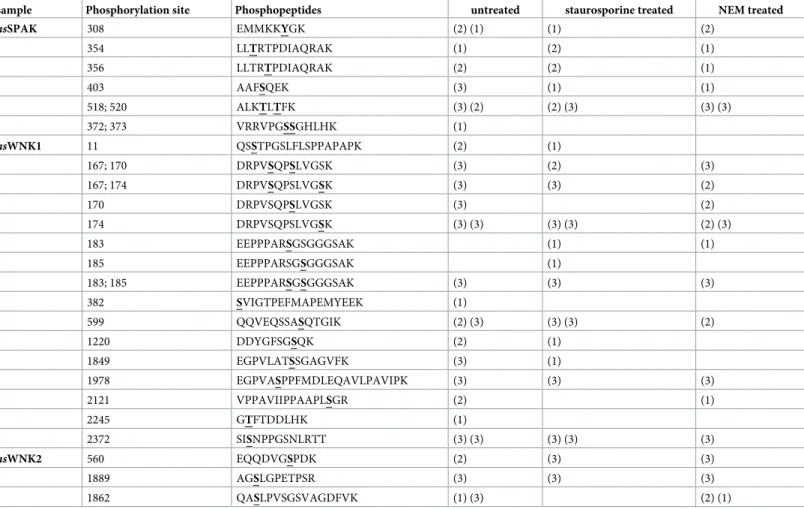
Nor-mally, this site is directly phosphorylated by WNK1 and WNK4 to activate SPAK [60,63,69, Table 1. Phospho-sites of stably transfected HEKrnKCC2bcells. Stably transfected HEKrnKCC2bwere treated with or without 1 mM NEM or 8μM staurosporine before
they were analyzed by mass spectrometry. The protein accession numbers are:hsNKCC1 (P55011), hsKCC1 (Q9UP95), rnKCC2b (Q9H2X9-2), hsKCC4 (Q9Y666).
Sample Phosphorylation sites Phosphopeptides untreated NEM treated staurosporine treated
hsNKCC1 T212; T217 TFGHNTMDAVPR (2) S242 LLRPSLAELHDELEK (1) (1) T266 EPFEDGFANGEESTPTR (3) (2) (2) S940 EGLDISHLQGQEELLSSQEK (2) (2) (2) (1) (3) (1) Y956; S957 DVVVSVEYSKK (3) (2) (3) (1) (3) (3) hsKCC1 T983 IQMTWTRDK (2) rnKCC2b S25; S26 ESSPFINSTDTEK (1) S26 ESSPFINSTDTEK (2) (3) (3) (3) (3) (3) S31 ESSPFINSTDTEK (2) (1)(1) T32 ESSPFINSTDTEK (1) (1) (1) T34 ESSPFINSTDTEK (3) (2) (2) (1) T906 TLVMEQRSQILK (3) (3) (3) S937 EIQSITDESRGSIR (2) S940 EIQSITDESRGSIR (2) (3) (2) (1) T1007 VHLTWTK (3) (3) (3) S1022; S1025 GPSPVSSEGIK (3) (1) (3) (3) (1) S1022; S1025; S1026 GPSPVSSEGIK (1) (1) S1022; S1026 GPSPVSSEGIK (3) (3) (3) S1026 GPSPVSSEGIK (3) (3) (3) hsKCC4 T926 TLMMEQR (2) T980 VQMTWTREK (3) (1)
The number in brackets indicates in how many technical replica a given phospho-site was detected (max. 3). Each bracket provides the results of one biological experiment.
95]. Furthermore, we did not detect any phospho-sites of the ubiquitously expressed WNK3 and WNK4. Again, this probably results from low expression rates in HEK293 cells.
PKC mediates the phosphorylation of KCC2 and NKCC1 [48,77,96,97]. The PKC family consists of 10–12 isoforms grouped into three classes [98–101]. We detected several phospho-sites in sevenhsPKC family members (alpha, beta, delta, epsilon, theta, eta and iota;Table 4).
To summarize, according to mass spectrometry based phosphoproteome analyses, stauros-porine and NEM reduce the number of detected phospho-sites of stably expressedrnKCC2b
and endogenously expressedhsKCC1, hsKCC4, hsNKCC1, hsWNK1 and hsSPAK.
Phosphory-lation of some sites (rnKCC2b: Ser31,hsNKCC1:Ser242,hsKCC4: Thr980) was absent only after staurosporine treatment. Yet, these results can only be used as an indication since the absence of phosphorylation sites can reflect detection problems caused by low phosphorylation rates.
Quantitative analyses of phospho-sites of
rnKCC2b and hsNKCC1 upon
staurosporine and NEM treatment in HEK
rnKCC2bcells
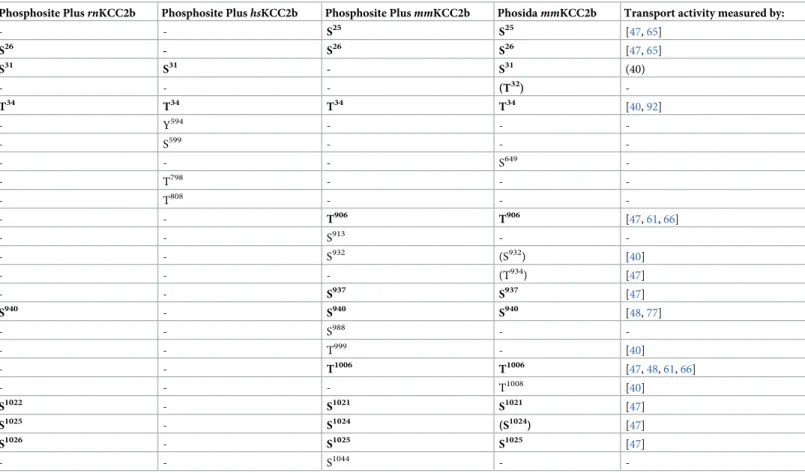
The experimental setup of our mass spectrometry-based analysis precluded quantification of changes at individual phospho-sites. We therefore applied in a next step phospho-site-specific antibody, as they were previously shown to quantitatively monitor changes in KCC2, NKCC1 and SPAK phosphorylation [23,48,59,66,70,102]. Currently, a limited number of this class Table 2. Phospho-sites in PhosphoSitePlus and PHOSIDA detected by mass spectrometry analyses.
Phosphosite PlusrnKCC2b Phosphosite PlushsKCC2b Phosphosite PlusmmKCC2b PhosidammKCC2b Transport activity measured by:
- - S25 S25 [47,65] S26 - S26 S26 [47,65] S31 S31 - S31 (40) - - - (T32) -T34 T34 T34 T34 [40,92] - Y594 - - -- S599 - - -- - - S649 -- T798 - - -- T808 - - -- - T906 T906 [47,61,66] - - S913 - -- - S932 (S932) [40] - - - (T934) [47] - - S937 S937 [47] S940 - S940 S940 [48,77] - - S988 - -- - T999 - [40] - - T1006 T1006 [47,48,61,66] - - - T1008 [40] S1022 - S1021 S1021 [47] S1025 - S1024 (S1024) [47] S1026 - S1025 S1025 [47] - - S1044 -
-Abbreviations used are as follows:rn, Rattus norvegicus; hs, Homo sapiens; mm, Mus musculus. Phospho-sites detected in the present mass spectrometry study are
marked in bold.
of antibodies is available for CCCs. They are directed against the well-known phospho-sites Ser940, Thr906and Thr1007inrnKCC2b and Thr203, 207, 212inhsNKCC1. So far, no data are
available for the staurosporine and NEM effect on Thr906inrnKCC2b and Thr203, 207, 212in
hsNKCC1 and the staurosporine effect on Ser940, and Thr1007inrnKCC2b. To examine the
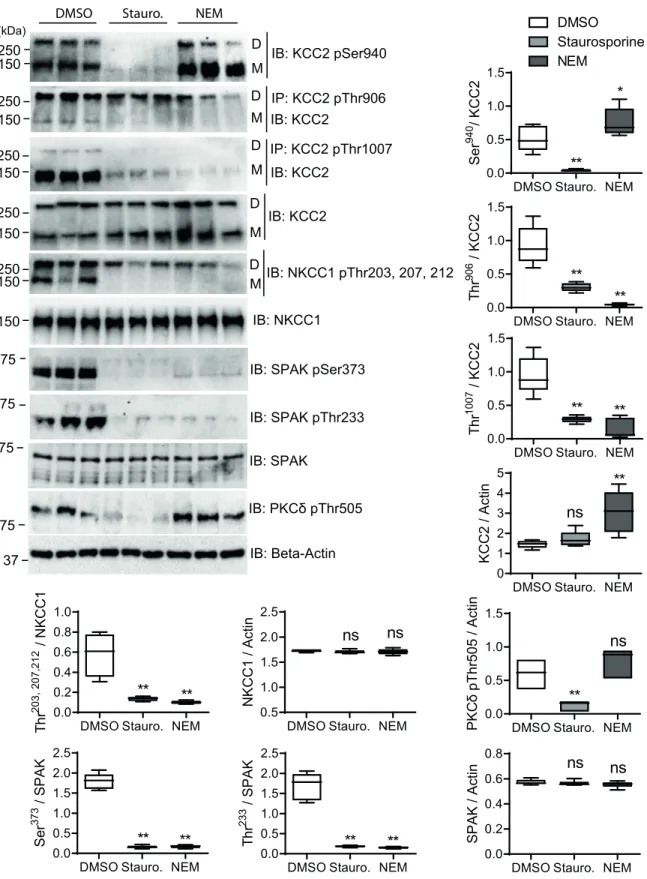
impact of staurosporine and NEM on the phosphorylation level of these sites, we treated HEKrnKCC2cells with 8μM staurosporine, 1 mM NEM or DMSO as a vehicle control for 15 min. Lysates were probed for KCC2 or NKCC1 and phosphorylation levels of each phospho-site were quantified (Fig 3). As previously described, positions Ser940, Thr906and Thr1007are phosphorylated in KCC2b, and Thr203, 207, 212in NKCC1 of untreated HEKrnKCC2cells [48,70,
102] (Fig 3). These data corroborate the phosphoproteome analyses which revealed phosphor-ylation of Ser940, Thr906and Thr1007in KCC2b and Thr212/Thr217in NKCC1 as well (Table 1).
Next, we observed the impact of staurosporine and NEM on these phospho-sites (Fig 3). Both agents decreased the phosphorylation status of the WNK/SPAK sites Thr906(p-value for
NEM or staurosporine:p = 0.0026) and Thr1007(p-value for NEM or staurosporine:
p = 0.0026) of rnKCC2 and Thr203/207/212ofhsNKCC1 (p-value for NEM and staurosporine:
Table 3. Phospho-sites ofhsSPAK, hsWNK1 and hsWNK2 endogenously expressed in stably transfected HEKrnKCC2bcells. Stably transfected HEKrnKCC2bwere
treated with or without 1 mM NEM or 8μM staurosporine before they were analyzed by mass spectrometry. The protein accession numbers are: hsSPAK (AAC72238.1),
hsWNK1 (Q9H4A3.2), hsWNK2 (Q9Y3S1.4).
sample Phosphorylation site Phosphopeptides untreated staurosporine treated NEM treated
hsSPAK 308 EMMKKYGK (2) (1) (1) (2) 354 LLTRTPDIAQRAK (1) (2) (1) 356 LLTRTPDIAQRAK (2) (2) (1) 403 AAFSQEK (3) (1) (1) 518; 520 ALKTLTFK (3) (2) (2) (3) (3) (3) 372; 373 VRRVPGSSGHLHK (1) hsWNK1 11 QSSTPGSLFLSPPAPAPK (2) (1) 167; 170 DRPVSQPSLVGSK (3) (2) (3) 167; 174 DRPVSQPSLVGSK (3) (3) (2) 170 DRPVSQPSLVGSK (3) (2) 174 DRPVSQPSLVGSK (3) (3) (3) (3) (2) (3) 183 EEPPPARSGSGGGSAK (1) (1) 185 EEPPPARSGSGGGSAK (1) 183; 185 EEPPPARSGSGGGSAK (3) (3) (3) 382 SVIGTPEFMAPEMYEEK (1) 599 QQVEQSSASQTGIK (2) (3) (3) (3) (2) 1220 DDYGFSGSQK (2) (1) 1849 EGPVLATSSGAGVFK (3) (1) 1978 EGPVASPPFMDLEQAVLPAVIPK (3) (3) (3) 2121 VPPAVIIPPAAPLSGR (2) (1) 2245 GTFTDDLHK (1) 2372 SISNPPGSNLRTT (3) (3) (3) (3) (3) hsWNK2 560 EQQDVGSPDK (2) (3) (3) 1889 AGSLGPETPSR (3) (3) (3) 1862 QASLPVSGSVAGDFVK (1) (3) (2) (1)
The number in brackets indicates in how many technical replica a given phospho-site was detected (max. 3). Each bracket provides the results of one biological experiment.
p = 0.0026) [72–75,103]. The reduced phosphorylation of Thr212inhsNKCC1 agrees with our
phosphoproteome analyses as no phosphorylation of Thr212/Thr217in NKCC1 was observed (Table 1).
Previous analyses showed that SPAK directly phosphorylates Thr1007ofrnKCC2 [48] and Thr203/207/212ofhsNKCC1 [70]. Treatment of HEK293 cells with NEM resulted in a decrease of phosphorylation of Thr233(p = 0,0026), that is located in the T-loop kinase domain, and the
S-loop phosphorylation site Ser373ofhsSPAK (p = 0.0026) (Fig 3). Both are targets of WNKs [48,69,93]. As no data were available for the staurosporine mediated effect, we additionally analyzed its impact on these phospho-sites in HEK293 cells. Staurosporine also reduced the phosphorylation of Thr233(p = 0.0026) and Ser373(p = 0.0026) in hsSPAK (Fig 3). Thus, both agents reduced phosphorylation levels of these SPAK phospho-sites. These data conform well to our phosphoproteomic analyses, as no phosphorylated Ser372/373ofhsSPAK was detected
after treatment with either of the two agents.
Furthermore, staurosporine reduced phosphorylation of Ser940(p = 0.0026) in HEKrnKCC2b, whereas NEM increased phosphorylation of Ser940(p = 0.046) significantly (Fig 3). Since, Ser940is directly phosphorylated by PKC [77,104], we here analyzed the impact of both agents on the T-loop phosphorylation site Thr505of PKC-δ. Autophosphorylation of this site is most probably essential for kinase activity [105–107]. Staurosporine significantly decreases Thr505 phosphorylation (p = 0.0026,Fig 3), whereas NEM slightly, but not significantly, increases Thr505phosphorylation (p = 0.064). The different impact of both agents on the
phosphoryla-tion of Thr505of PKC correlates well with their impact on Ser940phosphorylation of KCC2b. We also determined whether staurosporine or NEM altered the total protein amount of
rnKCC2b, hsNKCC1 or hsSPAK (Fig 3). Whereas NEM resulted in increased KCC2 amount (p = 0.0026), no obvious change was detected upon staurosporine treatment. NKCC1 and
SPAK levels were not changed significantly upon treatment with either agent.
To conclude, staurosporine and NEM reduced the phosphorylation status of SPAK (Thr233 and Ser373). This correlated with the reduction of the phosphorylation of Thr1007inrnKCC2b
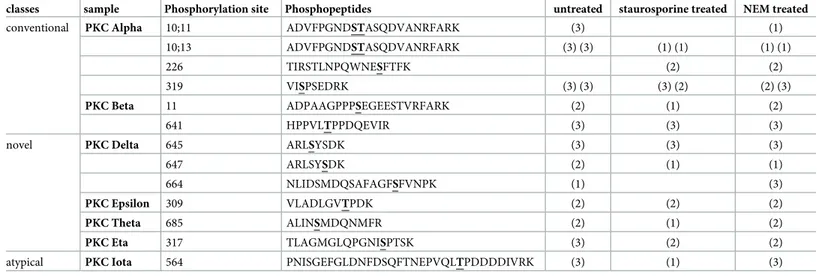
Table 4. Phospho-sites ofhsPKC endogenously expressed in stably transfected HEKrnKCC2bcells. Stably transfected HEKrnKCC2bwere treated with or without 1 mM
NEM or 8μM staurosporine before they were analyzed by mass spectrometry. The protein accession numbers are: hsPKC Alpha (P17252), hsPKC Beta (P05771-2), hsPKC Delta (Q05655),hsPKC Epsilon (Q02156), hsPKC Theta (Q04759), hsPKC Eta (P24723), and hsPKC Iota (P41743).
classes sample Phosphorylation site Phosphopeptides untreated staurosporine treated NEM treated
conventional PKC Alpha 10;11 ADVFPGNDSTASQDVANRFARK (3) (1)
10;13 ADVFPGNDSTASQDVANRFARK (3) (3) (1) (1) (1) (1)
226 TIRSTLNPQWNESFTFK (2) (2)
319 VISPSEDRK (3) (3) (3) (2) (2) (3)
PKC Beta 11 ADPAAGPPPSEGEESTVRFARK (2) (1) (2)
641 HPPVLTPPDQEVIR (3) (3) (3)
novel PKC Delta 645 ARLSYSDK (3) (3) (3)
647 ARLSYSDK (2) (1) (1)
664 NLIDSMDQSAFAGFSFVNPK (1) (3)
PKC Epsilon 309 VLADLGVTPDK (2) (2) (2)
PKC Theta 685 ALINSMDQNMFR (2) (1) (2)
PKC Eta 317 TLAGMGLQPGNISPTSK (3) (2) (2)
atypical PKC Iota 564 PNISGEFGLDNFDSQFTNEPVQLTPDDDDIVRK (3) (1) (3)
The number in brackets indicates in how many technical replica a given phospho-site was detected (max. 3). Each bracket provides the results of one biological experiment.
Fig 3. Quantitative analyses ofrnKCC2b and hsNKCC1 phospho-sites upon staurosporine and NEM treatment in HEKrnKCC2b
cells. Stably transfected HEKrnKCC2bcells were treated with DMSO (control), 8μM staurosporine or 0.5 mM NEM, respectively, for 15 min. Cell lysates were harvested and subjected to immunoprecipitation (IP) and immunoblot (IB) with indicated antibodies. D, dimeric KCC2; M, monomeric KCC2. Band intensities were quantified with ImageJ software.���,p < 0.001;��,p < 0.01;
Wilcoxon-Mann-Whitney test (n = 6).
and Thr203/207/212inhsNKCC1. Additionally, both agents reduced phosphorylation of Thr906
inrnKCC2b, which is phosphorylated by WNKs and a yet unknown kinase [48]. Staurospor-ine also reduced phosphorylation of the PKC site Ser940inrnKCC2b, whereas NEM increased
its phosphorylation level. This correlated with the reduction of Thr505phosphorylation of PKC-δ upon staurosporine treatment and the impact of NEM to increase Thr505
phosphorylation.
Quantitative analyses of phospho-sites of KCC2 and NKCC1 upon
staurosporine or NEM treatment of rat immature hippocampal neurons
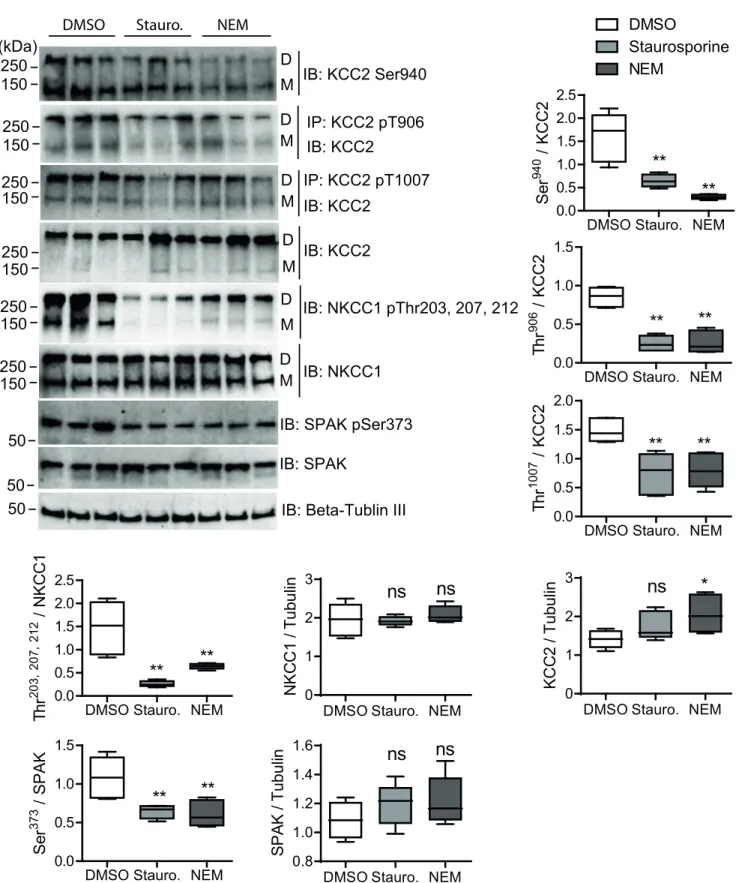
As KCC2 is predominantly expressed in neurons [20], we analyzed for the first time the impact of staurosporine and NEM on the phosphorylation of specific phospho-sites of endogenously expressed KCC2 and NKCC1 using immature (9 DIV) primary rat hippocampal neurons (Fig 4). At this age cultured hippocampal neurons exhibit prominent level of Thr906and Thr1007 KCC2 phosphorylation [66] that could be a subject of modulation by staurosporine and NEM. To this end, we treated neurons with 8μM staurosporine, 0.5 mM NEM or DMSO as a vehicle control for 15 min. NEM was reduced to 0.5 mM, since higher concentrations induced cell death. As described for the analyses in stably transfected HEKrnKCC2bcells, we used phospho-specific KCC2 and NKCC1 antibodies to quantify phosphorylation levels of each phospho-site relatively to the DMSO control. In untreated cultured immature hippocampal neurons, Ser940, Thr906and Thr1007in KCC2 and Thr203, 207, 212in NKCC1 were phosphorylated, similar to sta-bly transfected HEKrnKCC2bcells (Fig 4).
Most actions of staurosporine and NEM, as monitored by immunblots, were similar between HEKrnKCC2bcells and immature hippocampal neurons. Both agents resulted in decreased phosphorylation of Thr1007in KCC2 (p-value for NEM and staurosporine: p = 0.0026), Thr203/207/212in NKCC1 (p-value for NEM and staurosporine: p = 0.0026), and
Ser373in SPAK (p-value for NEM: p = 0.0026 and staurosporine: p = 0.0026). Additionally,
both agents reduced phosphorylation of the WNK-dependent phospho-site Thr906in KCC2 (p-value for NEM and staurosporine: p = 0.0026). Finally, NEM increased the total protein
level of KCC2, as observed in HEK293 cells (p = 0.015) (Fig 4). We were not able to detect the phosphorylation of Thr233of SPAK using phospho-specific antibodies.
A marked difference, however, was observed for the PKC dependent phospho-site Ser940. Here, treatment with NEM reduced phosphorylation of Ser940(p = 0.0026) (Fig 4), contrary to the results obtained in stably transfected HEKrnKCC2bcells (Fig 3). Treatment with staurospor-ine also resulted in reduced phosphorylation of Ser940(p = 0.0026), which was similar to its
action in HEKrnKCC2bcells. We could not detect Thr505phosphorylation of PKC-δ due to low expression rates.
To sum up, NEM affected the phosphorylation status of Ser940in immature hippocampal neurons (decrease) in the opposite way compared to HEKrnKCC2bcells (increase). All other effects of staurosporine and NEM were similar between immature hippocampal neurons and HEK293 cells, i.e. both reduced the phosphorylation status of Ser940, Thr906, and Thr1007in KCC2 and Thr203/207/212inhsNKCC1.
Discussion
KCC2 and NKCC1 are key players for the development and maintenance of fast inhibitory neurotransmission. Their oppositely directed transport of K+and Cl-ions within the same neuronal population necessitates a precisely coordinated regulatory mechanism for efficient setting of the intracellular [Cl-] concentration [4,38,55–60] (Fig 5).
Fig 4. Quantitative analyses ofrnKCC2 and rnNKCC1 phospho-sites upon staurosporine or NEM treatment in immature hippocampal neurons. Immature rat hippocampal neurons were treated with DMSO (control), 8μM staurosporine or 0.5 mM NEM, respectively, for 15 min. Neuronal lysates were harvested and subjected to immunoprecipitation (IP) and immunoblot (IB) with the indicated antibodies. D, dimeric KCC2; M, monomeric KCC2. Band intensities were quantified using ImageJ software.���,p < 0.001;��,p < 0.01; Wilcoxon-Mann-Whitney test (n = 6).
Posttranslational regulation via the WNK-SPAK/OSR1 dependent phosphorylation repre-sents a potent mechanism to regulate transport activity of KCC2 and NKCC1 in a reciprocal way [60,108–110] (Fig 5). Here, we show that staurosporine and NEM decrease phosphoryla-tion of Thr233and Ser373in SPAK, of Thr1007inrnKCC2 and Thr203
, Thr207and Thr212in
hsNKCC1 in both HEK293 cells and immature cultured hippocampal neurons. Since SPAK
directly impairs phosphorylation of Thr1007inrnKCC2 and Thr203, Thr207and Thr212in
hsNKCC1 [38,48,59,60,63,68–76], our data suggest that staurosporine and NEM directly affect the WNK-SPAK/OSR1 mediated phosphorylation of these residues in KCC2 and NKCC1. The data are in line with previous analyses showing that NEM reduces phosphoryla-tion of Ser373in SPAK and Thr1007in KCC2 using HEK293 cells and immature cortical neu-rons [48]. Furthermore, application of staurosporine and NEM decreases phosphorylation of Thr906inrnKCC2. This site is directly phosphorylated by WNKs and a yet unknown kinase
[48]. However, functional in-depth analyses such as mutagenic approaches are required to prove a causal relation between dephosphorylation of SPAK Thr233and Ser373and dephos-phorylation of the specific KCC2 and NKCC1 phospho-sites upon staurosporine and NEM treatment.
Recent analyses demonstrated that dephosphorylation of Thr906and Thr1007increases KCC2 activity [61,64–66], whereas dephosphorylation of Thr203, Thr207and Thr212decreases NKCC1 activity [45,51]. Furthermore, staurosporine and NEM results in activation of KCC2 (this study and [40,47,48,59,60,79,80], whereas they reduce NKCC1 activity [43–46,51]. This suggests, that staurosporine and NEM mediated dephosphorylation of these phospho-sites result in a reciprocal regulation of KCC2 (activation) and NKCC1 (inactivation) activity most likely via the WNK/SPAK-dependent phosphorylation pathway. This is also in line with the observation in immature hippocampal neurons that KCC2 can rapidly be activated by staurosporine [42].
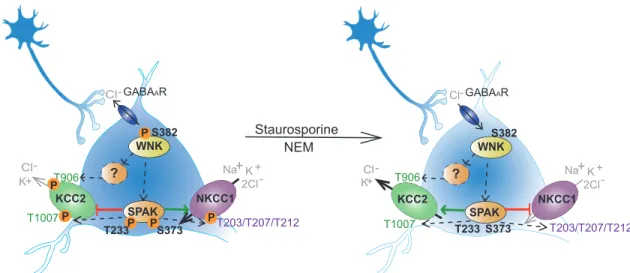
Fig 5. Staurosporine and NEM impair the WNK-SPAK/OSR1 mediated phosphorylation of KCC2 and NKCC1. In immature
hippocampal neurons, the WNK mediated phosphorylation of SPAK/OSR1 directly phosphorylates T1007of KCC2 and T203, T207 and T212of NKCC1. WNKs also interact with a yet unknown kinase to phosphorylate Thr906of KCC2. Phosphorylation of these
residues decreases KCC2 and increases NKCC1 activity. Application of staurosporine or NEM decreases phosphorylation of S382of
WNK1 and T233and S373of SPAK. This likely results in reduction of phosphorylation of T906and T1007in KCC2 and of T203, T207 and T212in NKCC1. Dephosphorylation of these residues increases KCC2 activity and decreases NKCC1 activity. The figure is modified from Moore et al. [39].
Another key regulatory KCC2 phospho-site is the PKC-mediated phosphorylation of Ser940. Phosphorylation of Ser940enhances KCC2 cell surface expression and increases ion transport activity, whereas mutation of serine to alanine (mimicking the dephosphorylated state) results in transport activity that is equal or decreased compared to wild-type KCC2 (KCC2wt) [65,77,111]. Our data demonstrate that staurosporine and NEM can differentially affect Ser940phosphorylation. Treatment of immature hippocampal neurons with either agent results in decreased phosphorylation of Ser940. However, treatment of HEKrnKCC2bcells with staurosporine decreases, whereas NEM increases phosphorylation of Ser940. This is in line with the different effect of these agents on transport activity of the phosphomutants Ser31A/D, Thr34A/D, Thr999Aand Thr1008A/D[40].
Moreover, NEM has a cell-type specific impact on Ser940phosphorylation. In immature cortical neurons [48] and HEK293 cells, NEM increases Ser940phosphorylation, whereas it decreases Ser940phosphorylation in immature cultured hippocampal neurons (Fig 4). The mechanisms that cause this opposite effect of NEM on Ser940phosphorylation in different tis-sues is unclear. One possibility is that different NEM concentrations (HEK293 cells: 1 mM and 0.1 mM; immature hippocampal neurons: 0.5 mM; immature cortical neurons: 0.1 mM [48]) affect different regulatory pathways. Alternatively, tissues-specific sets of PKC isoforms and phosphatases result in different phosphorylation patterns. Indeed, the PKC family consists of 10–12 isoforms grouped into three classes [98–101] that vary in their expression profile [112] and regulation of their activity through several regulatory proteins, co-factors and second mes-senger cascades [100,101,113]. This offers the opportunity to differentially regulate KCC2 function in distinct neuronal populations through PKC. In HEKrnKCC2bcells, we showed that staurosporine reduced and NEM slightly increased phosphorylation of the T-loop phospho-site Thr505of PKC-δ. This correlated with decreased KCC2 Ser940phosphorylation upon staur-osporine treatment and increased phosphorylation of this residue upon NEM treatment. This suggests, that both agents directly act on PKC-δ mediating the phosphorylation of Ser940
in HEKrnKCC2bcells. However, more functional in-depth analyses are required to elucidate the causal link between dephosphorylation of PKC-δ Thr505
and dephosphorylation of KCC2 Ser940upon staurosporine treatment. Since we were unable to detect phosphorylation of PKC-δ Thr505
in immature hippocampal neurons, we suggest that other PKC isoforms are involved in the direct phosphorylation of KCC2 Ser940in immature hippocampal neurons.
Our data furthermore reveal that staurosporine (HEKrnKCC2bcells, immature hippocampal neurons) and NEM treatment (immature hippocampal neurons) decrease Ser940phosphorylation resulting in an equal or diminished transport activity compared to KCC2wt[65,77,111]. We therefore conclude that Ser940is not the key regulatory phospho-site mediating the staurosporine and NEM-based stimulation effect on KCC2. This is in line with recent published analyses show-ing that NEM still enhances the transport activity of Ser940A(mimicking dephosphorylated state), indicating that other phospho-sites are important in NEM-dependent stimulation [40,48].
NEM but not staurosporine increased total KCC2 amount in HEK293 cells and immature cultured hippocampal neurons. In immature cortical neurons, Deep and coworkers [48] detected the same trend of enhanced total KCC2 abundance (albeit not significant), resulting in increased cell surface expression [48]. This suggests that in contrast to staurosporine, NEM increases KCC2 expression and trafficking that could result in a higher KCC2 activity. The dif-ferent impact of NEM on total KCC2 abundance in HEK293 in the study of Deep and cowork-ers (no increase) and our analyses (increase) could result from different NEM concentration used in the experiments (0.1 mM vs. 1 mM).
Via mass spectrometry analysis, we identified several new phosphorylation sites whose function awaits further investigation. These sites are the N-terminal KCC2 phospho-site Thr32, and the C-terminal NKCC1 phospho-sites Ser242, Thr266, Th268, Ser940, Tyr956and
Ser957. Future studies should investigate their regulatory impact on KCC2 and NKCC1 activity.
Conclusions
In conclusion, our data identify molecular mechanisms involved in staurosporine and NEM mediated changes in transport activity of KCC2 and NKCC1, which are a defining feature of CCCs [114]. The observation of cell-type specific action of these agents is in line with different reversal potentials in mature neuronal populations [115] and calls for comprehensive neuron sub-type-specific phospho analysis. The recently reported structural data of CCCs [116–119] finally lay the foundation to analyze jointly the physiological role of phosphorylation and underlying structural changes to obtain an integrative and mechanistic view of the action of phosphorylation.
Supporting information
S1 Table. Phospho-sites in PhosphoSitePlus detected by mass spectrometry analyses.
(DOCX)
S2 Table. Phospho-sites in PhosphoSitePlus detected by mass spectrometry analyses.
(DOCX)
S3 Table. Phospho-sites in PhosphoSitePlus detected by mass spectrometry analyses.
(DOCX)
S1 Fig. Quantitative analyses ofrnKCC2 and hsNKCC1 phospho-sites upon staurosporine and NEM treatment in HEKrnKCC2bcells.
(PDF)
S2 Fig. Quantitative analyses ofrnKCC2 and hsNKCC1 phospho-sites upon staurosporine and NEM treatment in immature hippocampal neurons.
(PDF)
Acknowledgments
We thank M. Reents for excellent technical support. Authors are also grateful to Prof. Matthias Mann for continuous support and Katharina Zettl for technical support.
Author Contributions
Conceptualization: Igor Medina, Anna-Maria Hartmann.
Data curation: Jinwei Zhang, Antje Cordshagen, Igor Medina, Jacek R. Wisniewski, Michael
Winklhofer, Anna-Maria Hartmann.
Formal analysis: Jinwei Zhang, Antje Cordshagen, Jacek R. Wisniewski, Michael Winklhofer,
Anna-Maria Hartmann.
Funding acquisition: Hans Gerd Nothwang, Jacek R. Wisniewski, Anna-Maria Hartmann. Investigation: Jinwei Zhang, Antje Cordshagen, Igor Medina, Jacek R. Wisniewski,
Anna-Maria Hartmann.
Methodology: Jinwei Zhang, Antje Cordshagen, Igor Medina, Jacek R. Wisniewski, Michael
Winklhofer, Anna-Maria Hartmann.
Supervision: Igor Medina, Hans Gerd Nothwang, Jacek R. Wisniewski, Anna-Maria
Hartmann.
Validation: Jinwei Zhang, Antje Cordshagen, Igor Medina, Jacek R. Wisniewski, Michael
Winklhofer, Anna-Maria Hartmann.
Visualization: Jinwei Zhang, Antje Cordshagen, Jacek R. Wisniewski, Michael Winklhofer,
Anna-Maria Hartmann.
Writing – original draft: Jinwei Zhang, Igor Medina, Hans Gerd Nothwang, Jacek R.
Wis-niewski, Michael Winklhofer, Anna-Maria Hartmann.
References
1. Hartmann A-M, Tesch D, Nothwang HG, Bininda-Emonds ORP. Evolution of the Cation Chloride Cotransporter Family: Ancient Origins, Gene Losses, and Subfunctionalization through Duplication. Molecular biology and evolution. 2014:mst225.
2. Gamba G. Molecular Physiology and Pathophysiology of electroneutral Cation-Chloride Cotransporter. Physiological Reviews. 2005; 85:423–93.https://doi.org/10.1152/physrev.00011.2004PMID:15788703
3. Daigle ND, Carpentier GA, Frenette-Cotton R, Simard CF, Lefoll M-H, Noel M, et al. Molecular charac-terization of a human cation-Cl- cotransporter (SLC12A8, CCC9A) that promotes polyamine and amino acid transport. Journal of Cellular Physiology. 2009; 220:680–9.https://doi.org/10.1002/jcp. 21814PMID:19472210
4. Hartmann A, Nothwang HG. Molecular and evolutionary insights into the structural organization of cat-ion chloride cotransporters. Name: Frontiers in Cellular Neuroscience. 2015; 8:470.https://doi.org/10. 3389/fncel.2014.00470PMID:25653592
5. Payne JA, Rivera C, Voipo J, Kaila K. Cation-Chloride cotransporters in neuronal communication, development and trauma Trends in Neuroscience. 2003; 26:199–206.
6. Arroyo JP, Kahle KT, Gamba G. The SLC12 family of electroneutral cation-coupled chloride cotran-sporters. Molecular Aspects of Medicine. 2013; 34:288–98.https://doi.org/10.1016/j.mam.2012.05. 002PMID:23506871
7. Kahle KT, Staley KJ, Nahed BV, Gamba G, Hebert SC, Lifton RP, et al. Roles of the cation-chloride cotransporters in neurological disease. Nature Clinical Practice. 2008; 4:490–502.
8. Blaesse P, Airaksinen MS, Rivera C, Kaila K. Cation-Chloride Cotransporters and Neuronal Function. Cell. 2009; 61:820–38.
9. Adragna NC, Fulvio MD, Lauf PK. Regulation of K-Cl Cotransport: from Function to Genes. Journal of Membrane Biology. 2004; 201:109–37.https://doi.org/10.1007/s00232-004-0695-6PMID:15711773
10. Di Fulvio M, Alvarez-Leefmans FJ. The NKCC and NCC genes: an in silico view. Physiology and Pathology of Chloride Transporters and Channels in the Nervous System. 2009:169–208.
11. Gagnon KB, Delpire E. Physiology of SLC12 transporters: lessons from inherited human genetic mutations and genetically engineered mouse knockouts. American Journal of Physiology-Cell Physiol-ogy. 2013; 304:C693–C714.https://doi.org/10.1152/ajpcell.00350.2012PMID:23325410
12. Medina I, Friedel P, Rivera C, Kahle KT, Kourdougli N, Uvarov P, et al. Current view on the functional regulation of the neuronal K+-Cl−cotransporter KCC2. Frontiers in cellular neuroscience. 2014;8.
13. Achilles K, Okabe A, Ikeda M, Shimizu-Okabe C, Yamada F, Fukuda A, et al. Kinetic properties of Cl -uptake mediated by Na+-dependent K+-2Cl-cotransport in immature rat neocortical neurons. Journal of Neuroscience. 2007; 27:8616–27.https://doi.org/10.1523/JNEUROSCI.5041-06.2007PMID:17687039
14. Sipila¨ ST, Huttu K, Yamada J, Afzalov R, Voipio J, Blaesse P, et al. Compensatory enhancement of intrinsic spiking upon NKCC1 disruption in neonatal hippocampus. The Journal of Neuroscience. 2009; 29:6982–8.https://doi.org/10.1523/JNEUROSCI.0443-09.2009PMID:19474325
15. Yamada J, Okabe M, Toyoda H, Kilb W, Luhmann HJ, Fukuda A. Cl-uptake promoting depolarizing GABA actions in immature rat neocortical neurones is mediated by NKCC1. Journal of Physiology. 2004; 557:829–41.https://doi.org/10.1113/jphysiol.2004.062471PMID:15090604
16. Yuste R, Katz LC. Control of postsynaptic Ca2+influx in developing neocortex by excitatory and inhibi-tory neurotransmitters. Neuron. 1991; 6:333–44.https://doi.org/10.1016/0896-6273(91)90243-s PMID:1672071
17. Reichling DB, Kyrozis A, Wang J, MacDermott AB. Mechanism of GABA and glycine depolarization-induced calcium transients in rat dorsal horn neurons. Journal of Physiology. 1994; 476:411–21. https://doi.org/10.1113/jphysiol.1994.sp020142PMID:8057250
18. Owens DF, Boyce LH, Davis MBE, Kriegstein AR. Excitatory GABA responses in embryonic and neo-natal cortical slices demonstrated by gramicidin perforated-patch recordings and calcium imaging. The Journal of Neuroscience. 1996; 16:6416–23.
19. Hu¨bner CA, Stein V, Hermans-Borgmeyer I, Meyer T, Ballanyi K, Jentsch TJ. Disruption of KCC2 reveals an essential role of K-Cl cotransport already in early synaptic inhibition. Neuron. 2001; 30:515–24.https://doi.org/10.1016/s0896-6273(01)00297-5PMID:11395011
20. Uvarov P, Ludwig A, Markkanen M, Pruunsild P, Kaila K, Delpire E, et al. A novel N-termianl isoform of the neuron-specific K-Cl Cotransporter KCC2. Journal of Biological Chemistry. 2007; 282(42):30570– 6.https://doi.org/10.1074/jbc.M705095200PMID:17715129
21. Kim JY, Liu CY, Zhang F, Duan X, Wen Z, Song J, et al. Interplay between DISC1 and GABA signaling regulates neurogenesis in mice and risk for schizophrenia. Cell. 2012; 148(5):1051–64.https://doi.org/ 10.1016/j.cell.2011.12.037PMID:22385968
22. Tyzio R, Nardou R, Ferrari DC, Tsintsadze T, Shahrokhi A, Eftekhari S, et al. Oxytocin-mediated GABA inhibition during delivery attenuates autism pathogenesis in rodent offspring. Science. 2014; 343(6171):675–9.https://doi.org/10.1126/science.1247190PMID:24503856
23. Kahle KT, Merner ND, Friedel P, Silayeva L, Liang B, Khanna A, et al. Genetically encoded impairment of neuronal KCC2 cotransporter function in human idiopathic generalized epilepsy. EMBO reports. 2014; 15(7):766–74.https://doi.org/10.15252/embr.201438840PMID:24928908
24. Merner ND, Chandler MR, Bourassa C, Liang B, Khanna AR, Dion P, et al. Regulatory domain or CpG site variation in SLC12A5, encoding the chloride transporter KCC2, in human autism and schizophrenia. Frontiers in cellular neuroscience. 2015;9.https://doi.org/10.3389/fncel.2015.00009 PMID:25698924
25. Huberfeld G, Wittner L, Clemenceau S, Baulac M, Kaila K, Miles R, et al. Perturbed chloride homeo-stasis and GABAergic signaling in human temporal lobe epilepsy. The Journal of Neuroscience. 2007; 27(37):9866–73.https://doi.org/10.1523/JNEUROSCI.2761-07.2007PMID:17855601
26. Coull JAM, Boudreau D, Bachand K, Prescott SA, Nault F, Sik A, et al. Trans-synaptic shift in anion gradient in spinal lamina I neurons as a mechanism of neuropathic pain. Nature. 2003; 424:938–42. https://doi.org/10.1038/nature01868PMID:12931188
27. Rivera C, Li H, Thomas-Crussels J, Lahtinen H, Viitanen T, Nanobashvili A, et al. BDNF-induced TrkB activation down-regulates the K+-Cl- cotransporter KCC2 and impairs neuronal Cl- extrusion. The Journal of Cell Biology. 2002; 159(5):747–52.https://doi.org/10.1083/jcb.200209011PMID:12473684
28. Boulenguez P, Liabeuf S, Bos R, Bras H, Jean-Xavier C, Brocard C, et al. Down-regulation of the potassium-chloride cotransporter KCC2 contributes to spasticity after spinal cord injury. Nature medi-cine. 2010; 16(3):302–7.https://doi.org/10.1038/nm.2107PMID:20190766
29. Papp E, Rivera C, Kaila K, Freund TF. Relationship between neuronal vulnerability and potassium-chloride cotransporter 2 immunreactivity in hippocampus following transient forebrain ischemia. 2008. 2008;Neuroscience:677–89.
30. Shulga A, Thomas-Crusells J, Sigl T, Blaesse A, Mestres P, Meyer M, et al. Posttraumatic GABAA-mediated [Ca2+] i increase is essential for the induction of brain-derived neurotrophic factor-depen-dent survival of mature central neurons. The Journal of Neuroscience. 2008; 28(27):6996–7005. https://doi.org/10.1523/JNEUROSCI.5268-07.2008PMID:18596173
31. Puskarjov M, Ahmad F, Khirug S, Sivakumaran S, Kaila K, Blaesse P. BDNF is required for seizure-induced but not developmental up-regulation of KCC2 in the neonatal hippocampus. Neuropharmacol-ogy. 2014.
32. Pisella LI, Gaiarsa J-L, Diabira D, Zhang J, Khalilov I, Duan J, et al. Impaired regulation of KCC2 phos-phorylation leads to neuronal network dysfunction and neurodevelopmental pathology. 2019; 12(603): eaay0300.
33. Delpire E, Lu J, England R, Dull C, Thorne T. Deafness and imbalance associated with inactivation of the secretory Na-K-2Cl co-transporter. Nature Genetics. 1999; 22:192–5.https://doi.org/10.1038/ 9713PMID:10369265
34. Delpire E, Mount DB. Human and Murine Phenotypes associated with defects in Cation-Chloride-Cotransporter. Annu Rev Physiol. 2002; 64:803–43.https://doi.org/10.1146/annurev.physiol.64. 081501.155847PMID:11826289
35. Dzhala VI, Talos DM, Sdrulla DA, Brumback AC, Mathews GC, Benke TA, et al. NKCC1 transporter facilates seizures in the developing brain. Nature Medicine. 2005; 11:1205–13.https://doi.org/10. 1038/nm1301PMID:16227993
![[PDF] Cours de bureautique excel word 2016 PDF | Cours Bureautique](data:image/gif;base64,R0lGODlhAQABAIAAAP///wAAACH5BAEAAAAALAAAAAABAAEAAAICRAEAOw==)