HAL Id: hal-02481505
https://hal.archives-ouvertes.fr/hal-02481505
Submitted on 17 Feb 2020HAL is a multi-disciplinary open access
archive for the deposit and dissemination of sci-entific research documents, whether they are pub-lished or not. The documents may come from teaching and research institutions in France or abroad, or from public or private research centers.
L’archive ouverte pluridisciplinaire HAL, est destinée au dépôt et à la diffusion de documents scientifiques de niveau recherche, publiés ou non, émanant des établissements d’enseignement et de recherche français ou étrangers, des laboratoires publics ou privés.
Insight into gluten structure in a mild chaotropic solvent
by asymmetrical flow field-flow fractionation (AsFlFFF)
and evidence of non-covalent assemblies between
glutenin and ω-gliadin
Marie-Hélène Morel, Justine Pincemaille, Edouard Chauveau, Ameur
Louhichi, Frédéric Violleau, Paul Menut, Laurence Ramos, Amélie Banc
To cite this version:
Marie-Hélène Morel, Justine Pincemaille, Edouard Chauveau, Ameur Louhichi, Frédéric Violleau, et al.. Insight into gluten structure in a mild chaotropic solvent by asymmetrical flow field-flow fractionation (AsFlFFF) and evidence of non-covalent assemblies between glutenin and ω-gliadin. Food Hydrocolloids, Elsevier, 2020, 103, pp.105676. �10.1016/j.foodhyd.2020.105676�. �hal-02481505�
1
Insight into gluten structure in a mild chaotropic solvent by Asymmetrical Flow
Field-Flow Fractionation (AsFlFFF) and evidence of non-covalent assemblies
between glutenin and
-gliadin
M-H Morel 1, J. Pincemaille 1,2, E. Chauveau 2, A. Louhichi 2, F. Violleau4,5, P. Menut 1,3, L. Ramos 2, A. Banc 2*
1. UMR IATE, Université de Montpellier, CIRAD, INRA, Montpellier SupAgro, 2 pl. Pierre Viala, 34070
Montpellier, France.
2. Laboratoire Charles Coulomb (L2C), Univ. Montpellier, CNRS, Montpellier, France.
3. Ingénierie Procédés Aliments, AgroParisTech, INRA, Université Paris-Saclay, 91300, Massy, France.
4. Laboratoire de Chimie Agro-industrielle LCA, Université de Toulouse, INRA, INP-PURPAN, Toulouse, France.
5. Toulouse FFF Center, Université de Toulouse, INP-PURPAN, Toulouse, France.
*Corresponding author: Amelie.banc@umontpellier.fr
ABSTRACT
Wheat gluten, one of the most complex viscoelastic protein networks in nature, is unique to get the specific texture of bread. Due to its complex protein composition, its insolubility in most solvents and the very high molar mass of half of the proteins (glutenin, the other half being gliadin), the architecture of the network is still not well understood. In this work, we have investigated model gluten protein extracts with contrasted compositions in glutenin and gliadin solubilized in a mild chaotropic solvent: ethanol/water (50/50 v/v). The samples display a liquid-liquid phase separation with an upper critical solution temperature that depends on the protein composition. The phase diagrams are consistent with the presence of supramolecular assemblies of proteins. To confirm the presence of these assemblies and fully characterize the objects dispersed in ethanol/water, we have used an asymmetrical flow field-flow fractionation (AsFlFFF) set-up coupled with differential refractive index, multi-angle light scattering and dynamic light scattering detections to probe very dilute protein suspensions. We have identified three classes of objects, with distinctive molar mass, characteristic size and conformation: protein monomers, polymeric structures, and very loose protein assemblies with molar mass larger than 2.106 g/mol. A molecular characterization of the species by size exclusion chromatography in a denaturing solvent shows that polymers and assemblies are mainly composed of glutenin and -gliadin. The high content of
2
-gliadin, devoid of cysteines, indicates the importance of non-covalent interactions involved in protein assemblies and might play a major role in gluten rheology.
3
1. INTRODUCTION
Wheat gluten is widely used for its unique viscoelastic properties as an improver of cereal products (bread, pastry, etc.). However, the understanding of its exceptional properties remains matter of research since a long time (Wrigley, 2006). Difficulty comes from the complexity of gluten composition, the huge size distribution of the proteins (Wrigley, 1996) and their insolubility in most solvents. Gluten proteins were initially classified according to their solubility in different solvents. Proteins soluble in 70 % ethanol were named gliadin whereas the others proteins, partially soluble in dilute acid, were named glutenin (Osborne, 1924). The apparent molar mass of the glutenin fraction was found to be drastically affected by the use of disulfide bond reducing agents contrarily to that of gliadin (Pence, 1952). As a consequence, presently, monomeric proteins of gluten are referred as gliadin (Gli), whereas polypeptides linked by intermolecular disulfide bonds are refered as glutenin polymers (Glu). However, it is important to mention that such solvent fractionated proteins are not perfectly separated. A small amount of polypeptides linked by intermolecular disulfide bonds was found in the 70 % ethanol soluble fraction (Bietz and Wall, 1980; Schmid, 2016) while low molecular weight polypeptides were also found in the glutenin fraction (Rao and Nigam, 1987; Ueno et al., 2002). The molecular composition analysis is generally achieved by size-based electrophoresis, size exclusion high performance liquid chromatography (HPSEC) or asymmetrical flow field-flow fractionation (AsFlFFF), using strong denaturing solvents (Shewry, 2003). Buffers containing surfactant such as sodium dodecyl sulfate (SDS) to break non-covalent bonds, and eventually a sonication step, are employed to ensure the solubility of gluten proteins and achieve their separation into monomeric polypeptides and disulfide bonded polymers. Further identification of gluten proteins is generally achieved by electrophoresis and reducing conditions are used to evidence the sub-unit constituting disulfide bonded polymers. -, - - and -gliadins can be thus identified according to their electrophoretic mobility. / and -gliadinsare characterized by an even number of cystein residues involved in intramolecular disulfide bonds while -gliadin is free of cysteines .As a consequence, / and gliadins are partially folded whereas -gliadin is totally disordered like glutenin subunits.
The impact of the wheat protein composition on breadmaking quality has been investigated for a long time, and a positive correlation was found between the amount of glutenin and the remarkable viscoelasticity of gluten (Singh et al., 1990). This correlation was further refined by considering the molecular size distribution of disulfide bonded glutenin polymers (Cornec et al., 1994). However, fractionation-reconstitution studies showed that the glutenin content is not the unique parameter to take into account (Janssen et al., 1996). Gliadin somehow has been found to promote the formation of a protein network (Song and Zheng, 2008). As a consequence, the non-covalent bonds involved in gliadin-glutenin interactions may probably be also important for the understanding of gluten rheology.
Our strategy to investigate gluten structure is to study model glutens with controlled and tunable compositions in a mild chaotropic solvent, an ethanol/water (50/50 v/v) mixture (Banc et al., 2017). This solvent is expected to impact the protein structure in a less harsh way as compared to a buffer containing SDS. Ethanol/water binary solvents are known as co-solvents of gliadin (Dill and Alsberg, 1925). We have nevertheless recently shown that glutenin-rich extracts (up to 66 % of glutenin by weight) can be as well solubilized in this solvent (Banc et al., 2019; Pincemaille, 2018). The addition of
4
ethanol enclosing both polar and apolar moieties may act as a compatibilizer (Zhang and Hoogenboom, 2015) and assist the dissolution of wheat proteins while keeping some intermolecular non-covalent interactions. Accordingly, we have previously evidenced the presence of low density supramolecular assemblies of proteins, with size of the order of 100 nm, for extracts with equal content of gliadin and glutenin solubilized in ethanol/water (Dahesh et al., 2014). In the semi-dilute regime assemblies induce the presence of regions, of comparable size, with strong hydrogen bonds between proteins (Banc et al., 2016). In addition, in ethanol/water we expect the gluten network architecture to be preserved since rheological properties, in particular the elastic plateau, are coherent with that of native gluten in water (Dahesh et al., 2016).
The objective of this work is to characterize the structure of gluten polymers and gluten polymer assemblies for very dilute protein solutions in a mild solvent. We use protein extracts with varying glutenin (Glu) content from 1 % to 57 %. The use of a mild solvent has enabled the investigation of the supramolecular assemblies involving as well non-covalent intermolecular bonds. We have observed an unexpected phase behavior evolution with the protein composition that has been understood thanks to an in-depth structural analysis, using AsFlFFF coupled to differential refractive index (dRI), multi angle light scattering (MALS) and dynamic light scattering (DLS) detections. The combination of dRI, MALS and DLS detections has resulted in a thorough characterization of all species dispersed in ethanol/water as a function of the protein composition. The study has been completed by an analysis of the polypeptide composition of the eluted AsFlFFF fractions by size exclusion chromatography in a denaturating solvent.
2. MATERIAL AND METHODS 2.1 Material
Native gluten powder was courtesy of Tereos-Syral Company (France). The moisture content of the gluten was 5.9 % and its protein content (dry basis) was 73.3 %. Six protein extracts, with different glutenin content (Glu/(Gli+Glu) comprised between 1 % and 57 % w/w where Gli and Glu are the masses of gliadin and glutenin respectively), soluble in an ethanol/water mixture (50/50, v/v), were obtained following a protocol inspired from Dahesh et al. (Dahesh et al., 2014) and detailed in (Pincemaille, 2018). Gluten powder (20 g) was placed in a centrifuge bottle (volume 250 mL) with 200 mL of 50 % (v/v) ethanol/water solvent and submitted to a continuous rotating agitation (60 rpm at 20 °C) for 19 h. After a 30 min centrifugation at 15 000 g at 20 °C, the clear supernatant was quenched at a low temperature Tq for 1 h using a water circulating bath, yielding a liquid-liquid phase separation. The quenching temperatures used were Tq= 12, 9, 6 and 2 °C. To fully separate the transparent supernatant and the more turbid dense phase, a second centrifugation at 10 000 g, at the same temperature Tq was performed during 33 minutes. The ethanol content of the two separated phases was decreased to allow a proper freeze-drying: five volumes of water were added per volume of the dense phase, while the ethanol of the light phase was partially evaporated under a fume hood for 48 h. The solutions were subsequently frozen at -40 °C before being freeze-dried and ground. Extracts comprising 1 %, 9 % and 23 %, of glutenin were obtained from the supernatants of the samples quenched at Tq=2 °C, 6 °C and 12 °C respectively. By contrast, extracts enriched in glutenin were obtained from the dense phase: Glu 29 %,
5
Glu 47 % and Glu 57 %, extracts were obtained from samples quenched at Tq = 2 °C, 6 °C and 9 °C respectively.
For sample preparation, the lyophilized powders were dispersed in ethanol/water solvent (50/50 , v/v) at the required concentration and mixed overnight at room temperature on a rotary shaker. For DLS, HPSEC and AsFlFFF analyses, samples were firstly dispersed at 20 g/L, then diluted to the final concentration and filtered on cellulose mixed ester (CME) syringe filters with a pore size of 0.8 μm to remove dust particles and very large aggregates.
2.2 Size exclusion high performance liquid chromatography (HPSEC)
Protein size distribution was measured using size exclusion high-performance liquid chromatography (HPSEC) performed on an Alliance system equipped with a TSK G4000 SWXL column (Morel et al., 2000). Samples were prepared at a protein concentration C = 4 g/L in ethanol/water (50/50 v/v), filtered and then diluted to reach a concentration of about 1 g/L in a denaturing buffer composed of 0.1 M sodium phosphate at pH 6.8, 1 % sodium dodecyl sulfate (SDS) and 6 M urea. Elution of the injected sample (20 μl) was performed at 0.7 ml/min in a 0.1 M sodium phosphate buffer at pH 6.8, 0.1 % SDS. Detection of the different species was recorded at a wavelength of 214 nm. The apparent molar mass calibration of the column was obtained using a series of protein standards with molar mass (M) in the range 13 to 2 000 kDa according to Dahesh et al. (Dahesh et al., 2014).
2.3 Phase diagram determination and modulated differential scanning calorimetry (MDSC)
For samples with a concentration C < 150 g/L the liquid-liquid phase separation temperature was determined by visual observation. 1 mL samples prepared in transparent vials were immersed in a water bath at ambient temperature (about 20 °C) and the bath temperature was decreased by 0.5 °C every 10 minutes. The liquid-liquid phase separation temperature was defined as the temperature from which samples became cloudy.
For samples with C > 150 g/L the liquid-liquid phase separation was determined and analyzed using modulated differential scanning calorimetry (MDSC) which uses small volumes of samples (less than 100 µL) but requires sufficiently high concentration (Pincemaille et al., 2018). MDSC measurements were performed in the DSC Q2000 calorimeter from TA instrument calibrated with indium. For each protein solution, three aluminum pans (40 µL TzeroHermetic Pan and Lid) were prepared with 10-30 mg of sample and sealed. An empty pan was used as reference. A modulated temperature with amplitude of 0.3 °C over a period of 60 s was applied with a cooling rate of -2 °C/min from 40 °C to -10 °C. Reported values (onset temperature of the transition and amplitude of the thermal transition) were obtained by TA Universal Instrument Analysis software, version 4.5A. The energy involved in the liquid-liquid transition was determined according to the data analysis described in supporting information SI 1.
6
2.4 Batch dynamic light scattering (DLS)
Dynamic light scattering measurements were carried out at room temperature on batch samples (with C = 5 g/L) for scattering angles in the range (20-140)°, yielding scattering wave vectors 𝑞 = 4𝜋𝑛0⁄ sin(𝜃/2) in the range (5.6-30.1)x10𝜆 6 m-1. Here n0 = 1.357 is the refractive index of the solvent (ethanol/water 50/50 v/v), and λ = 532 nm is the wavelength of the incident light (a Cobalt diode-pumped solid-state laser). The intensity auto-correlation functions, g2(τ)-1, were calculated using an Amtec goniometer and a Brookhaven BT9000 correlator for delay times, τ, in the range (10-6 - 1) s. Correlation functions were analyzed using a double exponential function: 𝑔2(𝜏) − 1 = [B1. exp(−1τ) + B2. exp(−2τ)]2 , where I are the decay rates, and Bi are the associated amplitudes. The decay rates were plotted as a function of q² and the translational diffusion coefficients DTrans were obtained after extrapolation of the slope of the I vs q² plot to zero scattering angle. Hydrodynamic radii, 𝑅𝐻, were obtained using the Stokes-Einstein relationship, 𝑅𝐻=
𝑘B𝑇
6𝜋𝜂0𝐷Trans , where 𝑘B𝑇 is the thermal energy and 𝜂0 is the solvent viscosity (𝜂0 = 2.788 mPa s).
2.5 Asymmetrical flow field-flow fractionation (AsFlFFF)
Asymmetrical flow field-flow fractionation experiments were carried out using a Dual Tech System (Wyatt Technology Europe, Dernbach, Germany) coupled with a Dionex® ultimate 3000 Series high-performance liquid chromatography (HPLC) system (LC-Packings, Dionex, Amsterdam, The Netherlands). The AsFlFFF channel had a trapezoidal geometric shape (length 26.54 cm, width of the inlet 1.60 cm, and width of the outlet 0.40 cm) and a thickness of 350 µm. The membrane used as bottom wall of the channel was made of regenerated cellulose with an average molar mass cut-off of 10 kDa (Wyatt Technology Europe, Dernbach, Germany). The separation system was coupled with a 18 angles MALS Heleos II instrument (Wyatt Technology, Santa Barbara, CA, USA) and an Optilab Rex refractometer (Wyatt Technology, Santa Barbara, CA, USA). The MALS detector used a laser with a wavelength
= 658.8 nm, and the response of the various photodiodes was normalized with a solution of bovin serum albumin protein. The intensity of the light scattering was calibrated by using toluene (HPLC quality). A 0.1 μm in-line filter (VVLP, Millipore, Germany) was placed between the pump and the channel in order to remove large impurities from the eluent. A DLS detector (Wyatt Technology, Santa Barbara, CA, USA) was positioned at a fixed scattering angle (129°) on the MALS, set-up, corresponding to q = 23x106 m-1. Auto-correlation functions were acquired and averaged over 2s.
We have developed an optimized flow program to separate gluten monomers and assemblies in ethanol/water (50/50 v/v) with AsFlFFF. The difficulty was to manage the high viscosity of the ethanol/water mixture used as eluent (𝜂0 = 2.788 mPa s at room temperature, as compared to 1 mPa s for water-based eluent), which induces high pressures in the channel. The channel flow was fixed at 0.6 mL/min for the entire AsFlFFF run and only the cross-flow rate was varied. A cross-flow rate of 1.5 mL/min was initially fixed for a 2 minutes focus step. Then, 50 µl of protein solutions (C= 4 g/L) were injected during the 5 minutes focus/injection step with the cross flow maintained at 1.5 mL/min. At the end of the focus-injection stage, for elution, the crossflow was linearly decreased from 1.5 mL/min to
7
reach 0.15 mL/min in 25 minutes and then maintained at 0.15 mL/min for 10 minutes. At the end of the run, the crossflow was stopped for 2 minutes before rinsing the injection loop with the carrier solvent for 2 minutes and eluting it for 2 minutes without crossflow.
Collecting and processing of data were performed using Astra software (version 6.1.7 Wyatt technology, Santa Barbara, CA, USA). In order to calculate the concentration along elution from the dRI signal, we used a constant value dn/dC=0.169 mL/g where n is the refractive index of the protein solution of concentration C as calculated for gluten proteins in ethanol/water (Zhao et al., 2011). A single exponential decay, 𝑔2(𝜏) − 1 = B1. exp(−1τ), was used to fit DLS correlation functions acquired with a delay time comprised between 2 µs and 1 s. The Stokes Einstein equation was used to derive the hydrodynamic radius from the translational diffusion coefficient using a temperature dependent solvent viscosity since the temperature in the channel was measured to vary from 30 °C to 33 °C. The solvent viscosity was estimated following 𝜂0(𝑇) = 2.8836 exp(-0.032136 (T-20)) mPa s, with T in °C, according to our measurements and data from the literature (Gonzalez et al., 2007; Khattab et al., 2012; Pires et al., 2007) (See supporting information SI 2 for details). A Zimm analysis was used to fit the MALS data. In the limit qRg << 1, where Rg is the radius of gyration:
𝐾𝐶 𝑅 = (1 + 𝑅𝑔2𝑞2 3 )( 1 𝑀+ 2𝐴2𝐶)
where R is the excess Rayleigh ratio, C the concentration, M the molar mass, A2 the second virial coefficient and K an optical constant: 𝐾 = 4𝜋2𝑛02(d𝑛 d𝐶⁄ )2/𝒩𝑎𝜆4 with 𝒩𝑎 the Avogadro number. In the approximation 𝐴2→ 0, M is given by the ordinate at the origin of a
𝐾𝐶
𝑅 versus sin 2 𝜃
2 plot, while Rg is given by the slope. Data issued from all scattering angles were used for fitting the fractions eluted before 25 minutes, whereas only the lowest scattering angle data (q<11x106 m-1) were used for fractions eluted after 25 minutes in order to satisfy qRg << 1.
Figure 1 displays typical raw DLS and MALS data acquired at short and long elution times and fitted with the models described above. Because of the weak scattering of the small objects eluted at short elution times, DLS and MALS data are very noisy as compared to data acquired at longer elution times. We find that, whatever the size of the objects, their hydrodynamic radius, RH, could, be measured by DLS, with an absolute error RH ~ 2 nm and the molar mass was measured by MALS with a relative error comprised between 3 and 7 %. By contrast, the radius of gyration could be only measured reliably for samples eluted after 25 minutes with an absolute error of a few nanometers. In addition, the quality of the experimental data depends on the protein concentration. In the following, data are reported and analyzed only for elution times at which the protein concentration is above 3 mg/L.
Using the flow program that we have developed the recovery of all gluten samples was higher than 80 % as evaluated by a comparison of the protein contents injected and eluted. Moreover, the good repetability of AsFlFFF experiments was checked by performing six repetitions with the Glu 47 % extract (see supporting information SI 3 for details).
8
Figure 1. Typical DLS (a and b) and MALS (c and d) data measured at short (a and c) and long elution times (b and d) (16 and 28 minutes respectively for Glu = 47 %). DLS data are fitted by a single exponential decorrelation function that gives (a) RH = 5 ± 2 nm and (b) RH = 71 ± 1 nm. MALS data are fitted according to a Zimm plot and gives (c) M = (6.9 ± 0.5)104 g/mol and (d) M = (1.29 ±0.04)107 g/mol, Rg = 108 ± 5 nm.
3. RESULTS
3.1 Macromolecular composition of model gluten samples
Macromolecular composition of the gluten extracts was characterized by HPSEC analyses carried out in SDS buffer after sample denaturation with urea and SDS in order to break all weak interactions between proteins. Nevertheless, the non-reducing conditions ensured the integrity of glutenin polymers crosslinked by disulfide bonds. The molar mass distribution of the different extracts is illustrated by the HPSEC elution profiles shown in Figure 2. Before 9 minutes of elution, an excluded peak is measured, which corresponds to non-fractionated very large mass (M > 106 g/mol) glutenin. Between 9 and 13 minutes, smaller glutenin polymers, with 105 < M <106 g/mol, are eluted. Gliadins are recovered within two main peaks: -gliadins are eluted between 13 and 14.5 minutes while the other gliadins are eluted between 14.5 minutes and 16 minutes. Finally residual globular albumins and globulins are eluted after 16 minutes. The albumin/globulin content remains approximately constant in all extracts (about 10 %).
-0.05 0 0.05 0.1 0.15 0.2 0.25 0.3 10-6 10-5 0.0001 0.001 0.01 0.1 1 g 2 1 (s) (a) -0.05 0 0.05 0.1 0.15 0.2 0.25 0.3 10-6 10-5 0.0001 0.001 0.01 0.1 1 g 2 1 (s) (b) 1 10-5 1.2 10-5 1.4 10-5 1.6 10-5 1.8 10-5 2 10-5 0 0.2 0.4 0.6 0.8 1 (c) KC/ R ( m ol /g) sin² (/2) 8 10-8 1.2 10-7 1.6 10-7 2 10-7 2.4 10-7 2.8 10-7 0 0.2 0.4 0.6 0.8 1 (d) KC/ R ( m ol /g) sin² (/2)
9
The extracts are labelled according to their glutenin content, calculated from the sum of the fractions area corresponding to glutenin (including the excluded peak) relative to the total gliadin + glutenin area (excluding albumin and globulin). We have prepared protein extracts with a glutenin (Glu) fraction that ranges between 1 and 57 %. An interesting observation is that the gliadin fraction is enriched in -gliadin and the distribution of glutenin polymer molar masses is shifted toward high masses when the glutenin content increases.
Figure 2. HPSEC profiles of the gluten protein extracts solubilized in 0.1 M phosphate buffer at pH 6.8
with 0.1 % SDS and 6 M urea. Vertical dashed lines display the limits used to define the protein composition of gluten samples. The grey line gives the molar mass calibration of the column.
3.2 Phase diagrams in ethanol/water
The temperature-concentration phase diagrams of the six gluten extracts solubilized in ethanol/water 50/50 v/v are shown in Figure 3. All samples are monophasic at room temperature whatever the protein concentration C (from 10 to 600 g/L) and undergo a liquid-liquid phase separation at low temperature. We find that three classes of samples can be distinguished based on their maximum transition temperature (critical temperature Tc): (i) Tci ~ 5 °C for gliadin-rich samples (Glu ≤ 9 %) (ii) Tcii~9°C for samples with an intermediate glutenin content (Glu = 23 %), (iii) Tciii ~ 12 °C for glutenin-rich samples (Glu ≥ 29 %). Interestingly, the glutenin-rich and glutenin-poor samples are also characterized by different DSC thermograms (Fig. 4a and b). In all cases, upon decreasing temperature, an increase of the apparent heat capacity is observed at the liquid-liquid phase separation temperature. The integrated exothermic peak corresponds to about 3 J/g of protein which is in the order of magnitude of energy
0 0.2 0.4 0.6 0.8 1 1000 104 105 106 107 8 10 12 14 16 18 Glu=1% Glu=9% Glu=23% Glu=29% Glu=47% Glu=57% No rm a li s ed a b s o rb a n c e 2 1 4 nm ( a .u .) M ( g /m ol )
10
involved in the liquid-liquid phase separation of synthetic polymers (Dreezen et al., 2001; Seuring and Agarwal, 2012). However, the shape of the transition peak evolves. Class (i) samples are characterized by a sharp heat capacity peak at the transition temperature independently of the concentration (Fig. 4a) whereas a smoother peak is observed at low concentration for samples of classes (ii) and (iii) (Fig. 4b). The sharpness of the peak could be quantified by the amplitude of the step CL-L (as defined in the inset of Fig. 4c) normalized by the protein mass fraction P in each sample (P=
𝑚𝑃
𝑚𝑇 with mP the protein mass and mT the total mass of the sample). This quantity is roughly constant with sample concentration for class (i) samples, whereas it increases with concentration until C = 300 g/L and then reaches a constant value equal to that of classes (ii) and (iii) samples. With the hypothesis that the energy released by one gram of protein during the liquid-liquid phase separation is constant, the measurements suggest that at the transition temperature all proteins of class (i) samples are involved in the phase separation process whatever the concentration, whereas only a part of the protein from class (ii) and (iii) samples are involved for C < 300 g/L. This suggests that another phase separation could occur at lower temperature for the remaining proteins. Above this concentration, all proteins would be involved in the liquid-liquid phase separation at the same transition temperature. Interestingly, the threshold concentration (C ~ 300 g/L) corresponds to the minimum concentration at which phase diagrams roughly overlap (Fig. 3).
Figure 3. Phase diagram of protein extracts solubilized in ethanol/water 50/50 v/v. L displays the
monophasic domain and L+L displays the biphasic domain.
A multiple phase-separation in class (ii) and (iii) samples is also supported by optical microscopy observations performed during temperature quenches (Fig. 4d). A class (iii) sample (protein concentration 237 g/L, prepared with a Glu 47 % extract) was first quenched at 10.5 °C, yielding a phase-separation via spinodal decomposition. Drops of protein-poor phase are observed in a protein-rich continuous phase at the end of the separation process. Hereafter, a further quench into a lower temperature yields textures consistent with spinodal decomposition both in the droplet and in the continuous phase. This finding is the signature of multi-step phase-separation processes in line with DSC measurements. -10 -5 0 5 10 15 0 100 200 300 400 500 600 Glu=1% Glu=9% Glu=23% Glu=29% Glu=47% Glu=57% T (° C ) C (g/L) L+L L
11
Figure 4. DSC profiles, heat capacity versus temperature, for protein solutions at different concentrations
(as indicated in the legend) in ethanol/water 50/50 v/v for extracts with composition Glu = 1 % (a) and Glu = 29 % (b). (c) Amplitude of the step, CL-L ,as defined in the inset, normalised by the protein mass fraction, p, as a function of the sample protein concentration for Glu = 1 % and Glu = 29 % extracts. Dashed lines are guides for the eyes. Inset: Comparison of DSC profiles for two samples prepared with Glu = 1 % and Glu = 29 % extracts, at a protein concentration of 198 g/L (d) Light microscopy picture of the ethanol/water solution of the extract Glu = 47 % at 237 g/L following a two-step temperature quench (from 20 °C to 10.5 °C and 150 min later, from 10.5 °C to 8 °C).
The complex molar mass composition of the gluten protein extracts could be at the origin of the peculiar phase behavior of the samples. According to Flory theory for polymers (Daoud and Jannink, 1976), as the polymerization degree of macromolecules increases, the critical temperature is expected to increase and the critical concentration to decrease. Although the phase diagrams (Fig. 3) are too noisy to reliably extract critical concentrations, they clearly exhibit higher critical temperature for glutenin-rich extracts (class iii). However, according to the molecular mass distributions of the different extracts a continuous
0 0.05 0.1 0.15 0.2 0.25 0.3 100 150 200 250 300 350 400 450 500 Glu=1% Glu=29% C (g/L) C L -L / P ( J / (° C g)) (c) -5 0 5 10 15 132 g/L 198 g/L 238 g/L 264 g/L 330 g/L 396 g/L 462 g/L 4.8 4.85 4.9 4.95 5 5.05 5.1 A ppa re nt he a t c a pa c ity ( J /(° C g)) T(°C) 0.05J/(°C g) (a) -5 0 5 10 15 20 132 g/L 198 g/L 238 g/L 264 g/L 330 g/L 396 g/L 462 g/L 4.8 4.85 4.9 4.95 5 5.05 5.1 Ap p a re n t h e a t c a p a c it y ( J /(° C g )) T(°C) 0.05J/(°C g) (b)
25 µm
(d) -5 0 5 10 15 20 Glu=1% Glu=29% A p pa ren t heat ca pa cit y (J/ (° C g )) T(°C) 0.05J/(°C g) C L-L12
evolution of phase diagram would be expected, at odds with our findings. This suggests that other effects probably due to interactions between proteins have to be taken into account.
3.3 Structural characterization in ethanol/water
Structural characteristics of dilute samples prepared by dispersing the different protein extracts in ethanol/water were firstly investigated by batch multi-angle DLS. For all extracts, autocorrelation functions are satisfactorily fitted using a double exponential model, suggesting a bimodal size distribution. The two decay rates are plotted in Figure 5 as a function of the square of the scattering vector. The high decay rates, corresponding to a small size population, vary linearly with q², indicating a diffusive behavior from which diffusion coefficients and hydrodynamic radii can be easily deduced. We measure that the hydrodynamic radii increase progressively from to 2 nm to 8 nm with the glutenin content (Table 1). By contrast, the smaller decay rates vary linearly with q², signing a diffusive process, only at small q, whereas the high q regime evolves erratically. An extrapolation from the low q data is used to determine the diffusion coefficient, from which one determines a hydrodynamic radius similar for all protein extracts RH ~ (80±20) nm (Table 1). This size is reminiscent of assemblies previously identified by us for a sample with Glu = 53 % (Dahesh et al., 2014; Schmidt et al., 1979). The deviation from the diffusive process, observed from qRH ~ 1, was attributed to the internal dynamics of large and loose protein assemblies. Hence, batch DLS are not consistent with a monomodal size distribution. Instead, all data can be modeled as resulting from a bimodal size distribution of the scattering objects. However, we note that the strong scattering of large objects dominates the light scattering signal and can hide the signal of other smaller populations. Moreover, the proportion of the different size populations is difficult to reliably estimate by batch DLS, as it requires to know the density of the different type of objects or assume that they have the same density. A separation step prior to light scattering appears therefore crucial to better characterize the samples structure.
Figure 5. Batch DLS, for solutions of gluten protein extracts dispersed in ethanol/water (50/50 v/v). (a)
Fast and (b) slow decay rates as a function of q². Lines correspond to linear fits of the experimental data. 0 5000 1 104 1.5 104 2 104 2.5 104 3 104 0 2 1014 4 1014 6 1014 8 1014 1 1015 Glu=1% Glu=9% Glu=23% Glu=29% Glu=47% Glu=57% fas t (s -1 ) q² (m-2) 0 200 400 600 800 1000 1200 0 2 1014 4 1014 6 1014 8 1014 1 1015 Glu=1% Glu=9% Glu=23% Glu=29% Glu=47% Glu=57% slow (s -1 ) q² (m-2)
13
Glu (%)
R
H1(nm)
±0.5 nm
R
H2(nm)
±20 nm
1
2
70
9
4
80
23
4
90
29
7
70
47
8
100
57
8
80
Table 1. Hydrodynamic radii, as measured by batch DLS, for solutions of gluten protein extracts
dispersed in ethanol/water (50/50 v/v).
AsFlFFF combined with online dRI, MALS and DLS detections was performed on the different gluten extract solutions prepared in ethanol/water. As detailed in the Material and Methods section, a procedure with ethanol/water 50/50 as eluent was developed on purpose. The crossflow profile enabled to separate the different populations previously identified by batch DLS (Fig. 6a). Consistent results were obtained for the different protein extracts. Between 10 and 25 min we find that the hydrodynamic radius of the eluted objects linearly increases with elution time, from 5 to 20 nm. At 25 min a sharp increase of RH, from 20 to 70 nm, is observed before elution of bigger objects, whose hydrodynamic radius increase from 70 nm to 120 nm, as elution time varies from 25 to 32 min. However, the large hydrodynamic radii values are probably underestimated and must be taken with care. Indeed, large hydrodynamic radii are difficult to measure during flow through DLS cell since the dynamics of the flow can perturb the Brownian motion detection. In principle, the maximum measurable hydrodynamic radii could be increased using a larger angle of detection, but at the same time qRH must be small enough to avoid measurement to be affected by the internal dynamics of the loose objects (Rolland-Sabate et al., 2008). Nevertheless, large objects scatter a lot and the MALLS measurements give confident radius of gyration values for elution times larger than 25 min (Figure 1d). We find that the values of the radius of gyration are similar to the numerical values measured for RH (Figure 7a). The discontinuity of the eluted radii, which is not expected for a linear decrease of the crossflow (Rolland-Sabate et al., 2011), can be attributed to some differences in the internal structure of the eluted objects. The transition from the normal mode to the steric/hyperlayer mode could also explain a decrease of size selectivity for elution times larger than 25 min (Myers and Giddings, 1982). Of note, the RH elution profile is identical for the 6 extracts as expected for flow fractionation of similar objects even though the big objects are absent for glutenin-poor samples. The molar masses measured as a function of the elution time (Fig. 6b) show consistent trends with the RH elution profile. Before 18 minutes of elution, molar masses independent of the elution time are measured. The masses moreover are found to significantly increase with the glutenin content of the samples (from ~ 3 104 to ~ 105 g/mol, when Glu varies from 1 % to 57 %). An insufficient focusing step or overloading could explain this feature (Wahlund, 2013). Up to 25 minutes of elution, the molar masses range from 3 104 to 106 g/mol and are consistent with the protein masses measured by HPSEC. By contrast, after 25 minutes, we measure masses of several 107 g/mol. These
14
masses are higher than the ones resolved by the HPSEC column used in this study, but are also larger than those previously measured by us in a denaturing solvent with a set-up that extends the resolution range of HPSEC (Dahesh et al., 2014). Remarkably, these masses are consistent with the mass of assemblies (2.7 107 g/mol) identified in ethanol/water by batch MALS for a sample with Glu = 53 % (Dahesh et al., 2014).
Figure 6. (a) Crossflow rate (line) and hydrodynamic radii (dots), as measured by online DLS, (b) molar
mass M, as measured by online MALS and (c) dRI signal measured as a function of the AsFlFFF elution time for the different extracts, as indicated in the legend, solubilized and eluted in ethanol/water (50/50 v/v). (d) Percentage of proteins involved in species with M > 106 g/mol measured in ethanol/water (50/50 v/v) by AsFlFFF, and in SDS buffer by HPSEC for each extract.
In addition, the proportion of proteins involved in each population can be estimated by the dRI signal intensity. Figures 6c displays the normalized dRI intensity as a function of the elution time for the six extracts. As the glutenin content increases the peak corresponding to small sizes decreases whereas the area corresponding to intermediate (eluted between 20 and 25 minutes) and large sizes increase. As a first hypothesis, large sizes could be attributed to glutenin polymers. However, comparing HPSEC data acquired in a denaturing solvent with AsFlFFF data acquired in ethanol/water, we find significantly
0 0.05 0.1 0.15 0.2 10 20 30 40 Glu=1% Glu=9% Glu=23% Glu=29% Glu=47% Glu=57% Nor m a li s ed d R I (a .u )
AsFlFFF elution time (min)
(c) 104 105 106 107 108 10 20 30 40
AsFlFFF elution time (min)
M (g /m o l) (b) 0 20 40 60 80 100 120 140 0 0.2 0.4 0.6 0.8 1 1.2 1.4 1.6 0 10 20 30 40 R H ( n m) V c (ml /m in )
AsFlFFF elution time (min)
(a) 0 5 10 15 20 25 0 10 20 30 40 50 60 SDS buffer Ethanol/water 50/50 v/v % of pr o te in inv ol v e d i n s pe cie s wi th M >10 6 g/ mo l Glu (%) (d)
15
different results concerning the fraction of protein involved in objects with M > 106 g/mol (Fig. 6d). For samples with Glu ≥ 29 % prepared in ethanol/water, until twice as much proteins in the ethanol/water solvent than in the SDS buffer are found. This strongly suggests the presence of supramolecular assemblies involving weak interactions in an ethanol/water solvent.
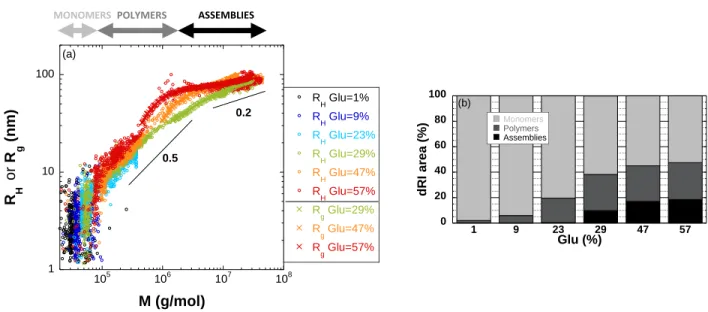
Figure 7. (a) Hydrodynamic radii and radii of gyration as a function of the molar mass for the different
extracts solubilized in ethanol/water (50/50 v/v) (b) Structural composition of the different extracts in ethanol/water.
Beside the estimation of molar masses of the objects, the MALS data enable to measure their radius of gyration Rg if the scattering signal is sufficient. In our case, as shown above (Fig. 1) we can only measure Rg for the large objects probed after 25 minutes of elution. The scaling of the radius of gyration with the molar mass, Rg M, provides information on the conformation of the objects: for a rod,
for a linear random coil and for a compact sphere (Flory, 1953). Such analysis can be performed with the hydrodynamic radius if the ratio 𝑅𝑔
𝑅𝐻 remains constant over a population. We show in Figure 7a the evolution of RH and Rg with M, for the six investigated extracts. Three main populations are evidenced depending on the molar mass. Molar masses smaller than 105 g/mol correspond to gliadins and low molecular weight glutenins. The objects belonging to this class are coined later on as monomers. For protein monomers, no clear evolution of the size with the molar mass is observed because of the large scattering of the data. For 105 < M < 2 106 g/mol, a clear power law evolution with an exponent
0.55±0.10, characteristic of coils, is evidenced for all samples with Glu ≥ 23 %. This power law demonstrates the polymeric structure of the eluted objects. In the following, this population will be generically defined as polymers. Finally, we find that the radius of gyration of the objects with a molar mass M > 2 106 g/mol does not evolve significantly with M. The size of these objects, which we coin as assemblies, appears limited to about Rg ~ 100 nm, even though their molar mass can reach 5 107 g/mol. The power law exponent ( ~ 0.2) is not compatible with a constant internal structure and rather
MONOMERS POLYMERS ASSEMBLIES
0 20 40 60 80 100 1 9 23 29 47 57 Monomers Polymers Assemblies dRI are a (%) (b) Glu (%) 1 10 100 105 106 107 108 R H Glu=1% R H Glu=9% R H Glu=23% R H Glu=29% R H Glu=47% R H Glu=57% R g Glu=29% R g Glu=47% R g Glu=57% R H o r R g ( n m) M (g/mol) (a) 0.5 0.2
16
indicates an increase of the apparent density with the molar mass or a change of the mass distribution into the objects (Schmidt et al., 1979). The apparent density, calculated using 𝜌 =4/3𝜋𝑅𝑀
𝑔 3 𝑁 𝑎( 3 5) 3 2 , effectively increases from 1 to 7 kg/m3 with the molar mass (from 106 to 3 107 g/mol) for the assemblies identified for samples prepared with glutenin-rich extracts (Glu > 29 %). The low numerical values indicate very loose structures since gluten protein density is 1300 kg/m3. For comparison, protein assemblies such as casein micelles display an apparent density comprised between 80 and 300 kg/m3 (Glantz et al., 2010).
Figure 8. (a) Identification of the 5 fractions (Ci) collected along the AsFlFFF elution time of the
Glu = 47 % sample (b) Normalised HPSEC profiles of the collected fractions diluted in 0.1 M phosphate buffer at pH 6.8 with 0.1 % SDS and 6 M urea compared to the parent sample Glu = 47 %. (c) % of total proteins found in each collection.
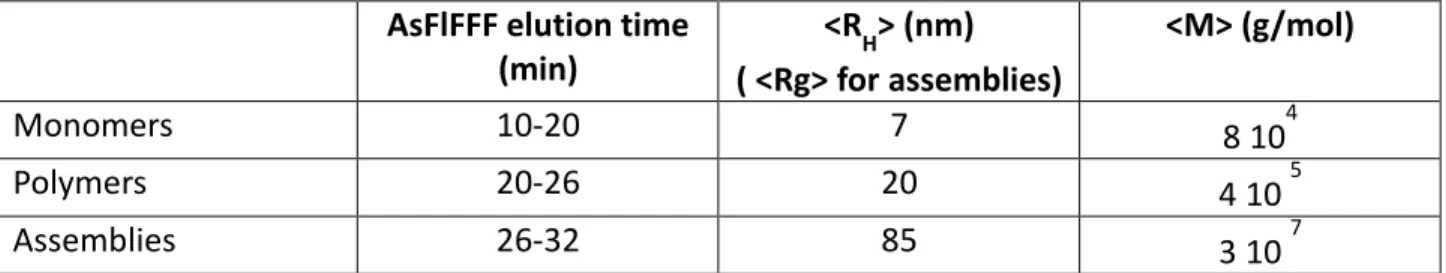
To summarize, we have identified three classes of objects according to their physical structure: monomers (3 104 < M < 105 g/mol), polymers (105 < M < 2 106 g/mol) and assemblies (M > 2 106 g/mol) (Table 2). Thanks to the dRI detection we have quantified the proportion of protein involved in each class for the different extracts (Fig. 7b). The fraction of monomers decreases with the Glu content while the
MONOMERS POLYMERS ASSEMBLIES
0 10 20 30 40 50 60 C1 C2 C3 C4 C5 Glutenin -gliadin ,-gliadin P rote in di s tr ibu tio n ( % ) Collection (c) C1 C2 C3 C4 C5 0 0.5 1 1.5 2 2.5 3 8 10 12 14 16 18 No rm a li s e d a b s o rb a n c e 2 1 4 n m ( a .u .)
HPSEC elution time (min)
C5 C4 C3 C2 C1 Glu=47% (b) ,-gli -gli Glu polymers 0 50 100 150 200 104 105 106 107 108 10 15 20 25 30 35 R H (n m ) M ( g /m ol )
AsFlFFF elution time (min)
17
fraction of polymers and assemblies increases. We find that the sample with intermediate glutenin content (Glu = 23 %) is pivotal since it contains polymers but almost no assemblies.
AsFlFFF elution time
(min)
<R
H> (nm)
( <Rg> for assemblies)
<M> (g/mol)
Monomers
10-20
7
8 10
4Polymers
20-26
20
4 10
5Assemblies
26-32
85
3 10
7Table 2. Average characteristics of the three identified structures.
3.4 Evidence of -gliadin-glutenin interaction
To get insight into the nature of the proteins involved in each type of structure, we collected five samples during the elution of a protein dispersion with Glu = 47 % (see Fig. 8a for the definition of the 5 collections), and characterized their protein composition using HPSEC in denaturing conditions. Figure 8b displays the normalized HPSEC profiles of the collected samples compared to the normalized HPSEC profile of the total extract Glu = 47 %. Collections 1 and 2 (C1 and C2) correspond to the monomer class and display similar HPSEC signatures. The ,-gliadin peak dominates the profile as expected, but low molecular weight glutenins are also present, and their distribution shift toward high masses with the AsFlFFF elution time. The light scattering signal indicates that glutenin detected at short elution time does not form assemblies. Notably, the proportion of -gliadin is very low (10 %) compared to that for the total extract profile (20 %). By contrast, collection 3 that corresponds to the polymer class includes large amount of —gliadin (26 %) and protein of high molar mass (found in the excluded peak), while it is depleted in ,-gliadin and small glutenins. Collection 4 and 5, which are associated to the assemblies, display similar characteristics and are even richer in -gliadin (33 % and 38 % respectively). To complete these data, Figure 8c shows the repartition of proteins in each collection. We clearly see that our AsFlFFF procedure, as opposed to HPSEC, does not separate individual proteins, but supramolecular protein objects. Most ,-gliadins are eluted in the monomer peak as expected, but glutenins are as much eluted in the monomer peak as in the polymer peak. Even more surprisingly, most
-gliadins are not eluted as individual species but through polymer or assemblies. This unanticipated result clearly shows that -gliadin, devoid of cysteines, interact with glutenin polymers through non-covalent interactions.
18
4. DISCUSSION AND CONCLUSION
4.1 Evidence of three classes of objects: monomers, polymers and assemblies
In the literature, aqueous ethanol solutions of wheat proteins are generally considered as gliadin solutions. By definition gliadins are monomeric proteins, but several authors have nevertheless identified the presence of high molar mass proteins (up to 700 000 g/mol) solubilized in this type of solvent (Bietz and Wall, 1980; Schmid, 2016; Shewry et al., 1983). Objects with hydrodynamic radius of about 100 nm co-existing with monomers were observed but disregarded (Boire et al., 2018). Exploiting the low temperature liquid-liquid phase separation of solutions of wheat gluten in ethanol/water 50/50 v/v (Boire et al., 2013), we developed extraction procedures to obtain ethanol/water soluble gluten protein extracts enriched in glutenin. Hence, in a solution of protein prepared with a 53 % Glu extract, we previously characterized the structure and the dynamics of the 100 nm large objects which dominate the signal in batch DLS (Dahesh et al., 2014). Here we use Asymmetrical Flow Field-Flow Fractionation (AsFlFFF) to separate objects solubilized in the mild chaotropic solvent. Indeed, AsFlFFF can size fractionate a very wide size range (from 2 nm to 1 µm in normal mode), limiting shear forces during separation since separation does not rely on a stationary phase (Nilsson, 2013; Wahlund, 2013). We show that gluten proteins solubilized in ethanol/water 50/50 v/v are either in the form of monomers (RH < 10 nm), or polymers (RH < 20 nm), or very loose assemblies (Rg ~ 100 nm). These assemblies display the same characteristics as those previously identified by us. The structural characteristics of these objects are not modified by the protein composition while the proportion of polymers and assemblies increases with the Glu content. In the past, wheat proteins were studied by AsFlFFF using more or less denaturing solvents, mainly buffers with surfactants (Arfvidsson et al., 2004; Aussenac et al., 2001; Lemelin, Aussenac, et al., 2005; Wahlund et al., 1996) and dilute acetic acid (Pitkanen et al., 2014; Stevenson and Preston, 1996; Stevenson et al., 1999; Ueno et al., 2002). The mass distribution of gluten proteins was measured to range from 3 104 g/mol until several 108 g/mol and glutenins were associated to masses higher than ~ 106 g/mol. Interestingly, using either SEC-MALS or AsFlFFF-MALS, several authors (Carceller and Aussenac, 2001; Mendichi et al., 2008; Pitkanen et al., 2014) identified a change of scaling exponent in the conformation plot (log-log plot of Rg versus M) around this molar mass. Our measurements are in agreement with this finding. However, the power law exponent characterizing the conformation of the species (Rg Mwere smaller in their solvents (below 0.33) and interpreted with difficulty. Using ethanol/water (50/50 v/v) wheat proteins are in good solvent conditions, without additional interacting molecules such as detergent, and results are more easily interpreted using polymer physics. In addition, a maximum size (Rg) of the eluted objects was also measured around 100 nm for glutenin extracted using sonication in a 2 % SDS buffer (Mendichi et al., 2008) or in 0.05 M acetic acid (Pitkanen et al., 2014). Hence this limited size is observed for different protein extraction processes and is not limited to aqueous ethanol soluble proteins. It could be associated to the biosynthesis of wheat storage proteins that involve the formation of dense protein granules (Bechtel et al., 1982). Schmid et al (Schmid, 2016) proposed a similar hypothesis to explain the presence of high molecular weight species, named HMW-gliadin, dissolved in 60 % ethanol and separated in acetonitrile/trifluoroacetic acid. According to this study, HMW-gliadin is composed of equal proportion
19
of glutenin (mainly low molecular weight subunit) and gliadin, like the assemblies identified by us. However, in their case, gliadin including an odd number of cysteines would act as terminator of glutenin polymerization (Schmid et al., 2017) and -gliadin represents only 13 % of proteins. By contrast, in our study monomeric proteins are evidenced in assemblies and -gliadin represents more than 30 % of the total proteins in these objects. The high associative properties of -gliadin in aqueous-ethanol are evidenced by their involvement up to 75 % in mass in total within polymers and assemblies (Fig. 8c). The tendency of -gliadin to bind to glutenin was previously evocated by Lemelin et al (Lemelin, Branlard, et al., 2005) who indicated that polymeric fractions separated by AsFlFFF using a SDS buffer were composed of high and low molecular weight glutenin subunits and -gliadins. In addition the extractability of -gliadin was found similar to that of glutenin by Fu et al. (Fu et al., 1996). The hypothesis of hydrophobic interactions is precluded by the persistence of the interaction observed in presence of SDS (Lemelin, Branlard, et al., 2005), while electrostatic interactions are not very likely due to the low content of charged amino acid residues (about 3 %) in the sequence of -gliadin. However, -gliadin is highly disordered along its whole sequence and contains many glutamines (more than 30 % regularly distributed in sequences) prone to form intermolecular hydrogen bonds, which very likely play a major role in the gluten structural and mechanical properties (Marchut and Hall, 2007). Nevertheless, the exact nature of the interactions between glutenin subunits and -gliadin involved has to be more clearly elucidated.
4.2 Temperature behavior
Wheat protein solutions in aqueous ethanol display an upper critical separation temperature (UCST) that changes with the protein composition. We showed recently that samples at a fixed protein concentration (C = 237 g/L) but prepared with different extract composition (Glu = 4, 44, and 66 %) phase-separate via a spinodal decomposition, whose kinetics depend on the sample viscoelasticity (Banc et al., 2019) . An UCST behavior requires strong intermolecular interactions that are weakened upon heating and lead to an enthalpy-driven solubility phase transition. The supramolecular interactions involved can be either ionic or hydrogen bonds. The amount of hydrophobic residues can raise the transition temperature like the molar mass of polymers through a decrease of the mixing entropy according to the Flory theory (Daoud and Jannink, 1976; Seuring and Agarwal, 2012). In addition the disparity in size of polymers causes the critical composition to shift into the solvent-rich region and results in asymmetric phase diagrams (Daoud and Jannink, 1976; Seuring and Agarwal, 2012). Hence, the evolution of the transition temperature observed with the different samples can be understood considering the supramolecular mass of objects dispersed in ethanol/water. Indeed, a transition at 12 °C is measured for samples (Glu ≥ 29 %) which contain assemblies (M ~ 2 107 g/mol) whatever their content, while a transition at 6 °C is measured for solutions which contain only monomers (M < 105 g/mol). Sample prepared with Glu = 23 %, which contains polymers but no assemblies, phase separate at an intermediate temperature Tc = 9 °C. As a consequence, the initiation of the phase separation appears to be piloted by the objects of maximal molar mass and pursued with objects of smaller mass when the temperature further decreases. This interpretation is strengthened by the DSC signals that show weaker heat capacity jumps for samples rich in glutenin in the concentration range where the transition temperatures are significantly different for gliadin-rich and glutenin-rich samples.
20
The phase diagram established for the most enriched in gliadin extract is consistent with the diagram measured by Dill for a pure gliadin extract (Dill, 1927). A critical temperature around 7-8 °C was measured, and the transition temperature was nearly independent of protein concentration. Our results are in agreement with these findings. By contrast, the phase diagram measured for gliadin by Boire et al. (Boire et al., 2018) displays a critical temperature of 12 °C and a protein concentration dependence that is reminiscent of what we observe for samples with Glu ≥ 29 %. This could be explained by the presence of assemblies evidenced by DLS that would pilot the cloud point temperature observed, although the gliadin extract contained only 7.6 % glutenin. This hypothesis is reinforced by a previous study (Boire et al., 2013) which mentioned that above 5 °C only proteins with M > 45 000 g/mol were separated.
The presence of supramolecular assemblies probably strongly impacts the rheological properties of samples. The linear viscoelastic properties of samples with different Glu content are much contrasted (Banc et al., 2019) . As expected, samples are more elastic when the Glu content increases. However, the assembly as a whole, including proteins linked through non-covalent interactions, should be considered, as suggested by Rao et al. (Rao and Nigam, 1987). A strong positive correlation is generally established between the breadmaking quality and the glutenin content, but it is equally correlated to the -gliadin content (Malalgoda et al., 2018; Ohm et al., 2010). It suggests that assemblies including glutenin polymers and non-covalently bonded -gliadins would be the reinforcing arm of gluten rather than glutenin polymers alone.
4.3 Final summary
To summarize, controlled gluten protein compositions, with contrasted glutenin content (from 4 to 57 %), have been investigated in a mild chaotropic solvent: ethanol/water (50/50 v/v). In this solvent, proteins are dissolved either as monomers or polymers or as loose branched supramolecular assemblies composed mainly of glutenin and gliadin. We show that these association states, involving covalent but also non-covalent intermolecular bonds, control the evolution of the UCST phase diagram, and probably contribute to the extraordinary viscoelastic behavior of gluten.
Acknowledgments
We acknowledge the Doctoral School GAIA and the Labex Numev (ANR-10-LAB-20) for the funding of the PhD Grant of J. Pincemaille. We also thank financial support by the scientific council of Montpellier SupAgro and the Agence Nationale pour la Recherche for the funding of the project entitled Elastobio (ANR-18-CE06-0012-01).
References
Arfvidsson, C., Wahlund, K.G., Eliasson, A.C., 2004. Direct molecular weight determination in the evaluation of dissolution methods for unreduced glutenin. Journal of Cereal Science 39, 1-8.
21
Aussenac, T., Carceller, J.L., Kleiber, D., 2001. Changes in SDS solubility of glutenin polymers during dough mixing and resting. Cereal Chemistry 78, 39-45.
Banc, A., Charbonneau, C., Dahesh, M., Appavou, M.-S., Fu, Z., Morel, M.-H., Ramos, L., 2016. Small angle neutron scattering contrast variation reveals heterogeneities of interactions in protein gels. Soft Matter 12, 5340-5352.
Banc, A., Dahesh, M., Wolf, M., Morel, M.H., Ramos, L., 2017. Model gluten gels. Journal of Cereal Science 75, 175-178.
Banc, A., Pincemaille, J., Costanzo, S., Chauveau, E., Appavou, M.S., Morel, M.H., Menut, P., Ramos, L., 2019. Phase separation dynamics of gluten protein mixtures. Soft Matter 15, 6160-6170.
Bechtel, D.B., Gaines, R.L., Pomeranz, Y., 1982. Early Stages in Wheat Endosperm Formation and Protein Body Initiation. Annals of Botany 50, 507-518.
Bietz, J.A., Wall, J.S., 1980. Identity of High Molecular-Weight Gliadin and Ethanol-Soluble Glutenin Subunits of Wheat - Relation to Gluten Structure. Cereal Chemistry 57, 415-421.
Boire, A., Menut, P., Morel, M.H., Sanchez, C., 2013. Phase behaviour of a wheat protein isolate. Soft Matter 9, 11417-11426.
Boire, A., Sanchez, C., Morel, M.H., Lettinga, M.P., Menut, P., 2018. Dynamics of liquid-liquid phase separation of wheat gliadins. Scientific Reports 8.
Carceller, J.L., Aussenac, T., 2001. Size characterisation of glutenin polymers by HPSEC-MALLS. Journal of Cereal Science 33, 131-142.
Cornec, M., Popineau, Y., Lefebvre, J., 1994. Characterization of Gluten Subfractions by Se-Hplc and Dynamic Rheological Analysis in Shear. Journal of Cereal Science 19, 131-139.
Dahesh, M., Banc, A., Duri, A., Morel, M.H., Ramos, L., 2014. Polymeric Assembly of Gluten Proteins in an Aqueous Ethanol Solvent. Journal of Physical Chemistry B 118, 11065-11076.
Dahesh, M., Banc, A., Duri, A., Morel, M.H., Ramos, L., 2016. Spontaneous gelation of wheat gluten proteins in a food grade solvent. Food Hydrocolloids 52, 1-10.
Daoud, M., Jannink, G., 1976. Temperature-Concentration Diagram of Polymer-Solutions. Journal De Physique 37, 973-979.
Dill, D.B., 1927. The behavior of prolamins in mixed solvents. II. J. Biol. Chem. 72, 239-247.
Dill, D.B., Alsberg, C.L., 1925. Preparation, solubility, and specific rotation of wheat gliadin. Journal of Biological Chemistry 65, 279-304.
Dreezen, G., Groeninckx, G., Swier, S., Van Mele, B., 2001. Phase separation in miscible polymer blends as detected by modulated temperature differential scanning calorimetry. Polymer 42, 1449-1459. Flory, P.J., 1953. Principles in Polymer Chemistry. Cornell University Press, Ithaca
Fu, B.X., Sapirstein, H.D., Bushuk, W., 1996. Salt-induced disaggregation/solubilization of gliadin and glutenin proteins in water. Journal of Cereal Science 24, 241-246.
Glantz, M., Hakansson, A., Mansson, H.L., Paulsson, M., Nilsson, L., 2010. Revealing the Size, Conformation, and Shape of Casein Micelles and Aggregates with Asymmetrical Flow Field-Flow Fractionation and Multiangle Light Scattering. Langmuir 26, 12585-12591.
Gonzalez, B., Calvar, N., Gomez, E., Dominguez, A., 2007. Density, dynamic viscosity, and derived properties of binary mixtures of methanol or ethanol with water, ethyl acetate, and methyl acetate at T=(293.15, 298.15, and 303.15) K. Journal of Chemical Thermodynamics 39, 1578-1588.
Janssen, A.M., van Vliet, T., Vereijken, J.M., 1996. Rheological Behaviour of Wheat Glutens at Small and Large Deformations. Effect of Gluten Composition. Journal of Cereal Science 23, 33-42.
Khattab, I.S., Bandarkar, F., Fakhree, M.A.A., Jouyban, A., 2012. Density, viscosity, and surface tension of water plus ethanol mixtures from 293 to 323 K. Korean Journal of Chemical Engineering 29, 812-817. Lemelin, E., Aussenac, T., Violleau, F., Salvo, L., Lein, V., 2005. Impact of cultivar and environment on size characteristics of wheat proteins using asymmetrical flow field-flow fractionation and multi-angle laser light scattering. Cereal Chemistry 82, 28-33.
22
Lemelin, E., Branlard, G., Salvo, L., Lein, V., Aussenac, T., Dayde, J., 2005. Breadmaking stability of wheat flours: Relation between mixing properties and molecular weight distribution of polymeric glutenins. Journal of Cereal Science 42, 317-326.
Malalgoda, M., Ohm, J.B., Meinhardt, S., Simsek, S., 2018. Association between gluten protein composition and breadmaking quality characteristics in historical and modern spring wheat. Cereal Chemistry 95, 226-238.
Marchut, A.J., Hall, C.K., 2007. Effects of chain length on the aggregation of model polyglutamine peptides: Molecular dynamics simulations. Proteins-Structure Function and Bioinformatics 66, 96-109. Mendichi, R., Fisichella, S., Savarino, A., 2008. Molecular weight, size distribution and conformation of Glutenin from different wheat cultivars by SEC-MALLS. Journal of Cereal Science 48, 486-493.
Morel, M.H., Dehlon, P., Autran, J.C., Leygue, J.P., Bar-L'Helgouac'h, C., 2000. Effects of temperature, sonication time, and power settings on size distribution and extractability of total wheat flour proteins as determined by size-exclusion high-performance liquid chromatography. Cereal Chemistry 77, 685-691. Myers, M.N., Giddings, J.C., 1982. Properties of the Transition from Normal to Steric Field-Flow
Fractionation. Analytical Chemistry 54, 2284-2289.
Nilsson, L., 2013. Separation and characterization of food macromolecules using field-flow fractionation: A review. Food Hydrocolloids 30, 1-11.
Ohm, J.B., Hareland, G., Simsek, S., Seabourn, B., Maghirang, E., Dowell, F., 2010. Molecular Weight Distribution of Proteins in Hard Red Spring Wheat: Relationship to Quality Parameters and Intrasample Uniformity. Cereal Chemistry 87, 553-560.
Osborne, T.B., 1924. Vegetable Proteins. Longmans,Green And Co, London UK.
Pence, J.W.O., H. S., 1952. Studies of glutenin. 1 . Comparison of preparative methods. Cereal Chemistry 50, 106.
Pincemaille, J., 2018. Interactions and assemblies of gluten proteins. PhD thesis of the University of Montpellier.
Pincemaille, J., Banc, A., Chauveau, E., Fromental, J.M., Ramos, L., Morel, M.H., Menut, P., 2018. Methods for Screening Cloud Point Temperatures. Food Biophysics 13, 422-431.
Pires, R.M., Costa, H.F., Ferreira, A.G.M., Fonseca, I.M.A., 2007. Viscosity and density of water plus ethyl acetate plus ethanol mixtures at 298.15 and 318.15 k and atmospheric pressure. Journal of Chemical and Engineering Data 52, 1240-1245.
Pitkanen, L., Sontag-Strohm, T., Kanerva, P., 2014. Enhanced separation and characterization of gluten polymers by asymmetrical flow field-flow fractionation coupled with multiple detectors. Journal of Cereal Science 59, 126-131.
Rao, U.J.S.P., Nigam, S.N., 1987. Gel-Filtration Chromatography of Glutenin in Dissociating Solvents - Effect of Removing Noncovalently Bonded Protein-Components on the Viscoelastic Character of Glutenin. Cereal Chemistry 64, 168-172.
Rolland-Sabate, A., Guilois, S., Jaillais, B., Colonna, P., 2011. Molecular size and mass distributions of native starches using complementary separation methods: Asymmetrical Flow Field Flow Fractionation (A4F) and Hydrodynamic and Size Exclusion Chromatography (HDC-SEC). Analytical and Bioanalytical Chemistry 399, 1493-1505.
Rolland-Sabate, A., Mendez-Montealvo, M.G., Colonna, P., Planchot, V., 2008. Online determination of structural properties and observation of deviations from power law behavior. Biomacromolecules 9, 1719-1730.
Schmid, M., 2016. Isolation and Characterization of High-Molecular-Weight (HMW) Gliadins from Wheat Flour. Cereal Chemistry v. 93, pp. 536-542pp. 537-2016 v.2093 no.2016.
Schmid, M., Wieser, H., Koehler, P., 2017. Disulphide structure of high-molecular-weight (HMW-) gliadins as affected by terminators. Journal of Cereal Science 78, 66-74.
23
Schmidt, M., Nerger, D., Burchard, W., 1979. Quasi-Elastic Light-Scattering from Branched Polymers .1. Polyvinylacetate and Polyvinylacetate-Microgels Prepared by Emulsion Polymerization. Polymer 20, 582-588.
Seuring, J., Agarwal, S., 2012. Polymers with Upper Critical Solution Temperature in Aqueous Solution. Macromolecular Rapid Communications 33, 1898-1920.
Shewry, P.R., Miflin, B.J., Lew, E.J.L., Kasarda, D.D., 1983. The Preparation and Characterization of an Aggregated Gliadin Fraction from Wheat. Journal of Experimental Botany 34, 1403-1410.
Shewry, P.R.L., G. L., 2003. Wheat Gluten Protein Analysis. American Association of Cereal Chemists. Singh, N.K., Donovan, R., Macritchie, F., 1990. Use of Sonication and Size-Exclusion High-Performance Liquid-Chromatography in the Study of Wheat-Flour Proteins .2. Relative Quantity of Glutenin as a Measure of Breadmaking Quality. Cereal Chemistry 67, 161-170.
Song, Y., Zheng, Q., 2008. Influence of gliadin removal on strain hardening of hydrated wheat gluten during equibiaxial extensional deformation. Journal of Cereal Science 48, 58-67.
Stevenson, S.G., Preston, K.R., 1996. Flow field-flow fractionation of wheat proteins. Journal of Cereal Science 23, 121-131.
Stevenson, S.G., Ueno, T., Preston, K.R., 1999. Automated frit inlet frit outlet flow field-flow fractionation for protein characterization with emphasis on polymeric wheat proteins. Analytical Chemistry 71, 8-14. Ueno, T., Stevenson, S.G., Preston, K.R., Nightingale, M.J., Marchylo, B.M., 2002. Simplified dilute acetic acid based extraction procedure for Fractionation and analysis of wheat flour protein by size exclusion HPLC and flow field-flow Fractionation. Cereal Chemistry 79, 155-161.
Wahlund, K.G., 2013. Flow field-flow fractionation: Critical overview. Journal of Chromatography A 1287, 97-112.
Wahlund, K.G., Gustavsson, M., MacRitchie, F., Nylander, T., Wannerberger, L., 1996. Size
characterisation of wheat proteins, particularly glutenin, by asymmetrical flow field flow fractionation. Journal of Cereal Science 23, 113-119.
Wrigley, C.W., 1996. Biopolymers - Giant proteins with flour power. Nature 381, 738-739.
Wrigley, C.W.B., F.; Bushuk, W., 2006. Gluten: A Balance of gliadin and glutenin, in: Wrigley, C.W.B., F.; Bushuk, W. (Ed.), Gliadin and glutenin: the unique balance of wheat quality. AACC, pp. 3-32.
Zhang, Q.L., Hoogenboom, R., 2015. Polymers with upper critical solution temperature behavior in alcohol/water solvent mixtures. Progress in Polymer Science 48, 122-142.