1996 Update on Compliance and Emissions Trading under the U.S. Acid Rain Program
by
97-005 November 1997
A. Denny Ellerman, Paul L. Joskow, and Richard Schmalensee
1996 UPDATE
ON COMPLIANCE AND EMISSIONS TRADING
UNDER THE U.S. ACID RAIN PROGRAM
A. Denny Ellerman, Paul L. Joskow, and Richard Schmalensee
1Center for Energy and Environmental Policy Research
Massachusetts Institute of Technology
1
The authors are indebted to Juan Pablo Montero, now of the Catholic University of Chile, and Estelle Andrin, of MIT's Technology and Policy Program, for valuable assistance in conducting this analysis.
I. INTRODUCTION
This paper reports on the second year of compliance with the sulfur dioxide
(SO2) emissions-reduction and -trading provisions of Title IV of the 1990 Clean Air Act
Amendments (CAAA). The material is intended as a supplement to Ellerman, et al.
(1997), which evaluated theemissions-trading program in 1995, and to which the
reader is referred for background and definitions of terms. In the main, compliance with Title IV in 1996 was very similar to that which occurred in 1995. Sulfur dioxide
emissions from affected units were about 4.0 million tons lower than they would have been in the absence of the emissions restrictions specified in Title IV. As in 1995, about half of the emissions reduction could be attributed to the use of scrubbers and the other half to switching. Finally, at 5.43 million tons, 1996 emissions from these units were significantly below the 1996 "cap" of 8.12 million tons, not to mention the 3.25 million allowances banked from 1995 that could have been used in 1996. However, the more interesting aspect of compliance with Title IV in 1996 lies not so much in the aggregate results as in the small changes on the margin that indicate how affected parties were using the flexibility afforded by emissions trading. In this regard, the most significant change was a 6% increase in emissions from affected units. With the decreasing number of allowances issued annually as Phase II approaches and a fixed Phase II "cap," one would have expected emissions to be lower in 1996 than in 1995, not higher. The unexpected increase in average emission rates is, however, the mirror image of the equally unexpected fall in the price of allowances between 1994 and 1995. With lower allowance prices, it is cheaper in at least some locations to spend more on allowances in order to take advantage of lower-priced, higher-sulfur coal.
II. AGGREGATE COMPLIANCE DATA FOR 1995 AND 1996
A. All Affected Units
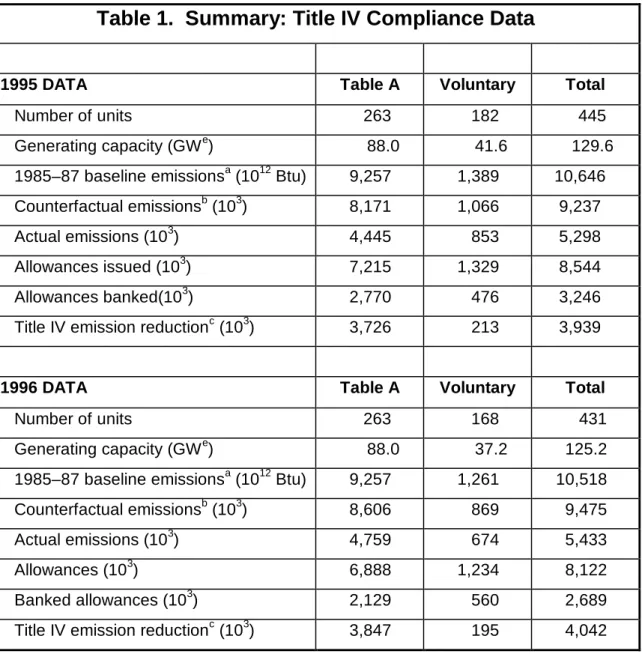
The summary compliance statistics for the first two years of Title IV are presented in Table 1 for both mandatorily (Table A) and voluntarily (substitution, compensation, and opt-in industrial) affected units subject to emissions limits in Phase
Table 1. Summary: Title IV Compliance Data
1995 DATA Table A Voluntary Total
Number of units 263 182 445
Generating capacity (GWe) 88.0 41.6 129.6
1985–87 baseline emissionsa (1012 Btu) 9,257 1,389 10,646
Counterfactual emissionsb (103) 8,171 1,066 9,237
Actual emissions (103) 4,445 853 5,298
Allowances issued (103) 7,215 1,329 8,544
Allowances banked(103) 2,770 476 3,246
Title IV emission reductionc (103) 3,726 213 3,939
1996 DATA Table A Voluntary Total
Number of units 263 168 431
Generating capacity (GWe) 88.0 37.2 125.2
1985–87 baseline emissionsa (1012 Btu) 9,257 1,261 10,518
Counterfactual emissionsb (103) 8,606 869 9,475
Actual emissions (103) 4,759 674 5,433
Allowances (103) 6,888 1,234 8,122
Banked allowances (103) 2,129 560 2,689
Title IV emission reductionc (103) 3,847 195 4,042
Notes: a. Sum of baseline heat input (average 1985–87) times 1985 emission rate for all affected units.
b. Sum of 1993 emission rate times heat input during the year for all affected units. c. Counterfactual emissions less actual emissions.
• Fewer units and generating capacity were affected.
• Fewer allowances were issued.
• Emissions from affected units increased by 135,000 tons.
• The number of allowances banked decreased by 557,000.
• The emissions reduction attributable to Title IV remained at about 4.0 million tons
annually.
Electric utility operators can decide from year to year whether non-Table A units
will become or remain affected units under Phase I.2 In 1996, the number of units and
generating capacity affected by Title IV decreased—the number of voluntarily affected units by 14, due to the departure of 26 substitution units and six compensation units and the accession of 11 substitution units and seven industrial opt-in units.
Sulfur dioxide emissions increased by 135,000 tons in 1996 because of two compensating factors. Table A units increased emissions by 314,000 tons due to greater heat input and a slightly higher average emission rate; however, emissions from the smaller number of voluntarily affected units were 179,000 tons less than in 1995.
The principal reason for the issuance of fewer allowances in 1996 was the discontinuation of approximately 314,000 early reduction credits issued to five Table A units for 1995 only. The smaller number of voluntarily affected units also accounted for a net reduction of 117,000 allowances. In addition, there were minor adjustments in the number of Phase I extension and substitution/compensation allowances issued to units affected in both years.
As in 1995, 1996 emissions were well below the total number of allowances issued for the year, but the amount banked by individual units in 1996 was 557,000, or almost 20% less than in 1995. At the end of 1996, the total bank of allowances from 1995 and 1996, including the 150,000 allowances sold at auction for each vintage, amounted to approximately 6.24 million allowances.
2
Title IV of the 1990 CAAA lists in Table A the 263 units that are mandated to become subject to Title IV restrictions in Phase I, beginning in 1995. The legislation also provides that 1) other utility units not subject to Title IV until Phase II can, beginning in the year 2000, elect to become affected units in Phase I as substitution or compensation units, and 2) industrial process units not otherwise affected may similarly opt-in during Phase I or II.
Despite the increase in emissions, we estimate that emissions reductions attributable to Title IV remained about the same in 1996 as in 1995—at about 4 million tons—because counterfactual emissions (what we estimate emissions would have been without Title IV) increased by 238,000 tons due to greater generation of electricity at Table A units. This increase is approximately 100,000 tons more than the actual increase in emissions at affected units; hence, the slight increase in the estimated reduction attributable to Title IV, from 3.94 million tons to 4.04 million tons. It must be emphasized, however, that the figure for counterfactual emissions is only an estimate based upon assumptions about the demand for electricity and unit emission rates in the absence of Title IV. As in 1995, Table A units accounted for almost all Title IV
emissions reductions.
B. Units Entering and Exiting the Title IV Program
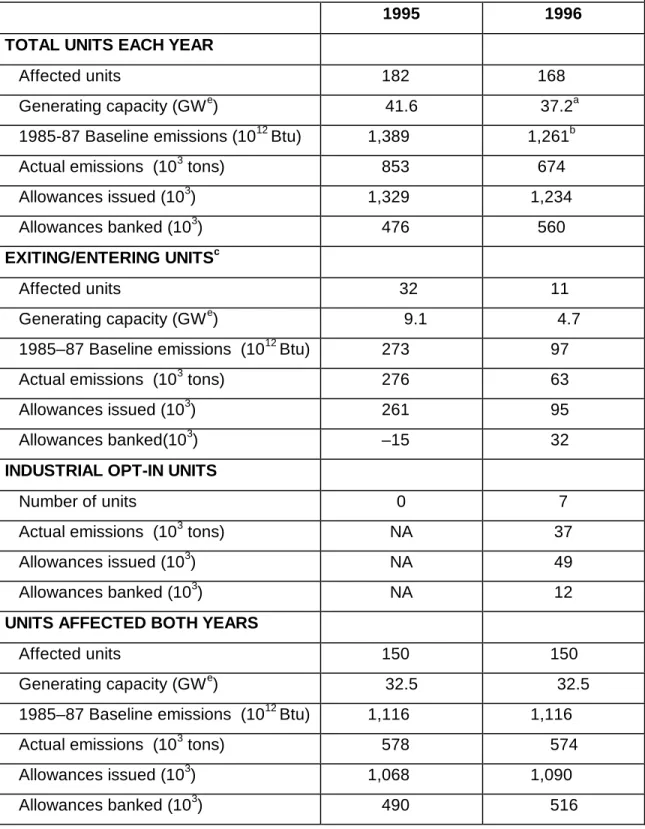
The changing composition of units between 1995 and 1996 complicates the analysis of compliance behavior unless the analysis is restricted to the units that were subject to Phase I restrictions in both years. Table 2 provides more detail about the voluntarily affected units in 1995 and 1996 by category and isolates the 150 voluntarily affected units that were subject to Title IV in both years.
Taken as a whole, the 32 substitution/compensation units exiting the program in 1996 had 1995 emissions 15,000 tons higher in the aggregate than the number of allowances issued to them, while the 18 new voluntarily affected units banked a total of 32,000 allowances in 1996. At the unit level, 16 of the 32 exiting units were short of allowances in 1995, and they had to acquire additional allowances by transfer from other units or by purchase. In contrast, only two of the 18 newly volunteering units were short of allowances in 1996.
Since voluntarily affected units can exit or enter voluntarily by declaration made one month before the close of the calendar year, it would be unusual for a unit that had such an option to be caught short, and in fact most are not. Still, unexpected changes in the dispatch of units in the last month of the year can lead to the observed result. In addition, as noted by Montero (1997) in an earlier study of voluntary compliance in
1995, the reasons for volunteering are several and complex. In this regard, it is worth noting that not all of the units that were short of allowances in 1995 exited the program in 1996, although the majority of them did. Eleven units that were short of allowances in 1995 stayed, and 9 of these units were also short of allowances in 1996. In addition, another 8 voluntarily affected units that had banked allowances in 1995 increased emissions in 1996 such that they were short of allowances in 1996. Nevertheless, the total number of such units decreased from 27 in 1995 to 18 in 1996.
In addition to the electric utility generating units that can qualify as substitution or compensation units, there were seven units at two industrial plants, in Tennessee and in Indiana, that opted into the program in 1996. (There were no such units in 1995.) As discussed in more detail by Atkeson (1997), the plant in Tennessee was shut down when an arrangement was made to obtain substitute steam from four generating units operated by the Tennessee Valley Authority. The three units at the plant in Indiana provide electricity for an aluminum smelter and are co-located with a fourth unit that provides electricity to the grid and is a Table A unit.
Table 2. Voluntarily Affected Units, 1995 & 1996
1995 1996
TOTAL UNITS EACH YEAR
Affected units 182 168
Generating capacity (GWe) 41.6 37.2a
1985-87 Baseline emissions (1012 Btu) 1,389 1,261b
Actual emissions (103 tons) 853 674
Allowances issued (103) 1,329 1,234
Allowances banked (103) 476 560
EXITING/ENTERING UNITSc
Affected units 32 11
Generating capacity (GWe) 9.1 4.7
1985–87 Baseline emissions (1012 Btu) 273 97
Actual emissions (103 tons) 276 63
Allowances issued (103) 261 95
Allowances banked(103) –15 32
INDUSTRIAL OPT-IN UNITS
Number of units 0 7
Actual emissions (103 tons) NA 37
Allowances issued (103) NA 49
Allowances banked (103) NA 12
UNITS AFFECTED BOTH YEARS
Affected units 150 150
Generating capacity (GWe) 32.5 32.5
1985–87 Baseline emissions (1012 Btu) 1,116 1,116
Actual emissions (103 tons) 578 574
Allowances issued (103) 1,068 1,090
Allowances banked (103) 490 516
Notes: aDoes not include industrial opt-in units.
b
Baseline emissions for industrial opt-in units assumed equal to allowances.
c
C. Units Affected in Both 1995 and 1996
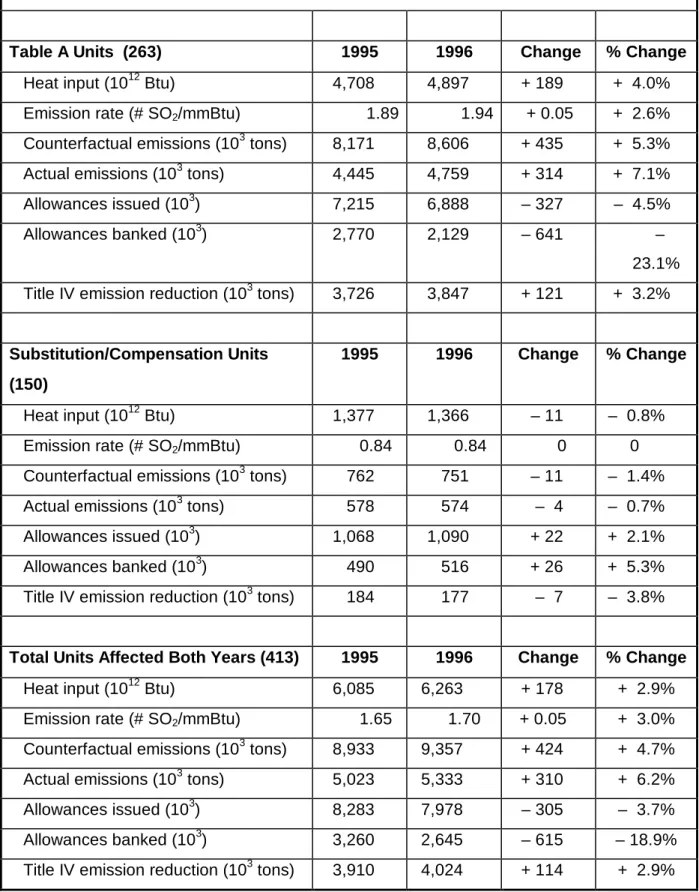
The 150 continuing substitution and compensation units added to the 263 units listed in Table A yield 413 units "commonly affected" in both 1995 and 1996. These units account for the great bulk of allowances, emissions, banking and the reduction attributable to Title IV in both years. Accordingly, unless explicitly noted to the contrary, subsequent analysis is based on these units. The summary statistics for these 413 commonly affected units are presented in Table 3. In the main, the same conclusions hold for this smaller set as for the comparison made in Table 1: fewer allowances, more emissions, less banking, and a roughly constant reduction of emissions attributable to Title IV in 1996 compared to 1995. Table 3 clearly shows that most changes observed between 1995 and 1996 are due to the Table A units, which account for approximately 70% of the affected capacity and 85% of allowances and emissions. Both heat input and the average emission rate increased at Table A units in 1996, while the 150 continuing substitution and compensation units experienced little change in either.
The total number of Table A units retrofitted with scrubbers was brought to 27 by the addition of 6 more units that became operational in 1996. These units were Conemaugh 2, located in Pennsylvania, Petersburg 1 & 2 in Indiana, HMP&L Station Units 1 & 2 in Kentucky, and Niles 1 in Ohio. Emissions from these six units were 127,000 tons less than in 1995 and offset slightly over a third of the increase in emissions from the other Table A units. As was the case with the 21 units retrofitted with scrubbers in 1995, the utilization of these newly retrofitted units increased markedly, by more than 20% over the average for the preceding six years. The
reasons for this marked shift ofgeneration to newly retrofitted units is not entirely clear,
but it has negated what might have been expected to be a tendency to shift generation away from the newly-constrained Phase I affected units to units that were not yet subject to Title IV limitations.
Table 3. Data on Units Affected in Both 1995 and 1996
Table A Units (263) 1995 1996 Change % Change
Heat input (1012 Btu) 4,708 4,897 + 189 + 4.0%
Emission rate (# SO2/mmBtu) 1.89 1.94 + 0.05 + 2.6%
Counterfactual emissions (103 tons) 8,171 8,606 + 435 + 5.3%
Actual emissions (103 tons) 4,445 4,759 + 314 + 7.1%
Allowances issued (103) 7,215 6,888 – 327 – 4.5%
Allowances banked (103) 2,770 2,129 – 641 –
23.1%
Title IV emission reduction (103 tons) 3,726 3,847 + 121 + 3.2%
Substitution/Compensation Units (150)
1995 1996 Change % Change
Heat input (1012 Btu) 1,377 1,366 – 11 – 0.8%
Emission rate (# SO2/mmBtu) 0.84 0.84 0 0
Counterfactual emissions (103 tons) 762 751 – 11 – 1.4%
Actual emissions (103 tons) 578 574 – 4 – 0.7%
Allowances issued (103) 1,068 1,090 + 22 + 2.1%
Allowances banked (103) 490 516 + 26 + 5.3%
Title IV emission reduction (103 tons) 184 177 – 7 – 3.8%
Total Units Affected Both Years (413) 1995 1996 Change % Change
Heat input (1012 Btu) 6,085 6,263 + 178 + 2.9%
Emission rate (# SO2/mmBtu) 1.65 1.70 + 0.05 + 3.0%
Counterfactual emissions (103 tons) 8,933 9,357 + 424 + 4.7%
Actual emissions (103 tons) 5,023 5,333 + 310 + 6.2%
Allowances issued (103) 8,283 7,978 – 305 – 3.7%
Allowances banked (103) 3,260 2,645 – 615 – 18.9%
III. ANALYSIS OF CHANGES OBSERVED IN 1996
A. Changes in Emissions by Generating Units
Emissions are the product of the heat input of fuel used at each generating unit
and the SO2 emission rate associated with the fuel, as modified by whatever
sulfur-removal equipment may exist at the unit. Accordingly, changes in emissions from one year to another can be analyzed in terms of changes in heat input and in the emission rate. Since heat input for each unit is largely determined by the unit's position in dispatch and the overall demand for electricity, the variable over which an operator has most control for purposes of compliance with Title IV is emission rate. We therefore focus most of our unit-level analysis on changes in emission rates between 1995 and 1996.
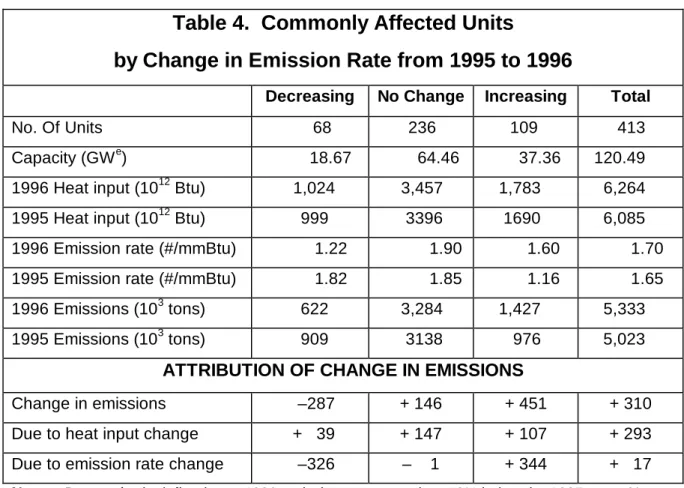
The operators of most commonly affected units kept the 1996 emission rate very close to the 1995 rate; however, of those that did not, about twice as many increased the emission rate as reduced it. The top panel of Table 4 provides detail on the number of units, capacity, 1996 heat input, emissions, and allowances for the 413 commonly affected units, categorized according to whether their 1996 emission rate (1) increased more than 10%, (2) remained within +/–10%, or (3) decreased by more than 10% of the 1995 rate. Table 4 also shows, in the second panel, the decomposition of the change in emissions as a result of changes in heat input and emission rate. The 109 units whose emission rates increased significantly are almost entirely offset by the 68 units that decreased emissions significantly. As a result, the 310,000-ton aggregate increase in emissions in 1996 over 1995 can be almost entirely attributed to increased heat input, which is approximately evenly spread across units in the three categories.
Although the units’ increasing and reducing emission rates almost completely offset each other, the question remains why nearly a quarter of the affected units would be increasing emission rates significantly. Furthermore, most of the offsetting reduction results from the implementation of decisions made prior to 1995-96. For instance, the six units that retrofitted scrubbers in 1996 account for 148,000 tons, or slightly less than half, of the 326,000 tons attributable to emission rate reductions at the 68 units.
Table 4. Commonly Affected Units
by Change in Emission Rate from 1995 to 1996
Decreasing No Change Increasing Total
No. Of Units 68 236 109 413
Capacity (GWe) 18.67 64.46 37.36 120.49
1996 Heat input (1012 Btu) 1,024 3,457 1,783 6,264
1995 Heat input (1012 Btu) 999 3396 1690 6,085
1996 Emission rate (#/mmBtu) 1.22 1.90 1.60 1.70
1995 Emission rate (#/mmBtu) 1.82 1.85 1.16 1.65
1996 Emissions (103 tons) 622 3,284 1,427 5,333
1995 Emissions (103 tons) 909 3138 976 5,023
ATTRIBUTION OF CHANGE IN EMISSIONS
Change in emissions –287 + 146 + 451 + 310
Due to heat input change + 39 + 147 + 107 + 293
Due to emission rate change –326 – 1 + 344 + 17
Notes: Decreasing is defined as a 1996 emission rate more than 10% below the 1995 rate. No change is an emission rate within +/–10% of the 1995 emission rate. Increasing is a 1996 emission rate greater than 10% above the 1995 emission rate.
Contracts for the construction of these scrubbers were almost certainly signed before 1995. Another 12 of these units, located in the area being heavily penetrated by PRB
and western coals, account for an additional 78,000 tons, or another 20% of this total.3
These switches would likely have occurred anyway, and their timing in 1996 may reflect expiration of pre-Phase I contracts that required the use of higher sulfur coals in 1995. When allowance is made for these units, only 50 units reduced emission rates for an aggregate reduction in emissions of about 100,000 tons. In contrast, 109 affected units increased emission rates by more than 10% and emissions by 344,000 tons. These actions increased the allowance costs incurred by the operator.
We turn now to the question of why some operators might increase allowance cost and use up allowances in 1996, rather than save them for Phase II when more stringent emission limits will be imposed.
3
B. The Price of Allowances
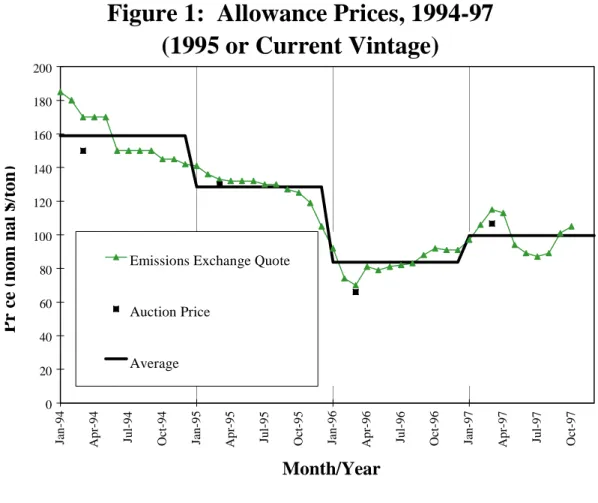
The most salient feature about the evolution of allowance prices to date is their steady decline from early 1994 to early 1996. In calendar year 1994, the average price of an allowance was $159 and by 1995, the annual average price fell to an average of $129. As Figure 1 shows, allowance prices fell precipitously in the latter half of 1995;
by March 1996, the all-time low of $70 was recorded.4 Thereafter, prices rose steadily
throughout 1996, but the average annual price for the year was $84, well below the 1995 (not to mention the pre-Phase I) price.
4
This is the Emissions Exchange quote for March 1996. The EPA auction that same month cleared at a price of $66.05.
Figure 1: Allowance Prices, 1994-97
(1995 or Current Vintage)
0 20 40 60 80 100 120 140 160 180 200Jan-94 Apr-94 Jul-94 Oct-94 Jan-95 Apr-95 Jul-95 Oct-95 Jan-96 Apr-96 Jul-96 Oct-96 Jan-97 Apr-97 Jul-97 Oct-97
Month/Year
Emissions Exchange QuoteAuction Price Average
P
r
ce
(nom
na
l
$/t
on
)
The price of an allowance indicates to all operators the value of an additional ton of emission reduction. Operators of affected units who are attentive to the market price of allowances will compare this value to the incremental cost of burning a lower-sulfur coal. When the difference between the prices of lower- and higher-lower-sulfur coals is greater than what is justified by the current price of allowances, such operators will save money by purchasing the higher-sulfur coal and using more allowances.
Unfortunately, there is no good indicator of coal-sulfur premiums applicable in all locations and to which movements in allowance prices can be compared. This is
because the coals competing at most powerplants typically come from different
locations, so the difference in price between coals of varying sulfur content is as much an issue of transportation and mine cost as it is the sulfur premium that might be defined in some single mining district, such as Central Appalachia. Nevertheless, it is likely that the higher allowance prices in 1994 and 1995, not to mention expectations that allowance prices would rise with the start of Phase I, caused operators to contract for lower-sulfur coals in 1994 and 1995. Depending on the length of the contract, those purchases would be delivered over periods ranging from three months to several years, and at least some of those contracts would be expiring in 1996. With lower allowance prices and the same coal-sulfur premium, some operators would be able to reduce generating cost by shifting back to higher-sulfur coals. More would be spent, or foregone, on allowances, but the extra expense would be more than compensated by the reduced fuel cost.
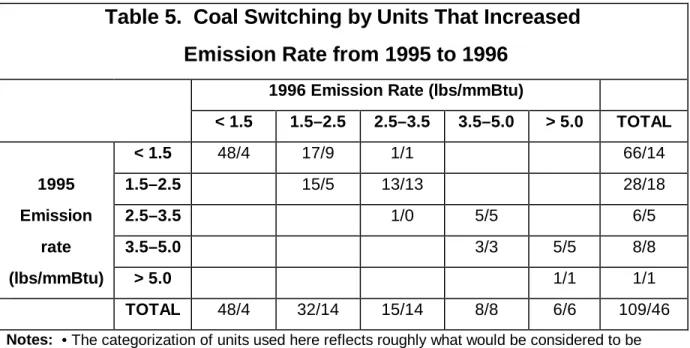
The higher-sulfur coals purchased by operators of the 109 units increasing emission rates in 1996 were not necessarily what would be considered “high-sulfur” coals, as shown by Table 5. Whether judged by percentage or absolute change, most units whose emission rates increased in 1996 switched from low- to mid-sulfur coal, or increased rates within the mid-sulfur ranges. Only about 15 of the units switched either from mid-sulfur to high-sulfur ranges or to even higher-sulfur coals within the high-sulfur ranges. This shift to slightly higher sulfur content among the low- and mid-sulfur coals indicates that higher sulfur content is penalized across the entire sulfur range of coal, not just for some high-sulfur coals, and that at least some operators of affected units are arbitraging between allowance and coal markets.
Table 5. Coal Switching by Units That Increased
Emission Rate from 1995 to 1996
1996 Emission Rate (lbs/mmBtu)
< 1.5 1.5–2.5 2.5–3.5 3.5–5.0 > 5.0 TOTAL < 1.5 48/4 17/9 1/1 66/14 1995 1.5–2.5 15/5 13/13 28/18 Emission 2.5–3.5 1/0 5/5 6/5 rate 3.5–5.0 3/3 5/5 8/8 (lbs/mmBtu) > 5.0 1/1 1/1 TOTAL 48/4 32/14 15/14 8/8 6/6 109/46
Notes: • The categorization of units used here reflects roughly what would be considered to be low-, low-to-mid, mid-to-high, high-, and very-high-sulfur coal.
• The number preceding the slash mark in each cell entry indicates the number of units that increased the emission rate by more than 10%, corresponding to the categories used in Table 4. Since many of these units are in the low-sulfur categories and a 10% increase could be small, the number that increased the emission rate by more than 0.40#/mmBtu is indicated after the slash mark.
C. Emissions Trading at the Unit and Utility Level
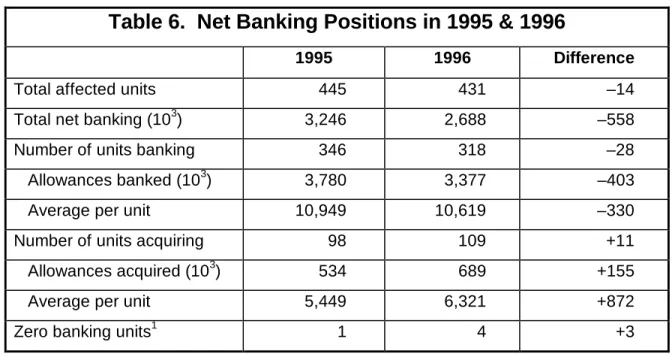
As in 1995, utilities made significant use of emissions trading to avoid high-cost abatement at some units currently and in the future through banking. Table 6 presents the data on all affected units that were bankers and acquirers of allowances in 1995
and 1996.5 The number of units banking declined, as did the total allowances banked
and the average number of allowances banked per unit, while the number of units acquiring allowances from other units to cover emissions in excess of unit allowance allocations increased, as did the total number of such allowances and the average number of allowances purchased per unit. The reduction in banking and increased use of allowances to cover "excess" emissions is particularly noticeable among the 413 commonly affected units. As shown in Table 7, 25 of these units shifted from being bankers in 1995 to acquirers of allowances in 1996. At the utility level, as shown by Table 8, a similar small change was observed in the number of independent utilities and holding companies with affected units that were net bankers and acquirers of allowances.
5
We adopt the term acquirers to denote those who acquire allowances from other units or the accumulated bank to cover emissions in excess of the allowances allocated to their unit in 1996.
Table 6. Net Banking Positions in 1995 & 1996
1995 1996 Difference
Total affected units 445 431 –14
Total net banking (103) 3,246 2,688 –558
Number of units banking 346 318 –28
Allowances banked (103) 3,780 3,377 –403
Average per unit 10,949 10,619 –330
Number of units acquiring 98 109 +11
Allowances acquired (103) 534 689 +155
Average per unit 5,449 6,321 +872
Zero banking units1 1 4 +3
Note: 1These units (substitution units, Wood River 1 in both years, and Poston 1, 2, and 3 in
1996) neither received allowances nor had any emissions in the respective years.
Table 7. Change of Banking Status by Units, 1995 to 1996
Bankers Acquirers Zero Total
1995 Status 346 98 1 445
Commonly affected units –28 +25 +3 0
Units exiting in 1996 –16 –16 0 –32
Units entering in 1996 +16 +2 0 +18
1996 Status 318 109 4 431
Table 8. Banking Status by Utility
1995 1996
Utilities with affected units 57 56
Net acquirers of allowances 6 7
Net bankers of allowances 51 49
Trading among units 21 20
No trading among units 23 21
Table 9 provides more detail on the nine utilities for which emissions from affected units were higher in the aggregate than the number of allowances issued to those units in 1995 and/or 1996. Four of the six utilities having this status in 1995 remained so in 1996, while two became net bankers (one, Indianapolis Power & Light, because of the retrofitting of two units with scrubbers). Three other utilities changed from being net bankers in 1995 to net acquirers in 1996. In contrast to the four utilities that were net acquirers in both 1995 and 1996, which could only have obtained the necessary allowances from other utilities, the three utilities that became net acquirers in 1996 would have been able to draw from the amounts they banked in 1995.
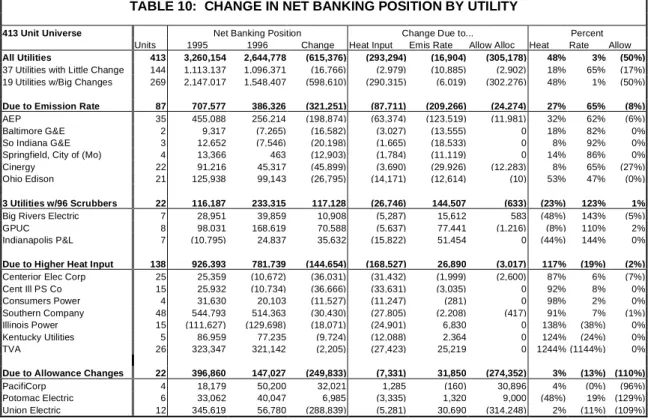
Most of the change in the net banking position of units and utilities occurred in 19 of the 56 utilities that had affected units during both years. Table 10 decomposes the net change in banking position for all 413 units affected in both years, and
attributes the change to changes in emission rates, heat input, and allowance
allocation.6 Of the 56 utilities and 413 units, 37 utilities and 144 units experienced little
change in any of these variables. The remaining 19 utilities and 269 units account for virtually all of the 600,000-allowance decrease in banking in 1996. About half of the total reduction in banking was due to increased emissions; the other half was due to reduced allowance allocations. The 19 utilities are further subdivided into four
categories, according to the factor most responsible for their change in banking status. The only group to experience a net increase in banking included three utilities that retrofitted scrubbers in 1996. Two other utilities increased banking because of increased allowance allocations, but for the remaining 14 utilities, higher heat input, higher emission rates, and fewer allowances led to significantly less banking in 1996 than in 1995.
6
The decomposition into the constituent elements is accomplished by the following discrete approximation:
dNTP=−r dH+H dr− −dA
where dNTP is the observed annual difference in net trading position, dH is the observed annual difference in heat input, dr is the observed annual difference in emission rate, dA is the observed annual difference in allowance allocation, rbar is the simple average of the unit emission rates during the two years, and Hbar is the simple average of the unit heat input during the two years.
Table 9: Utilities Engaging in Inter-Utility Trading in 1995 or 1996 Aggregate Utility Undercompliance Total Allowances % Under/OverComp
All Affected Units 1995 1996 Abs Chg Sum2Yrs 1995 1996 1995 1996
Total Interutility 147,770 168,617 20,847 316,387 459,082 675,589 32% 25% 1995 Utilities Illinois Power 110,925 127,480 16,555 238,405 186,579 194,573 59% 66% Indianapolis P&L 24,022 (24,837) (48,859) (815) 126,881 96,655 19% (26%) Duquesne Lighting 4,720 1,841 (2,879) 6,561 38,139 38,139 12% 5% Tampa Electric 4,647 9,414 4,767 14,061 86,485 86,485 5% 11%
Hoosier Energy REC 2,215 (5,077) (7,292) (2,862)
18,427 18,427 12% (28%) Iowa PubSvc Co 1,241 1,211 (30) 2,452 2,571 2,571 48% 47% TOTAL 1995 147,770 110,032 (37,738) 257,802 459,082 436,850 32% 25% New 1996 Utilities Baltimore G&E (9,317) 7,265 16,582 (2,052) 21,479 21,479 (43%) 34%
Centerior Energy Corp (25,359) 10,672 36,031 (14,687) 213,788 211,188 (12%) 5% Cent Ill PubSvc Co (25,932) 10,734 36,666 (15,198) 121,154 121,154 (21%) 9%
TOTAL 1996 (60,608) 28,671 89,279 (31,937) 356,421 353,821 (17%) 8%
TABLE 10: CHANGE IN NET BANKING POSITION BY UTILITY
413 Unit Universe Net Banking Position Change Due to... Percent
Units 1995 1996 Change Heat Input Emis Rate Allow Alloc Heat Rate Allow
All Utilities 413 3,260,154 2,644,778 (615,376) (293,294) (16,904) (305,178) 48% 3% (50%)
37 Utilities with Little Change 144 1,113,137 1,096,371 (16,766) (2,979) (10,885) (2,902) 18% 65% (17%) 19 Utilities w/Big Changes 269 2,147,017 1,548,407 (598,610) (290,315) (6,019) (302,276) 48% 1% (50%)
Due to Emission Rate 87 707,577 386,326 (321,251) (87,711) (209,266) (24,274) 27% 65% (8%)
AEP 35 455,088 256,214 (198,874) (63,374) (123,519) (11,981) 32% 62% (6%) Baltimore G&E 2 9,317 (7,265) (16,582) (3,027) (13,555) 0 18% 82% 0% So Indiana G&E 3 12,652 (7,546) (20,198) (1,665) (18,533) 0 8% 92% 0% Springfield, City of (Mo) 4 13,366 463 (12,903) (1,784) (11,119) 0 14% 86% 0% Cinergy 22 91,216 45,317 (45,899) (3,690) (29,926) (12,283) 8% 65% (27%) Ohio Edison 21 125,938 99,143 (26,795) (14,171) (12,614) (10) 53% 47% (0%)
3 Utilities w/96 Scrubbers 22 116,187 233,315 117,128 (26,746) 144,507 (633) (23%) 123% 1%
Big Rivers Electric 7 28,951 39,859 10,908 (5,287) 15,612 583 (48%) 143% (5%) GPUC 8 98,031 168,619 70,588 (5,637) 77,441 (1,216) (8%) 110% 2% Indianapolis P&L 7 (10,795) 24,837 35,632 (15,822) 51,454 0 (44%) 144% 0%
Due to Higher Heat Input 138 926,393 781,739 (144,654) (168,527) 26,890 (3,017) 117% (19%) (2%)
Centerior Elec Corp 25 25,359 (10,672) (36,031) (31,432) (1,999) (2,600) 87% 6% (7%) Cent Ill PS Co 15 25,932 (10,734) (36,666) (33,631) (3,035) 0 92% 8% 0% Consumers Power 4 31,630 20,103 (11,527) (11,247) (281) 0 98% 2% 0% Southern Company 48 544,793 514,363 (30,430) (27,805) (2,208) (417) 91% 7% (1%) Illinois Power 15 (111,627) (129,698) (18,071) (24,901) 6,830 0 138% (38%) 0% Kentucky Utilities 5 86,959 77,235 (9,724) (12,088) 2,364 0 124% (24%) 0% TVA 26 323,347 321,142 (2,205) (27,423) 25,219 0 1244% (1144%) 0%
Due to Allowance Changes 22 396,860 147,027 (249,833) (7,331) 31,850 (274,352) 3% (13%) (110%)
PacifiCorp 4 18,179 50,200 32,021 1,285 (160) 30,896 4% (0%) (96%) Potomac Electric 6 33,062 40,047 6,985 (3,335) 1,320 9,000 (48%) 19% (129%) Union Electric 12 345,619 56,780 (288,839) (5,281) 30,690 (314,248) 2% (11%) (109%)
IV. CONCLUDING OBSERVATIONS
There are two ways to view compliance with Title IV in 1996 as compared with 1995. From one point of view, 1996 was very similar to 1995. There were small changes in coverage, emissions, and allowances, but the important aspects remained unchanged: a significant reduction of emissions below what would otherwise be the case, mainly from Table A units, and significant banking of allowances.
From another point of view, 1996 can be seen as unusual in that the average emission rate of affected units might have been expected to decline as Phase II approached. The unexpected increase in average emission rates is, however, the mirror image of the equally unexpected fall in the price of allowances between 1994 and 1995. With lower allowance prices, it is cheaper in at least some locations to spend more on allowances in order to take advantage of lower-priced, higher-sulfur coal.
The more fundamental issue is why allowance prices fell so precipitously in late 1995 and early 1996. As explained more fully in our more comprehensive analysis of compliance in 1995, the cause was a combination of the recognition that current and future costs would be lower than expected and the very low variable cost of abatement by scrubbers, which established the floor. For a variety of reasons, Phase I has been characterized by overinvestment in compliance, and the response is a lower allowance price trajectory, as well as a deferral of the time when higher-cost, Phase II abatement will be required. As such, the increase in emission rates in 1996 is a transitory
phenomenon that reflects an adjustment to the overinvestment in compliance that has characterized Phase I, rather than movement along an equilibrium path.
Since early 1996, allowance prices have been on an upward trend. In part, this reflects the greater demand for allowances that appeared as utilities shifted to higher-sulfur coals, but it is also more like the movement along the longterm trajectory that can be expected to characterize allowance prices as Phase II approaches. In this light, 1996 can be seen as a year of adjustment and of transition to a more realistic view of current and future abatement costs.
REFERENCES
Atkeson, Erica (1997), "Joint Implementation: Lessons from Title IV"s Voluntary Compliance Programs," Working Paper 97-003, MIT Center for Energy and Environmental Policy Research (CEEPR), May.
Ellerman, A. Denny, Richard Schmalensee, Paul L. Joskow, Juan Pablo Montero, and Elizabeth M. Bailey (1997), Emissions Trading under the U.S. Acid Rain Program: Evaluation of Compliance Costs and Allowance Market Performance, Special Report, MIT Center for Energy and Environmental Policy Research (CEEPR), October.
Montero, J.P. (1997), "Volunteering for Market-based Environmental Regulation: The
Substitution Provisions of the SO2 Emissions Trading Program," Working Paper