HAL Id: hal-02829006
https://hal.inrae.fr/hal-02829006
Submitted on 7 Jun 2020
HAL is a multi-disciplinary open access
archive for the deposit and dissemination of sci-entific research documents, whether they are pub-lished or not. The documents may come from teaching and research institutions in France or abroad, or from public or private research centers.
L’archive ouverte pluridisciplinaire HAL, est destinée au dépôt et à la diffusion de documents scientifiques de niveau recherche, publiés ou non, émanant des établissements d’enseignement et de recherche français ou étrangers, des laboratoires publics ou privés.
A simulation approach to evaluate supply policies of a
pig slurry treatment plant by multiple farms
Francois Guerrin, Jean-Michel Médoc
To cite this version:
Francois Guerrin, Jean-Michel Médoc. A simulation approach to evaluate supply policies of a pig slurry treatment plant by multiple farms. 5. Conference of the European Federation for Information Technology in Agriculture, Food and Environment and The 3rd World Congress on Computers in Agriculture and Natural Resources, Jul 2005, Vila Real, Portugal. 8 p. �hal-02829006�
A Simulation Approach to Evaluate Supply
Policies of a Pig Slurry Treatment Plant by
Multiple Farms
François Guerrin a and Jean-Michel Médoc b
a Cirad, UPR 78 Environmental Risks of Recycling, BP 20, 97408 Saint-Denis cedex 09, Reunion Island, France, guerrin@cirad.fr b Cirad, UPR 78, 97408 Saint-Denis cedex 09, Reunion Island, France, medoc@cirad.fr
Abstract
This paper describes the use of a dynamical simulation model to evaluate various management policies in a two-stage production systems. Such a simulation-based evaluation is applied to the situation of Grand-Ilet (Reunion Island) where 51 pig farms must supply a collective treatment plant (CTP) with pig slurry. Based on actual data and stakeholders’ preferences, three policies are tested: a planned policy with fixed delivery period and delivery size and two reactive policies with time-varying order points and replenishment levels: one based on farm stocks, the other based on the CTP stock. The reactive policy focused on farm stocks is judged most adapted to meet the management goals (no stock overflow, robustness) even with random disturbances.
Key words: Model-based decision support, supply chain management, agricultural production systems, pig slurry, Reunion Island.
1 Introduction
Concentration of indoor livestock farming in the highlands of the Reunion Island generates environmental risks due to very cramped spreading areas. In order to help the farmers improve their practices to reduce these risks, our team has developed a multi-modelling approach to manage organic material fluxes both at the farm and territory levels (Guerrin and Paillat, 2003). These models are conceived as a means to experiment by simulation with complex agricultural systems in a participatory approach.
Grand-Ilet, a small locality in the mountainous cirque of Salazie, concentrates 51 indoor pig farms producing annually 20 000 m3 slurry and 20 poultry farms producing 2 700 tons solid manure and 2 700 m3 slurry. In front of this production, 187 ha of agricultural land only are available of which 75 ha are crops and 112 ha are fallow land. Actually, poultry manure is not an issue as it is widely used by market gardeners and as a composting platform is about to be implemented. Hence, we consider pig slurry only which is the most critical: many farm stocks overflow regularly and it is not seldom that pig effluents be disposed of in the wild… The total nitrogen produced as pig slurry amounts up to 100 tons/year. This would yield an application rate of 1 300 kgN/ha/year on cultivated land (or 893 kgN/ha/year considering the total land, thus assuming that fallows become cultivated) whereas regulation rules impose total applications to be less than 350 kgN/ha/year for forage and pastures or 200 kgN/ha/year for other crops. Thus, the surplus may be estimated to over 5 times the ‘legal’ absorption capacity of land potentially available for spreading. After checking that export of raw pig slurry out of the cirque was not feasible (Médoc et al., 2004), it was decided to transform it into less bulky, easy to transport, by-products likely to be used by the crops in the coastal zone. Due to the low investment capacity of farmers and the lack of space, it was decided to install a collective treatment plant (CTP) to treat the total pig slurry produced by the farms. This paper aims at presenting the use of a simulation model to evaluate three tentative supply policies of this plant. Section 2 gives a brief overview of the model and the three policies. Then, Section 3 presents the base scenario encompassing the system’s structure (based on actual data), the management
EFITA/WCCA 2005 Joint Conference,
The 5th Conf. of the European Federation for Information Technology in Agriculture,
Food and Environment and The 3rd World Congress on Computers in Agriculture and
Natural Resources, July 25-28, 2005, Vila Real (Portugal)
options (defined from stakeholders preferences) and possible random disturbances likely to occur in this supply chain. Simulations of each policy are described in Section 4 in both deterministic and random cases. Finally, simulation outputs are compared and discussed in Section 5 and guidelines to help the stakeholders make a choice are provided.
2 System representation
2.1 Conceptual representation
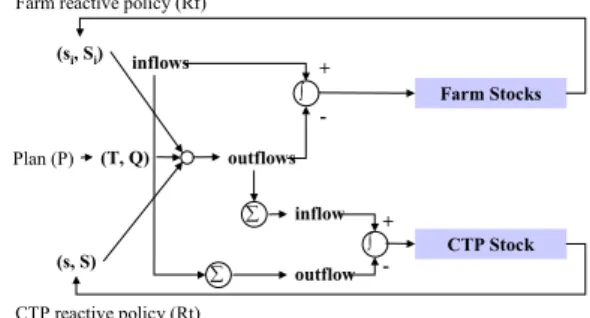
The system is viewed as a set of slurry farm stocks connected, by means of transport, to a single CTP stock (Fig. 1). Farm stocks are filled by the slurry fluxes produced by the livestock and are emptied by the deliveries to the CTP. Whereas farm stock inflows are assumed to be continuous and constant, outflows are inherently discrete and vary according to the supply policy implemented. The CTP pre-storage and mixing tank (denoted ‘CTP stock’) is supplied with the farm deliveries and it is assumed that it feeds the treatment process continuously.
2.2 Simulation model
The simulation model (described in Guerrin, 2004) is an hybrid dynamical system, thus encompassing both continuous and discrete variables. The former represent stock dynamics and the latter action or control variables. Model parameters are used to describe the three main parts of the system’s structure: (1) Farms: herd size, slurry production rate, storage capacity; (2) CTP: storage capacity, treatment plant utilisation flow; (3) Logistics: type, number and capacity of transport means, farm distances to the CTP, transportation times, loading/unloading/cleaning operation times, working schedule, priority rules. In addition to the time-evolutions of stocks, fluxes and delivery actions, the model outputs provide several management indicators: stock overflows, number of deliveries, delivery times, amounts delivered, time of slurry shortage at the CTP. To account for disturbances unavoidable in such logistic systems, randomness may also be introduced in the simulations (see Section 3.3).
2.3 Tentative management policies
As for all inventory systems, management policies must answer two basic questions for each farm: When should a delivery be done? How much should be delivered? These answers must be such that, at least, stock overflow does not occur and too long slurry shortage is avoided at the CTP. Three policies are envisaged (Fig. 2):
1. P: planned (T, Q) policy with fixed delivery period T (time lag between two consecutive deliveries of the same farm) and delivery size Q (amount to be delivered);
2. Rf: reactive (si, Si) policy based on farm stocks with time-varying delivery point si (alert level of stock at which a delivery is triggered as soon as possible) and deliver-down-to level Si (level down to which a stock should be emptied as far as possible);
3. Rt: reactive (s, S) policy based on the CTP stock with time-varying reorder point s (level of stock at which deliveries are ordered) and order-up-to level S (level at which all current deliveries stop).
Farm 1 Farm n Transport CTP Farm k Farm stock 1 Farm stock k Farm stock n ... ... CTP stock Discrete flow Continuous flow Overflow
Fig. 1 Physical flow-stock representation of the production system dealt with in this study.
Farm Stocks CTP Stock outflows inflows outflow inflow (s, S) (si, Si) (T, Q) Plan (P)
Farm reactive policy (Rf)
CTP reactive policy (Rt) + -+ -∫ ∑ ∑ ∫
Fig. 2 Dynamical system layout outlining the three policies tested to supply the single CTP stock with multiple farm stocks.
To ease the comparison of stocks of various capacities, stock evolutions are normalised to 1, i.e. expressed as the ratio of the current level to the maximum storage capacity. Note that, whereas the P policy is feedforward controlled, the Rf and Rt policies involve feedback loops (Fig.2). Whereas P and Rf are ‘Push’ (based on suppliers’ production), Rt is ‘Pull’ (based on customer’s demand). To deal with concurrent deliveries, priority rules, jointly based on stock level, distance and herd size (or possibly other criteria), are used to allocate transport capacities to farm delivery needs (see Section 3.2).
3 Base scenario
3.1 System structure
For the sake of clarity and because they share common constraints, the 51 pig farms are grouped into 7 neighbourhoods based on proximity. Their main structural characteristics are given in Table 1. Some of these data (herd size, slurry production) come from recently made farm diagnoses motivated by this project. Assuming a normalization that should soon occur, farm storage capacities are deduced from herd sizes, based on a retention time of 120 days (legal norm) and an individual sow production of 0.06 m3/day slurry. Data about the CTP result from three technical proposals relative to the treatment process already chosen by the stakeholders (centrifugation followed by nitrification-denitrification; see Médoc et al., 2004). The utilisation rate of the CTP is taken equal to the total farm slurry production rate (20 658 m3/year assuming a constant flux). The mixing/pre-storage tank is set to 1 200 m3 capacity (21-day retention time). Distances and transport times from the farms to the CTP were assessed using a GIS. In addition of effective transport, each one-way trip is extended with a fixed 22.5 minutes period (a simulation time-step) accounting for loading/unloading and cleaning operations as well as idle time. Average round-trips performed with a tanker thus range between about 1h:05 min for Camp-Pierrot farms up to 1h:37 min for Mathurin without perturbation (twice 22.5 min + the time given in Table 1).
3.2 System management
According to preferences of Grand-Ilet’s stakeholders, it is envisaged that farm stocks be collected by transporters connected to the CTP. Two tankers of 26 tons weight with 15 m3 capacity are foreseen. However, due to traffic constraints (crossing a small bridge), it is assumed that deliveries made from the 4 farms of the Mathurin neighbourhood will be restricted to 5 m3 (1/3 tanker capacity). As the tanker capacities are small with respect to the amounts to be delivered, transport of slurry will be performed on a one-to-one round trip basis (the start point of the tanker is assumed to be at the CTP and only one farm is collected at a time although possibly by several consecutive trips). Each tanker will be assigned a full-time driver working according to the following schedule:
- 8 hours a day from 8:00 a.m. till 4:00 p.m. (1-hour lunch break is assumed within this period). - 5 days a week (Saturday and Sunday are excluded).
- 5 weeks’ holiday are given yearly to be taken in 2 or 3 periods (holiday periods do not overlap). - In addition, public holiday amounts up to 12 days off per year.
Table 1. Structural characteristics of the 51 Grand-Ilet pig farms.
Average one-way transport time (min) Neighbourhood Farm # Number of
farms (total nb. of Herd size sows)
Slurry production
(total m3/year) distance to Average
CTP (km) Tractor 5-10 m3 Tanker 20-26 T Camp-Pierrot 1-9 9 244 4 855 3.20 23.7 10.2 Casabois 10-16 7 115 2 296 5.25 30.9 16.8 Grand-Ilet1 17-26 10 190 3 774 4.56 32.1 14.5 Grand-Ilet2 27-37 11 208 4 139 4.96 34.7 15.7 Grand-Ilet3 38-44 7 129 2 558 4.17 30.0 13.2 Le Bélier 45-47 3 47 944 6.61 46.9 21.0 Mathurin 48-51 4 105 2 092 8.32 59.6 26.3 Total 1-51 51 1 038 20 658 - - -
As the CTP will be regularly monitored, it is assumed that an alert immediately stops the deliveries whenever 99% of its storage capacity is reached. This option, common to all policies, constitutes a negative feedback to prevent the CTP stock from overflowing. Hence, possible overflowing will mainly concern the farm stocks. As the number of tankers is limited, priority rules are used to deal with concurrent deliveries: whenever two or more deliveries must be made at the same time, which one to decide first? For avoiding farm stock overflow it seems clearly necessary to give priority to the stock with maximum level. Because of the diversity of farms within each neighbourhood, the transport should not be organised on a group basis (treating all the farms of a neighbourhood one after each other, then go collect farms in the next neighbourhood, etc.) but, rather, by ranking the stocks according to their level (collect the fullest stock, then the second fullest, etc.). Secondary criteria are used to discriminate between stocks with the same level. These are the time of transport, influencing the delivery speed, and the herd size, influencing the amount to be collected. Hence, for each farm, the normalised stock level (time-varying) along with the transport time and herd size (both constants) are differently combined to define the following priority rules: Prio1: fullest-nearest-smallest first; Prio2: fullest-furthest-biggest first; Prio3: fullest-nearest-biggest first; Prio4: fullest-furthest-smallest first. Priority 1 is chosen for the base scenario. 3.3 Random disturbances
As long as statistical data are lacking and for the sake of simplicity, normal distributions with arbitrary (though realistic) parameters are used. Since the aim is to check the three policies for robustness, the parameterisation of random functions reflects a worst-case testing approach rather than a fully realistic one. Stochastic simulations should therefore be interpreted in a relative sense rather than absolute. The concerned variables and how they are affected by randomness in the simulations presented hereafter are: - Farm slurry production rate: to account for the variability of farmer practices, a random function
makes this variable fluctuate within ±10% around the base value derived from farm data.
- CTP slurry utilisation rate: to account for possible plant breakdowns, every day a binary value is drawn (0: no flow; 1: normal flow). This results in an average of 8.4 days/year failure (2.3%). - Tanker availability: to account for tanker breakdowns or maintenance or, even, drivers’ sick leaves,
every day a binary value is drawn (0: normal; 1: one tanker unavailable) assuming that not both tankers may fail at the same time. This results in an average of 8 days/year failure (2.1%) in addition to stopping induced by annual holidays, though some of these days may coincide.
- Delivery date: to account for lead time variability (namely because of information transmission delays), each delivery may be delayed with a maximum of 8 hours.
- Transport length: to account for delays in transport, the duration of each delivery may vary within ±25% of the normal transport times given in Table 1.
- Road practicability: to account for pouring rains, typhoons or falling rocks (as Reunion is a tropical mountainous island), every day a binary value is drawn for each farm neighbourhood (0: no traffic for all farms of the neighbourhood; 1: normal traffic). This yields an average of 2.43 days/year of traffic interruption, some of these days being possibly weekends or holiday (not affecting in this case the deliveries).
4 Simulation-based evaluation of management policies
4.1 Policy evaluation method
As our aim is to provide agricultural stakeholders with decision support, policy evaluation should lead to policy selection based on relevant management indicators, where no stock overflow is taken as the main criterion, others being ancillary. Using as input the base scenario built upon actual data and stakeholders’ preferences (Section 3), simulations are performed, for each policy, as follows:
1. Find the configurations of parameters resulting in no stock overflow in deterministic simulations; 2. For each configuration, introduce random disturbances in the simulations, and, if needed, adapt
3. Rank the successful configurations according to long-term stability and robustness (ability to resist disturbances) and other selected criteria accounting for technical efficiency and cost (number and frequency of deliveries, transport times, amounts delivered, distance covered, time of shortage). Scenario adaptation must be made parsimoniously, by prioritising the modification of management rules before structure parameters. Simulations are made using a time base of 1 day and integration time-step of 0.015625 day (22.5 min), since the time-scale of delivery actions is about 1 hour. Not because it is relevant for the lifespan of the projected CTP, but to detect long-term effects (e.g. an increasing trend in a stock), 10-year (3 650 days) or 30-year (10 950 days) simulation bounds are chosen. To synchronize seasonally-dependent variables (e.g. working days) initial time is assumed to be the 1st of January of the first simulated year. Prior to simulation, initial conditions are set on state variables; here, all the stock levels are set to zero as this is more neutral to compare the planned policy with reactive ones.
4.2 Testing the planned (T, Q) policy
For each farm, the delivery size Q should be at least the amount of slurry produced between two consecutive deliveries. The delivery period T should be at most equal to the retention time of stocks (120 days for all farms) and at least, assuming only full capacity transport, equal to the necessary delay to fill a volume corresponding to the tanker capacity (5 m3 for Mathurin, 15 m3 for other farms). In this latter case, delivery periods range between 2.3 days for bigger farms and 65.2 days for smaller farms. Simulating with T =120 days yields 45 000 m3 farm stock overflow for 10 years, whereas the overflowed amount is ‘only’ 1 079 m3 with the second option. Trying intermediate values for the delivery period shows intermediate overflow values. It thus appears that minimising the delivery period dramatically reduces overflow. However, this doesn’t satisfies yet the no-overflow criterion. Further analysis shows that Farm 51 (from Mathurin) is responsible alone for nearly 80% of this amount (861 m3). As it is one of the bigger three farms and the more distant one, it seems that Priority 1, that gives priority to the smaller-nearer farms is not adapted. Simulating with the other three priorities (Section 3.2) gives the following results ranked by overflow (in brackets) increasing order: Prio3 (3.5 m3) > Prio2 (28 m3) > Prio1 (1 079 m3) > Prio4 (25 120 m3). Prio3, that prioritises the bigger-nearer farms thus appears almost acceptable. The very small overflow observed is from Farm 21, the smallest and medium-distant farm, hence with low priority. This can be simply fixed by slightly increasing the storage capacity of this farm. However this simulation exhibits wide fluctuations in the CTP stock evolution (scenario p1). All the minimums match with the holiday periods when one tanker is lacking, subsequently provoking an increase in the farm stocks (Fig. 3). This is particularly marked at the Christmas period at which, for 48 consecutive days, only one tanker is available. Four phases can be distinguished in this evolution (Fig. 3):
1. Time = 0-182: with initial zero stock, the CTP stock oscillates while the farm stocks are filling up. 2. Time = 182-1460: a relatively stationary state exhibiting wide fluctuations is found at the CTP. 3. Time = 1460-1825: a new transitory phase appears after a sudden drop in the CTP stock (-10%
deliveries at Christmas) and correlatively a jump of the farm stocks towards a new stationary state. 4. Time > 1825: the new reached state remains stable, even when simulating over 30 years.
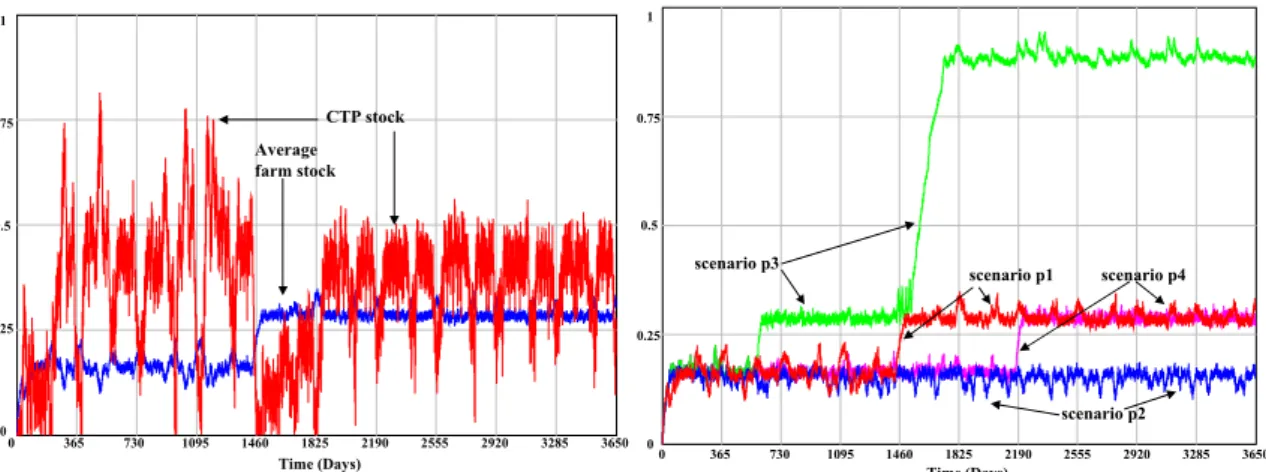
1 0.75 0.5 0.25 0 0 365 730 1095 1460 1825 2190 2555 2920 3285 3650 Time (Days) CTP stock Average farm stock 1 0.75 0.5 0.25 0 0 365 730 1095 1460 1825 2190 2555 2920 3285 3650 Time (Days)
Fig. 3. Evolutions of average farm and CTP stocks for the planned policy (scenario p1).
1 0.75 0.5 0.25 0 0 365 730 1095 1460 1825 2190 2555 2920 3285 3650 scenario p1 scenario p2 scenario p3 scenario p4 1 0.75 0.5 0.25 0 0 365 730 1095 1460 1825 2190 2555 2920 3285 3650 Time (Days)
Fig. 4. Evolutions of average farm stock for the planned policy according to 4 scenarios (explanations in text).
By slightly modifying the initial conditions, although the same process repeats, the same new state is jumped upon very differently: after 4 years with initial farm stocks at 0%, 3 years with 10%, but only 1 year with 1%. This non-linear sensitivity to initial conditions in a deterministic system may let us suspect some chaos at work; however this hypothesis deserves further careful analyses. Suppressing annual holiday brings very rapidly the system to reach the first equilibrium (phase 2 above) by more evenly distributing the delivery load over time (scenario p2, Fig. 4). Consequently, overflow is no more observed. However, introducing random disturbances in the simulation provokes a second jump to a new equilibrium during the fifth year (scenario p3, Fig. 4). This time, the jump follows delivery stops stemming from feedback alerts of the CTP due to stock overload (level ≥ 99% storage capacity). Equilibrium is reached at the expense of 37 733 m3 farm stock overflow (with 24 farms overflowing continuously and many others episodically). Stocks stabilise at a very high level for the farms (88% of capacity in average) and a very low level for the CTP stock (2.2% of capacity). Imposing a mandatory over-priority as soon as a stock starts overflowing does not help as, in that case, intermittent overflow affects all the farms. In order to correct this imbalance it is needed to introduce some adaptive feature in the system’s management. This may call for increasing Q (collecting more than the amount produced since the last delivery). In that case, due to the constraint of full capacity transport (minimum delivery becomes 2 tankers), overflow concentrates on farms with lower priorities. Another way is to control the utilisation rate of the treatment process proportionally to the CTP stock. Multiplying the constant utilisation rate (56.6 m3/day) by 1+k/20 (with k the normalised CTP stock) resolves the issue with an average 2% rate increase over the 10-year simulation period (scenario p4, Fig. 4). This adapted planned policy should thus be retained at this step, as it meets the no-overflow criterion, even with disturbances, and involves slight management adaptations only.
4.3 Testing the reactive (si, Si) policy based on farm stocks
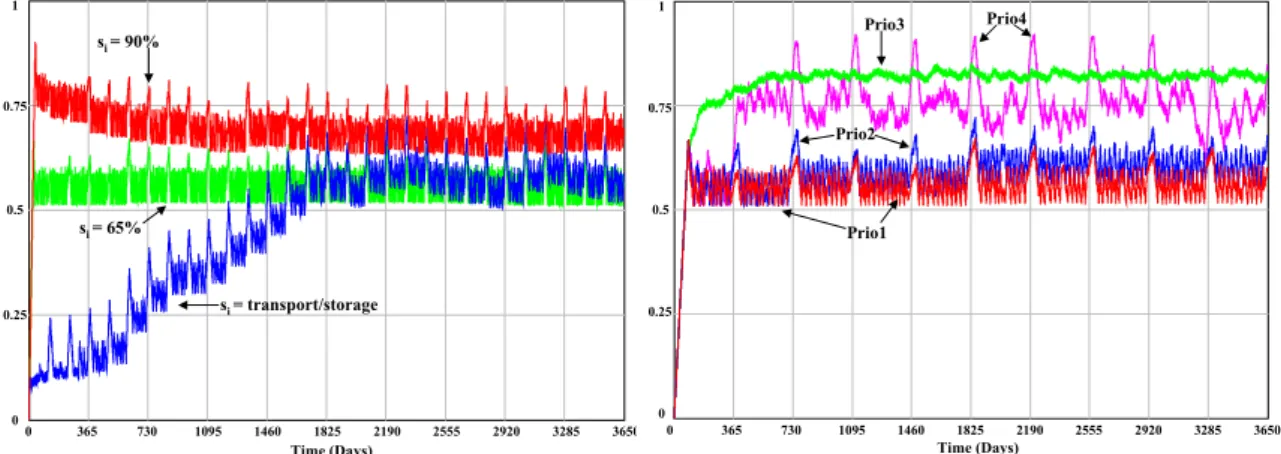
First it is necessary to define for each farm the delivery point si and the deliver-down-to level Si. For the latter, emptying a stock as much as possible (Si = 0) may be a good hint. The delivery point si should be at most equal to the total capacity of storage minus a security margin and, at least, correspond to the level at which the transport capacity is reached (5 m3 Mathurin, 15 m3 others). In the first case, simulating with si = 90% yields an overflow of 855 m3 (of which 95% from Mathurin’s farms 49 and 51). In the second case (si = transport capacity/storage capacity) it gives 341 m3 (all from farm 51). However, it is noted a decreasing trend of farm stocks in the first case and an increasing one in the second; both converge in the long run (15 years) to a value comprised between 55 and 75% (Fig. 5). Simulating with si = 65% yields no farm overflow and a much better long-term stability of the farm stocks. The CTP stock regularly fluctuates within 40-100% capacity outside holiday periods at which it generally drops down to 12-22% capacity. Now, there is no need to suppress annual holidays to meet the no-overflow criterion in the deterministic case. This result was obtained using Priority 1 (nearer-smaller first). Testing for other priorities gives (Fig. 6): Prio1 (0 m3) > Prio2 (75 m3) > Prio4 (21 826 m3) > Prio3 (35 982 m3). Based on si = 65% with Prio1, introducing randomness yields 3 884 m3 overflow of which almost all comes from Mathurin’s farms 49 (845 m3) and 51 (3010 m3). As in the planned strategy, proportional control of the CTP utilisation rate (using 1+k/16) resolves the problem with an average 3.5% increase in the base rate.
1 0.75 0.5 0.25 0 0 1095 2190 3285 4380 5475 6570 7665 8760 9855 10950 Time (Days) 1 0.75 0.5 0.25 0 0 365 730 1095 1460 1825 2190 2555 2920 3285 3650 si = 90% si = transport/storage si = 65% Time (Days)
Fig. 5. Average farm stock evolutions according to 3 delivery points si in the reactive policy based on farm stocks.
1 0.75 0.5 0.25 0 0 365 730 1095 1460 1825 2190 2555 2920 3285 3650 Time (Days) Prio1 Prio2 Prio3 Prio4 1 0.75 0.5 0.25 0 0 365 730 1095 1460 1825 2190 2555 2920 3285 3650 Time (Days)
Fig. 6. Influence of priority rules on the average farm stock evolution in the reactive policy based on farm stocks.
4.4. Testing the reactive (s, S) policy based on the CTP stock
As with the reactive policy based on farm stocks, we need to determine the reorder point s and the order-up-to level S. In order the CTP to achieve its function, S must be as large as possible, i.e. equal to the upper threshold (S = 99%). The reorder point s should be at most equal to the minimal delivery amount below the upper threshold (we take s = 95%, i.e. about 3 tankers) and at least as close as possible of emptiness while avoiding slurry shortage (e.g. s = 15%, leaving about 3 days autonomy). First scenario (s = 95%) yields an overflow of 1 576 m3 (always Mathurin’s farms 49 and 51) whereas the second (s = 15%) yields 5 814 m3. Trials with intermediate values show that higher the threshold, lesser the overflow. Keeping s = 95% and testing for other priorities gives: Prio2 = Prio3 (0 m3) > Prio1 (1 576 m3) > Prio4 (36 098 m3). Both priorities 2 and 3 could thus be candidate as they meet, with no adaptation, the no-overflow criterion over 10 years. However, introducing randomness let appear that Prio2 is more adaptive than Prio3 (2 348 m3 overflow against 34 865 m3). Proportional control of the CTP utilisation rate (using 1+k/16) with an average increase of 3.8% brings back the simulation with Prio2 to no overflow without suppressing holiday.
5 Discussion and concluding remarks
5.1 Summary of simulation experiments
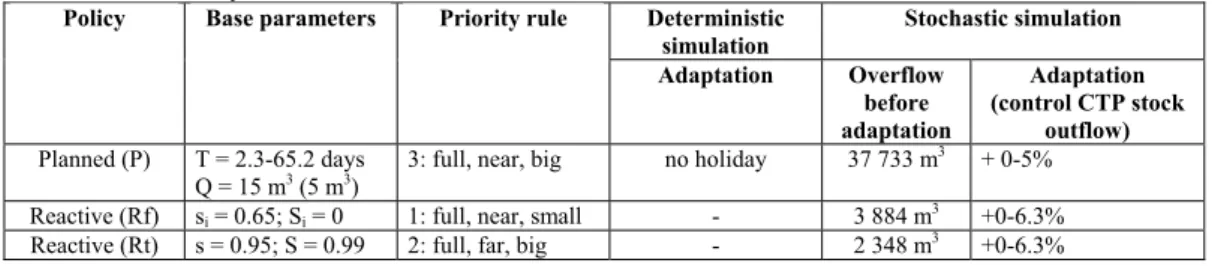
All these simulation experiments emphasise the crucial role played by disturbances (deterministic like annual holiday or random) and by priority rules (reflecting organisation choices) both affecting the workload distribution in such a supply chain. These disturbances, however, does not prevent the system from self-organising by means of interactions mediated by dynamic priority rules. Table 2 summarises the first practical conclusions drawn. It appears that reactive policies, based on feedback control, are more efficient to rapidly comply with system’s uncertainty than the feedforward planned policy. In effect, no adaptation is required for both reactive policies to meet the no-overflow criterion in deterministic simulation. Introducing randomness affects also considerably less (factor 10) the loss of performance of these policies with respect to this criterion. However, although the reactive policies satisfy as such the no-overflow criterion, suppressing annual holiday gives the stocks much better stability (lower level, less variability). We thus consider 5 candidate policies: the planned policy with the no-holiday option and both reactive policies with and without this option.
5.2 Comparison of policies according to management indicators
Several performance criteria exhibit close values from one policy to another. With two 15 m3 tankers and per year: 1 631-1 638 round-trip deliveries are performed, 20 525-20 618 m3 slurry carried out, 2 217-2 217-2217-24 hours spent in transport, 17 751-17 845 km covered. Although these policies exhibit different stock evolutions (as deliveries are differently distributed over time), their average delivery frequencies differ by no more than 0.73%. Neither, the long-term stability of their stocks differ that much in permanent regime (SDs of stocks are 2-5% for farms, 17-24% for the CTP). Due to inherent imprecision, these results, worked out from 30 year-simulations, should not be regarded as significantly different. This convergence is not so surprising, since all these policies were tuned to meet the same criterion (no-overflow). However, a difference would have been expected according to the holiday vs. no-holiday options. Whereas it is the case for the planned policy, it appears, for the reactive policies, that the lack of one tanker is compensated by overtime work performed during or after the holiday periods (overtime is 25% of total work time with holiday, 15% with no-holiday).
Table 2. Policy features able to meet the no-overflow criterion in deterministic and stochastic simulations.
Deterministic simulation
Stochastic simulation Policy Base parameters Priority rule
Adaptation Overflow before adaptation Adaptation (control CTP stock outflow) Planned (P) T = 2.3-65.2 days
Q = 15 m3 (5 m3) 3: full, near, big no holiday 37 733 m
3 + 0-5%
Reactive (Rf) si = 0.65; Si = 0 1: full, near, small - 3 884 m3 +0-6.3%
However, there is a difference for the time of shortage at the CTP: 4-5 days/year with holiday, 0.2-0.4 days/year with no-holiday. As these values are far below the treatment process tolerances, shortage should not constitute a real criterion of choice. Eventually, these 5 policies may be regarded as relatively equivalent with respect to the no-overflow criterion. Therefore the choice should be made based on two remaining criteria: robustness to disturbances and field implementation.
5.3 Checking policies for robustness
Concerning robustness, repeated simulations are performed with 10 different seeds for computing the random numbers, thus generating different disturbances among the simulations of the same policy. The variability between simulations is checked for the following outputs: overflow, farm stock, CTP stock, slurry shortage, overtime work. For each policy and for each output, the range width between the max and min values among the simulations is calculated. Then, for each output, the policies are ranked based on the assumption that narrower the range, lesser the variability and so, better the robustness. Then, summing up these ranks for each policy gives a score used to sort the policies by decreasing order of robustness (lesser the score, more robust the policy). The final ranking is as follows (score in brackets): Rf-no-holiday (10) > Rt-no-Rf-no-holiday (12) > Rf (16) > Rt (17) > P-no-Rf-no-holiday (20). This result confirms, first, that reactive policies (Rf and Rt) are better than the planned one (P). Second, it outlines the validity of the no-holiday option for robustness, the most preferable policy being that based on farm stocks (Rf-no-no-holiday). 5.4 Field implementation of policies
Concerning field implementation, due to the convergence of the 5 policies for the criteria discussed above (Section 5.2), operating costs would differ only according to the holiday/no-holiday option. According to the French regulations, the workforce to achieve transport approximately corresponds to 1.4 full-time work. As this time is effective time spent in transport, it is reasonable to round the total necessary workforce up to 2 full-time works, assuming some work time apart from driving. However, if the no-holiday option is implemented, then not two full-time workers but one full-time and two half-times would be necessary. Another relevant point is information. Apart from the planned policy whose parameters are fixed, the Rf policy needs information on the farm stocks for triggering the deliveries and organising the delivery schedule. For the same reasons, the Rt policy needs information on the CTP stock and the farm stocks. Farm information can be collected by direct observation of stock levels either by the farmers themselves or by the tanker drivers. Another way could be to instrument the farm tanks with permanent submersible sensors triggering an alarm when the delivery point is reached. The alarm could be transmitted to the CTP manager by cellular phone either manually (i.e. by the farmers) or automatically. For both cases, the option involving the CTP personnel directly in charge of slurry management is probably more reliable although it has the inconvenient to call for a lesser participation of farmers. 5.5 Conclusions
Finally, within the framework imposed by stakeholders’ wishes, it appears that the planned policy should be excluded for lack of adaptivity. As among the reactive policies the Rf policy with the no-holiday option demonstrated to be most adaptive and robust it is judged preferable. However, information is a point deserving attention for reactive policies. An information system about farm stock levels should be organised, either based on direct observation or automatic data acquisition and transmission to the CTP manager. These options need further technical investigations and discussion with the stakeholders. Other adaptations could also be investigated, like collecting Mathurin’s farms separately with a special vehicle.
5 References
Guerrin, F., 2004. Simulation of stock control policies in a two-stage production system. Application to pig slurry management involving multiple farms. Computers and Electronics in Agriculture 45 (1-3), 27-50.
Guerrin, F., Paillat, J.-M., 2003. Modelling biomass fluxes and fertility transfers: animal wastes management in the Reunion Island. Modsim 2003, Int. Congress on Modelling and Simulation, 14-17 July 2003, Townsville, Australia, vol. 3, pp. 1591-1596.
Médoc, J.-M., Guerrin, F., Courdier, R., Paillat, J.-M., 2004. A multi-modelling approach to help agricultural stakeholders design animal wastes management strategies in the Reunion Island. iEMSs Congress, June 14-17 2004, Osnabrück, Germany.