HAL Id: hal-02775970
https://hal.inrae.fr/hal-02775970
Submitted on 4 Jun 2020
HAL is a multi-disciplinary open access
archive for the deposit and dissemination of
sci-entific research documents, whether they are
pub-lished or not. The documents may come from
teaching and research institutions in France or
abroad, or from public or private research centers.
L’archive ouverte pluridisciplinaire HAL, est
destinée au dépôt et à la diffusion de documents
scientifiques de niveau recherche, publiés ou non,
émanant des établissements d’enseignement et de
recherche français ou étrangers, des laboratoires
publics ou privés.
Distributed under a Creative Commons Attribution - NonCommercial| 4.0 International
License
metabarcoding primer sets for insectivorous diet
analyses
Orianne Tournayre, Maxime Leuchtmann, Ondine Filippi-Codaccioni, Marine
Trillat, Sylvain Piry, Dominique Pontier, Nathalie Charbonnel, Maxime Galan
To cite this version:
Orianne Tournayre, Maxime Leuchtmann, Ondine Filippi-Codaccioni, Marine Trillat, Sylvain Piry,
et al.. In silico and empirical evaluation of twelve metabarcoding primer sets for insectivorous diet
analyses. Ecology and Evolution, Wiley Open Access, In press, pp.1-23. �10.1002/ece3.6362�.
�hal-02775970�
Ecology and Evolution. 2020;00:1–23. www.ecolevol.org | 1
Received: 10 January 2020
|
Revised: 20 March 2020|
Accepted: 22 April 2020 DOI: 10.1002/ece3.6362O R I G I N A L R E S E A R C H
In silico and empirical evaluation of twelve metabarcoding
primer sets for insectivorous diet analyses
Orianne Tournayre
1| Maxime Leuchtmann
2|
Ondine Filippi-Codaccioni
3,4| Marine Trillat
1| Sylvain Piry
1|
Dominique Pontier
3,4| Nathalie Charbonnel
1| Maxime Galan
1This is an open access article under the terms of the Creative Commons Attribution License, which permits use, distribution and reproduction in any medium, provided the original work is properly cited.
© 2020 The Authors. Ecology and Evolution published by John Wiley & Sons Ltd.
Dominique Pontier and Nathalie Charbonnel contributed equally to this work.
1CBGP, INRAE, CIRAD, IRD, Montpellier
SupAgro, Université de Montpellier, Montpellier, France
2Nature Environnement 17, Surgères, France 3LabEx ECOFECT “Ecoevolutionary
Dynamics of Infectious Diseases, Université de Lyon, Lyon, France
4CNRS, Laboratoire de Biométrie et Biologie
Évolutive, UMR5558, Université de Lyon, Université Lyon 1, Villeurbanne, France
Correspondence
Orianne Tournayre, CBGP, INRAE, CIRAD, IRD, Montpellier SupAgro, Université de Montpellier, Montpellier, France. Email: orianne.tournayre@supagro.fr
Funding information
LABEX ECOFECT, Grant/Award Number: ANR-11-LABX-0048; French National Research Agency (Investissements d'Avenir), Grant/Award Number: ANR-11-IDEX-0007; Institut National de la Recherche
Agronomique; CBGP laboratory, ; Nouvelle-Aquitaine Region, ; Nouvelle-Nouvelle-Aquitaine DREAL; European Regional Development Fund; LabEx CeMEB, Grant/Award Number: ANR-10-LABX-04-01
Abstract
During the most recent decade, environmental DNA metabarcoding approaches have been both developed and improved to minimize the biological and technical biases in these protocols. However, challenges remain, notably those relating to primer design. In the current study, we comprehensively assessed the performance of ten COI and two 16S primer pairs for eDNA metabarcoding, including novel and previously pub-lished primers. We used a combined approach of in silico, in vivo-mock community (33 arthropod taxa from 16 orders), and guano-based analyses to identify primer sets that would maximize arthropod detection and taxonomic identification, successfully identify the predator (bat) species, and minimize the time and financial costs of the experiment. We focused on two insectivorous bat species that live together in mixed colonies: the greater horseshoe bat (Rhinolophus ferrumequinum) and Geoffroy's bat (Myotis emarginatus). We found that primer degeneracy is the main factor that influ-ences arthropod detection in silico and mock community analyses, while amplicon length is critical for the detection of arthropods from degraded DNA samples. Our guano-based results highlight the importance of detecting and identifying both pred-ator and prey, as guano samples can be contaminated by other insectivorous species. Moreover, we demonstrate that amplifying bat DNA does not reduce the primers' capacity to detect arthropods. We therefore recommend the simultaneous identifi-cation of predator and prey. Finally, our results suggest that up to one-third of prey occurrences may be unreliable and are probably not of primary interest in diet stud-ies, which may decrease the relevance of combining several primer sets instead of using a single efficient one. In conclusion, this study provides a pragmatic framework for eDNA primer selection with respect to scientific and methodological constraints.
K E Y W O R D S
1 | INTRODUCTION
The genetic analysis of environmental samples such as soil, water, or feces, known as environmental DNA (eDNA) metabarcoding, is a rapid and cost-effective tool for the study of species that are difficult to detect or monitor (Bohmann et al., 2014). This approach allows the simultaneous identification of multiple taxa in environmental sam-ples, bypassing the need to isolate organisms prior to identification (Clare, 2014; Taberlet, Coissac, Hajibabaei, & Rieseberg, 2012). eDNA metabarcoding is of particular interest in dietary analysis of rare or elusive species, and this approach has now been applied to a large spectrum of organisms (Clare, Fraser, Braid, Fenton, & Hebert, 2009; Corse et al., 2017; Kartzinel & Pringle, 2015; Rytkönen et al., 2019; Shehzad et al., 2012). Compared to the traditional microscopic study of undigested fragments in fecal remains, eDNA metabarcoding has three key advantages for dietary analysis: (a) a finer resolution (po-tentially to the species level), (b) the simultaneous processing and sequencing of several hundred samples, and (c) the detection of spe-cies that could not be detected using previous techniques such as vi-sual recognition of morphological features (e.g., soft-bodied species; Galan et al., 2018; Nielsen, Clare, Hayden, Brett, & Kratina, 2018). However, eDNA metabarcoding is subject to many biological and technical biases in each step of the process, including fieldwork, laboratory analysis, and bioinformatics. Inappropriate sampling and storage conditions, contaminations, PCR inhibitors, PCR stochastic-ity, and chimera formation are common biases influencing the re-liability of results (for a review, see Alberdi, Aizpurua, et al., 2019; Lindahl et al., 2013). Many methodological improvements have been made to limit some of these biases and to introduce best-practice guidelines for metabarcoding protocols, such as the systematic inclusion of technical replicates and negative controls (Alberdi, Aizpurua, Gilbert, & Bohmann, 2018; Corse et al., 2017; Elbrecht & Steinke, 2019; Galan et al., 2016; Mata et al., 2018).
Another major issue in eDNA metabarcoding protocols that still needs to be solved is the selection of appropriate primer set(s), al-though this issue has received increased attention in recent years (Elbrecht et al., 2019; Op De Beeck et al., 2014; Piñol, Senar, & Symondson, 2019). This is a crucial choice, as the primers must be suitable for all of the taxa actually present in the environmental sam-ple in order to avoid missing unexpected items (Taberlet, Coissac, Pompanon, Brochmann, & Willerslev, 2012). The DNA fragment amplified by the primers must be variable enough to discriminate close species, but also needs to be abundantly referenced in public sequence databases for successful taxonomic identification based on the sequences generated (Elbrecht et al., 2016). Among the var-ious mitochondrial genes used in animal metabarcoding, such as the 12S rRNA, 16S rRNA, and cytochrome b genes (Hänfling et al., 2016; Riaz et al., 2011; Santas, Persaud, Wolfe, & Bauman, 2013), the cyto-chrome c oxidase I (COI) gene is the most widely used as it fulfills the above criteria the best (Andújar, Arribas, Yu, Vogler, & Emerson, 2018; Hebert, Cywinska, Ball, & deWaard, 2003). Formerly, DNA barcod-ing approaches targeted the “Folmer region” of COI which is 658 base pairs (bp) long. This is too long for efficient sequencing using
the second generation of high-throughput sequencing (HTS) plat-forms (Lear et al., 2018). Moreover, eDNA is often highly degraded, due to the digestion process (in the case of fecal samples) or to envi-ronmental exposure of the samples (i.e., rain, sunlight; Oehm, Juen, Nagiller, Neuhauser, & Traugott, 2011). Such issues render the use of the entire “Folmer region” COI sequence impracticable (Deagle, Eveson, & Jarman, 2006). “Mini COI barcodes” (i.e., with a targeted re-gion range < 200 bp; Hajibabaei et al., 2006; Pompanon et al., 2012) are therefore more commonly used in eDNA metabarcoding analy-ses. However, the paucity of conserved regions in the COI sequence can complicate universal primer design (Deagle, Jarman, Coissac, Pompanon, & Taberlet, 2014). Thus, some authors have argued for the joint use of several COI primer sets (e.g., Corse et al., 2019; Esnaola, Arrizabalaga-Escudero, González-Esteban, Elosegi, & Aihartza, 2018) or for the combination of mitochondrial 16S rRNA and COI primer sets (e.g., Alberdi et al., 2018; Bohmann et al., 2018). This combined approach should improve the taxonomic coverage of prey items. For example, Esnaola et al. (2018) have shown that the combination of the Zeale, Butlin, Barker, Lees, and Jones (2011) and Gillet et al. (2015) primer sets enabled the detection of 37.2% more species than when using Gillet's primer set alone. However, the combination of several primer sets greatly increases both the financial cost and the duration of laboratory and bioinformatics analyses of metabarcoding studies. In this context, the use of a single highly degenerate primer set would be preferred, and some studies have already highlighted the effi-ciency of this approach (Elbrecht & Leese, 2017; Galan et al., 2018; Vamos, Elbrecht, & Leese, 2017). Degenerate bases are used in primer sequences to avoid mismatches at variable positions between the dif-ferent targeted taxa. In theory, this process should enable the amplifi-cation and identifiamplifi-cation of many different taxa using a unique primer set in a single PCR. However, degenerate primers have to be carefully designed because high levels of degeneracy can lead to high rates of nontarget amplification (Innis, Gelfand, Sninsky, & White, 2012). No consensus on primer choice has yet been reached in eDNA metabar-coding, and at present, a multitude of primer sets exist for the COI and 16S genes that differ in their target length, degeneracy levels, and position within the genes.
Designing robust metabarcoding protocols for the study of insec-tivorous bat diets is still an important issue. Such molecular analyses are critical because the direct observation of bat feeding is virtually impossible. The morphological identification of prey remains in guano rarely provides resolution at the genus or species level and can be highly time-consuming. Finally, many bat species are endangered and highly protected such that invasive methods cannot be used to carry out diet surveys. Metabarcoding analysis of the DNA contained in bat guano has thus been developed (a) to deepen our understanding of bat ecology (Arrizabalaga-Escudero et al., 2015; Clare, Symondson, Broders, et al., 2014), (b) to highlight the potential ecosystem ser-vices provided by bats as pest suppressors (Aizpurua et al., 2018; Maslo et al., 2017; Wray et al., 2018), and ultimately, (c) to set up ef-fective conservation strategies (Arrizabalaga-Escudero et al., 2015). However, most of these studies have used specific arthropod primer sets (but see Galan et al., 2018; Jusino et al., 2018; Wray et al., 2018)
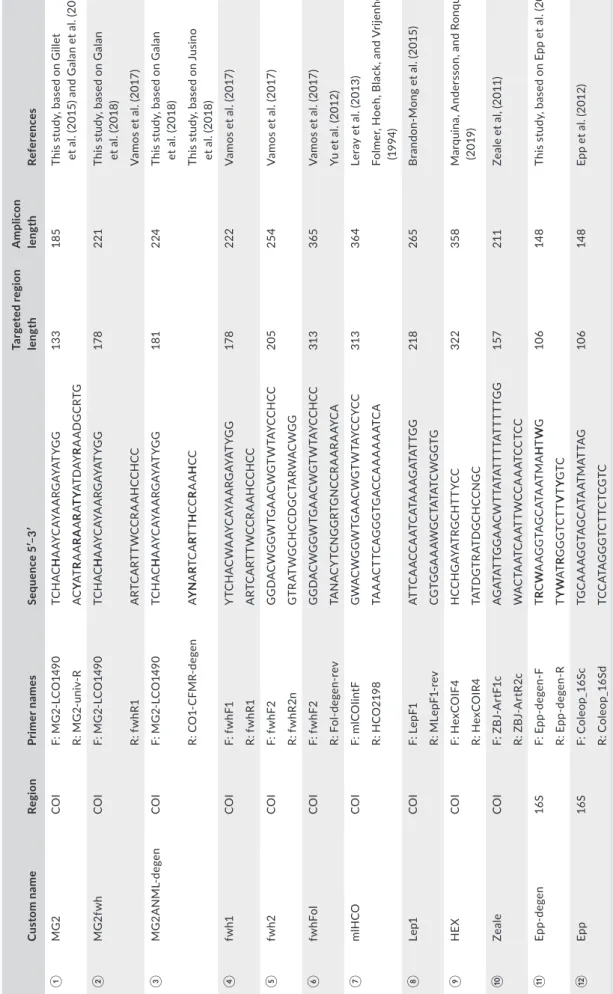
T A B LE 1 Pr im er s et i nf or m at io n. B as es i n b ol d i nd ic at e t he b as es w hi ch w er e m od ifi ed ( de ge ne ra te d o r c or re ct ed ) i n t hi s s tu dy C us to m n ame Re gi on Pri me r n ame s Seq uen ce 5 ′– 3′ Ta rg et ed r eg io n len gth A m pl ic on len gth Re fer en ce s ① M G 2 CO I F: M G 2-LC O 14 90 TC H A C H A AY C AYA A RG AYA TY G G 13 3 18 5 Th is s tu dy , b as ed o n G ill et et a l. (2 01 5) a nd G al an e t a l. (2 01 8) R: M G 2-uni v-R AC YAT R AA R A A R ATY AT D AY R A AD G C RT G ② M G 2f wh CO I F: M G 2-LC O 14 90 TC H A C H A AY C AYA A RG AYA TY G G 17 8 22 1 Th is s tu dy , b as ed o n G al an et a l. (2 01 8) R: f w hR 1 AR TC AR TT W C C R A AHC C HC C V am os e t a l. (2 01 7) ③ M G 2A N M L-de ge n CO I F: M G 2-LC O 14 90 TC H A C H A AY C AYA A RG AYA TY G G 181 224 Th is s tu dy , b as ed o n G al an et a l. (2 01 8) R: C O 1-C FM R-de ge n AY N A R TC A R TT H CC R AA H CC Th is s tu dy , b as ed o n J us in o et a l. (2 01 8) ④ fw h1 CO I F: f w hF 1 Y TC H A C W A AY C AYA A RG AYA TY G G 17 8 222 V am os e t a l. (2 01 7) R: f w hR 1 AR TC AR TT W C C R A AHC C HC C ⑤ fw h2 CO I F: f w hF 2 G G D AC W G G W TG A AC W G TW TA YC C H C C 205 25 4 V am os e t a l. (2 01 7) R: f w hR 2n G TR AT W G C HC C D G C TAR W A C W G G ⑥ fw hF ol CO I F: f w hF 2 G G D AC W G G W TG A AC W G TW TA YC C H C C 313 365 V am os e t a l. (2 01 7) R: F ol -d eg en -r ev TAN A C Y TC NG G RT G NC C R A AR A AY C A Yu e t a l. ( 20 12 ) ⑦ m lH CO CO I F: m lC O Iin tF G W A C W G G W TG A A C W G TW TA YC C YC C 313 36 4 Le ra y e t a l. ( 20 13 ) R: H C O 21 98 TAAA C TT C A G G G TG A C C AAAAAA TC A Fo lm er , H oe h, B la ck , a nd V rij en ho ek (1 99 4) ⑧ Le p1 CO I F: L ep F1 AT TC A A C C A AT C AT A A A G AT AT TG G 218 26 5 B ra nd on -M on g e t a l. (2 01 5) R: M Le pF 1-re v C G TG G A A AW G C TA TA TC W G G TG ⑨ H EX CO I F: H ex C O IF 4 H C C H G AYA TR G C H TT YC C 32 2 35 8 M ar qu in a, A nd er ss on , a nd R on qu is t (2 01 9) R: H ex C O IR 4 TA TD G TR AT D G C HC C NG C ⑩ Ze al e CO I F: Z B J-A rt F1 c A G AT ATT G G A A C WTT AT ATTTT ATTTTT G G 157 211 Ze al e e t a l, (2 01 1) R: Z B J-A rt R 2c W A C TAA TC AA TT W C C AAA TC C TC C ⑪ Ep p-de gen 16 S F: E pp -d eg en -F TR C W A A G G TA G C AT A AT M A H TW G 10 6 14 8 Th is s tu dy , b as ed o n E pp e t a l. (2 01 2) R: E pp -d eg en -R TYW AT R GGG TC TT V TY G TC ⑫ Ep p 16 S F: C ol eo p_16 Sc TG C A A A G G TA G C AT A AT M AT TA G 10 6 14 8 Ep p e t a l. (2 01 2) R: C ol eo p_16 Sd TC C AT A G G G TC TTC TC G TC
or specific bat primer sets (Walker, Williamson, Sanchez, Sobek, & Chambers, 2016). While working with guano collected from roost sites, a potential problem arises from the fact that several bat species may roost in the same sites. Because guano is not easily distinguish-able between bat species (Ware, Garrod, Macdonald, & Allaby, 2019), it is critical to identify bat species to avoid misassigning prey to the wrong bat species and also to discard guano samples that could be contaminated with excreta from other bat species. To this end, Galan et al. (2018) previously optimized a metabarcoding approach to simul-taneously identify bat species and their prey, instead of using differ-ent primer sets and methodologies to iddiffer-entify bat species on the one hand and arthropods on the other (e.g., Bohmann et al., 2011; Van den Bussche et al., 2016). As the amplification of bat DNA may re-duce the sensitivity of prey DNA detection (Pompanon et al., 2012), it is important to find a trade-off between the success of an exhaustive prey amplification and bat species identification.
In this study, we followed a multicriteria assessment approach to compare the performance of several sets of primers for use in in-sectivorous bat dietary analyses. We compared statistically different primer sets to identify the characteristics (primer degeneracy, am-plicon length, DNA degradation) that would maximize the accuracy of arthropod detection and identification, while minimizing the time and financial cost of laboratory work. We also compared the capac-ity of primer sets to provide identification of bat species without over amplifying bat DNA. We focused on the greater horseshoe bat (Rhinolophus ferrumequinum) and Geoffroy's bat (Myotis emarginatus) as they often share maternity roosts during summer but have con-trasting diets (Goiti et al., 2011; Jones, 1990). Following the recent recommendations of Elbrecht et al. (2019), we carried out a complete primer assessment based on three steps. We first made an in silico comparison of primer sets, using hundreds of thousands of arthropod sequences available in public databases. This step enabled us to eval-uate primer efficiency to detect a wide taxonomic range of arthro-pods, independently of both the quality of samples and the effects of laboratory procedures (extraction, PCR, etc.). We then performed an in vivo comparison of primer sets using two mock communities (MC)—one containing arthropod DNA only and the other one con-taining both arthropod and bat DNA. This step enabled us to evaluate how efficiently primer sets detect a wide taxonomic range of known arthropod taxa, and to assess whether the presence of bat DNA would affect the efficiency of prey detection. Lastly, we made an in vivo comparison of primer sets using guano samples collected from two insectivorous bat species. This step allowed us to compare the efficiency of primer sets when amplifying degraded arthropod DNA; a common scenario for guano samples collected from roost sites.
2 | MATERIALS AND METHODS
2.1 | In silico evaluation
First, we selected primers that are commonly used in arthropod me-tabarcoding studies (Table 1, Figure 1). Six of the selected primer
sets amplified fragments within the Folmer region of the COI gene, and one set amplified a region in the 16S gene. We favored primer sets which amplified short fragments (between 133 and 218 bp ex-cluding primers), but we also looked at longer fragments (between 313 and 322 bp excluding primers) to evaluate the potential ef-fect of amplicon length on prey detection and identification in bat guano. Then, we designed five new combinations of primers (four for COI and one for 16S) based on the seven primer sets described above. We increased the base degeneracy level of the COI reverse primer described in Jusino et al. (2018) and of the 16S primers from Epp et al. (2012), to improve primer binding during PCR amplifica-tion. Although some studies have advocated for the combined use of 16S and COI primers (Alberdi et al., 2018; Bohmann et al., 2018; Kaunisto, Roslin, Sääksjärvi, & Vesterinen, 2017), we only included two 16S primer sets in this study, as 16S does not currently result in significant gains in taxonomic discovery for dietary studies due to a lack of local reference sequences for this region (Clarke, Soubrier, Weyrich, & Cooper, 2014; Elbrecht et al., 2016; Marquina, Esparza-Salas, Roslin, & Ronquist, 2019). We did not include the COI primer sets proposed by Shokralla et al. (2015) which span the entire COI barcode region. Indeed, previous studies have shown that these primers do not perform efficiently with degraded DNA, probably because of the length of the fragments (respectively 325 and 418 bp excluding primers) (Haran et al., 2018). Therefore, they were not considered appropriate for the metabarcoding analyses of guano samples.
Thus, our aim was to compare the efficiency of 12 primer sets. We used the R package PrimerMiner (Elbrecht & Leese, 2016) on 21 arthropod orders including potential bat prey (Figure 2). We clus-tered 4,259,845 sequences from the BOLD database into 327,412 COI OTUs (operational taxonomic units) and 83,651 sequences from the NCBI database into 25,505 16S OTUs. COI and 16S sequences were aligned separately using MAFFT v7.017 (Katoh, Misawa, Kuma, & Miyata, 2002) as implemented in GENEIOUS v8.1.7 (Kearse et al., 2012). The consensus sequence alignment for each order of arthropods was visualized using PrimerMiner which facilitates the identification of suitable primer binding sites. All primer sets (previ-ously published and redesigned) are detailed in Table 1. They varied in target region length and degeneration level (Figure 1).
We used the mean penalty score per arthropod order provided in PrimerMiner. This score is calculated as a mismatch scoring that includes the adjacency, position, and type of mismatch between primers and template sequences. Primer evaluation was conducted only for arthropod orders represented by at least 100 OTUs, as rec-ommended by Elbrecht and Leese (2016). This threshold enabled us to capture a large portion of the variability potentially existing at primer binding sites and to limit potential biases resulting from the presence of only few sequences when evaluating the match/mis-match. We compared primer sets by combining the penalty scores from both the forward and reverse primers. We then used these scores to determine whether the arthropod OTUs would theoreti-cally be successfully amplified using the default value (success: pen-alty score < 120).
2.2 | In vivo evaluation
2.2.1 | Mock community: sample collection and
preparation
Briefly, we collected 33 arthropod individuals representing 16 or-ders with two taxa per order except for Opiliones, Dermaptera, Isopoda, Psocodea, Julida, Polyxenida, and Raphidioptera (which had one taxa per order). They were captured alive in May and June 2019 in the South of France and then immediately frozen at −20°C to avoid DNA degradation. Bat DNA was extracted from tissue sam-ples. Greater horseshoe bats (R. ferrumequinum) were captured in Western France in 2016, and a piece of patagium (wing membrane) was collected using a 3-mm-diameter biopsy punch, after which bats were released. These bat samples were preserved in 95% ethanol solution at 4°C until DNA extraction and pooling.
The DNA of arthropods and bats was extracted using the EZ-10 Spin Column Genomic DNA Miniprep Kit for Animal (BioBasic) following the manufacturer's instructions. DNA extractions were normalized to 7 ng/µl after Qubit fluorometer quantification (Invitrogen). The integrity of DNA was evaluated by electrophoresis on a 1.5% agarose gel.
We built two versions of the same mock community (MC) of 33 different arthropod taxa. The first one included the 33 arthropod DNA extracts mixed in equimolar proportions (MCarthr). The second
one included 50% of this mock community and 50% of bat DNA (MCarthr+bat). The R. ferrumequinum DNA used in the mock
commu-nity was a pool of DNA extractions representing 18 individuals of
the same colony. This design enabled us to limit the use of DNA per individual and to preserve this material for future studies.
We used the same DNA extractions of bats and arthropods to build reference sequences for the COI and 16S genes. Normalized DNA was amplified and sequenced for each individual to provide reference sequences for each gene. As the ten COI primers span al-most all of the 658-bp COI Folmer region, we sequenced this region using Sanger technology as described in Sow et al. (2018). We se-quenced the 106-bp region targeted by the two 16S minibarcodes using the Epp-degen primer set and MiSeq sequencing technology for each DNA extraction independently, following the same protocol used for the analysis of the mock and guano samples, as described below.
2.2.2 | Guano samples: collection and preparation
We collected 22 fecal pellets from each of five mixed maternity colonies of the greater horseshoe bat and Geoffroy's bat in Western France in June 2018. Each fecal pellet was retrieved from paper plates which had been left on the ground beneath the colony for 10 days. Single-use forceps were used to collect pellets to avoid contaminations between samples. Paper plates were renewed on each sampling date to avoid contaminations. Samples were stored at −20°C until DNA extraction.
Briefly, guano samples were frozen at −80°C and then bead-beaten for 2 × 30 s at 30 Hz in a TissueLyser (Qiagen) using a 5-mm stainless steel bead. DNA was extracted using the NucleoSpin 8
F I G U R E 1 Visual representation of DNA barcode lengths and primer positions on the COI gene. Primer sets are represented by a
number (see Table 1) and colored arrows, with each color representing a unique primer set. For each primer set, the number on the gray line corresponds to the amplicon length excluding primers. This information is collated at the bottom of the figure, with the whole 658-bp COI Folmer region represented in black and the 3′ position of each primer indicated with traits of its respective color
Plant II kit (Macherey-Nagel) with the slight modifications recom-mended in Zarzoso-Lacoste et al. (2018).
2.2.3 | PCR and library construction
The PCR conditions can greatly influence the performance of primer sets (Jusino et al., 2018). Thus, we applied the same PCR program for all primer sets and used a low annealing temperature (45°C) as recommended in recent studies (Elbrecht et al., 2019; Jusino et al., 2018). We validated this program by checking the quality of PCR amplifications on the mock communities for the 12 primer sets.
We made four versions of each primer by adding a 5′ heterogeneity spacer of 0–3 bp to the primer sequence. This increased the diversity at each sequencing cycle, improved the detection of the sequencing clus-ters at the flowcell surface, and thus increased the quality of the reads. The four versions of each primer were mixed together before PCR.
We used the two-step PCR protocol described in Galan et al. (2018) with slight modifications. Firstly, we increased the ex-tension time (2 min instead of 45 s) in PCR1 and PCR2 to reduce
chi-mera formation (Qiu et al., 2001). Secondly, for each PCR replicate multiplexed in the same run, we used a double indexing strategy as recommended in Kircher, Sawyer, and Meyer (2012) to significantly reduce the rate of read misassignment: Each 9-bp i5 and i7 dual index was used only for one PCR sample, eliminating the problem of “leak” due to false index-pairing (Martin, 2019). PCR1 was
per-formed in 10 µl reaction volumes using 5 µl of 2× Qiagen Multiplex Kit Master Mix (Qiagen), 2.5 µl of ultrapure water, 0.5 µl of each mix of forward and reverse primers (10 µM), and 1.5 µl of DNA extract. Thermocycler conditions for PCR1 consisted of an initial
denatur-ation step at 95°C for 15 min, followed by 40 cycles of denaturdenatur-ation at 94°C for 30 s, annealing at 45°C for 45 s, and extension at 72°C for 2 min, followed by a final extension step at 72°C for 10 min. Conditions for PCR2 consisted of a limited-cycle amplification step
to add multiplexing indexes i5 and i7 (nine bases each) and Illumina sequencing adapters P5 and P7 at both ends of each DNA fragment from PCR1. PCR2 was carried out in a 10 µl reaction volume using 5 µl of Qiagen Multiplex Kit Master Mix (Qiagen) and 2 µl of each indexed primer i5 and i7 (0.7 µM). Then, 2 µl of PCR1 product was added to each well. The PCR2 started by an initial denaturation step
of 95°C for 15 min, followed by eight cycles of denaturation at 94°C for 40 s, annealing at 55°C for 45 s, and extension at 72°C for 2 min, followed by a final extension step at 72°C for 10 min.
We included a negative control for extraction (NCext), a negative
control for PCR (NCPCR), and a negative control for indexing (NCindex) in each 96-well microplate. We performed three PCR technical rep-licates per sample on each DNA extract. For the guano samples, we
considered a sample positive for a particular taxon if at least two out of three replicates were positive, to overcome the stochasticity of the PCR in the detection of rare prey while reducing the number of putative false-positive results (i.e., one positive replicate out of three is considered a false-positive result; Alberdi et al., 2018).
We checked the homogeneity of amplifications between primer sets and for nonspecific amplification by electrophoresis using 3 µl of each PCR2 product on a 1.5% agarose gel. Then, PCR2 products
were pooled separately for each of the 12 primer sets and put on a low-melting agarose gel (1.25%) for excision. After electrophoresis, the excision step was used to eliminate primer dimers and nonspecific am-plifications. We used the PCR Clean-up Gel Extraction kit (Macherey-Nagel) to purify the excised bands. The 12 pools were quantified using the KAPA library quantification kit (KAPA Biosystems) taking into ac-count the different fragment lengths, normalized at 4nM, and pooled in equimolar concentrations before loading 14 pM and 5% of PhiX control on a MiSeq flowcell with a 500-cycle Reagent Kit v2 (Illumina). The mock communities and the guano samples were sequenced inde-pendently on two different Illumina runs.
2.2.4 | Bioinformatics and taxonomic assignments
First, we used a R preprocessing script (Sow et al., 2019) to merge paired-end sequences into contigs with FLASH v.1.2.11 (Magoč & Salzberg, 2011) and to trim primers with CUTADAPT v.1.9.1 (Martin, 2011). We then used the FROGS pipeline (“Find Rapidly OTU with Galaxy Solution”; Escudié et al., 2018) to create an abun-dance table for each variant. Briefly, this pipeline enabled us to (a) filter sequences by length (±20 bp from the expected length), (b) cluster the variants into operational taxonomic units (OTUs) using a maximum aggregation distance of one mutation with the SWARM algorithm (Mahé, Rognes, Quince, de Vargas, & Dunthorn, 2014), (c) remove chimeric variants using VSEARCH with de novo UCHIME method (Edgar, Haas, Clemente, Quince, & Knight, 2011; Rognes, Flouri, Nichols, Quince, & Mahé, 2016), and (d) filter by keeping only OTUs present in at least two PCR replicates.
Taxonomic assignments were carried out for each primer set, fol-lowing different procedures. We used the Sanger reference sequences produced to analyze mock community results (see above). This enabled us to identify the 33 genuine arthropod sequences in the two mock communities and the genuine bat sequences. The other sequences were excluded from subsequent analyses. With regard to guano sam-ples, we analyzed the 16S OTUs using BLASTN (Altschul, Gish, Miller, Myers, & Lipman, 1990) and the NCBI Nucleotide database (Benson, Karsch-Mizrachi, Lipman, Ostell, & Wheeler, 2008). Taxonomic assign-ments of COI OTUs were made using the NCBI BLAST+ automatic
F I G U R E 2 In silico evaluation of arthropod orders represented by at least 100 OTUs using PrimerMiner. (a) Primer set performance is
shown for each order using pie charts, with green and red colors representing success and failure, respectively, of in silico amplification. Success of amplification corresponded to PrimerMiner mean penalty score < 120 and amplification failure to a mean penalty score ≥ 120. (b) Boxplots of the median of PrimerMiner mean penalty scores over all arthropod orders and for each primer set, with mean values represented by a circle within boxplots. (c) Percentage of degeneracy level of each primer set
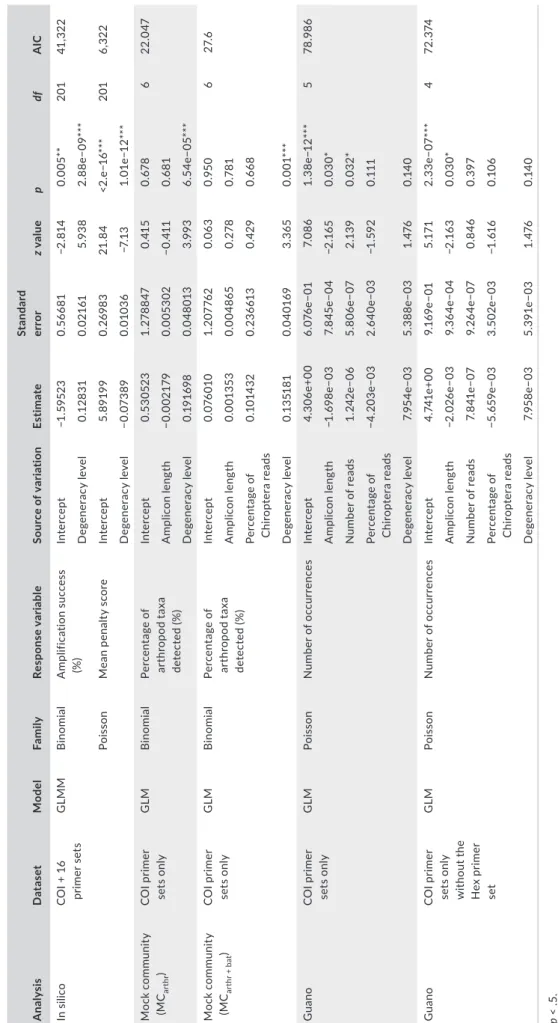
T A B LE 2 Ef fe ct o f t he p rim er s et c ha ra ct er is tic s o n t he i n s ili co a m pl ifi ca tio n s uc ce ss a nd m ea n p en al ty s co re , t he d et ec tio n o f m oc k c om m un ity t ax a, a nd t he d et ec tio n o f a rt hr op od oc cu rr en ce s i n g ua no s am pl es A nal ys is D at as et Mo de l Fa mil y Re sp on se v ar ia ble So ur ce o f v ar ia tio n Es tim at e St an da rd er ro r z value p df A IC In s ili co C O I + 1 6 pr im er s et s G LM M B in omi al A m plif ic at io n su cc es s (% ) Inte rc ep t −1 .59 52 3 0. 566 81 −2 .8 14 0.0 05 ** 201 41 ,3 22 D eg en er ac y l ev el 0.1 28 31 0.0 21 61 5.9 38 2. 88 e− 09 *** Po is so n M ea n p en al ty s co re Inte rc ep t 5. 89 19 9 0. 269 83 21 .8 4 <2 .e −1 6*** 201 6, 32 2 D eg en er ac y l ev el −0.0 73 89 0.0 10 36 −7 .1 3 1. 01 e− 12 *** M oc k c om m un ity (M Car thr ) C O I p rim er se ts o nl y G LM B in omi al Pe rc en ta ge o f ar th ro po d t ax a de te ct ed ( % ) Inte rc ep t 0. 53 052 3 1. 27 88 47 0. 41 5 0. 67 8 6 22 .0 47 A m pl ic on l en gt h −0.0 02 17 9 0.0 05 30 2 −0 .41 1 0. 681 D eg en er ac y l ev el 0. 19 16 98 0.0 48 01 3 3.9 93 6. 54 e− 05 *** M oc k c om m un ity (M Car th r + b at ) C O I p rim er se ts o nl y G LM B in omi al Pe rc en ta ge o f ar th ro po d t ax a de te ct ed ( % ) Inte rc ep t 0.0 76 01 0 1. 20 776 2 0.0 63 0.9 50 6 27. 6 A m pl ic on l en gt h 0.0 01 35 3 0.0 04 86 5 0. 27 8 0. 781 Pe rc en ta ge o f C hi ro pt er a re ad s 0. 10 14 32 0. 23 66 13 0. 42 9 0. 66 8 D eg en er ac y l ev el 0. 13 5181 0.0 40 16 9 3. 365 0. 00 1*** G uan o C O I p rim er se ts o nl y G LM Po is so n N um be r o f o cc ur re nc es Inte rc ep t 4. 30 6e +0 0 6. 076 e− 01 7. 08 6 1. 38 e− 12 *** 5 78 .9 86 A m pl ic on l en gt h −1 .6 98 e− 03 7. 84 5e −0 4 −2 .1 65 0.0 30* N um be r o f r ea ds 1. 24 2e −0 6 5. 80 6e −07 2.1 39 0.0 32 * Pe rc en ta ge o f C hi ro pt er a re ad s −4. 20 3e −0 3 2. 640e −0 3 −1 .5 92 0. 111 D eg en er ac y l ev el 7. 95 4e −0 3 5. 38 8e− 03 1. 476 0. 14 0 G uan o C O I p rim er se ts o nl y w ith ou t t he H ex p rim er set G LM Po is so n N um be r o f o cc ur re nc es Inte rc ep t 4. 74 1e +0 0 9. 16 9e −0 1 5. 17 1 2. 33 e− 07 *** 4 72 .3 74 A m pl ic on l en gt h −2. 02 6e −0 3 9. 36 4e −0 4 −2 .1 63 0.0 30* N um be r o f r ea ds 7. 84 1e −0 7 9. 26 4e −0 7 0. 84 6 0. 397 Pe rc en ta ge o f C hi ro pt er a re ad s −5 .6 59 e− 03 3. 50 2e −0 3 −1 .6 16 0.1 06 D eg en er ac y l ev el 7. 95 8e −0 3 5. 39 1e −0 3 1. 476 0. 14 0 *p < .5 . ** p < .0 1. *** p < .0 01 .
affiliation tool available in the FROGS pipeline, with the Public Record Barcode Database (data related to the BOLD database, http://v3.bolds ystems.org, accessed in February 2019, with maximum 1% of N).
2.3 | Statistical analyses
2.3.1 | In silico data
We tested the effect of the level of primer degeneracy on mean penalty score and on theoretical amplification success. We used a Poisson and a binomial generalized linear mixed model (GLMM), re-spectively, with the primer set and the order as random effects.
2.3.2 | Mock community data
We tested the effect of amplicon length, level of primer degeneracy, and percentage of bat reads on the percentage of arthropod taxa detected using a binomial generalized linear model (GLM).
2.3.3 | Guano sample data
We tested the effect of amplicon length, level of primer degeneracy, total number of reads, and percentage of bat reads on the number of arthropod occurrences using a Poisson GLM. We did not work on the number of OTUs but rather on taxa occurrence. This was preferred as it enabled us to take into account the frequency of detection of a particular taxon for each primer set, and hence to minimize the importance of rare taxa (i.e., those detected in a single sample). As such, we minimized artificial inflations of OTUs diversity.
Note that we did not include the 16S primer sets in the in vivo statistical analyses (mock communities and guano samples) because of confounding factors (e.g., smaller size of the 16S reference data-base compared to the COI datadata-base).
2.3.4 | Defining a strategy to determine the best
primer set(s) for the study
We developed a multicriteria table that included criteria for each step of primer set evaluation (in silico, mock community, and guano sam-ple analyses). We provided a score for each criterion with regard to the objectives and constraints of our future metabarcoding studies.
3 | RESULTS
3.1 | In silico evaluation
The in silico evaluation was performed on 21 arthropod orders (Figure 2). We recovered almost fifty times more sequences for the
COI (4,259,845 sequences) than for the 16S gene (83,651 sequences) using the BOLD and NCBI databases. Two orders, Dermaptera and Julida, and four orders, Archaeognatha, Dermaptera, Julida, and Mecoptera, were excluded from the COI and 16S analyses, respec-tively, using PrimerMiner due to their insufficient number of OTUs (<100).
The mean penalty scores and the theoretical amplification suc-cess varied strongly between primer sets and between arthropod or-ders (Figure 2). We found a significant negative effect of the level of primer degeneracy on the mean penalty score (GLMM, p = 1.01e−12) and a positive influence on the theoretical amplification success (GLMM, p = 2.88e−09) (Table 2). The highest mean penalty scores (>165) and lowest amplification success rates (mean < 50%) were observed for the primer sets exhibiting a lack of degeneracy (e.g., mlHCO, Lep1, Zeale, and Epp). For example, the mean penalty score of Epp primers was about 12 times higher than the score of its de-generate version Epp-degen.
3.2 | In vivo evaluation—Mock communities
3.2.1 | Sequencing results
DNA quality checks revealed that DNA was of high molecular weight and intact for all taxa considered, except for Hemiptera-1 (Uroleucon sp.) whose DNA was degraded. Homogeneous amplification be-tween primer sets was demonstrated by MC PCR product migra-tion on agarose gels. The MiSeq sequencing run produced a total of 3,100,343 reads for the two MCs analyzed in this study. Removing reads with unexpected lengths excluded up to 6.3% of the reads (Hex primer set), while removing chimeras excluded up to 4.67% of the reads (fwhFol primer set) and removing sequences not shared by at least two PCR replicates excluded up to 21.64% of the reads (mlHCO primer set). The remaining reads varied from 168,815 for Hex to 284,216 for Lep1.
Note that we kept only the sequences that exhibited 100% identity with the reference Sanger sequences. These sequences represented between 3.16% and 10.03% of the OTUs in the mock communities but between 76.23% and 98.42% of the reads de-pending on the primer set (mean over all primer sets and mock communities = 92.53%).
3.2.2 | Detection of bat DNA
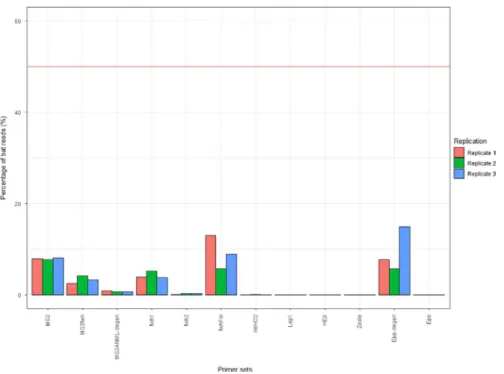
All primer sets amplified less bat DNA (up to 18.36% of the number of reads; replicate 2 of Epp-degen) than the expected 50% (as arthro-pod and bat DNA were in equimolar proportions in the MCarthr+bat;
Figure 3). Primers with a lack of degeneracy amplified only a few reads (Hex, mlHCO, and Epp; triplicate mean < 0.01%) or did not amplify any bat DNA at all (Zeale and Lep1). The degenerate primers fwh2 and MG2ANML-degen amplified <1% of bat reads and fwh1 and MG2fwh <5.2%. The best primer sets for the amplification of
bat DNA were Epp-degen (triplicate mean 10.17%), fwhFol (triplicate mean 7.53%), and MG2 (triplicate mean 7.43%).
3.2.3 | Detection of arthropod taxa
The percentage of arthropod taxa detected in MCs varied from 67% to 100% (see Figure 4 and Figure S1). In the mock commu-nity lacking bat DNA (MCarthr), MG2 was the only primer set that amplified all arthropod orders in triplicate. Five other primer sets (MG2fwh, MG2ANML-degen, fwh1, fwh2, and fwhFol) ampli-fied all arthropod orders; however, the taxa with degraded DNA (Uroleucon sp. Hemiptera-1) amplified only few reads in two repli-cates out of three. Hex was also among the best primer sets as it amplified all taxa except the degraded Hemiptera-1. Hemiptera-1 was misamplified by less than half of the primer sets (only one to three reads were recorded) and not amplified by the others. In ac-cordance with the in silico evaluation, mlHCO, Lep1, Zeale, and Epp failed to detect an important number of taxa, and Zeale and Lep1 were the less efficient primer sets with, respectively, eight and 14 taxa unamplified or misamplified (two replicates out of three). Our results revealed a positive effect of COI primer degeneracy levels on the percentage of detected taxa in MCarthr (GLM, p = 6.54e−05; Table 2) but no effect of the amplicon length (GLM, p = .681; Table 2). The influence of the degeneracy level is also illustrated by the two 16S primer sets: Epp misamplified or did not amplify five (MCarthr) and six taxa (MCarthr+bat), while its degenerated ver-sion Epp-degen misamplified or did not amplify only two taxa of the mock communities.
In the mock community containing bat DNA (MCarthr+bat), four
primer sets, MG2, MG2ANML-degen, fwh2, and fwhFol, amplified all taxa in triplicate (Figure S1). The primer set fwh1 performed with reduced efficiency as it did not amplify Hemiptera-1 at all. The two
primer sets Zeale and Lep1 were again the least efficient with eight and 13 taxa that were not amplified or misamplified, respectively. Our results revealed a positive effect of the level of COI primer degener-acy on the percentage of taxa detected in MCarthr+bat (GLM, p = .001;
Table 2). We found no effect of amplicon length (GLM, p = .781; Table 2) or of the percentage of bat reads (GLM, p = .668; Table 2).
In both MCs, the primer sets that detected the smallest num-ber of taxa (Zeale, Lep1, mlHCO, and Epp) also exhibited the largest variation of read numbers between arthropod taxa and between the observed and expected number of reads (Figure S1).
3.2.4 | Taxonomic identification of arthropod taxa
All COI primer sets led to identical identifications of arthropod taxa and exhibited only slight differences in taxonomic resolution. In con-trast, the COI and 16S primer sets often led to different identifications and levels of taxonomic resolution. For example, identical identifica-tions and resoluidentifica-tions were found for only eight taxa among the 33 ar-thropod taxa included in the MCs. The 16S sequences always reached a lower level of taxonomic resolution. The only exceptions were (a) Lepidoptera-2 that was identified at the species level (Melitaea deione) by the 16S sequences and at the genus level by the COI sequences, and (b) Psocoptera-2 that was identified at the genus level (Myopsocus sp.) by the 16S sequences and not identified by the COI sequences.
3.3 | In vivo evaluation—Guano samples
3.3.1 | PCR verification and sequencing results
DNA amplification was relatively homogeneous between primer sets and pellet samples, except for Hex and Lep1. These both had
F I G U R E 3 Percentage of bat reads for
each primer set in the mock community MCarthr+bat. The red line indicates the
expected value for percentage of bat reads (50%, corresponding to the DNA quantity in the DNA pool)
amplification failures and nonspecific product amplifications. MiSeq sequencing produced a total of 9,190,350 reads. Removing reads with unexpected lengths excluded 0.52% (Epp-degen) to 10.57% (Lep1) of the reads (and exceptionally 40.16% of the reads for Hex). Removing chimeras excluded 0.1% (Epp-degen) to 6.42% (mlHCO) of the reads. Removing reads not shared by at least two PCR replicates excluded 0.3% (Epp-degen) to 16.17% (Hex) of the reads. Finally, the remaining reads varied from 552,914 (Epp-degen primer set) to 808,594 (Zeale primer set), with the primer set Hex remaining an outlier (368,121 reads).
3.3.2 | Detection of bat taxa
Two bat species were identified: Rhinolophus ferrumequinum and
Myotis emarginatus. Rhinolophus ferrumequinum was predominant in
ten samples (mean percentage of reads > 98.9% of all the Chiroptera
reads), M. emarginatus was predominant in eleven samples (mean percentage of reads > 99.2%), and both species were found in high mixed proportions in one sample (mean percentage of R.
ferrum-equinum reads = 84.2% and mean percentage of M. emarginatus
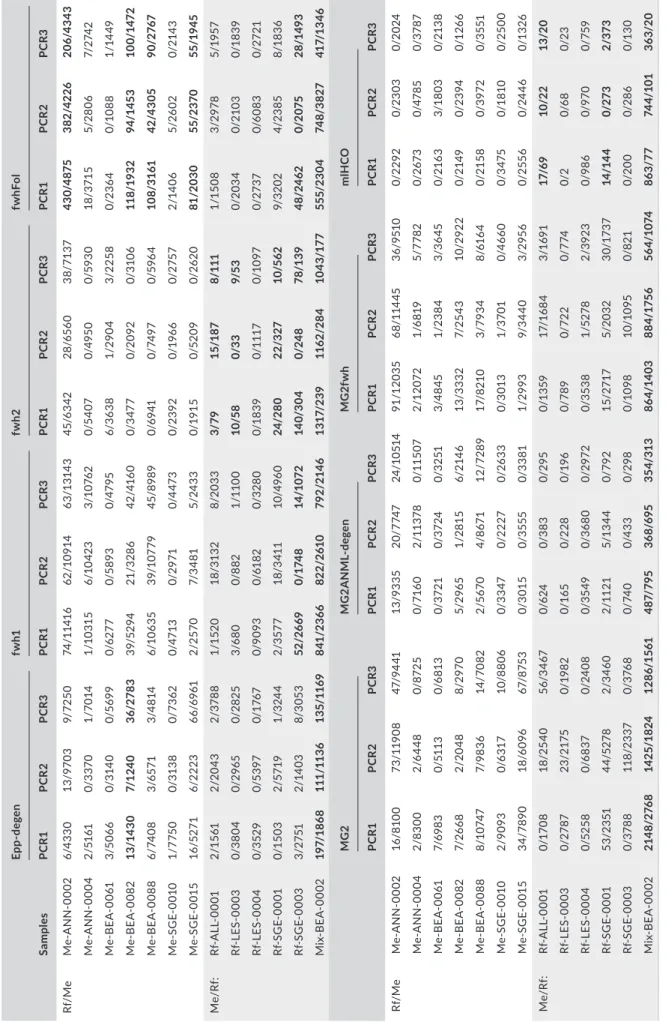
reads = 15.80%). This sample was discarded from further analyses. For eight primer sets and 12 samples, some reads of the wrong spe-cies (mean number of reads = 15, median = 2 reads; true spespe-cies: mean = 3,760 reads, median = 2,961 reads) were also observed but in highly unbalanced proportions and only in some of the PCR rep-licates (55%), indicating very slight traces of cross-contamination between pellets from different bat species in the colonies (contami-nation median number of reads < 0.05%; Table 3). Traces of DNA from another bat species, Myotis myotis, were also found in three samples by four primer sets (mean of 0.0001% of bat reads; Epp-degen, fwh1, MG2, and MG2fwh). Moreover, some primer sets did not amplify any of the two bat species (Hex) or amplified only one bat species (Zeale, Lep1), whereas others amplified both bat species
F I G U R E 4 Representation on a log-scale of the number of reads gathered for each genuine arthropod sequence with the MG2 and Zeale
COI primer sets, and Epp and Epp-degen 16S primer sets, and for the three PCR technical replicates of the mock community MCarthr. The blue line indicates the expected number of reads. Each dot represents a technical replicate. Yellow bars emphasize situations where only one or two PCR replicates out of three, generated reads for the taxon in question. Red bars emphasize situations where none of the PCR replicate generated reads for the taxon in question
T A B LE 3 N um be r o f r ea ds o f t he p ut at iv el y w ro ng ( nu m be r a t t he l ef t) a nd r ig ht ( nu m be r a t t he r ig ht ) b at s pe ci es i n s am pl es s ho w in g t ra ce s o f r ea ds o f t he w ro ng s pe ci es . R at io s > 1% a re w rit te n i n b ol d Sample s Epp -de gen fw h1 fw h2 fw hF ol PC R1 PCR 2 PC R3 PC R1 PCR 2 PC R3 PC R1 PCR 2 PC R3 PC R1 PCR 2 PC R3 Rf/ M e M e-A N N -0 002 6/4 33 0 13 /97 03 9/ 72 50 74 /1 14 16 62 /1 09 14 63 /1 314 3 45 /6 34 2 28 /6 56 0 38 /71 37 43 0/4 87 5 38 2/4 22 6 20 6/ 43 43 M e-A N N -000 4 2/ 51 61 0/ 33 70 1/ 70 14 1/1 03 15 6/ 10 42 3 3/ 10 76 2 0/5 40 7 0/4 95 0 0/5 93 0 18 /3 71 5 5/ 28 06 7/ 27 42 M e-B EA -0 061 3/5 06 6 0/ 314 0 0/ 569 9 0/ 627 7 0/5 89 3 0/4 79 5 6/3 63 8 1/ 29 04 3/ 22 58 0/ 23 64 0/1 08 8 1/ 14 49 M e-B EA-00 82 13 /1 43 0 7/ 12 40 36 /2 78 3 39/ 52 94 21 /3 28 6 42 /4 16 0 0/ 347 7 0/ 20 92 0/ 310 6 11 8/ 19 32 94 /1 45 3 10 0/1 47 2 M e-B EA-00 88 6/ 74 08 3/ 657 1 3/4 81 4 6/ 1063 5 39/ 10 77 9 45 /89 89 0/ 69 41 0/ 7497 0/ 596 4 10 8/ 31 61 42 /4 30 5 90 /2 76 7 M e-S G E-00 10 1/ 77 50 0/ 31 38 0/ 73 62 0/4 71 3 0/ 29 71 0/4 47 3 0/ 23 92 0/ 196 6 0/ 275 7 2/ 14 06 5/ 26 02 0/ 214 3 M e-S G E-00 15 16 /5 27 1 6/ 222 3 66 /696 1 2/ 25 70 7/ 34 81 5/ 24 33 0/ 19 15 0/5 20 9 0/ 26 20 81 /2 03 0 55/ 23 70 55/ 19 45 M e/R f: Rf -A LL -000 1 2/ 15 61 2/ 20 43 2/3 78 8 1/1 52 0 18/ 31 32 8/ 20 33 3/ 79 15/ 18 7 8/ 111 1/1 50 8 3/ 29 78 5/ 19 57 Rf -L ES -000 3 0/ 38 04 0/ 296 5 0/ 282 5 3/6 80 0/ 88 2 1/ 11 00 10 /5 8 0/3 3 9/ 53 0/ 20 34 0/ 210 3 0/1 83 9 Rf -L ES -000 4 0/ 352 9 0/5 39 7 0/17 67 0/ 90 93 0/6 18 2 0/ 32 80 0/1 83 9 0/ 111 7 0/1 09 7 0/ 27 37 0/6 08 3 0/ 27 21 Rf -S G E-000 1 0/1 50 3 2/ 57 19 1/ 324 4 2/3 57 7 18 /3 41 1 10/ 496 0 24 /2 80 22 /3 27 10 /5 62 9/ 3202 4/ 23 85 8/1 83 6 Rf -S G E-000 3 3/ 27 51 2/ 14 03 8/3 05 3 52 /2 66 9 0/ 174 8 14 /1 07 2 14 0/ 30 4 0/2 48 78 /1 39 48 /2 46 2 0/ 20 75 28 /1 49 3 M ix -B EA -0 002 19 7/ 18 68 111 /11 36 13 5/ 11 69 841 /2 36 6 82 2/ 261 0 79 2/ 214 6 131 7/ 23 9 11 62 /2 84 10 43 /1 77 555 /2 30 4 74 8/ 38 27 41 7/ 13 46 M G2 M G 2A NM L-de gen M G2 fw h m lH CO PC R1 PCR 2 PC R3 PC R1 PCR 2 PC R3 PC R1 PCR 2 PC R3 PC R1 PCR 2 PC R3 Rf/ M e M e-A N N -0 002 16 /8 10 0 73 /1 19 08 47/ 94 41 13 /9 33 5 20 /77 47 24 /1 051 4 91/ 12 03 5 68 /1 14 45 36 /9 51 0 0/ 22 92 0/ 23 03 0/ 202 4 M e-A N N -000 4 2/8 30 0 2/6 44 8 0/ 87 25 0/ 71 60 2/ 11 37 8 0/ 11 50 7 2/1 20 72 1/6 81 9 5/ 77 82 0/ 267 3 0/4 78 5 0/ 37 87 M e-B EA -0 061 7/ 69 83 0/ 51 13 0/6 81 3 0/ 37 21 0/ 37 24 0/ 32 51 3/4 84 5 1/ 23 84 3/3 64 5 0/ 216 3 3/1 80 3 0/ 21 38 M e-B EA-00 82 7/ 26 68 2/ 20 48 8/ 297 0 5/ 29 65 1/ 28 15 6/ 214 6 13 /333 2 7/ 25 43 10 /2 92 2 0/ 214 9 0/ 23 94 0/1 26 6 M e-B EA-00 88 8/1 07 47 7/ 98 36 14 /7 08 2 2/5 67 0 4/ 867 1 12 /72 89 17/ 82 10 3/ 79 34 8/6 16 4 0/ 21 58 0/ 39 72 0/ 35 51 M e-S G E-00 10 2/9 09 3 0/6 31 7 10 /8 80 6 0/ 33 47 0/ 222 7 0/ 26 33 0/ 30 13 1/3 70 1 0/4 66 0 0/ 347 5 0/ 181 0 0/ 25 00 M e-S G E-00 15 34/ 78 90 18 /6 09 6 67/ 87 53 0/ 30 15 0/ 3555 0/ 33 81 1/ 29 93 9/ 34 40 3/ 29 56 0/ 255 6 0/ 24 46 0/1 32 6 M e/R f: Rf -A LL -000 1 0/17 08 18 /2 54 0 56 /3 467 0/6 24 0/ 38 3 0/ 29 5 0/1 35 9 17 /1 68 4 3/1 69 1 17/ 69 10 /2 2 13/ 20 Rf -L ES -000 3 0/ 27 87 23 /2 17 5 0/ 19 82 0/1 65 0/ 22 8 0/ 196 0/ 78 9 0/ 72 2 0/ 77 4 0/ 2 0/6 8 0/ 23 Rf -L ES -000 4 0/5 25 8 0/ 683 7 0/ 24 08 0/ 35 49 0/ 36 80 0/ 29 72 0/ 35 38 1/5 27 8 2/ 392 3 0/ 98 6 0/97 0 0/ 759 Rf -S G E-000 1 53 /2 35 1 44 /5 27 8 2/3 46 0 2/ 11 21 5/1 34 4 0/ 79 2 15 /2 717 5/ 20 32 30 /17 37 14 /14 4 0/2 73 2/3 73 Rf -S G E-000 3 0/ 37 88 11 8/ 23 37 0/ 376 8 0/ 74 0 0/4 33 0/ 29 8 0/1 09 8 10 /10 95 0/ 82 1 0/ 20 0 0/ 28 6 0/1 30 M ix -B EA -0 002 21 48 /27 68 14 25/ 18 24 12 86 /1 561 48 7/ 79 5 36 8/6 95 35 4/ 313 86 4/1 40 3 88 4/1 75 6 56 4/ 10 74 86 3/77 74 4/ 10 1 36 3/ 20 N ote : R f = R . f err ume qu in um ; M e = M . em ar gi na tu s.
(Figure 5). However, the percentage of bat reads in R. ferrumequinum pellets was always lower than in M. emarginatus pellets, whichever primer set was considered (Figure 5). Finally, bat reads outnumbered arthropod reads for eight primer sets out of 12 in pellet samples from M. emarginatus, and for the 16S Epp-degen primer set (Epp-degen) in R. ferrumequinum pellet samples.
3.3.3 | Detection of arthropod taxa
We found a negative effect of the amplicon length (p = .030) and a positive effect of the number of reads (p = .032) on the number of occurrences detected (Table 2). However, the number of reads was not significant (p = .397) when the primer set with the lowest num-ber of reads (Hex) was excluded. The degeneracy level of the primers and the percentage of bat reads had no effect on the number of oc-currences detected (p = .140 and p = .111, respectively).
Taken together, our results showed that the 12 primer sets allowed the identification of 96 taxa (from 10 orders, 32 families, 56 genera, and 60 species) in R. ferrumequinum samples and 109 taxa (from 11 orders, 34 families, 63 genera, and 65 species) in M. emarginatus sam-ples. The 16S primer sets revealed about 30% and 20% of the occur-rences in R. ferrumequinum and M. emarginatus samples, respectively (Figure 6a). Six and four of the ten COI primer sets allowed for the detection of at least 50% of the occurrences of prey items in R.
ferru-mequinum and M. emarginatus samples, respectively (Figure 6a). The
other COI primer sets revealed between 31.2% and 49.5% of the total number of occurrences. The Zeale primer set revealed the highest number of arthropod occurrences for both bat species (N = 68, 62% of R. ferrumequinum occurrences; and N = 68, 71% of M. emarginatus occurrences); however, this primer set was unable to amplify and iden-tify bat species. The optimal primer set that amplified bat DNA and provided the highest number of arthropod occurrences for both bat species was fwh1 (number of occurrence(R. ferrumequinum) = 60; number
of occurrence(M. emarginatus) = 62) although MG2 was slightly better than
fwh1 for R. ferrumequinum samples (number of occurrence(R.
ferrumequi-num) = 63). The combination of two to four primer sets (Epp-degen,
fwh1, MG2, and Zeale) allowed for a gain of nine to 18 occurrences in
R. ferrumequinum samples (up to 89.58% of the occurrences detected
by combining all primer sets) and of 20–25 occurrences in M.
emargin-atus samples (up to 85.32% of the occurrences detected by combining
all primer sets) (Figure 6a). However, about one-third of all the occur-rences corresponded to potentially unreliable amplifications (amplifi-cations in two PCRs out of three and/or amplifi(amplifi-cations by only one primer set) associated with a low number of reads (Figures 6b and 7). Indeed, we observed that 79.3% (M. emarginatus) and 86.7% (R.
fer-rumequinum) of the occurrences found by only one of the primer sets
out of the 12 were not reproducible across the three PCR replicates (Figure 7). In R. ferrumequinum samples, these potentially unreliable occurrences represented a very low number of reads whichever primer set was considered (median < 39 reads). In M. emarginatus samples, these potentially unreliable occurrences also represented a very low number of reads ranging from 5 to 575 (exceptionally 4,186 for Zeale) for all primer sets (Figure 6b). The maximum number of reads for the potentially unreliable occurrences was lower in R. ferrumequinum than in M. emarginatus samples (591 reads, Zeale; Figure 6b).
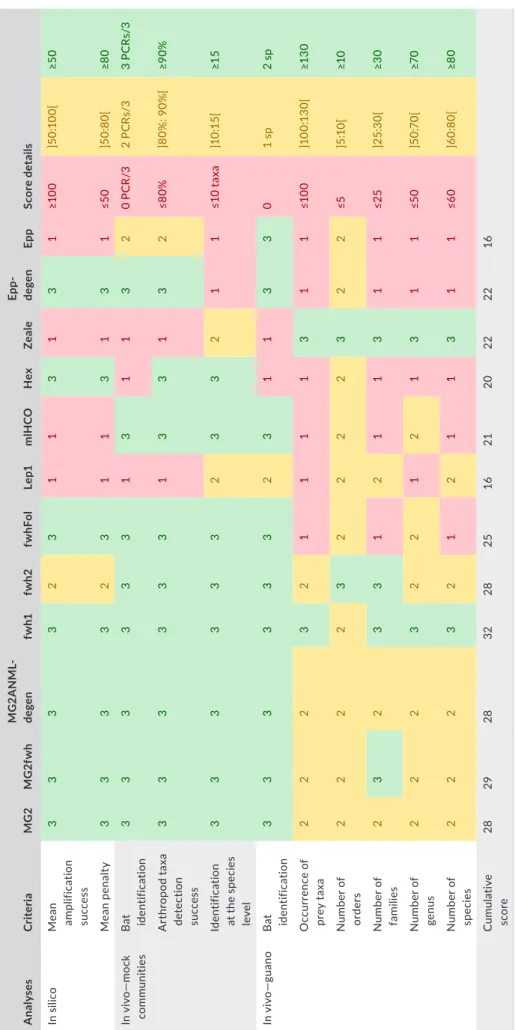
3.4 | Multicriteria evaluation of primer sets
Based on the scores of mean penalty and theoretical amplification success provided by PrimerMiner, we identified seven appropriate primer sets (MG2, MG2fwh, MG2ANML-degen, fwh1, fwhFol, Hex, and Epp-degen), one intermediate (fwh2), and four inefficient primer sets (Lep1, mlHCO, Zeale, and Epp) (Table 4). The number of detected taxa (bat and arthropod) and the taxonomic resolution of the latter indicated that seven primer sets were equivalent considering mock community results: MG2, MG2fwh, MG2ANML-degen, fwh1, fwh2,
F I G U R E 5 Percentage of bat reads in the guano samples from Myotis emarginatus in red (N = 11) and from Rhinolophus ferrumequinum in
fwhFol, and mlHCO (Table 3). Considering guano results, Zeale and fwh1 had the best scores. However, Zeale did not amplify bat DNA, which is critical when studying environmental DNA from feces that can potentially originate from different predator species. Overall, the best primer set for our study was therefore fwh1 (Table 4).
4 | DISCUSSION
During the most recent decade, eDNA metabarcoding has proven to be a promising approach for characterizing biodiversity in a broad array of contexts (Bohmann et al., 2014). The accuracy and
completeness of metabarcoding results are critical from a funda-mental point of view, and because these data could potentially be used to inform environmental management strategies. Previous me-tabarcoding studies highlighted how the choice of primer sets may influence the detection of particular arthropod species in diet analy-ses, and in turn the interpretation of trophic ecology (e.g., Esnaola et al., 2018).
4.1 | The need for primers that identify predator
species and discard contaminated samples
The need for identifying predators in insectivorous diet studies strongly depends on the sampling scheme and on the ecology of the targeted organisms. Such identification is especially important when using environmental samples, such as fecal samples, as it en-sures that samples belong to the species of interest and it eliminates erroneous assignation of prey (Ware et al., 2019). For example, the metabarcoding study performed by Forin-Wiart et al. (2018) on cat fecal samples revealed that 2.4% of these belonged to another predator species despite a preselection of samples using qPCR screening. Similarly, Biffi et al. (2017) sequenced 560 feces assumed to belong to the Pyrenean Desman. They showed that, in fact, 170 samples belonged to 25 other predator species (birds and mammals). In the particular case of insectivorous bats, the identification of bat species from guano is critical when guano is collected in roosts,
especially when bat colonies are known to be mixed. It is poten-tially less important when guano is retrieved from trapped bats, or from monospecific bat colonies. However, even colonies supposed to be monospecific can be shared by cryptic bat species (Filippi-Codaccioni et al., 2018) or other insectivorous species (e.g., birds). Furthermore, we have shown that some of the guano sampled in the roosts of mixed colonies (R. ferrumequinum/M. emarginatus) was contaminated with excreta belonging to other bat species, including
M. myotis, for which a few individuals were also known to be present
in the studied colony. Hence, future diet analyses should allow for the simultaneous identification of bat species and their prey, to re-veal the presence of unexpected species in the roosts studied, and to discard guano that would be contaminated by the DNA of multiple predators. It is thus particularly important to ensure that primer sets are able to identify all bat species potentially present in the roosts. Here, we have shown that some primer sets did not amplify bat spe-cies at all and that others could provide bat identification only for some of the bat species of interest (one out of three). We performed a posteriori in silico analyses to test the efficiency of our primer sets on four bat families (Molossidae, Mormoopidae, Rhinolophidae, and Vespertilionidae). Using this larger spectrum of Chiropteran families and species, our results tended to confirm the contrasting pattern of bat amplification observed between our primer sets, albeit with low power due to a low numbers of OTUs (see Appendix S1).
The simultaneous identification of predator and prey is often avoided in diet analyses as an elevated predator amplification is
F I G U R E 6 Occurrences of arthropod prey taxa detected in guano samples for each primer set and for four combinations of primer sets.
Dashed lines separate the primer sets from the combinations of primer sets. N is the number of guano samples analyzed for each bat species. (a) Occurrences of arthropod orders. Black lines represent 50% of the occurrences (55 occurrences for Myotis emarginatus samples and 48 for Rhinolophus ferrumequinum samples). (b) Comparison of the number of occurrences of arthropod orders considering the reliability of the technical PCR replicates (dark green = occurrences validated in three PCRs out of three; light green = occurrences validated in two PCRs out of three) for each primer set on the one hand and for two to four primer sets in combination on the other hand. The latter include the two 16S primer sets and the COI primer sets that provided the best results in terms of occurrence of arthropod orders. Dashed lines separate the primer sets from the combinations of primer sets. Numbers correspond to the number of reads gathered for each class of occurrence validation (three PCRs out of three vs two PCRs out of three)
F I G U R E 7 Reliability of the occurrences of prey taxa in Myotis emarginatus samples (N = 11) and Rhinolophus ferrumequinum (N = 10).
The occurrences are grouped by bat species and ordered by level of reliability according to the repeatability between primer sets and PCR replicates: (a) not shared between the 12 primer sets (i.e., observed with only 1 of the 12 primer sets), (b) shared by at least one COI primer set and one 16S primer set, or (c) shared by at least two COI primer sets. Number of positive PCR replicates: “2” (light green) = occurrence in two PCRs out of three; and “3” (green) = occurrence in three PCRs out of three
T A B LE 4 M ul tic rit er ia t ab le i nd ic at in g t he s co re o f e ac h p rim er s et f or t he t hr ee a ss es sm en t s te ps p er fo rm ed A nal ys es Cri te ria M G2 M G2 fw h M G 2A N ML -de gen fw h1 fw h2 fw hF ol Le p1 m lH CO H ex Zeale Ep p-de gen Ep p Sc or e de tail s In s ili co M ea n am plif ic at io n su cc es s 3 3 3 3 2 3 1 1 3 1 3 1 ≥1 00 ]5 0:1 00 [ ≥5 0 M ea n p en al ty 3 3 3 3 2 3 1 1 3 1 3 1 ≤5 0 ]5 0: 80 [ ≥8 0 In v iv o— m oc k co m m unit ie s B at iden tif ic at io n 3 3 3 3 3 3 1 3 1 1 3 2 0 P C R /3 2 P C Rs /3 3 P C Rs /3 A rt hr op od t ax a de te ct io n su cc es s 3 3 3 3 3 3 1 3 3 1 3 2 ≤8 0% ]8 0% : 9 0% [ ≥9 0% Iden tif ic at io n at t he s pe ci es le ve l 3 3 3 3 3 3 2 3 3 2 1 1 ≤1 0 t ax a ]1 0:1 5[ ≥1 5 In v iv o— gu ano B at iden tif ic at io n 3 3 3 3 3 3 2 3 1 1 3 3 0 1 s p 2 s p O cc ur re nc e o f pr ey t ax a 2 2 2 3 2 1 1 1 1 3 1 1 ≤1 00 ]1 00 :1 30[ ≥1 30 N um be r o f or der s 2 2 2 2 3 2 2 2 2 3 2 2 ≤5 ]5 :1 0[ ≥1 0 N um be r o f fa m ilie s 2 3 2 3 3 1 2 1 1 3 1 1 ≤2 5 ]2 5: 30[ ≥3 0 N um be r o f ge nu s 2 2 2 3 2 2 1 2 1 3 1 1 ≤5 0 ]5 0:7 0[ ≥7 0 N um be r o f sp ec ies 2 2 2 3 2 1 2 1 1 3 1 1 ≤6 0 ]6 0: 80 [ ≥8 0 C um ula tiv e sc or e 28 29 28 32 28 25 16 21 20 22 22 16 N ote : S co re s r an ge f ro m t he l es s e ff ic ie nt ( “1 ” r ep re se nt ed i n r ed ) t o t he m os t e ff ic ie nt ( “3 ” r ep re se nt ed i n g re en ).
expected to dampen that of prey (Pompanon et al., 2012; Vestheim & Jarman, 2008). Other approaches used to be applied to ensure that the samples belong to the relevant species, including a sepa-rate diagnostic PCR that is specific to the expected species, and/or Sanger sequencing that only reveals the major DNA sequence of the sample (Bohmann et al., 2011; Forin-Wiart et al., 2018). These al-ternatives add a supplementary step to the metabarcoding process, thereby increasing the time and financial cost of the analyses. Most importantly, they do not reveal the presence of nontargeted preda-tor species, or the rate of between-species contamination of sam-ples. As such, they do not facilitate the rejection of contaminated samples. In this study, we have shown that the simultaneous pred-ator amplification by metabarcoding does not necessarily lead to a drop in prey detection. Our results revealed that there is no effect of the percentage of bat reads on the percentage of arthropod taxa detected in mock communities, nor on the number of arthropod oc-currences in guano samples. This corroborates the results of Galan et al. (2018) which showed well-balanced proportions of reads for 16 bat species and their prey using a previous version of the MG2 primer set used here. We therefore recommend the simultaneous identification of predator species when working on environmental fecal samples.
4.2 | Choosing between the “16S + COI” and
“COI-alone” strategies
In this study, we compared primers designed from two mitochon-drial genes that are frequently used in eDNA metabarcoding stud-ies of animals (Deagle et al., 2014): the COI and 16S genes. Our results showed that the 16S primer sets were always less efficient and had lower levels of taxonomic resolution than most of the COI primer sets tested. This was surprising, as, for example, the 16S Epp-degen was identified as one of the best primer sets from the in silico analysis. Moreover we expected a high amplification success for this primer set due to its short amplicon length and high level of degeneration. In consequence, it is likely that the poor perfor-mance of the 16S primers revealed in the guano analyses is due to the paucity of reference sequences in the 16S database; an issue which has been emphasized in previous studies (Clarke et al., 2014; Elbrecht et al., 2016; Marquina et al., 2019). This difference in di-versity between COI and 16S reference databases could explain the differences in the number of taxa which could be assigned to genera or species. Lack of reference sequences could also bias re-sults when analyzing short-length amplicons. Indeed, as there are less reference sequences, the risk of obtaining an identification with strong confidence levels for the wrong taxa is potentially higher. For example, the mock community analyses showed that Lepidoptera-2 was identified to the species level by the 16S sequences (only one species Melitaea deione was available in the database) and to the genus level by the COI sequences because five different Melitaea species occurred in the database with identical similarities to the query sequence. Also, Psocoptera-2 was identified to the genus
level (Myopsocus sp.) by the 16S sequences and not identified by the COI sequences because none of the 43 Myopsocus vouchers with 100% identity to our sequences were identified to the species level in the Bold Species Level Barcode Records database. Moreover, this lack of reference sequences also increases the possibility that 16S affiliations are different from COI ones, therefore leading to a false increase in species richness when combining both genes, as it was observed in this study for mock community analyses (Trichoptera-1 identified as Stenophylax vibex for COI primer sets and Anabolia
bi-maculata for 16S primer sets). Therefore, the choice of the marker
in metabarcoding studies should be strongly guided by the compre-hensiveness of the reference databases available. We advocate for the use of the COI gene in animal metabarcoding studies because of its extensive database. However the 16S gene can be used if a sequence database of local species of interest is specifically created (Elbrecht et al., 2016).
4.3 | How many COI primer sets should be used?
To counter the negative effects of primer biases, two main strate-gies have recently been proposed considering the COI gene. Corse et al. (2019) advocated for the use of multiple primer sets as a so-lution to describe species diversity in fine detail, to reveal greater diversity, and to decrease false-negative results. However, their in silico analysis showed that the three primer sets considered were not degenerate enough to correctly amplify a large spectrum of prey. Nevertheless, the negative effects of primer biases can be re-duced by incorporating primer degeneracy and by carefully choos-ing primer sets suited for the targeted ecosystems and taxonomic groups of interest (Elbrecht et al., 2019). In our study, no primer set alone was able to detect all arthropod occurrences in the guano samples. This was also the case for the very recent primer set com-parison of Elbrecht et al. (2019) based on a Malaise trap capture. At first glance, our results showed that combining up to four primer sets allowed for a gain of between 8.5% (Zeale + fwh1) and 17% (Zeale + fwh1 + MG2 + Epp-degen) of arthropod occurrences in
R. ferrumequinum samples and between 20.8% (Zeale + fwh1) and
26% (Zeale + fwh1 + MG2 + Epp-degen) of arthropod occurrences in M. emarginatus samples. We might first hypothesize that this gain might at least partly result from the increased number of technical replicates associated with the combination of primer sets, indepen-dently of the primer sets' characteristics or the taxonomic origin of the prey. This hypothesis is reinforced by the gain in mainly less repeatable occurrences (between primer sets and PCR replicates) which are based on a low number of reads when combining several primer sets (see light green bar in Figure 6). It would thus be interest-ing to experimentally test the hypothesis of the effect of the number of PCR replicates on prey detection. Alternatively, our results could advocate for the use of multiple primers. Deciphering between the “one-locus” versus “multilocus” strategies should hence rely on the trade-off between the completeness of the results gathered on the one hand and the costs of combining several primers on the other.