Aut omatic all yg ener at ed rough PDF by Pr oo fCheck fr om Ri ver Valle yT ec hnologies Lt d
Hamida Bouhenni
1/ Hadjer Daoudi
1/ Haidar Djemai
2,3,4/ Philippe Noirez
2,3,4/ Abdelkader Rouabah
1/ Damien Vitiello
2,4,5,a/ Leila Rouabah
6,aRelationships between metabolic profile,
hypertension and uric acid with cardiometabolic
risk in adolescents with abdominal obesity:
impact of geodemographic factors on the
prevalence of abdominal obesity
1Laboratory of Molecular and Cellular Biology, Faculty of Natural Sciences and Life Sciences, Mentouri Brothers University,
Constantine, Algeria
2IRMES – Institute for Research in Biomedecine and Epidemiology of Sport, Paris, France, E-mail:
damien.vitiello@parisdescartes.fr
3EA 7329, Paris Descartes University, Sorbonne Paris Cité, Paris, France
4National Institute of Sport, Expertise and Performance – INSEP, Paris, France, E-mail: damien.vitiello@parisdescartes.fr 5EA 7329, Paris Descartes University, School of Sport Sciences, 1 Lacretelle street, 75015, Paris, France, Phone: +331176533402,
E-mail: damien.vitiello@parisdescartes.fr
6Laboratory of Molecular and Cellular Biology, Faculty of Natural Sciences and Life Sciences, Mentouri Brothers University, 1
Ain El bey street, 25000, Constantine, Algeria, Phone: +213777065109, E-mail: leilarouabah27@yahoo.fr
Abstract:
Background: Association of hyperuricemia, dyslipidemia and high blood pressure (BP) among adolescents
with high waist-to-height ratio (WHtR) remains not fully addressed and could represent a new way to diagnose adolescents early with cardiometabolic risk.
Objective: We aimed to determine abdominal obesity (AO) prevalence and investigate relations between AO,
uric acid (UA), lipid profiles, BP and geographical patterns in adolescents.
Subjects: 577 and 204 Algerian students aged between 10 and 19 years were included in our epidemiological
and biochemical studies, respectively.
Methods: Height, weight, waist circumference (Wc) and hip circumferences, body mass index (BMI) and BP
were measured. Fasting blood sampling was performed to measure glycemia, lipid profile, uricemia, insuline-mia and leptineinsuline-mia. The WHtR ≥0.50 was applied for the diagnosis of AO and geodemographics was evaluated.
Results: The prevalence of AO was 12.13% among all students, 19.17% and 16.39% among students living
in urban and plain areas, respectively. The risk of AO may be reduced in rural and mountainous areas. Lipid parameters, UA, insulin and leptin serum concentrations were significantly increased in adolescents with WHtR ≥0.50 compared to those with WHtR <0.50. Cardiometabolic risk was increased with WHtR ≥0.50 and BMI >26. Means of BMI, Wc, BP, and lipid parameters were significantly increased in the fourth quartiles compared to the first quartile of UA.
Conclusion: Urban areas and plains represent factors contributing to AO and WHtR ≥0.50 may be used as a
cut-off point to define risks of high BP, lipid abnormalities and UA serum level in Algerian adolescents.
Keywords: abdominal obesity, adolescents, cardiometabolic risk, uric acid DOI: 10.1515/ijamh-2017-0107
Received: June 27, 2017; Accepted: August 25, 2017
Introduction
General obesity and abdominal obesity (AO) are characterized by an excess of adipose tissue, which is directly related to several risk factors of chronic diseases like changes in lipid profile, increased blood pressure and
Damien Vitiello, Leila Rouabah are the corresponding authors.
aDamien Vitiello and Leila Rouabah contributed equally to this work.
Aut omatic all yg ener at ed rough PDF by Pr oo fCheck fr om Ri ver Valle yT ec hnologies Lt d
hyperinsulinemia [1]. Predominant abdominal fat has been shown to be associated with an increased risk of cardiovascular diseases (CVD) in adolescents [2].
Among the methods used for the diagnosis of AO, the waist circumference (Wc) is an anthropometric indi-cator related to adipose tissue and has a strong correlation with the body mass index (BMI) and with visceral fat [3]. The waist-to-hip ratio (WHR) is an indicator used to identify the type of body fat distribution and val-ues above 1.00 for men and 0.85 for women indicate a distribution of the android type [3]. The waist-to-height ratio (WHtR) has been recently used as criteria of AO [4]. In addition, it has been shown that those with an elevated WHtR might develop cardiometabolic diseases [5]. Thus, it might be included in the routine screening and assessment of overweight and obesity in children and adolescents. Finally, there are no standard methods to evaluate the growth and corpulence (e.g. Wc) of children and adolescents in Algeria [6] where AO and its complications represent a serious health concern. Therefore, more attention should be paid to AO in children and adolescents.
The prevalence of obesity in Algerian girls and boys were, respectively, 12.8% vs. 13.4% in urban area of the north-eastern region of Algeria [7], 3.4% vs. 3.6% in urban areas and 3.4% vs. 1.3% in rural areas [8], 4.9% vs. 5.8% around the Alger region [9] according to World Health Organization (WHO) reference, 2007.
Uric acid (UA) is the product of dietary and endogenous purine metabolism. Its serum concentration has been shown to be higher in overweight and obese individuals than in normal weight peers and associated with greater Wc, metabolic syndrome (MS), hypertension (HT) and impaired flow mediated dilation in asymp-tomatic prepubertal children [10]. In adults, it has been demonstrated that high serum levels of low-density lipoprotein-cholesterol (LDL-c), triglycerides (TG), total cholesterol (TC), apolipoprotein-B levels and high ra-tios of TG to high-density lipoprotein-cholesterol (HDL-c) (TG/HDL-c) and apolipoprotein-B to apolipoprotein A-I were strongly associated with high serum level of UA and significantly inversely associated with high serum level of HDL-c [11]. However, the association of high concentration of UA, dyslipidemia and HT among ado-lescents with AO remains not fully addressed and could represent a new way to early diagnosis of adoado-lescents with potential cardiometabolic risk.
In addition, it must be recognized that age, sex, genetics, ethnicity and environmental factors like geograph-ical patterns are huge etiologgeograph-ical factors contributing for the variation in the accumulation of visceral adipose tissue [3]. Hence, a more comprehensive management to deal with dyslipidemia, hyperuricemia and HT in ado-lescents with AO deserves further investigations as recently suggested [11] and studies of risk factors affecting AO, MS, or CVD in adolescents are needed.
Major socio-economic changes have affected the Algerians life resulting in increased non-communicable diseases and obesity [12]. In Algeria, the increase in the prevalence of general obesity [7] may be an indication of an increase in the prevalence of AO, high concentration of uric acid [13] and high blood pressure (BP) [14] in obese adolescents.
In this context, we aim to determine AO prevalence and investigate the independent relations between AO, UA serum level, lipid profile, BP and geographical patterns among Algerian adolescents.
Materials and methods
Study population
Using the stratified sampling method (strata were area of educational institutions, educational stage, classroom and sex), a descriptive cross-sectional study was carried out among 577 healthy adolescents selected from 51,775 college students distributed in 107 middle schools and 36,519 secondary students distributed in 37 secondary schools of urban and rural public educational institutions located in the Jijel province, Algeria, in 2014. Stu-dents aged between 10 and 19 years were included in the study and considered as adolescents as defined by the UNICEF [15]. Face-to-face interviews were performed to record the geodemographics. For assessment of biomarkers, 204 middle and secondary students (10–19 years) from the School Health Screening Unit of the Jijel province underwent blood sampling. Subjects with a history of CVD, diabetes, liver or renal diseases, under medication and with a history of alcohol consumptions and smoking were excluded. A written consent was obtained from all participants and their parents. They were also assured about the confidentiality of the study. The study was carried out in accordance with the Declaration of Helsinki (1989) of the World Medical Associa-tion and the research council of the Laboratory of Molecular and Cellular Biology, Faculty of Natural Sciences and Life Sciences, Mentouri brothers University (Algeria) approved the study protocol.
Aut omatic all yg ener at ed rough PDF by Pr oo fCheck fr om Ri ver Valle yT ec hnologies Lt d
Anthropometric measures and abdominal obesity definition
All adolescents underwent measurements of height and weight [16]. The BMI was calculated by dividing weight by height (kg/m2) [17]. The Wc was measured through the mean point between the tenth rib and the iliac crest
[18]. The hip circumference (Hc) was measured at the outermost points on the greater trochanters [19]. The WHR was calculated by the division between Wc and Hc. The WHtR was determined by the division between Wc and height. Abdominal obesity was based on a WHtR ratio ≥0.50 [14].
Blood sampling and biomarkers measurement
Venous blood samples were taken after semi supine rest for at least 15 min from all adolescents under fasting state in the morning. Serum samples were centrifuged (1500 g, 15 min, 4 °C) and immediately analyzed for the measurement of fasting plasma glucose (FPG), TG, TC, HDL-c and UA using colorimetric enzymatic assays (assay kits, Spinreact, Girona, Spain). The low-density lipoprotein-cholesterol (LDL-c) was calculated according to the Friedewald formula [20]. Non-high-density lipoprotein-cholesterol (non HDL-c), defined as TC minus HDL-c, includes all atherogenic cholesterols, such as LDL-c, lipoprotein (a), intermediate-density lipoprotein (IDL) and very-low-density lipoprotein (VLDL) remnants [21]. The TG/HDL-c, an indicator of IR [22], [23], was calculated. Plasma levels of leptin and insulin were measured by sandwich enzyme-linked immunosorbent assay (assay kits, Sigma-Aldrich, Saint Quentin Fallavier, France) in 40 adolescents (15 with WHtR <0.50 and 25 WHtR ≥0.50). We also calculated insulin resistance using the Homeostasis Model Assessment for Insulin Resistance (HOMA-IR) index [24]. Abnormal lipid profiles were defined according to [25]: TG ≥1.47 mmol/L, TC ≥5.18 mmol/L, LDL-c ≥3.37 mmol/L, HDL-c ≤1.03 mmol/L and non-HDL-c ≥3.76 mmol/L.
Blood pressure measurement and hypertension definition
Systolic (SBP) and diastolic blood pressure (DBP) BP measurements were performed twice after rest for at least 15 min in sitting position from all adolescents using an automatic blood pressure monitor. The systolic blood pressure to height (SBPHR) and diastolic blood pressure to height (DBPHR) ratios were calculated and used as indexes of hypertension [26]. Normal BP, prehypertension and hypertension (grade I and II) were defined, respectively for 10–17 years old subjects, as an average SBP and DBP <90th, an average SBP and/or DBP ≥90th and ≥95th percentile of the reference values for age, sex and height according to the standard definition using American children and adolescents [27]; for 18–19 years old subjects as an average SBP and DBP ≤120/80 mm Hg, as an average SBP and/or DBP ≥120/80 mm Hg and ≥140/90 mm Hg according to the guidelines of the Seventh Report of the Joint National Committee [28].
Statistical analysis
All statistical analyses were performed using the SPSS (Version 20.0) software. We used one-way ANOVA and Fisher’s Least Significant Difference (LSD) test to compare the difference between means of WHtR groups and between groups in different quartiles of plasma levels of uric acid. We used the chi-squared test to compare the difference between percentage of geodemographics and frequencies of abnormal serum lipid levels and UA and hypertension. All data in the tables were presented as means ± standard deviation (SD) as percentage (%) and as frequencies with 95% confidence intervals (95% CI). All data in figures were presented as means with 95% CI. Serum UA was categorized into quartiles based on the cut-points of the entire distribution. The hypothesis of a single factor underlying the original variables was investigated by Principal Component Analysis (PCA), which should recognize one component if a single mechanism explains this association. A p-value <0.05 was considered statistically significant vs. values of control group.
Results
Prevalence of abdominal obesity and its impact on blood pressure among adolescents
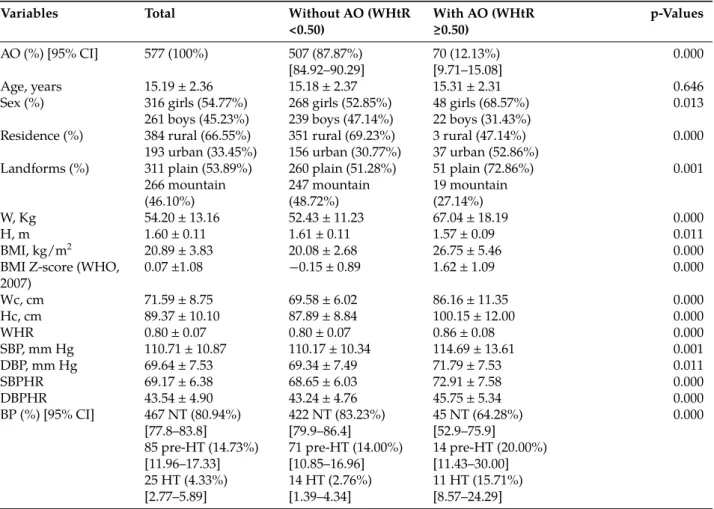
The final sample size was 308 middle students from 6 middle schools and 269 secondary students from 5 sec-ondary schools. The prevalence of AO was 12.13% (from 9.71 to 15.08) among these students (Table 1). Ado-lescents with AO exhibited higher BMI (+33.22%, p < 0.001), Hc (+13.95%, p < 0.001) and Wc (+23.83%, p <
Aut omatic all yg ener at ed rough PDF by Pr oo fCheck fr om Ri ver Valle yT ec hnologies Lt d
0.001) compared to their peers without AO (Table 1). The findings also showed that females exhibited a high prevalence of AO compared to males [8.43% (from 5.36 to 11.98) vs. 15.19% (from 11.39 to 19.30), p < 0.001]. The distribution of students by different geographical locations indicated that there was a high percentage of AO (i.e. proportion of adolescents with AO in each residence area and in each landform) among adolescents living in urban areas compared to those living in rural areas [19.17% (from 13.99 to 24.35) vs. 8.59% (from 5.99 to 11.72), p < 0.001]. There was also a high percentage of AO among adolescents living in plain areas compared to those living in mountainous areas [16.39% (from 12.54 to 20.26) vs. 7.14% (from 4.51 to 10.53), p < 0.001]. The SBPHR and DBPHR were significantly higher in adolescents with WHtR ≥0.50 compared to those with WHtR <0.50 (+6.21%, p < 0.001 and +5.80%, p < 0.001, respectively). The total prevalence of HT was 4.33% (from 2.77 to 5.89) among all adolescents but the prevalence of HT was 15.71% (from 8.57 to 24.29) among students with WHtR ≥0.50 and 2.76% (from 1.39 to 4.34) among students with WHtR <0.50 (p < 0.001) (Table 1).
Table 1: Epidemiological characteristics of the study population.
Variables Total Without AO (WHtR
<0.50) With AO (WHtR≥0.50) p-Values
AO (%) [95% CI] 577 (100%) 507 (87.87%)
[84.92–90.29] 70 (12.13%)[9.71–15.08] 0.000
Age, years 15.19 ± 2.36 15.18 ± 2.37 15.31 ± 2.31 0.646
Sex (%) 316 girls (54.77%) 268 girls (52.85%) 48 girls (68.57%) 0.013
261 boys (45.23%) 239 boys (47.14%) 22 boys (31.43%)
Residence (%) 384 rural (66.55%) 351 rural (69.23%) 3 rural (47.14%) 0.000
193 urban (33.45%) 156 urban (30.77%) 37 urban (52.86%)
Landforms (%) 311 plain (53.89%) 260 plain (51.28%) 51 plain (72.86%) 0.001
266 mountain
(46.10%) 247 mountain(48.72%) 19 mountain(27.14%)
W, Kg 54.20 ± 13.16 52.43 ± 11.23 67.04 ± 18.19 0.000
H, m 1.60 ± 0.11 1.61 ± 0.11 1.57 ± 0.09 0.011
BMI, kg/m2 20.89 ± 3.83 20.08 ± 2.68 26.75 ± 5.46 0.000
BMI Z-score (WHO,
2007) 0.07 ±1.08 −0.15 ± 0.89 1.62 ± 1.09 0.000 Wc, cm 71.59 ± 8.75 69.58 ± 6.02 86.16 ± 11.35 0.000 Hc, cm 89.37 ± 10.10 87.89 ± 8.84 100.15 ± 12.00 0.000 WHR 0.80 ± 0.07 0.80 ± 0.07 0.86 ± 0.08 0.000 SBP, mm Hg 110.71 ± 10.87 110.17 ± 10.34 114.69 ± 13.61 0.001 DBP, mm Hg 69.64 ± 7.53 69.34 ± 7.49 71.79 ± 7.53 0.011 SBPHR 69.17 ± 6.38 68.65 ± 6.03 72.91 ± 7.58 0.000 DBPHR 43.54 ± 4.90 43.24 ± 4.76 45.75 ± 5.34 0.000 BP (%) [95% CI] 467 NT (80.94%) [77.8–83.8] 422 NT (83.23%)[79.9–86.4] 45 NT (64.28%)[52.9–75.9] 0.000 85 pre-HT (14.73%) [11.96–17.33] 71 pre-HT (14.00%)[10.85–16.96] 14 pre-HT (20.00%)[11.43–30.00] 25 HT (4.33%) [2.77–5.89] 14 HT (2.76%)[1.39–4.34] 11 HT (15.71%)[8.57–24.29]
AO, abdominal obesity; CI, confidence interval; WHtR, waist-to-height; N, number of subjects; W, weight; H, height; BMI, body mass index; Wc, waist circumference; Hc, hip circumference; WHR, waist-to-hip ratio; SBP, systolic blood pressure; DBP, diastolic blood pressure; SBPHR, systolic blood pressure-to-height ratio; DBPHR, diastolic blood pressure to height ratio; BP, blood pressure; NT, normotensive; pre-HT, pre-hypertension; HT, hypertension. Variables are expressed as mean ± SD and as percentage (%). Differences are significant at p < 0.05 vs. AO (WHtR ≥0.50) group.
Metabolic consequences of abdominal obesity in adolescents
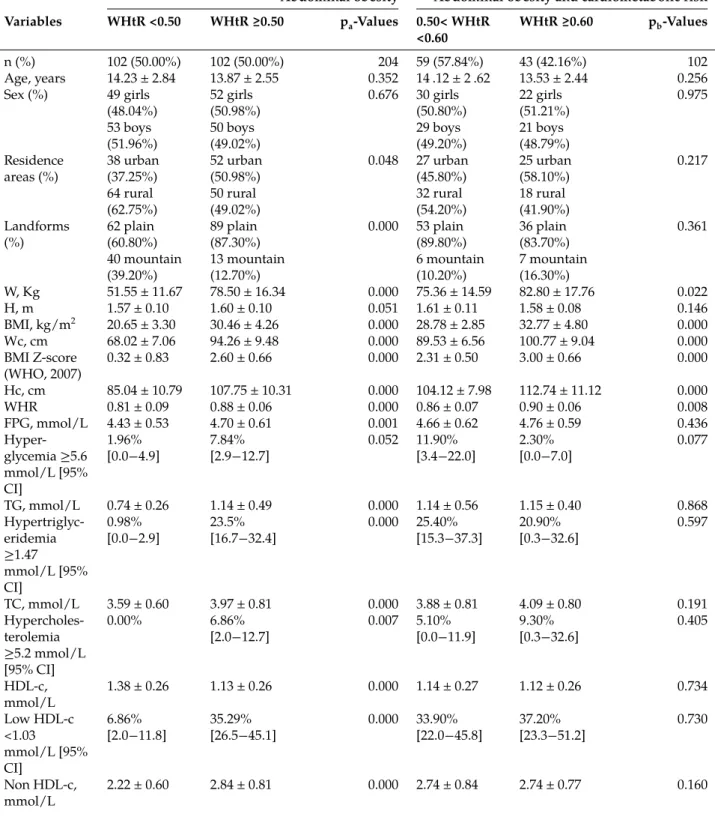
The means of the anthropometric characteristics presented significant differences between groups excepted for the means of height (Table 2). The highest proportion of adolescents with AO lived in urban areas (50.98%) and in plains (87.30%). The BMI, Wc and Hc were significantly higher in the group with WHtR ≥0.50 compared to the group with WHtR <0.50 (+47.51%, p < 0.001; +38.58%, p < 0.001 and +26.71%, p < 0.001, respectively) (Table 2). The SBPHR and DBPHR were significantly higher in the group with WHtR ≥0.50 compared to the group with WHtR <0.50 (+10.68%, p < 0.001 and +8.71%, p < 0.001, respectively) (Table 2). All the lipid parameters presented significant differences between groups (Table 2). For example, the serum concentration of LDL-c was significantly higher in adolescents with WHtR ≥0.50 compared to those with WHtR <0.50 (+26.57%, p < 0.001)
Aut omatic all yg ener at ed rough PDF by Pr oo fCheck fr om Ri ver Valle yT ec hnologies Lt d
(Table 2). The means of TG/HDL-c ratio and non HDL-c were significantly raised by 89.47% (p < 0.001) and by 26.57% (p < 0.001), respectively in adolescents with WHtR ≥0.50 compared to their peers with WHtR <0.50. The serum concentrations of UA, insulin and leptin were, respectively significantly increased by 29.78% (p < 0.001), 63.16% (p < 0.05) and 456.27% (p < 0.001) in adolescents with WHtR ≥0.50 compared to adolescents with WHtR <0.50 (Table 2). The comparison between subjects with WHtR ≥0.60 and subjects with 0.50≤ WHtR <0.60 indicated a significant increase in weight (+9.89%, p < 0.05); BMI (+13.86%, p < 0.001); Wc (+12.55%, p < 0.001); Hc (+8.28%, p < 0.001); WHR (+4.65%, p < 0.01); SBP (+4.73%, p < 0.01); SBPHR (+6.50%, p < 0.001) and leptin (+49.30%, p < 0.01) and no significant difference in lipid and glycemic profiles, UA serum level, insulin and HOMA-IR.
Table 2: Metabolic consequences of abdominal obesity in adolescents.
Abdominal obesity Abdominal obesity and cardiometabolic risk
Variables WHtR <0.50 WHtR ≥0.50 pa-Values 0.50< WHtR
<0.60 WHtR ≥0.60 pb-Values
n (%) 102 (50.00%) 102 (50.00%) 204 59 (57.84%) 43 (42.16%) 102
Age, years 14.23 ± 2.84 13.87 ± 2.55 0.352 14 .12 ± 2 .62 13.53 ± 2.44 0.256
Sex (%) 49 girls
(48.04%) 52 girls(50.98%) 0.676 30 girls(50.80%) 22 girls(51.21%) 0.975 53 boys
(51.96%) 50 boys(49.02%) 29 boys(49.20%) 21 boys(48.79%) Residence
areas (%) 38 urban(37.25%) 52 urban(50.98%) 0.048 27 urban(45.80%) 25 urban(58.10%) 0.217 64 rural
(62.75%) 50 rural(49.02%) 32 rural(54.20%) 18 rural(41.90%) Landforms
(%) 62 plain(60.80%) 89 plain(87.30%) 0.000 53 plain(89.80%) 36 plain(83.70%) 0.361 40 mountain
(39.20%) 13 mountain(12.70%) 6 mountain(10.20%) 7 mountain(16.30%)
W, Kg 51.55 ± 11.67 78.50 ± 16.34 0.000 75.36 ± 14.59 82.80 ± 17.76 0.022 H, m 1.57 ± 0.10 1.60 ± 0.10 0.051 1.61 ± 0.11 1.58 ± 0.08 0.146 BMI, kg/m2 20.65 ± 3.30 30.46 ± 4.26 0.000 28.78 ± 2.85 32.77 ± 4.80 0.000 Wc, cm 68.02 ± 7.06 94.26 ± 9.48 0.000 89.53 ± 6.56 100.77 ± 9.04 0.000 BMI Z-score (WHO, 2007) 0.32 ± 0.83 2.60 ± 0.66 0.000 2.31 ± 0.50 3.00 ± 0.66 0.000 Hc, cm 85.04 ± 10.79 107.75 ± 10.31 0.000 104.12 ± 7.98 112.74 ± 11.12 0.000 WHR 0.81 ± 0.09 0.88 ± 0.06 0.000 0.86 ± 0.07 0.90 ± 0.06 0.008 FPG, mmol/L 4.43 ± 0.53 4.70 ± 0.61 0.001 4.66 ± 0.62 4.76 ± 0.59 0.436 Hyper-glycemia ≥5.6 mmol/L [95% CI] 1.96% [0.0−4.9] 7.84%[2.9−12.7] 0.052 11.90%[3.4−22.0] 2.30%[0.0−7.0] 0.077 TG, mmol/L 0.74 ± 0.26 1.14 ± 0.49 0.000 1.14 ± 0.56 1.15 ± 0.40 0.868 Hypertriglyc-eridemia ≥1.47 mmol/L [95% CI] 0.98% [0.0−2.9] 23.5%[16.7−32.4] 0.000 25.40%[15.3−37.3] 20.90%[0.3−32.6] 0.597 TC, mmol/L 3.59 ± 0.60 3.97 ± 0.81 0.000 3.88 ± 0.81 4.09 ± 0.80 0.191 Hypercholes-terolemia ≥5.2 mmol/L [95% CI] 0.00% 6.86% [2.0−12.7] 0.007 5.10%[0.0−11.9] 9.30%[0.3−32.6] 0.405 HDL-c, mmol/L 1.38 ± 0.26 1.13 ± 0.26 0.000 1.14 ± 0.27 1.12 ± 0.26 0.734 Low HDL-c <1.03 mmol/L [95% CI] 6.86% [2.0−11.8] 35.29%[26.5−45.1] 0.000 33.90%[22.0−45.8] 37.20%[23.3−51.2] 0.730 Non HDL-c, mmol/L 2.22 ± 0.60 2.84 ± 0.81 0.000 2.74 ± 0.84 2.74 ± 0.77 0.160
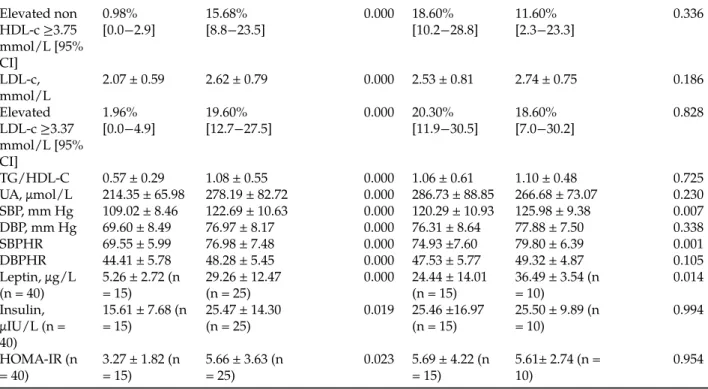
Aut omatic all yg ener at ed rough PDF by Pr oo fCheck fr om Ri ver Valle yT ec hnologies Lt d Elevated non HDL-c ≥3.75 mmol/L [95% CI] 0.98% [0.0−2.9] 15.68%[8.8−23.5] 0.000 18.60%[10.2−28.8] 11.60%[2.3−23.3] 0.336 LDL-c, mmol/L 2.07 ± 0.59 2.62 ± 0.79 0.000 2.53 ± 0.81 2.74 ± 0.75 0.186 Elevated LDL-c ≥3.37 mmol/L [95% CI] 1.96% [0.0−4.9] 19.60%[12.7−27.5] 0.000 20.30%[11.9−30.5] 18.60%[7.0−30.2] 0.828 TG/HDL-C 0.57 ± 0.29 1.08 ± 0.55 0.000 1.06 ± 0.61 1.10 ± 0.48 0.725 UA, μmol/L 214.35 ± 65.98 278.19 ± 82.72 0.000 286.73 ± 88.85 266.68 ± 73.07 0.230 SBP, mm Hg 109.02 ± 8.46 122.69 ± 10.63 0.000 120.29 ± 10.93 125.98 ± 9.38 0.007 DBP, mm Hg 69.60 ± 8.49 76.97 ± 8.17 0.000 76.31 ± 8.64 77.88 ± 7.50 0.338 SBPHR 69.55 ± 5.99 76.98 ± 7.48 0.000 74.93 ±7.60 79.80 ± 6.39 0.001 DBPHR 44.41 ± 5.78 48.28 ± 5.45 0.000 47.53 ± 5.77 49.32 ± 4.87 0.105 Leptin, μg/L (n = 40) 5.26 ± 2.72 (n= 15) 29.26 ± 12.47(n = 25) 0.000 24.44 ± 14.01(n = 15) 36.49 ± 3.54 (n= 10) 0.014 Insulin, μIU/L (n = 40) 15.61 ± 7.68 (n = 15) 25.47 ± 14.30(n = 25) 0.019 25.46 ±16.97(n = 15) 25.50 ± 9.89 (n= 10) 0.994 HOMA-IR (n = 40) 3.27 ± 1.82 (n= 15) 5.66 ± 3.63 (n= 25) 0.023 5.69 ± 4.22 (n= 15) 5.61± 2.74 (n =10) 0.954 AO, abdominal obesity; WHtR, waist-to height; N, number of subjects; W, weight; H, height; BMI, body mass index; Wc, waist
circumference; Hc, hip circumference; WHR, waist-to hip ratio; FPG, fasting plasma glucose; CI, confidence interval; TG, triglycerides; TC, total cholesterol; HDL-c, high-density lipoprotein-cholesterol; Non HDL-c, non high-density lipoprotein-cholesterol; LDL-c, low-density lipoprotein-cholesterol; TG/HDL-c, triglycerides-to-high-density lipoprotein-cholesterol ratio; UA, uric acid; SBP, systolic blood pressure; DBP, diastolic blood pressure; SBPHR, systolic blood pressure to height ratio; DBPHR, diastolic blood pressure to height ratio; HOMA-IR, homeostasis model assessment of insulin resistance. Variables are expressed as mean ± SD and as percentage (%). Differences are significant at p < 0.05; (a) WHtR <0.50 vs. WHtR ≥0.50 group; (b) 0.50< WHtR <0.60 vs. WHtR ≥0.60 group.
Relationships between, lipid profile, hypertension and uric acid in adolescents with abdominal obesity
Uric acid distribution was categorized for the values corresponding to the 25th; 50th; 75th and 90th percentiles (Figure 1–Figure 3).
Figure 1: Means of body mass index and waist circumference by uric acid quartiles in adolescents with abdominal obe-sity.
UA, uric acid; BMI, body mass index; Wc, waist circumference. Values are expressed as mean with 95% CI. (A) Compared to BMI and Wc values in the first quartile of UA; (B) Compared to BMI and Wc values in the second quartile of UA.ap <
Aut omatic all yg ener at ed rough PDF by Pr oo fCheck fr om Ri ver Valle yT ec hnologies Lt d
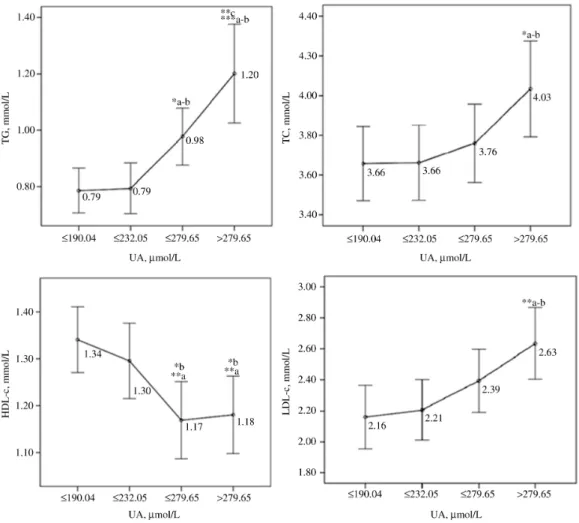
Figure 2: Means of lipid profile by uric acid quartiles in adolescents with abdominal obesity.
UA, uric acid; TG, triglycerides; TC, total cholesterol; HDL-c, high-density lipoprotein-cholesterol; LDL-c, low-density lipoprotein-cholesterol. Values are expressed as mean with 95% CI. (A) Compared to variable values in the first quartile of UA; (B) Compared to variable values in the second quartile of UA; (C) Compared to variable values in the third quartile of UA.ap < 0.05;bp < 0.01;cp < 0.001.
Figure 3: Means of systolic and diastolic blood pressure by uric acid quartiles in adolescents with abdominal obesity. UA, uric acid; SBP, systolic blood pressure; DBP, diastolic blood pressure. Values are expressed as mean with 95% CI. (A) Compared to SBP and DBP values in the first quartile of UA; (B) Compared to SBP and DBP values in the second quartile of UA.ap < 0.05;bp < 0.01;cp < 0.001.
Aut omatic all yg ener at ed rough PDF by Pr oo fCheck fr om Ri ver Valle yT ec hnologies Lt d
Adolescent corpulence and uric acid quartiles
The means of BMI and Wc were significantly higher in the fourth and third quartiles of UA compared with those in the first and second quartiles (p < 0.001) (Figure 1). The means of BMI were significantly increased by 22.75% in the third and by 30.56% in the fourth quartiles compared to the first quartile (p < 0.001). The means of Wc were significantly increased by 9.43% in the second (p < 0.05), 18.40% in the third and 22.89% in the fourth quartiles (p < 0.001) compared to the first quartile of UA (Figure 1).
Lipid profile and uric acid quartiles
No significant difference was found between means of TG in the first and second quartiles, but the means of TG were significantly increased by 24.45% and 52.97% in the third and fourth quartiles, respectively, compared to the first and second quartiles of UA (p < 0.001) (Figure 2). The fourth quartile was significantly increased by 22.45% compared to the third quartile (p < 0.01). No significant difference was found between means of TC in the first, second and third quartiles, but the mean of TC was significantly increased by 10.30% in the fourth quartile compared to the first and second quartiles of UA (p < 0.05) (Figure 2). No significant difference was found between means of HDL-c in the first and second quartiles but the means of HDL-c were significantly lowered by 12.80% and 11.95% in the third and fourth quartiles compared to the first (p < 0.01) and second (p < 0.05) quartiles of UA, respectively (Figure 2). No significant difference was found between means of LDL-c in the first, second and third quartiles but the mean of LDL-c was significantly increased by 21.95% in the fourth quartile compared to the first and second quartiles of UA (p < 0.01) (Figure 2).
Blood pressure and uric acid quartiles
The means of SBP were significantly increased by, respectively, 4.45%, 6.15% and 8.91% in the second (p < 0.05), third (p < 0.01) and fourth (p < 0.001) quartiles compared to the first quartile of UA. The mean of SBP was significantly increased by 25.94% in the fourth quartile compared to the third quartile (p < 0.05). The means of DBP were significantly increased by, respectively, 6.74% and, 9.85% in the third (p < 0.01) and fourth (p < 0.001) quartiles compared to first quartile of UA (Figure 3). The mean of DBP was significantly increased by 29.13% in the fourth quartile compared to the third quartile (p < 0.01).
Associations of uric acid serum level with cardiometabolic risk markers
The PCA identified two uncorrelated factors explaining 62.23% of the nine original variables (i.e. BMI, Wc, SBP, DBP, TG, HDL-c; UA, LDL-c and TC). The first factor (i.e. component 1) explained 45.05% of the variation and included BMI, Wc, SBP, DBP, TG, HDL-c and UA. The second factor (i.e. component 2) explained 17.18% of the variation and included TC and LDL-c (Figure 4). In addition, Wc, BP (SBP and DBP), TG and HDL-c represent the 4 metabolic syndrome (MS) criteria. Loadings of principal components after orthogonal rotation of the correlation matrix indicated that a high concentration of HDL-c is a protective factor (56%) and high serum levels of TG (58%) and UA (54%), SBP (78%), DBP (71%), Wc (83%) and BMI (85%) were major risk factors of MS. The UA serum level was positively associated with TG and BP and negatively associated with HDL-c.
Aut omatic all yg ener at ed rough PDF by Pr oo fCheck fr om Ri ver Valle yT ec hnologies Lt d
Figure 4: Two-component plot in rotated space among adolescents with and without abdominal obesity.
Extraction method: Principal component analysis. Rotation method: Varimax with Kaiser normalization. Component 1 was represented by BMI, Wc, SBP, DBP, TG, HDL-c and UA; Component 2 was represented by TC and LDL-c. BMI, body mass index; Wc, waist circumference; TG, triglycerides; TC, total cholesterol; HDL-c, high-density lipoprotein-cholesterol; LDL-c, low-density lipoprotein-cholesterol; UA, uric acid; SBP, systolic blood pressure; DBP, diastolic blood pressure.
Discussion
Abdominal obesity represents one of the most important factors contributing to general obesity and its compli-cations (e.g. MS, CVD) in children and adolescents [29]. The use of BMI as a surrogate of adiposity is especially problematic in the pediatric population, because the relative contributions of fat mass index and lean body mass index to body weight vary by age, sex, pubertal status and population ancestry [30]. Many BMI-for-age and sex reference curves were developed in different children and adolescent populations coming from dif-ferent countries and living in difdif-ferent geographical patterns and landforms. Moreover, no reference exists to evaluate the growth and corpulence of children and adolescents in Algeria [6]. Recently, it has been suggested that individuals should not be classified as obese based solely on BMI [31]. Indeed, children and adolescents in a normal BMI range may suffer from AO and their health risks could be missed out on oversight if screen-ing is done only by BMI [32]. This suggests that specific deposits of abdominal adipose tissue may be more strongly associated with dyslipidemia, metabolic dysregulation, future diabetes and CVD [33]. Thus, there is a need to develop standard methods to evaluate corpulence and to explore new diagnostic markers to prevent adolescents’ abdominal obesity and its associated complications during adulthood.
The prevalence of AO in Spanish adolescents with WHtR ≥0.50 was 14.3% [4]. Our finding showed that the prevalence of AO was 12.3% but was more frequent in girls. We also demonstrated that AO was more frequent in girls living in urban areas and plains. This difference may be due to different lifestyles and physical exercise in different regions as suggested by others [34]. Indeed, we demonstrated that rural and mountainous areas were protective factors reducing general obesity and abdominal obesity in our adolescents. Thus, these areas may reduce the risks associated with AO (e.g. hyperuricemia, hypertriglyceridemia, HT). Moreover authors showed that living in a mountainous area conveyed a 30% decrease in risk of overweight and a 50% decrease in risk of obesity in Sardinian adolescents, when compared to those living on plains and hillsides [35]. How-ever, the direct comparison between studies is difficult because each geographical region has its own specific characteristics. To sum up, our findings pointed out a specific age, a gender and geographical patterns and land-forms where novel interventional studies pertaining to prevent AO and its complications may be performed in Algeria.
In a previous study, authors demonstrated that in obese children with WHtR ≥0.60, 69% had an elevated HOMA-IR and 32% had MS [5]. In our population, the risks of MS and CVD were increased with a WHtR ≥0.50 and a BMI >26. This increased cardiometabolic risk was illustrated by an elevation of all analyzed metabolic variables in adolescents with AO, excepted for HDL-c. This is the first study using WHtR in adolescent subjects in Algeria to assess AO and its results are in line with other studies performed in other adolescents [36] where an elevated WHtR was associated with a poor prognostic factor of CVD. Therefore, our finding supports the use of WHtR among Algerian adolescents in clinics to improve the prevention of AO and its complications in their adulthood.
Epidemiological studies have reported that the prevalence of HT has significantly increased among children and adolescents in recent years [37]. In an Algerian population, the prevalence of HT, pre-HT and a high BP was associated with AO [15]. In our study, we demonstrated that adolescents with AO exhibited the highest hypertension indexes [26] (SBPHR, DBPHR). Thus, our finding is consistent with previous findings in Algerian adolescents and point out the importance of preventing AO in this specific population. Furthermore, our ado-lescents with AO had a greater serum concentration of insulin than their peers without AO. This may explain the relationship between AO and HT in adolescents. Indeed, hyperinsulinemia may result in the raise of sodium reabsorption and an may increase a vasoconstriction activity contributing to HT [29]. In addition, the release of adiponectin and plasminogen activator inhibitor by adipocytes of the visceral adipose tissue may also be involved in high BP [4]. The UA serum levels have been found to be associated with HT and MS in overweight and obese individuals [10]. In addition, UA serum concentrations were increased with different groups of BMI and Wc in Algerian adolescents [13]. In our study, we demonstrated that adolescents with AO exhibited the highest serum concentration of UA. We further demonstrated that they also had a higher leptin serum concen-tration than adolescents without AO. This last finding may explain the fact that our adolescents with AO had hyperuricemia because leptin production reduces UA excretion [38]. In a previous study, overweight schooled children were 2.4 to 7.1 times more likely to have elevated TC, LDL-c, and TG than their lean counterparts [29]. It has also been shown that TG was increased with high Wc and high UA serum concentration in Algerian
Aut omatic all yg ener at ed rough PDF by Pr oo fCheck fr om Ri ver Valle yT ec hnologies Lt d
adolescents [13]. In our study, we clearly demonstrated that adolescents with AO had dyslipidemia since all parameters of the lipid profile and leptin and insulin serum levels were significantly higher than in their coun-terparts without AO. To explain this result, it has been speculated that the synthesis of triglycerides will need NADPH resulting in increased UA production [11].
To our knowledge, no studies explored the potential relationships between hyperuricemia, lipid profile and HT in adolescents with AO in Algeria. The principal component analysis showed that BMI, Wc, SBP, DBP, TG, TC, HDL-c, LDL-c were significantly associated with high serum level of UA. Considering that BMI, Wc, BP, TG and HDL-c represent four criteria of MS [39] and because they are associated with high serum level of UA in our adolescents with AO, UA might be considered as one of the criterion for MS in this specific population. This finding suggests for the first time an intimate relationship between increased UA, dyslipidemia and high BP in Algerian adolescents with AO, as previously demonstrated in adults with obesity [11].
A number of limitations to our study need to be considered. First, we performed blood parameters analyses on a small number of students. This limitation is mainly due to the low frequency of students who voluntarily took and signed consents with their parents. However, the differences between students with and without AO were already significant. Second, the lack of control over the fasting time of the participants can have ef-fects on our results. The parents and their children were informed about the fasting time, but maybe some did not respect this condition. Third, the UA serum level could have been influenced by other factors such as physical activity and food habits. Future work will focus on relationships between geographical regions, food and physical activity with risk factors associated with AO and high UA serum level.
Conclusion
We demonstrated that adolescents with AO exhibits the highest serum levels of UA, the poorest lipid profile and the highest BP which are known risk factors of cardiometabolic diseases. Values of WHtR ≥0.5 can be used as a cut-off point for defining the risks of HT, lipid abnormalities and elevation of UA serum level in Algerian adolescents with AO and at risk of developing cardiometabolic diseases. We also demonstrated that urban areas and plains are factors contributing to the development of AO in our adolescent subjects and particularly in females. Finally, we showed that high serum level of UA is associated with AO and predicts abnormalities of the lipid profile and the increase of BP suggesting that WHtR ≥0.5 and UA could be assessed in a routine clinical practice to improve the diagnosis of HT, MS and cardiometabolic risk in adolescent subjects.
Conflict of interest statement: The author(s) declare(s) that there is no conflict of interest regarding the
publi-cation of this paper.
References
[1] Spolidoro JV, Pitrez Filho ML, Vargas LT, Santana JC, Pitrez E, Hauschild JA, et al. Waist circumference in children and adolescents correlate with metabolic syndrome and fat deposits in young adults. Clin Nutr. 2013;32:93–7.
[2] Singh R, Bhansali A, Sialy R, Aggarwal A. Prevalence of metabolic syndrome in adolescents from a north Indian population. Diabet Med. 2007;24:195–9.
[3] Roriz AK, Passos LC, de Oliveira CC, Eickemberg M, Moreira Pde A, Sampaio LR. Evaluation of the accuracy of anthropometric clinical indi-cators of visceral fat in adults and elderly. PLoS One. 2014;9:e103499.
[4] Schroder H, Ribas L, Koebnick C, Funtikova A, Gomez SF, Fito M. Prevalence of abdominal obesity in Spanish children and adolescents. Do we need waist circumference measurements in pediatric practice? PLoS One. 2014;9:e87549.
[5] Khoury M, Manlhiot C, McCrindle BW. Role of the waist/height ratio in the cardiometabolic risk assessment of children classified by body mass index. J Am Coll Cardiol. 2013;62:742–51.
[6] Bahchachi N, Dahel-Mekhancha CC, Rolland-Cachera MF, Badis N, Roelants M, Hauspie R, et al. Weight and height local growth charts of Algerian children and adolescents (6–18 years of age). Arch Pediatr. 2016;23:340–7.
[7] Daoudi H, Lakehal A, Sayed A, Rouabah A, Zaamouche A, Rouabah L. Frequency of obesity and eating habits among teenagers of constan-tine, algeria. World J Pharm Res (WJPR). 2014;4(1):70–83.
[8] Global School-based Student Health Survey. Algeria Rural. WHO; 2011.
[9] Service of epidemiology and preventive medicine. Study of overweight, obesity and factors associated with overweight among junior students enrolled in public colleges. Public Establishment of Proximity Health-Bouzareah (Algeria); 2011.
[10] Luciano R, Shashaj B, Spreghini M, Del Fattore A, Rustico C, Wietrzykowska Sforza R, et al. Percentiles of serum uric acid and cardio-metabolic abnormalities in obese Italian children and adolescents. Ital J Pediatr. 2017;43:3.
Aut omatic all yg ener at ed rough PDF by Pr oo fCheck fr om Ri ver Valle yT ec hnologies Lt d
[11] Peng TC, Wang CC, Kao TW, Chan JY, Yang YH, Chang YW, et al. Relationship between hyperuricemia and lipid profiles in US adults. Biomed Res Int. 2015;2015:127596.
[12] STEP wise approach to chronic disease risk factor, surveillance (STEPS). Measurement of risk factors for noncommunicable diseases in two wilaya in Algeria. WHO; 2005.
[13] Ghomari-Boukhatem H, Bouchouicha A, Mekki K, Chenni K, Belhadj M, Bouchenak M. Blood pressure, dyslipidemia and inflammatory factors are related to body mass index in scholar adolescents. Arch Med Sci. 2017;13:46–52.
[14] Benmohammed K, Valensi P, Benlatreche M, Nguyen MT, Benmohammed F, Paries J, et al. Anthropometric markers for detection of the metabolic syndrome in adolescents. Diabetes Metab. 2015;41:138–44.
[15] UNICEF. The state of the world’s children 11 – Adolescence an Age of Opportunity. New York ed.; 2011.
[16] UNICEF. How to Weigh and Measure Children: Assessing the Nutritional Status of Young Children in Household Surveys. New York ed.; 1986.
[17] Must A, Anderson SE. Body mass index in children and adolescents: considerations for population-based applications. Int J Obes. 2006;30:590–4.
[18] McCarthy HD, Jarrett KV, Crawley HF. The development of waist circumference percentiles in British children aged 5.0–16.9 y. Euro J Clin Nutr. 2001;55:902–7.
[19] WHO. Waist circumference and waist-hip ratio: Report of a WHO expert consultation. Geneva: WHO; 2008.
[20] Knopfholz J, Diniz Disserol C, Pierin A, Schirr F, Streisky L, Takito L, et al. Validation of the friedewald formula in patients with metabolic syndrome. Cholesterol. 2014;2014:1–5.
[21] Shim YS, Baek JW, Kang MJ, Oh YJ, Yang S, Hwang IT. Reference values for the triglyceride to high-density lipoprotein cholesterol ratio and non-high-density lipoprotein cholesterol in Korean children and adolescents: The Korean National Health and Nutrition Examina-tion Surveys 2007–2013. J Atheroscler Thromb. 2016;23:1334–44.
[22] Giannini C, Santoro N, Caprio S, Kim G, Lartaud D, Shaw M, et al. The triglyceride-to-HDL cholesterol ratio. Diabetes Care. 2011;34:1869–74.
[23] Olson K, Hendricks B, Murdock DK. The triglyceride to HDL ratio and its relationship to insulin resistance in pre- and postpubertal chil-dren: observation from the Wausau School Project. Cholesterol. 2012;28:e794252.
[24] Disse E, Elisha B, Fellahi S, Rabasa-Lhoret R, Laville M, Bastard J. Estimer la sensibilité à l’insuline : trop d’outils tuent-ils l’outil? Obésité. 2013;8:141–9.
[25] National Heart Lung and Blood Institute. Expert panel on integrated guidelines for cardiovascular health and risk reduction in children and adolescents: summary report. Pediatrics. 2011;128(Suppl 5):S213–56.
[26] Guo X, Zheng L Li Y, Zhang X, Yu S, Sun Y. Blood pressure to height ratio: a novel method for detecting hypertension in paediatric age groups. Paediatr Child Health. 2013;18:65–9.
[27] National High Blood Pressure Education Program Working Group on High Blood Pressure in Children and Adolescents. The fourth re-port on the diagnosis, evaluation, and treatment of high blood pressure in children and adolescents. Pediatrics. 2004;114:555–76. [28] Program NHBPE. The seventh report of the joint national committee on prevention, detection, evaluation, and treatment of high blood
pressure. National Institutes of Health. 2004. pp. 1–104.
[29] Forkert E, Rendo-Urteaga T, Nascimento-Ferreira M, Moraes A, Moreno L, de Carvalho H. Abdominal obesity and cardiometabolic risk in children and adolescents, are we aware of their relevance? Nutrire. 2015;41:15.
[30] Weber DR, Moore RH, Leonard MB, Zemel BS. Fat and lean BMI reference curves in children and adolescents and their utility in identify-ing excess adiposity compared with BMI and percentage body fat. Am J Clin Nutr. 2013;98:49–56.
[31] Cho WK, Kim H, Lee HY, Han KD, Jeon YJ, Jung IA, et al. Insulin resistance of normal weight central obese adolescents in Korea strati-fied by waist to height ratio: results from the Korea National Health and Nutrition Examination Surveys 2008–2010. Int J Endocrinol. 2015;2015:158758.
[32] Zhang YX, Zhao JS, Chu ZH. More attention should be paid to monitoring of abdominal obesity among children and adolescents. Ann Nutr Metab. 2016;69:212–4.
[33] Hatch-Stein JA, Kelly A, Gidding SS. Zemel BS, Magge SN. Sex differences in the associations of visceral adiposity, homeostatic model assessment of insulin resistance, and body mass index with lipoprotein subclass analysis in obese adolescents. J Clin Lipidol. 2016;10:757–66.
[34] Zhang YX, Zhao JS, Chu ZH, Tan HL. Prevalence and regional disparities in abdominal obesity among children and adolescents in Shan-dong, China, surveyed in 2010. Ann Nutr Metab. 2014;64:137–43.
[35] Velluzzi F, Lai A, Secci G, Mastinu R, Pilleri A, Cabula R, et al. Prevalence of overweight and obesity in Sardinian adolescents. Eat Weight Disord. 2007;12:e44–50.
[36] Bacopoulou F, Landis G, Rentoumis A, Tsitsika A, Efthymiou V. Mediterranean diet decreases adolescent waist circumference. Eur J Clin Invest. 2017;47:447–55.
[37] Kuciene R, Dulskiene V, Medzioniene, J. Association of neck circumference and high blood pressure in children and adolescents: a case-control study. BMC Pediatr. 2015;15:127.
[38] de Oliveira EP, Burini RC. High plasma uric acid concentration: causes and consequences. Diabetol Metab Syndr. 2012;4:12.
[39] Zimmet P, Alberti KG, Kaufman F, Tajima N, Silink M, Arslanian S, et al. The metabolic syndrome in children and adolescents – an IDF consensus report. Pediatr diabetes. 2007;8:299–306.