DOI 10.1007/s00138-013-0540-y O R I G I NA L PA P E R
Triangular traffic signs detection based on RSLD algorithm
Mohammed Boumediene · Christophe Cudel · Michel Basset · Abdelaziz Ouamri
Received: 23 July 2012 / Revised: 27 February 2013 / Accepted: 8 August 2013 / Published online: 25 August 2013
© Springer-Verlag Berlin Heidelberg 2013
Abstract This paper describes an efficient method for the detection of triangular traffic signs on grey-scale images.
This method is based on the proposed RANSAC symmetric lines detection (RSLD) algorithm which transforms trian- gle detection into a simple segment detection. A multi-scale approach allows the detection of any warning and yield traffic signs, whatever their distance to the vehicle. This algorithm is applied to a set of selected corners obtained with a coding gradient method. Baseline detection uses the scale of selected triangles to confirm the presence of traffic signs. The study demonstrates that RSLD is a low computation method as compared to standard triangle detection. The performance of the method proposed is compared with recently published methods on road sign databases, which use colour infor- mation. An equivalent detection rate is obtained with this algorithm, working on grey-scale images. This algorithm is implemented and runs in real-time at 30 frames per second.
Keywords Traffic sign detection ·Advanced driver assistance systems·Computer vision
M. Boumediene (
B
)·C. Cudel·M. BassetLaboratoire MIPS, Université de Haute Alsace, Mulhouse, France e-mail: [email protected]
C. Cudel
e-mail: [email protected] M. Basset
e-mail: [email protected] M. Boumediene·A. Ouamri
Laboratoire Signaux et Images, Université des Sciences et de la Technologie Mohamed Boudiaf, Oran, Algeria
A. Ouamri
e-mail: [email protected]
1 Introduction
Traffic signs allow the regulation and control of the traffic flow. These signs are important for road users: drivers or pedestrians. Although traffic signs are clearly visible along the roads, the driver can be distracted and miss signs, which can cause dangerous situations. Therefore, a traffic sign recognition (TSR) system assists the driver and gives him information about potentially dangerous situations.
Two main approaches to TSR systems are proposed in the literature: the global positioning system (GPS)-based approach and the vision-based approach. The first one recog- nises the current traffic signs by extracting information from the GPS navigation data. The disadvantage of this approach is that the GPS map is neither complete nor up-to-date and there are numerous situations where the GPS signal is not avail- able, e.g., in a tunnel. Therefore, the vision-based approach is necessary. This second approach uses an optical sensor (vehicle-mounted camera) and locates and recognises the traffic signs appearing in the captured frames. Recently, the MIPS (Modélisation, Intelligence, Processus et Systémes) laboratory has tried to merge both systems in order to design more robust TSR systems [8].
This paper focuses on a computer vision approach. Two distinct steps usually compose TSR system by vision, which are detection and recognition. First, regions of interest (ROI) containing the candidate traffic signs are detected in the cur- rent frame. This detection is based on the sign characteristics, such as colour and shape, which help to distinguish traffic signs from other objects appearing in the road environment.
Then, recognition or classification of the ROIs consists in identifying sign pictograms figuring in each ROI.
Each traffic sign is characterised by its colour, shape and pictogram. In the literature numerous methods use colour information to extract the ROIs containing road signs. There
are different colour spaces for segmentation, the one which is most often used is the hue-saturation-value (HSV) space [22,25,27]. A comparison between various segmentation techniques using different colour spaces for traffic sign detec- tion is presented in [13]. The results show that normalization improves performance and represents a low cost operation.
Advanced driver assistance systems (ADAS) can contain up to three different applications: TSR, pedestrian and lane detection. Usually, pedestrian and lane detection use only a grey-scale camera and only TSR can use colour information.
But colour information is sometimes perturbed by traffic sign surface reflectance which depends on the weather, daylight conditions and the age of signs. This is one of the reasons why a grey-scale method is proposed here, which offers the same performance as colour methods.
The aim is to detect triangular traffic signs in a context of grey-scale images, using the original operator RANSAC symmetric lines detection (RSLD) which exploits the sym- metry of a triangle. This paper is organised in three sec- tions: Section2presents a state of the art of related studies.
Section3details the proposed traffic sign detection and the results are presented in Sect.4, followed by a conclusion and discussion on future research work.
2 Related studies
The methods proposed in the literature can be classified into two categories: the Hough-like approaches and the template matching approaches. The Hough transform is a popular tool in computing vision, e.g., for line detection and circle detec- tion. For the detection of traffic signs, a voting procedure is carried out in a parameter space, from which the ROIs are obtained by computing the local-maxima in the parameter space. For the template matching approach, a set of shape sign templates is used for detection. Matching can be per- formed through correlation or by a classifier, such as the support vector machine (SVM). The following paragraphs describe recent algorithms, as well as colour or grey-scale images.
Garcia-Garrido [12] uses the classic Hough algorithm for searching straight lines in order to detect triangular signs.
The purpose is to detect three straight lines intersecting each other, forming a 60◦ angle. The advantage of the method proposed in [12] is that it can work day and night with no change of the algorithm. This is possible because the edge points used by the Hough transform are obtained with an extended Canny filter. The two Canny-thresholds are adapted by the image histogram.
In [7], a colour segmentation is performed to obtain a binary image with selected regions of the candidate signs. A simple threshold method helps to perform a segmentation in the hue-saturation-intensity (HSI) space. The salient points
(a) (b)
(c)
Fig. 1 The voting scheme of VBT and STUVT. a Scheme for the voting method of VBT. b Scheme for the voting method of STUVT [16]. c Example of Vaccuand Baccu[2]
related to the shape of the traffic sign are detected in the binary image by a detector of local binary features (DLBF) [7]. The set of the salient points are clustered for relating single points, one at each corner. The author does not well explain how the corners are connected for the recognition of triangular shapes.
The symmetric nature of triangular shapes is used in [23].
An extended fast radial symmetry transform is proposed, the regular polygon detector (RPD), which computes the possi- ble shape centroid locations into the grey-scale image. For regular polygons with n corners, the radius is defined as the perpendicular distance from an edge to the centroid. As for detecting the circle shape, each edge point votes for a poten- tial radius along the line of the gradient vector. All votes are accumulated into a matrix and are used with the equiangu- lar information of the regular polygons for computing the centroid of the shape.
The vertex and bisector transformation (VBT) is defined in [2]. This transformation is based on the image gradient and produces two arrays: Vaccuand Baccu, accumulating evidence of respectively the angle vertex and the angle bisector. The pair edge points(Pi,Pj)with non-parallel orientation gradi- ent vote for the vertex, ( A) in Fig.1a, to which they belong.
This pair also votes for the bisector ( A B) and helps to obtain two accumulators (Vaccuand Baccu). The centre of the trian- gular sign is represented by the local maxima of Baccuand its corners are determined by the local maxima of Vaccu(see Fig.1c).
Similar to VBT, a single target vote for upright triangles (STVUT) is proposed in [16]. The difference from VBT is that the STUVT computes one accumulator only and the vote relates triple edge points with pairwise non-parallel orienta- tions (see Fig.1b). To decrease the computational time of the
voting process, a heuristic method is proposed to choose the appropriate triple edge points. Pair edge points(Pi,Pj)are chosen in the same row image with mirror orientations. The position of the third edge point Pk is between Pi and Pj.
Several preprocessing steps are proposed and evaluated in [16] to increase the performance of the Hough-like meth- ods. The preprocessing steps transform the colour image into a gradient image which assigns magnitude and orientation to significant pixels, e.g., red pixels which are related to warn- ing traffic signs. Learned colour gradient (LCG) and expected orientations (EO) provide best results with RPD, VBT and STVUT [16]. LCG produces the gradient image according to local colour distribution. EO is a similar step, but orientation gradient is introduced to enhance triangles detection.
The colour and shape characteristics are used in [11].
Colour segmentation helps to extract the ROIs containing possible traffic signs from the rest of the image. A quad-tree histogram is applied to segmentation which, uses recursively, a division of the image into quadrants until all elements are homogeneous. To classify the ROIs into a particular group of signs, e.g., triangular signs, the histograms of oriented gradients (HOG) is used as descriptor.
A genetic algorithm is used in [9] to search for possible signs in the image. First, an analysis of the hue and saturation components of the image helps to detect the regions which satisfy some colour restrictions. Based on the perimeters of these regions, the genetic algorithm performs a global search to detect the traffic signs where each individual is represented by a sign model with a certain position, a scale and a rotation.
Two steps are proposed in [30] for the detection of warning traffic signs. In the first step, a linear SVM classifier is used, and it is trained with the HOG features of all types of triangu- lar traffic signs. To remove false detections, a blackhat filter [30] is applied to the image by emphasizing the dark pixels with high contrast in their local environment. Therefore, the border and the pictogram of the traffic sign are emphasised and the result is used to eliminate false detections.
Alefs et al. [1] proposes a matching method based on an edge orientation histogram (EOH). Using the grey-scale image, a Gaussian pyramidal of three levels is created. At each level, a scanning window is used, and the matching mea- surements, between a set of templates and the region defined by the scanning window, are analyzed in order to determine the presence or absence of traffic signs. The matching mea- surements are based on edge-orientation histograms defined on different subparts which represent a template.
The local contour pattern operator (LCP) is defined in [19,26] as a measurement over contour images to com- pute the local geometrical structures. For each contour point, obtained with the Canny filter, the local geometrical struc- ture is represented by a LCP code-word. In [19,26], 30 LCP code-words are used to represent 4 sets of orientations. The scanning windows are subdivided into subparts according to
geometrical structures defining the triangular signs and cir- cular signs. The four-bin histogram, related to the four sets of orientations, is computed on each subpart and used to detect the traffic signs. In [19], the checking of the candidate signs is based on quantum features which are learned by AdaBoost algorithm. Similar to Haar-like features, quantum features are a simple intensity level comparison between pixels which are not adjacent.
The method proposed here cannot be classified as a Hough-like approach or template-matching approach. It maybe be close to Hough-like approach because it is based on line fitting, but there is no voting process. The main idea is to use the principle of coordinates inversion combined with line detection to detect the symmetry of triangles. The inter- est of the method is to work on grey-scale images with a final algorithm easily implementable in real-time, and with performance similar to that of the latest methods published.
3 The method proposed
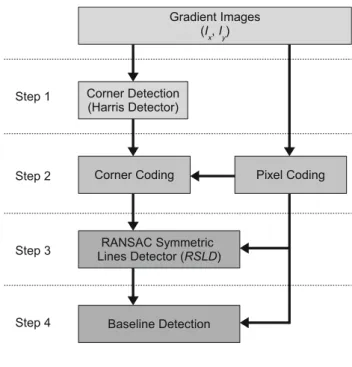
The authors propose a method to detect triangular traffic signs in four steps. This method is based on the Harris corner detec- tor and an original algorithm, RSLD. Figure 2 shows the four steps proposed in the algorithm. The method starts by computing the gradient image following x and y directions (Eq.1). The first step consists in computing the corners inside the images, using the well-known Harris detector to ensure the extraction of triangular traffic sign corners. The second step uses corner coding in order to select up and down corner
Fig. 2 Diagram of the algorithm proposed
candidates related to triangular shapes oriented upwards and downwards, respectively. The third step proposes the RSLD method for traffic sign triangular shape detection. The final step checks the presence of triangle baseline to confirm the triangular traffic sign detection.
Ix = ∂I
∂x, Iy= ∂I
∂y. (1)
3.1 Corner detection
For the detection of triangle corners in images, the Harris detector [15] is one of the most efficient methods with a low computation time. The Harris detector is based on the covariance matrix M (Eq.2). This matrix describes the gradi- ent distribution in a local neighbourhood for each pixel. The neighbourhood depends on the Gaussian window W used.
The eigenvalues,λ1andλ2, of this matrix represent the prin- cipal gradient components in two orthogonal directions. Both significant eigenvalues indicate the presence of two main directions in the neighbourhood, which can describe a cor- ner at the corresponding position. Harris [15] proposes an alternative to eigenvalue computation with the criterion R described in Eq.3where k is a scalar fixed at 0.04.
Ix2=Ix2⊗W, Iy2=Iy2⊗W, IxIy=IxIy⊗W,
M=
Ix2 IxIy
IxIy Iy2
. (2)
(λ1+λ2)2=T r2(M), λ1∗λ2=Det(M),
R=Det(M)−k∗T r2(M). (3)
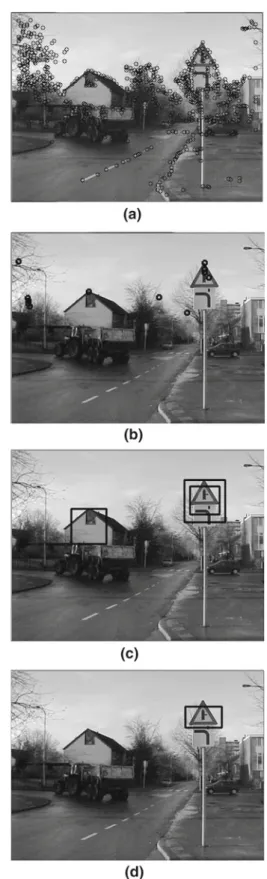
The set of corners are computed by finding the local- maxima in the R matrix. An example of detection is shown in Fig.3a.
3.2 Corner coding
The Harris detector is usually employed to compute geomet- ric relations between images or in image registration. These methods associate feature vector descriptors to describe each corner in order to perform a comparison with representative vectors contained in a database [20]. One major limitation of descriptors for traffic sign corners is the symmetric neigh- bourhood considered to create them. For example, the Harris feature vector descriptor (HFVD) proposed in [29] is based on a circular neighbourhood partition. This approach is not adapted for traffic sign detection because the feature descrip- tor will not only include information of road signs but also of
Fig. 3 Example of triangular traffic sign detection. a Results of Harris detector (step 1). b The corner candidates (step 2). c Results of the RSLD proposed (step 3). d Results of baseline detection (step 4)
Fig. 4 The edge angle space divided into four bins. Classes 3 and 4 represent the horizontal and the vertical pixel edges, respectively. The diagonal pixel edges are represented by classes 1 and 2
the background scene. This is the reason why an alternative to centered descriptors is proposed: coding the main directions attached to a corner in an appropriate neighbourhood.
The aim is to detect up and down corners related to trian- gular shapes oriented upwards or downwards, respectively, using gradient images (Ix, Iy) previously computed to iden- tify both types of corners. A coded image is generated, by using Eq.4, where each pixel is coded according to its orien- tation. Intermediate calculations available in the Harris com- putation are used to define A=(Ix2>T),B =(Iy2 >T), and C = (IxIy < 0). T is a threshold used to select a significant gradient; Its value is set to 1,000. Five classes {0,1,2,3,4}are defined. The non-edge pixels are coded by class 0, and the edge pixels are coded following the four directions depicted in Fig.4. The diagonal edges are repre- sented by classes 1 and 2. Finally, the horizontal and vertical edges are represented by classes 3 and 4.
Class= A B(2−C)+3 A(1−B)
+4B(1−A) (4)
The aim of corner coding is to select corner candidates which represent triangular traffic sign positions. This filtering is based on coded images. For each corner position reported in coded images, an up or down corner is detected according to class distribution. Two class distributions are proposed in adapted subregions. Figure5a shows subregions for up corner coding. In this case, a subregion concerns the neighbourhood under the corner position where the shape information of road signs must be found. For each corner, if class 2 is dominant in the South-West (SW) subregion and class 1 in the South-East (SE) subregion, then the corner is classified as an up corner.
A similar process is applied for down corners in agreement with the subregions shown in Fig.5b. Figure 6 illustrates the result of the corner coding step applied to a synthetic image, and Fig.3b on a road scene image. Figure7shows the number of remaining triangular traffic sign candidates compared to the Harris corner number. The corner coding is able to select candidate corners only, and to significantly
(a) (b)
Fig. 5 Class distribution used for corner coding. a Class distribution for a triangle oriented upward. b Class distribution for a triangle ori- ented downward
Fig. 6 Corner selection based on corner coding
Fig. 7 Results of corner coding on 32 images of Grigorescu’s database of traffic signs [14]. The top curve represents the number of detected corners with the Harris detector. The bottom curve represents the num- ber of selected corners with the proposed corner coding method
reduce the number of corners to be analyzed in the next steps, which should confirm that a corner represents a triangular traffic sign or not.
3.3 RSLD for triangle identification
Principle The methods described in [5,21,23,24], detect the borders of traffic signs with a line detector and analyze the
(a) (b)
Fig. 8 The inversion around the identified corners. a Represents a vertical y-coordinate inversion applied around the selected corners. b Represents a vertical y-coordinate inversion applied around the down corners
relative positions of these lines with different criteria such as symmetry, the distance to the border or the position of the intersection points. To reduce the computation time for line detection, the RSLD method based on RANSAC algorithm has been designed for this application.
The RANSAC algorithm is a well-known, powerful method to fit a model in a set of N points containing data related to the model (inliers) and data which are not related to the model (outliers). It is an iterative algorithm, composed of two mains steps. The first step consists in generating an appropriate model based on n samples chosen randomly from a set of points. The second step evaluates the computed model for the N points of the dataset.
The idea is to straighten the two diagonal sides of trian- gular shapes. This helps to detect only one segment instead of two with a RANSAC algorithm. This principle is illus- trated in Fig.8a, b. For up corner candidates, a simple inver- sion of the y-coordinate applied on coded pixels of class 2 transforms the two diagonal segments into a single segment.
For down corner candidates, the same inversion is performed with coded pixels of class 1. This approach converts the sym- metry detection into a simple line detection while preserv- ing the symmetry criteria. Indeed, if the corner candidate is really positioned at the top or bottom of a triangular shape, this method will produce a long segment centered around this corner. If the number of inliers is lower than a threshold s, the detected segment is then too short and the corner is not a true candidate. The threshold s is function of detection scale and its value is chosen from the receiver operating characteristics (ROC) curve as it is discussed in Sect.4.
Interest of the proposal There are two advantages which jus- tify this method: accuracy is better, depending on the outliers, and the number of computations is reduced as compared to other methods.
Fig. 9 Synthetic images. The circles represent inliers, real data related to the triangle’s sides with Gaussian noise, and the asterisks points represent outliers which are uniformly distributed. a Represents two sides of a triangle and b Represents these sides after applying a y- coordinate inversion
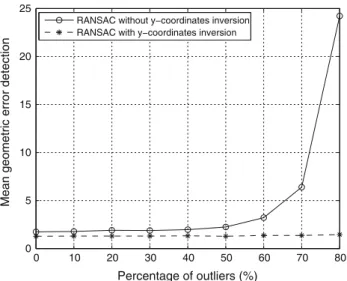
Concerning the accuracy, this approach was compared with the separate detection of the two segments, using RANSAC to retrieve one or both of the segments. This comparison was performed by adding outliers to a syn- thetic image containing two segments representing the diag- onal sides of a triangle. For each measurement, the RMSE (root-error-mean-square) geometric distance was computed between the segment(s) model and the segment(s) detected according to the level of the outliers added to the syn- thetic image. The comparison is performed between two approaches:
– without the y-coordinate inversion: detection of two seg- ments using the RANSAC method for each segment. The adapted subregions were defined around the corner can- didate (see Fig. 8) and RANSAC was applied to each region separately.
– with the y-coordinate inversion: detection of a single seg- ment with the RANSAC method applied to appropriate subregions after the y-coordinate inversion process.
Figure 9 shows an example of corresponding synthetic images with and without the y-coordinate inversion method.
Inliers were generated from equations: tan(π3)x+y=0 and
−tan(π3)x+y=0 with Gaussian noise (σ =3) added to their coordinates. This noise represents perturbations, which generates realistic simulations. The measurements were per- formed according to outliers percentage added. For a given outlier percentage, the experiment was repeated 1,000 times to obtain representative results.
The results of these experiments are reported in Fig.10.
The possibility of easier detection of a long single segment instead of two short, ones is thus confirmed. The curve pre- senting the lower RMSE is the one where the y-coordinate inversion was performed.
0 10 20 30 40 50 60 70 80 0
5 10 15 20 25
Percentage of outliers (%)
Mean geometric error detection
RANSAC without y−coordinates inversion RANSAC with y−coordinates inversion
Fig. 10 Comparison between RANSAC detection with and without the y-coordinate inversion
0 10 20 30 40 50 60 70 80
0 5 10 15 20 25 30
Percentage of outliers (%)
Computing Time (milliseconds)
RANSAC without y−coordinates inversion RANSAC with y−coordinates inversion
Fig. 11 Computing time of RANSAC detection with and without y-coordinate inversion. The number of inliers is of 30
Concerning the cost of computation, the number of iter- ations with and without the coordinate inversion was com- pared. The number of RANSAC iterations K (Eq.5) depends on the percentage of the inliersw, complexity of the model n and probability p that RANSAC gives a suitable model [10].
For line detection, as 2 points are enough to model a line, n=2. The probability is chosen such that(1−p)=10−3, which is a commonly used value for RANSAC. With these values, K =24 ifw=50 %, and K =687 if this percentage decreases to 10 %.
K = log(1−p)
log(1−wn) (5)
The RANSAC computation time T can be estimated using Eq. 6 [6] where tg and te represent, respectively, the cal- culation time for the two RANSAC steps: generation and evaluation.
T =K (tg+N te) (6)
The detection of diagonal triangle sides need the RANSAC algorithm to be applied two times in the subregions described in Fig.8a. First in subregion C and secondly in D. Here, A and B are unused subregions. C and D are considered to con- tain N2 samples each. The global computation cost TC D of this detection is then defined as the sum of the computation time for C and D subregions:
TC D =TC+TD,
=2 K
tg+ N 2 te
,
=K tg+T. (7)
The RANSAC with y-coordinate inversion used here, is applied to subregions A and D and the number of points in the dataset is then N . The duration TA Dof the method can be obtained by adding the y-coordinate inversion time tito T .
TA D =ti+T (8)
As the y-coordinate inversion is performed once, and not at each iteration, it can be concluded that ti < K tg. In this case TA D < TC D, which shows that the proposed method is faster than two successive RANSAC segment detections. Figure11compares the computation cost, with Matlab scripts, of both methods according to the outlier per- centage. A region of interest having a 50×50 pixels is used for this simulation (see Fig.9), with a realistic number of inliers (30). The results confirm that the proposed method needs low computation time than two segments detection. In practice, for real images, the computation cost is reduced by 40 %.
Multi-scale detection The traffic sign scale in images dep- ends on its distance from the camera. To use the present RSLD method efficiently, the region around the candidate corner where the inversion is applied must be defined pre- cisely. The region size must correspond to the road sign’s dimensions and without depth information, it is impossible to estimate this size. A multi-scale detection process helps to solve this problem. First, a small region r 1 is centered on the selected corner where the corresponding points for RANSAC algorithm are extracted, as shown in Fig.12. If no line is detected, there is no triangle related to this candi- date corner. Otherwise, there remains the length of the line detected in r 1. This process is repeated in regions r 2 to r 5 until the length line L is stabilised, as shown in Fig. 12.
This multi-scale detection helps to estimate the resolution of potential triangles detected and gives the diagonal side length which is L2. At this stage, only diagonal triangle sides are detected and it is necessary to confirm that this shape is a triangular traffic sign with a baseline detection. A typical example is given in Fig.3c.
Fig. 12 Multi-scale detection
(a)
(b)
Fig. 13 Baseline detection. a The horizontal subregion and its his- togram for the triangle oriented upwards. b The horizontal subregion and its histogram for the triangle oriented downwards
3.4 Baseline detection
In road scene images, numerous objects present shapes which are similar to triangular traffic signs. With two diagonal sides and a symmetrical appearance, they can be detected thanks to the previous step (see Fig.3c). These objects are then consid- ered as false positive detections and increase the computation time during the traffic sign recognition phase. The aim is to eliminate such false detections in a final step which consists in triangular shape baseline detection. This step exploits the length L2 obtained previously with the multi-scale detection.
First, a horizontal subregion at L2 sin(π3)distance from the candidate corner position is defined, as illustrated in Fig.13.
Secondly, as the sides of an equilateral triangle are equal, this subregion contains a baseline if the number of pixels from class 3 is L ±, where=0.05 L.
4 Evaluation and discussion
This section, presents the evaluation of the method proposed by giving the ROC curve and by comparing its performance with that of methods presented in recent publications [2,16, 23]. The comparisons are performed with two public image databases and on our experimental images.
Detection quality depends on the threshold s giving the acceptable number of inliers (cf. Sect. 3.3). As this limit depends on the detection scale, s is defined with the following expression:
s=αhi (9)
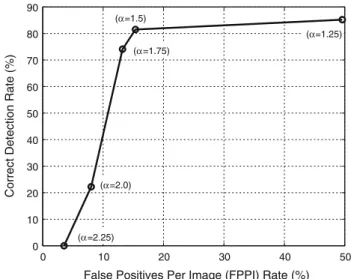
with hi = width(r 1)+10(i −1)where i represents the detection scale and takes the index value of the current region r i . The width of first region r 1 is fixed at 20 pixels. The value of αmust ensure a high correct detection rate and a minimum of false positive per image (FPPI) rate. Figure14 gives the corresponding ROC curve for different values ofα and shows thatα=1.5 provides an interesting compromise on the Stereopolis database [28]. This value gives a correct detection rate of 81 % for a FPPI rate of 15 %.
A first comparison concerns results [16] published in 2011. The author of [16] uses the public available Stereopolis database [28] to compute detection rates of the RPD, VBT and STVUT methods combined with the LCG and EO pre- processing steps. The database is constituted of 847 images from Paris, and there are 27 triangular traffic signs. In Table1, the detection rates of RPD, VBT, and STVUT algorithms are compared with the proposed method. Our method provides a detection rate of 81 % and a FPPI rate of 15 %. Neverthe- less, it can be interesting to note that most false positives (FP) are generated by triangular shapes, see Fig. 20a. The detection rate is equivalent to that obtained with STVUT, the
0 10 20 30 40 50
0 10 20 30 40 50 60 70 80 90
False Positives Per Image (FPPI) Rate (%)
Correct Detection Rate (%)
(α=2.25) (α=2.0)
(α=1.25) (α=1.75)
(α=1.5)
Fig. 14 The ROC curve of the method proposed on the Stereopolis database
Table 1 Comparison of detection rates on Stereopolis database
Method Detection rate (%)
RPD (LCG) 52
VBT (LCG) 74
STVUT (LCG) 78
RPD (EO) 48
VBT (EO) 81
STVUT (EO) 81
Proposed method 81 (FPPI = 15 %)
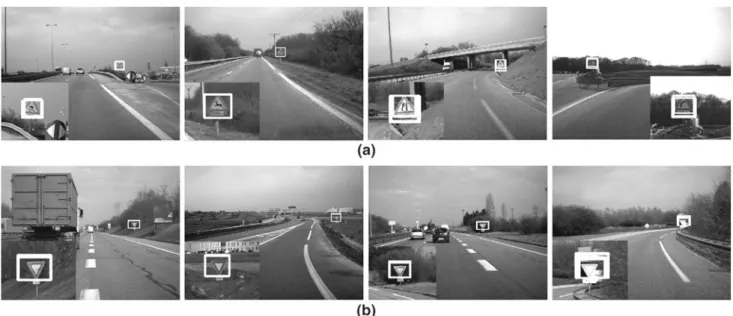
Fig. 15 Detection results: warning and yield traffic signs
0 5 10 15 20 25 30 35 40
10 20 30 40 50 60 70 80 90 100
Standard deviation of the Gaussian noise (gray level unit)
Correct Detection Rate (%)
VBT Our method
Fig. 16 Comparison results with Gaussian noise
best algorithm presented in [16]. This methods are Hough- like approaches using colour information, while the proposed method presents the advantage of similar performance on grey-scale images. The detection rate may even be improved with the introduction of colour information.
Fig. 17 Detection with an additive noise in the images
Fig. 18 Detection with rotation distortion. a An image rotated by an angle of +10◦(left) and−10◦(right). b An image rotated by an angle of +14◦(left) and−14◦(right)
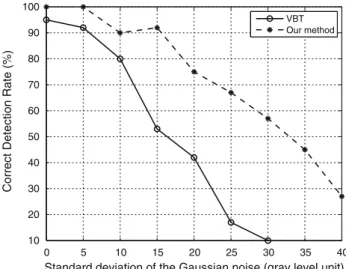
Secondly, the authors of [2] propose to evaluate the robust- ness of the VBT algorithm [3] in the presence of Gaussian noise. This evaluation has been presented in Grigorescu’s database of traffic sign [14] which contains 48 traffic scene images with 40 triangular signs (see Fig.15). The experimen- tal conditions described in [3] have been reproduced. The VBT algorithm and the proposed method are compared by adding different levels of Gaussian noise to images. Figure16 shows the detection rate forσvarying from 0 to 40. The pro- posed method provides the best detection rate, for example forσ =5; the proposed algorithm scores at 100 % while the VBT algorithm at 90 % only. Withσ = 15, the detection rate stays around 90 % (see Fig.17). Therefore, the present approach is more robust to noise than the VBT algorithm because the RSLD algorithm is based on RANSAC which is robust in a noisy environment and the coded image which helps to only select the pixels related to the diagonal sides of a triangular shape. Without noise, VBT algorithm and our method provide respectively 95 and 100 % of detection rate, and 2 and 1 FP.
Fig. 19 Examples of detection with our experimental images. Top row Warning traffic sign detection. Bottom row Yield traffic sign detection
Thirdly, robustness to rotation must be evaluated. The idea is to reproduce rotation that can appear in images when the car takes a tight turn. As the proposed algorithm is based on the pixel classification according to the orientation gra- dient, the rotation angle of the sign can decrease the correct detection rate. Figure18 illustrates the detection in traffic scenes taken from the Grigorescu’s database after adding an angular rotation. The conclusion is that the proposed method keeps the same detection rate if the rotation remains under 10◦.
For RSLD algorithm, blurred or unfocused images should influence the correct detection rate. Indeed, the starting point of our method is based on images gradient with the Harris detector, which detection rate decreases when corners disap- pear due to blur. As VBT is based on symmetry detector, it provides better detection rates than our method. RSLD and VBT methods have been compared when Gaussian smooth- ing filter is applied on Grigorescu’s database images. If stan- dard deviation is lower than 1 pixel, both detection rates remains close to 95 %, but for higher values, our method presents lower performance than VBT. The performance of VBT decreases when standard deviation is higher than 2.
For traffic sign detection, it is assumed that lens is focused at infinity with a fixed focal distance, so it is rare to have blurred images.
Finally, the following results have been obtained with images of the experimental system proposed. This system consists of an Evaluation Camera Kit (ECK1000, Cypress Semiconductor Corporation), designed for automotive appli- cations. The algorithm is implemented in an embedded com- puter with the Real Time Multisensor Advanced Prototyping Software (RTMaps) [18], coupled with the Open Computer Vision (OpenCV) [17] library. The present method runs in
Fig. 20 Examples of false positives, a obtained on Stereopolis data- base and b on our database
real-time at the camera video rate (30 frames per second).
Different traffic situations, have been tests in urban, rural and highway scenes. More than 14,000 frames sizing 640×480 pixels, have been used for the evaluation. The road sections contain 10 triangular warning signs and 13 yield signs. Detec- tion is considered correct if a sign is detected in more than three consecutive frames. The results show a detection rate of 91 % (see Fig.19), with a FPPI of 21 %. The false pos- itives are principally due to objects having similar shape to traffic signs, as shown in Fig. 20b. The undetected traffic signs are those located on highway exits; they are far from the vehicle and thus not clearly visible. As they are not on
the main driving road, their non-detection does not affect the performance of ADAS.
5 Conclusion
This paper has presented a novel approach to triangular traf- fic sign detection. The idea is to detect the corners and the symmetric sides of a triangle. The corners are detected using a well-known Harris detector followed by a corner coding process. This process identifies the up and down corners related to the warning and yield traffic signs. The aim is to detect the symmetric and diagonal sides of a triangle with an original algorithm named RANSAC symmetric lines detec- tion (RSLD). This algorithm is based on the y-coordinate inversion and transforms a symmetric detection problem into a simple line detection. The multi-scale approach developed helps to locate an adapted subregion for a baseline triangle detection.
The experiments and evaluation show that the proposed method gives a detection rate equivalent to that of the lat- est methods published. This method is easy to implement in real-time. A future aim is to combine this triangular traf- fic sign detection with an eye tracking system developed in the MIPS laboratory [4]. For this kind of application, where videos are available, the classification of traffic signs by type is sufficient and will give interesting statistics for driver evaluation.
Future studies will focus on the RSLD method. Instead of performing a simple y-coordinate inversion, this method could be generalised and extended to other symmetric shapes.
References
1. Alefs, B., Eschemann, G., Ramoser, H., Beleznai, C.: Road sign detection from edge orientation histograms. IEEE Intelligent Vehi- cles Symposium, Istanbul, pp. 993–998 (2007)
2. Belaroussi, R., Tarel, J.P.: Angle vertex and bisector geomet- ric model for triangular road sign detection. In: Proceedings of IEEE Workshop on Applications of Computer Vision (WACV’09), Snowbird, pp. 577–583 (2009)
3. Belaroussi, R., Tarel, J.P.: Détection des panneaux de signalisa- tion routière par accumulation bivariée. Traitement du signal 27(3), 265–297 (2010)
4. Bernet, S., Cudel, C., Lefloch, D., Basset, M.: Autocalibration- based partioning relationship and parallax relation for head- mounted eye trackers. Mach. Vis. Appl. 24(2), 393–406 (2013) 5. Cardarelli, E., Medici, P., Porta, P.P., Ghisio, G.: Road signs shapes
detection based on Sobel phase analysis. IEEE Intelligent Vehicles Symposium, Xi’an, pp. 376–381 (2009)
6. Choi, S., Kim, T., Yu, W.: Performance evaluation of RANSAC family. In: Procedings of the British Machine Vision Conference, London, pp. 81.1–81.12 (2009)
7. Cyganek, B.: Real-time detection of the triangular and rectangular shape road signs. In: Proceedings of the 9th International Confer-
ence on Advanced Concepts for Intelligent Vision Systems, vol.
467, Delft, pp. 744–755 (2007)
8. Daniel, J., Lauffenburger, J.P.: Conflict management in multi- sensor dempster-shafer fusion for speed limit determination.
IEEE Intelligent Vehicles Symposium, Baden-Baden, pp. 987–992 (2011)
9. de la Escalera, A., Armingol, J., Mata, M.: Traffic sign recognition and analysis for intelligent vehicles. Image Vis. Comput. 21(3), 247–258 (2003)
10. Fischler, M.A., Bolles, R.C.: Random sample consensus: a par- adigm for model fitting with applications to image analysis and automated cartography. Commun. ACM 24(6), 381–395 (1981)
11. Gao, X.W., Podladchikova, L.N., Shaposhnikov, D.G., Hong, K., Shevtsova, N.: Recognition of traffic signs based on their colour and shape features extracted using human vision models. J. Visual Commun. Image Rep. 17(4), 675–685 (2006)
12. Garcia-Garrido, M.A., Sotelo, M.A., Martm-Gorostiza, E.: Fast traffic sign detection and recognition under changing lighting con- ditions. Intelligent Transportation Systems Conference, Canada, pp. 811–816 (2006)
13. Gómez-moreno, H., Maldonado-bascón, S., Gil-jiménez, P., Lafuente-arroyo, S.: Goal evaluation of segmentation algorithms for traffic sign recognition. IEEE Trans. Intell. Transp. Syst. 11(4), 917–930 (2010)
14. Grigorescu, C., Petkov, N.: Distance sets for shape filters and shape recognition. IEEE Trans. Image Process. 12(10), 1274–1286 (2003)
15. Harris, C., Stephens, M.: A combined corner and edge detector. 4th Alvey Vision Conference, Manchester, pp. 147–152 (1988) 16. Houben, S.: A single target voting scheme for traffic sign detection.
IEEE Intelligent Vehicles Symposium, Baden-Baden, pp. 124–129 (2011)
17. Intel, Intel Open Source Computer Vision Library, v2.3 (2011).
http://sourceforge.net/projects/opencvlibrary/ (Accessed 1 Nov 2011)
18. Itempora, Real Time Multisensor Advanced Prototyping Software, v4.0 (2012).http://intempora.com/(Accessed 20 March 2012) 19. Landesa-Vzquez, I., Parada-Loira, F., Alba-Castro, J.L.: Fast real-
time multiclass traffic sign detection based on novel shape and texture descriptors. 13th International IEEE Conference on Intel- ligent Transportation Systems, Madeira Island, pp. 1388–1395 (2010)
20. Lin, H., Du, P., Zhao, W., Zhang, L., Sun, H.: Image registration based on corner detection and affine transformation. The 3rd Inter- national Congress on Image and Signal Processing, Yantai, pp.
2184–2188 (2010)
21. Liu, Y., Goto, S., Ikenaga, T.: An MRF model based algorithm of triangular shape object detection in color images. Int. J. Inf.
Technol. 12(2), 55–65 (2006)
22. Liu, Y.S., Duh, D.J., Chen, S.Y., Liu, R.S., Hsieh, J.W.: Scale and skew-invariant road sign recognition. Int. J. Imaging Syst. Technol.
17(1), 28–39 (2007)
23. Loy, G., Barnes, N.: Fast shape-based road sign detection for a driver assistance system. International Conference on Intelligent Robots and Systems, Sendai, pp. 70–75 (2004)
24. Maldonado-bascón, S., Lafuente-arroyo, S., Gil-jiménez, P., Gómez-moreno, H., López-ferreras, F.: Road-sign detection and recognition based on support vector machines. IEEE Trans. Intell.
Transp. Syst. 8(2), 264–278 (2007)
25. Paclka, P., Novoviˇcováa, J., Pudilb, P., Somolb, P.: Road sign clas- sification using the Laplace kernel classifier. Pattern Recognit. Lett.
21(13–14), 1165–1173 (2000)
26. Parada-loira, F., Alba-castro, J.L.: Local contour patterns for fast traffic sign detection. IEEE Intelligent Vehicles Symposium, San Diego, pp. 1–6 (2010)
27. Piccioli, G., Micheli, E.D., Campani, M.: A robust method for road sign detection and recognition. In: Proceedings of the Third European Conference on Computer Vision, vol. 800, Stocklholm, pp. 493–500 (1994)
28. Stereopolis database (2012). http://www.itowns.fr/roadsign.php (Accessed 20 Jan 2012)
29. Wang, X.G., Wu, F.C., Wang, Z.H.: Harris feature vector descriptor (HFVD). 19th International Conference on Pattern Recognition, vol. 1, Tampa, pp. 1–4 (2008)
30. Zaklouta, F., Stanciulescu, B.: Warning traffic sign recognition using a HOG-based K-d tree. IEEE Intelligent Vehicles Sympo- sium, Baden-Baden, pp. 1019–1024 (2011)
Author Biographies
Mohammed Boumediene obtai- ned the M.Eng. degree in com- puter science and an M.Sc.
degree in image processing at the Université des Sciences et Technologie Mohamed Boudiaf, Oran, Algeria, respectively in 2004 and 2006. He is currently working on a Ph.D. degree, with a focus on traffic-sign recog- nition systems, in Laboratoire Signaux et Images of Univer- sité des Sciences et Technologie Mohamed Boudiaf, Oran, Alge- ria. His research interests include computer vision, object detection, multi-object association, and intelli- gent transportation systems.
Christophe Cudel obtained his Ph.D. at the University of Reims Champagne Ardenne in 1995. He joined the MIPS laboratory, Uni- versité de Haute Alsace, Mul- house, France, as assistant pro- fessor in 1997. His research areas include computer vision, eye tracking and 3D monocular vision.
Michel Basset was born at Chalon-Sur-Saône, France, in 1962. He obtained his Ph.D. at the Université de Haute-Alsace in 1991. He is currently inves- tigating modelling and identifi- cation for diagnosis and control applications. His main research interests include the develop- ment of sensors, stability analy- ses and design of driving aid sys- tems in the automotive and aero- nautic domains. He is currently a Professor at the Université de Haute-Alsace. He teaches elec- trical engineering at the ENSISA engineering school.
Abdelaziz Ouamri was born in Algeria. He obtained an Engi- neer Degree in Electrical Engi- neering from ENSI (CAEN), an M.Sc. in automatic and signal processing from the Université Paris XI in 1979, a Ph.D. in Engi- neering in 1981 and a “Doctorat d’Etat” in signal processing from the Université Paris XI in 1986, France. He is currently a Profes- sor at the Université des Sciences et Technologies of Oran, Algeria.
His research interests are focused on high-resolution spectral array processing methods, detection and tracking of the moving objects. Dr.
Ouamri received in 1990 the senior award from the IEEE Signal Process- ing Society in the Spectrum Estimation Technical area.
![Fig. 1 The voting scheme of VBT and STUVT. a Scheme for the voting method of VBT. b Scheme for the voting method of STUVT [16]](https://thumb-eu.123doks.com/thumbv2/123doknet/7781861.258619/2.892.464.814.82.370/voting-scheme-stuvt-scheme-voting-method-scheme-voting.webp)
![Fig. 7 Results of corner coding on 32 images of Grigorescu’s database of traffic signs [14]](https://thumb-eu.123doks.com/thumbv2/123doknet/7781861.258619/5.892.462.806.500.813/results-corner-coding-images-grigorescu-database-traffic-signs.webp)