Contributions of the driven process and the loading-unloading process during
substorms: A study based on the IMAGE-SI12 imager
C. Blockx,1 J.-C. Gérard,1 V. Coumans,1 B. Hubert,1 and M. Meurant1
1Laboratoire de Physique Atmosphérique et Planétaire, Université de Liège, Liège, Belgium.
[1] Substorm energetics has been shown to have two components, the “loading-unloading” component releasing energy previously stored in the tail and the “directly driven” component dissipating simultaneously fed solar wind energy Previous studies disagree about the relative importance of each process. The SI12 spectral imager onboard the IMAGE satellite provides images of the Doppler-shifted Lyman α auroral emission at 121.8 nm every 2 min. It has been used to determine the auroral intensity during substorms, which may be compared to the solar wind characteristics and interplanetary magnetic field components before and/or after substorm onsets. In this study, we analyze 256 substorms between June 2000 and December 2002, which satisfy criteria relative to the viewing conditions. We compare the mean nightside intensity during the expansion phase with the magnetic open flux, the epsilon parameter, and other coupling functions (used as proxies of transfer of solar wind energy to the magnetosphere) integrated over the growth phase or the expansion phase. The mean auroral intensity during the expansion phase correlates well with coupling functions integrated over the growth phase. We also find that the correlation between the auroral precipitation during the expansion phase and the coupling functions integrated over the expansion phase is lower but still significant. This implies that, even though both
mechanisms contribute to the energy precipitated during substorms, the loading-unloading process is statistically dominant.
1. Introduction
[2] Following eruption from the Sun, carrying the inter-planetary magnetic field, plasma can penetrate the magnetic shielding of the Earth. A magnetic reconnection process at the dayside magnetopause allows energy transfer during times of predominantly southward interplanetary magnetic field (IMF) [Dumgey, 1961], while a smaller fraction of the plasma and energy can also be transferred via viscous processes [Axford and Hines, 1961]. The merging of field lines and penetration of particles represent an energy transfer into the
magnetosphere. Two physical processes are considered to be of importance in the dissipation of this energy input from the solar wind. One of these is the “directly driven process” in which energy, supplied from the solar wind, is directly dissipated in the auroral ionosphere and ring current with a delay (~20 min) being due to the
inductance of the magne-tosphere-ionosphere system. The other is the “loading-unloading process” in which energy from the solar wind is first stored in the magnetotail for some arbitrary period of time and then is suddenly released to be deposited in the auroral ionosphere and ring current as a consequence of external changes in the interplanetary medium or internal triggering processes [Bargatze et al., 1985; Tsurutani et al., 1985; Rostoker et al., 1987; Liou et al., 1998]. The directly driven processes can be convection events with no subsequent substorm or convection signatures prior to the substorm breakup during the substorm growth phase [Baker et al., 1997]. The loading-unloading event refers to the storing of energy during growth phase and the abrupt substorm breakup followed by a global expansion of the auroral oval. During substorms, one or the other of the two above processes may dominate for any individual case [Rostoker et al., 1987].
[3] In the original definition of the auroral substorm presented by Akasofu [1964], substorm development is divided into two main phases: an explosive expansion phase whose beginning defines the onset of the substorm, and a more gradual recovery phase. A third stage, the growth phase, a period of time prior the onset of the expansive phase usually lasting between 30 and 60 min, was first described by McPherron [1970]. This is the initial phase of many substorms, which starts following a southward turning of the interplanetary magnetic field (IMF), during which the energy required to supply the substorm explosive phase is stored in the magnetotail. In this model, emphasis is laid on the storage of the energy in the magnetotail (i.e., loading) and the subsequent explosive release of this energy (i.e., unloading) during the substorm expansive phase. The subsequent controversy surrounding the acceptance of the growth phase hypothesis centered around the auroral zone signatures attributed to the growth phase and in particular to the slow growth of the H component of auroral zone perturbations [Rostoker et al., 1987].
[4] The transfer of energy from the solar wind to the magneto sphere, which is the ultimate source of the nightside auroral precipitation, has been the object of extensive studies. Arnoldy [1971] used the north-south component of the IMF as a signature in the interplanetary medium for substorms. Gonzalez and Mozer [1974] suggested that the energy transfer through dayside reconnection depends on the component of the interplanetary electric field normal to the Sun-Earth line. Akasofu [1981] suggested a first approximation expression for the solar wind-magnetosphere energy coupling function, the Akasofu energy input parameter epsilon:
where Vsw is the solar wind speed, B the strength of the IMF, θc the IMF clock angle (the polar angle of the
component of the IMF normal to the Sun-Earth line measured from the northward geomagnetic axis), l0 (~7 RE)
is a constant with dimensions of distance. The ε parameter, first introduced by Perreault and Akasofu [1978], is a semiempirical function which has been shown to approximate the solar wind energy input to the magnetosphere due to dayside reconnection. It was proposed to correlate well with the total energy UT dissipated in the
ionosphere and deposited in the inner magnetosphere per unit time. In the original definition, UT was composed
of three separate components: (1) energy increase of the ring current UR, (2) kinetic energy UAof auroral
particles being lost in the ionosphere because of collisions, and (3) Joule heating of the atmosphere UJ being
associated with electric current flow in the resistive ionosphere.
[5] These are the three most important forms of ionospheric and magnetospheric energy dissipation [Akasofu, 1981; Baker et al, 1997; Knipp et al, 1998], although other forms of energy release such as plasma sheet heating and the energy returned to the solar wind by plasmoid ejections from the tail have been considered as well [Baker et al, 1997; Ieda et al, 1998; Lu et al, 1998]. The correlation study of magnetospheric energy dissipation and deposition with solar wind input carried out by Perreault and Akasofu [1978] showed, to a first
approximation, that ε(t) ~ UT (t) [Akasofu, 1981]. They showed that ε is the primary factor controlling the time
development of the magnetospheric substorms and storms. This expression indicates that the solar wind and the magnetosphere work together as a dynamo, by means of which the solar wind exchanges its energy with the magnetosphere. Other empirical functions were subsequently proposed by different authors to describe the strength of solar wind-magnetosphere coupling. Vasyliunas et al [1982] searched for a functional dependence on solar wind parameters of the rate of energy transfer from dimensional analysis constraints. They found that the energy transfer depends on the solar wind dynamic pressure, velocity, and transverse IMF orientation. Wygant et al [1983] used S3-3 measurements of the polar cross polar cap electric potential and compared them with the reconnection electric fields predicted by several theoretical and experimental models. They found best agreement for a dependence on θc, the angle between the transverse component of the IMF and the Earth's magnetic field at
the magnetopause, with a fourth power of sin θc. Other factors influencing the reconnection efficiency are the
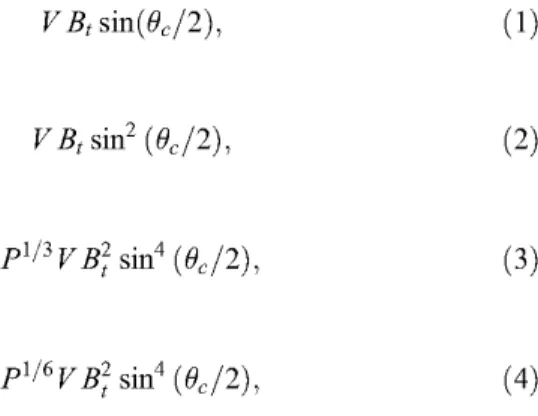
solar wind velocity and the absolute value of the transverse component of the IMF. Liou et al. [1998] made a correlative study of the auroral power derived from Polar UVI observations with the concurrent solar wind and IMF observations from the Wind satellite. Their conclusion was that the response function for nightside aurora is best represented by VBt sin4(θc/2) or P1/6 VBt sin4(θc/2) transfer functions. Coumans et al. [2006] showed that the
most appropriate functions to describe the energy released in the proton aurora are V Bt sin(θc/2), V Bt sin2(θc/2),
P1/3 VBt2 sin4(θc/2), and P1/6 VBt2 sin4((θc/2), where Bt is the transverse magnetic field. The first two are
alternative proxies based on the transverse solar wind electric field in the Y-Z plane, while the others assume that the amount of energy transferred from the solar wind to the magnetosphere is proportional to the solar wind kinetic energy intercepted by the magnetopause.
[6] Dungey [1961] published a pioneering work sketching the general dynamics of the Earth's magnetic field line interaction with the solar wind. The “Dungey cycle” describes how field lines of the planetary magnetic field are open at the dayside magnetopause by reconnection with the interplanetary magnetic field carried by the solar wind, convected antisunward by the solar wind flow, then reconnect in the nightside tail thus returning to a closed topology, and are finally convected back to the dayside. The four steps of this cycle take place
simultaneously in the magnetosphere almost all the time, creating the polar ionospheric convection. Cowley and Lockwood [1992, and references therein] summarized how the sign of each IMF component influences the dayside reconnection and the convection flow pattern. In particular, significant magnetic flux opening is expected when the IMF Bz component is southward (i.e., negative), but becomes greatly reduced when the IMF points northward. The opening of magnetic flux at the dayside creates the necessary conditions to produce substorms via an accumulation of open magnetic flux and hence field energy in the magnetic tail. The period of time preceding a substorm expansion during which the magnetosphere “accumulates” open magnetic flux is often referred to as the growth phase [McPherron, 1970]. This phase is characterized by an increase in the area
of the polar cap, because at that time, the rate of opening of magnetic flux on the dayside exceeds that of flux closure in the far tail.
[7] At some stage of the substorm cycle, intense magnetic flux closure starts in the tail along a neutral line closer to the earth, with a localized brightening of the auroral emission. This is the onset, that starts the substorm expansion phase during which magnetic field lines that have previously been opened at the dayside and convected downtail by the solar wind reconnect within the tail plasma sheet, causing a substantial flux closure which releases large amounts of accumulated field energy to the plasma particles. This reconfiguration of the tail magnetic field takes place together with poleward expanding auroral particle precipitation, and modification of the electric field, plasma flow, and currents flowing in the coupled magnetosphere-ionosphere system. The substorm cycle ends with the recovery phase during which magnetic flux closure still takes place at a lower rate. From that standpoint, any coupling function describing the energy exchange between the solar wind and the magneto-sphere should account for the rate of magnetic reconnection on the dayside. Both dayside and nightside reconnection of field lines are associated with potential drops across the open/ closed field line boundary, as can be understood by considering Faraday's law [Siscoe and Huang, 1985; see also Grocott et al., 2002; Milan et al., 2003, 2004; Milan, 2004, and references therein]. The rate of magnetic reconnection can thus be expressed as a voltage by integrating Faraday's law. In first approximation, the flux opening voltage is proportional to the solar wind electric field and the length of the reconnection site. The electric field is the cross product of the IMF and solar wind velocity, and 5-8 RE can be considered as a reasonable effective length for the reconnection site
[Hubert et al., 2006; Milan et al., 2007]. The shape of the bow shock and magnetopause could, in principle, play a role as well in the process of dayside reconnection, so that parameters governing the physics of these
boundaries, such as the solar wind dynamics pressure for example, can also be of importance. Indeed, the most efficient coupling functions that are proposed in the scientific literature always include a product of the solar wind velocity and IMF component, obviously pointing to the solar wind electric field, some of them also include the dynamic pressure. The dynamic pressure does, however, not only influence the magnetospheric outer boundary, but also the internal flow and structure of the magneto sphere, because it influences the pressure balance equilibrium between the interplanetary and magnetospheric medium.
[8] Shukhtina et al. [2005] recently demonstrated the importance of the loading-unloading substorm concept powered by reconnection. They analyzed the magnetotail magnetic flux at substorm onset as a function of solar wind parameters to show that the tail magnetic flux stored during the growth phase (∆FT) mainly depends
(r = 0.95) on the merging electric field Em = VSWBtsin3(θc/2). This implies a lack of threshold magnetic flux at
substorm onset. Also, the magnetic flux through the auroral bulge at substorm maximum (FB) was calculated
from Polar UVI images. Comparison of ∆FT and FB shows their close correlation and confirms their balance.
These results quantitatively support the loading-unloading substorm scheme, on the basis of re-connection mechanism of the auroral bulge formation. By contrast, Pulkkinen et al. [2006] analyzed results from global MHD simulation with the GUMICS-4 model and compared the energy input rate with the conversion and dissipation rates in the magneto sphere and ionosphere. They concluded that the energy entering the magnetosphere is processed by the system without delay. This led them to suggest that the role of energy accumulation during the substorm growth phase is to facilitate the configuration change rather than to store energy for later dissipation. They argue that, while the change of magnetotail stability requires configuration change, the substorm energetics after the onset is quite directly driven by the solar wind energy input.
[9] In this study, observations made with the FUV instruments on board the IMAGE satellite have been used to examine the energy deposition (UA) in the Northern Hemisphere by precipitating electrons and protons for the
256 selected substorms between June 2000, and December 2002. The global auroral precipitation, which is an estimator for UA, is analyzed before and during substorms and compared with solar wind energy input proxies,
such as the magnetic open flux, the ε parameter, or other coupling functions. We show that the mean auroral intensity during the expansion phase correlates well with coupling functions integrated over the growth phase. We also find that the correlation between the auroral precipitation during the expansion phase and the coupling functions integrated over the expansion phase is lower but still significant. This implies that, even though both mechanisms contribute to the energy precipitated during substorms, the loading-unloading process is statistically dominant.
2. Instrumentation and Methodology 2.1. IMAGE Data
[10] Satellite-based observations of the proton aurora were for a long time restricted to in situ satellite particle detection. Until the availability of the IMAGE satellite, no capability existed for global remote sensing of the
proton aurora. Since its launch in March 2000, the FUV instrument provides the capability to simultaneously observe the aurora with a 2-min resolution in three spectral bands: (1) the Wideband Imaging Camera (WIC) observes the aurora in broad (1350-1700 Å) ultraviolet band sensitive mainly to LBH N2 bands and NI lines, (2)
the SI12 spectral imager isolates a narrow region (2 A) with a peak sensitivity at 1218 Å and images Doppler-shifted Ly α auroral emission, and (3) the SI13 spectral imager selects a 50 Å passband centered on the O I 1356 Å feature.
[11] The response of these instruments was validated by laboratory and in flight calibrations using hot stars and was daily updated [Frey et al., 2003]. SI12 was designed to monitor the global-scale proton precipitation. It includes a grill system to reject the intense (>10 kR) geocoronal Ly α emission at 121.5 nm, which would otherwise appear as an bright diffuse glow, and to isolate a fraction of the Doppler-broadened auroral Ly α line profile [Mende et al., 2000a, 2000b]. Since this emission is emitted by excited fast hydrogen atoms, the line profile for a given observation geometry depends on the energy spectrum of the incident auroral protons and their pitch angle distribution. In addition, the response of the SI12 instrument with its multiple passbands depends on the Ly α line profile [Gérard et al., 2001]. The shape of this profile is also influenced by the orientation of the line of sight with respect to the local magnetic field lines. The complexity of the atmospheric and instrumental processes involved makes it necessary to simulate the SI12 response for a range of parameters describing the proton precipitation and the geometry of the observations. The drop in efficiency of the SI12 detector for energy higher than ~10 keV results from the increasing importance of other processes such as ionization competing with excitation into the H(2p) state as the initial proton energy increases [Strickland et al., 1993; Gérard et al., 2000]. The instrument efficiency also drops for low-energy proton precipitation owing to the lack of an extended red-shifted Ly α wing.
2.2. Solar Wind Data
[12] The IMF data used in this study were obtained by the Magnetic Field Experiment (MAG) on the Advanced Composition Explorer (ACE) satellite [Smith et al., 1998] with a time resolution of 16 s. Plasma data were collected by the Solar Wind Electron Proton Alpha Monitor (SWEPAM) on ACE [McComas et al., 1998] with time resolution of 64s (these data are courtesy of the NASA CDA Web site). ACE measures far from the Earth, at the L1 libration point (~220 RE upstream of Earth). ACE data are propagated to the bow shock using the
Weimer et al. [2002, 2003] pseudominimum variance technique. A delay of 4 min was added to consider the propagation to the ionosphere. Each FUV image can thus be related to the characteristics of the solar wind reaching the magnetosphere close to the time the image was taken.
2.3. Selection of Substorm Events
[13] For this study, we consider the period from 1 May 2000 to 31 December 2002, during which the north polar region was optimally viewed by the FUV imagers. Substorm events are selected from the list given by Frey et al. [2004], This list provides times and positions of all onsets observed with the WIC camera. From this list, we selected only isolated events which are entirely observed by IMAGE-FUV. We defined an “isolated event” as an event separated from the previous and the next one by at least 2 h. Such isolated events are added to our list only if it is entirely observed, i.e., if FUV data are available from 90 min before to 90 min after onset with a delay of at most 10 min between two consecutive images (i.e., 5 consecutive missing images). Data containing dark bands (because of a mass memory problem in the spacecraft) and too small field of view of the nightside
(because of a nonfavorable geometry of observation) are also excluded. The requested coverage is the 2100-0300 MLT -60°-90° MLAT sector which must be filled during the 90 min before to 90 min after the onset. In addition to those conditions, some visual criteria are also applied to define the set of substorms used for this study. To be considered, an event has to satisfy these following criteria: (1) a signal/noise ratio that allows the oval to be distinguished from the background, (2) correct pointing information: an event is rejected if the coordinate grid presents obvious anomalous displacement between two consecutive images or if the oval is badly positioned on the coordinate grid, and (3) avoid data with view angle distorting single pixels and making them as large as the oval (because of bad viewing angles).
[14] These restrictions drastically decrease the number of events compared to the Frey et al. [2004] list from 2437 to 262 events. Finally, we made a visual selection to verify if all these brightening events are real substorms. We rejected 6 cases which were poleward boundary intensifications (PBI). This type of auroral intensification is expected to relate quite differently to the solar wind input, particularly as regards growth phase conditions (PBIs have no growth phase). The final selection thus contains 256 events.
2.4. Nightside and Proton Precipitation
[15] We avoid residual dayglow contamination by not considering the dayside sector, from 6 MLT to 18 MLT. We only consider nightside precipitation, where the onset and the expansive phase are the most often wholly observable. Furthermore, the SI12 images are preferred to SI13 and WIC, despite the higher sensitivity of the latter camera, and to a lesser extent the SI13 camera, since these imagers are more subject to dayglow contamination. Instead, the Doppler-shifted Lyman α emission less suffers from this drawback because these photons are emitted directly by the precipitating protons capturing an electron. SI12 images are not contaminated by dayglow emissions in the nightside sector and are thus well suited for a systematic determination of the auroral emission boundary. We also checked that using the SI12 (protons) or the WIC (electrons) camera leads to similar results of this study. Indeed, proton precipitation averaged on the nightside sector follows with the same proportion as the electron precipitation on the nightside sector. The time evolution of the global proton
precipitation observed by SI12 may thus be considered as representative for the total auroral energy
precipitation. For the reasons described below, in this study we use the SI12 camera to monitor and compare the auroral precipitation during substorms with the solar wind energy input proxies, such as the magnetic open flux, the ε parameter, or other coupling functions.
2.5. Methodology
[16] For each of the selected events, we used the FUV SI12 images to determine the equatorial and polar boundaries of the auroral oval. A threshold was determined on a statistical basis to discriminate between the auroral signal and the image background. This threshold had to be accurately determined, as the boundary sought corresponds to the limit where the auroral emission drops to zero as was described by Hubert et al. [2006]. After removing the background, we then only considered the nightside sector to calculate the “nightside intensity” of the auroral precipitation for each image every 2 min, which is the sum of the counts collected by the pixels between the equatorial and polar boundaries of the auroral oval, in the nightside sector. This value is an estimation of the energy deposition (UA) in the Northern Hemisphere by precipitating particles.
[17] After looking at the time history of the intensity over substorm cycles, we adopted the convention that the expansion phase of a substorm ends when the nightside intensity falls to the half the maximum reached subsequently to the onset. The growth phase is taken for all events as a 40-min period before the onset. In fact we have no possibility to know for certain and accurately when the growth phase starts, whereas 40 min is a mean time period for growth phases (the length of the growth phase is the most often between 25 and 60 min [Coumans et al., 2007]). We finally compare the nightside intensity averaged over the expansion phase with (1) the magnetic open flux, (2) the ε parameter, and (3) coupling functions (most appropriate to describe the energy released in the proton aurora) averaged or integrated over (1) the growth phase or (2) the expansion phase. 3. Results
3.1. Magnetic Open Flux
[18] As mentioned before, the advantage of using the SI12 images of the proton aurora to estimate the location of the proton oval equatorial limit and the open/closed field line boundary is the absence of dayglow
contamination, despite limitations described by Hubert et al. [2006]. Then the open magnetic flux is given by
where is the vector normal to the area S inside this boundary, and the Earth's magnetic field. The poleward boundary estimated from the SI12 images is taken to be the open/closed field line boundary and the integral is calculated over the area delimited by it. The study of the evolution of the open flux during growth phases shows that the open magnetic flux increases by as much as 33% during this phase of the auroral substorm development [Coumans et al., 2007]. This feature is the signature of the storage of magnetic energy in the magneto sphere originating from the solar wind through dayside magnetic reconnection between the geomagnetic field and the IMF. Consequently, one might intuitively expect that the amount of energy released during the substorm expansion phase depends on the amount of magnetic open flux opened during the growth phase.
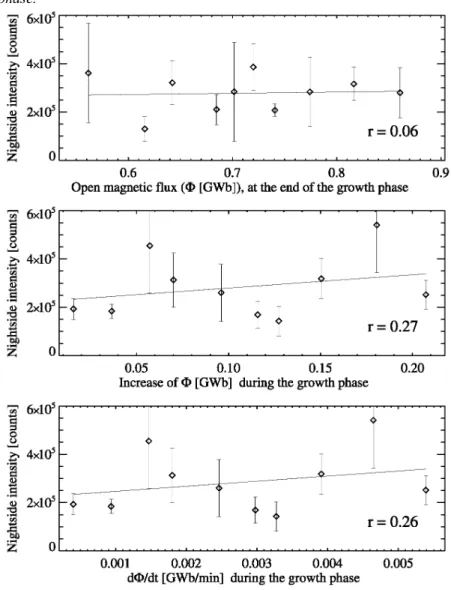
Figure 1. Comparison between the nightside intensity averaged over the expansion phase and (top) the open magnetic flux at the end of the growth phase, immediately preceding the substorm onset; (middle) the increase of the magnetic flux between the beginning and the end of the growth phase; and (bottom) the rate of increase during the growth phase.
[19] Figure 1 shows the nightside intensity averaged over the expansion phase as a function of the open magnetic flux at the end of the growth phase, immediately preceding the substorm onset (top), the increase of the magnetic flux between the beginning and the end of the growth phase (middle), and the rate of increase during the growth phase (bottom). These observations correspond to the 256 events selected from the list given by Frey et al. [2004], and are grouped into 10 bins, each bin containing 26 events. The solid line is the linear regression through the bins, and the vertical bars correspond to the standard deviation of individual values in each bin. These results yield an unexpectedly very low correlation, which means that the magnetic open flux accumulated during the growth phase does not predict the amount of the kinetic energy (UA) of auroral particles released
during the substorms. However, this result does not imply that the magnetic open flux accumulated during the growth phase is not well correlated with the total energy UT dissipated in the ionosphere and deposited in the
inner magnetosphere, since the part of energy released to increase the ring current (UR) and Joule heating of the
atmosphere UJ cannot be evaluated in this study. The value of the magnetic open flux at the onset time provides a
slightly higher correlation (r = 0.06 (Figure 1, top)) with the auroral intensity than the increase of the magnetic flux (r = 0.27 (Figure 1, middle)) and the rate of increase (r = 0.26 (Figure 1, bottom)) during the growth phase. However, the regression coefficients on the nonbinned data (272 events) are r = 0.19 for the magnetic open flux at the onset time (Figure 1, top), r = 0.25 for the increase (Figure 1, middle) and for the rate of increase (Figure 1, bottom) of the magnetic flux during the growth phase. This lack of correlation between the magnetic open flux and the auroral energy released during substorms led us to examine other proxies of transfer of solar wind energy to the magnetosphere, such as the epsilon parameter and other coupling functions.
3.2. Epsilon Parameter
[20] Figure 2 shows the nightside intensity averaged over the expansion phase, compared with the ε parameter integrated over the growth phase time period. The data points (corresponding to the 256 selected events) have been binned again into 10 groups of 26 events. The vertical bars correspond to the standard deviation of each bin. This is a test of the loading-unloading process, where the magnetosphere accumulates energy during the growth phase and releases it during the expansion phase. Figure 3 compares the nightside intensity during the expansion phase with the ε parameter. However, in this case, ε is integrated over the expansion phase, which is an illustration of the driven process: the energy released during the expansion phase is that entering the magnetosphere at the same time.
[21] These two results show a similar trend, namely that the expansion phase of the substorm is unambiguously more intense when the ε parameter is large. However, the loading-unloading process exhibits a very high linear correlation coefficient of r = 0.90, compared to r = 0.66 for the driven process. It is also interesting to mention that the regression coefficients on the nonbinned data are r = 0.65 for Figure 2 and r = 0.57 for Figure 3. 3.3. Other Coupling Functions
[22] As described in section 1, Coumans et al. [2006] showed that the coupling functions which had a significant correlation with the energy released in the proton aurora are
where Bt is the transverse magnetic field. The first two ((1) and (2)) are alternative proxies based on the
transverse solar wind electric field in the Y-Z plane, while the others ((3) and (4)) assume that the amount of energy transferred from the solar wind to the magnetosphere is proportional to the solar wind kinetic energy intercepted by the magnetopause. On the basis of their conclusions, we investigated the correlation between these four coupling functions and the nightside intensity during the selected substorms. The last two coupling functions ((3) and (4)) do not provide useful results because no trend is apparent, and these results are not shown.
Figure 2. Relationship between the nightside intensity during the expansion phase and the epsilon parameter integrated over the growth phase (loading-unloading process case).
Figure 3. Relationship between the nightside intensity during the expansion phase and the ε parameter integrated over the expansion phase time period (driven process case).
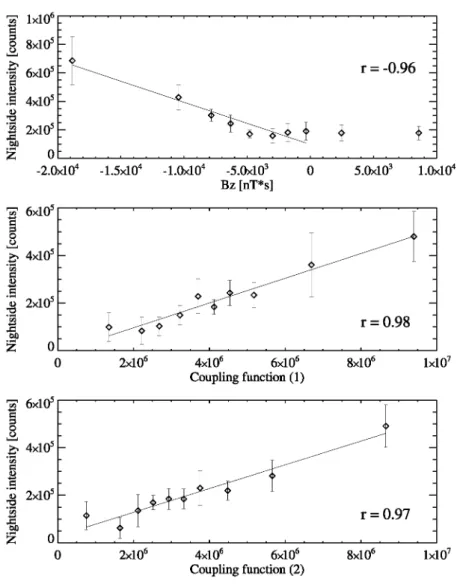
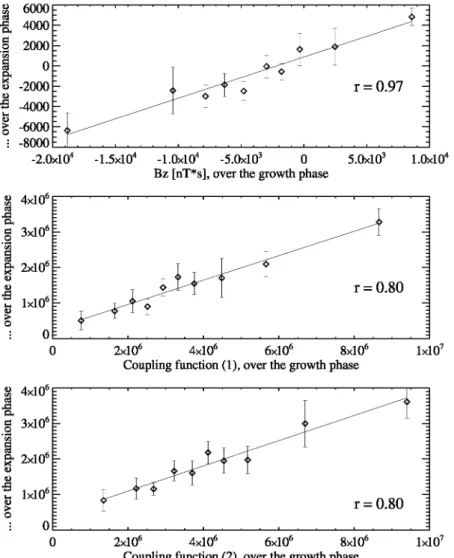
Figure 4. Comparison between the nightside intensity during the expansion phase and (top) BZ, (middle)
coupling function (1), and (bottom) coupling function (2) integrated over the growth phase (loading-unloading process case).
[23] Figure 4 compares the nightside intensity during the expansion phase with Bz (top), and with the coupling
functions (1) (middle) and (2) (bottom), integrated over the growth phase (case of the loading-unloading
process). Figure 5 represents the comparison between the nightside intensity during the expansion phase with the same functions (Bz (top) and the coupling functions (1) (middle) and (2) (bottom)), which are in this case
integrated over the expansion phase (illustration of the driven process). In Figures 4 and 5 (top), the substorm intensity increases with negative Bz values. Inversely, Figures 4 and 5 (middle and bottom) show that the
nightside aurora is most intense when coupling functions (1) and (2) are high. This conclusion agrees with many previous studies [Liou et al., 1998]. We find that the nightside intensity during the expansion phase is very well correlated with Bz and the coupling functions integrated over the growth phase (up to r = 0.98). The regression
coefficients on the nonbinned data in this case are r = -0.49 for Bz, r = 0.62 and r = 0.64 for the coupling
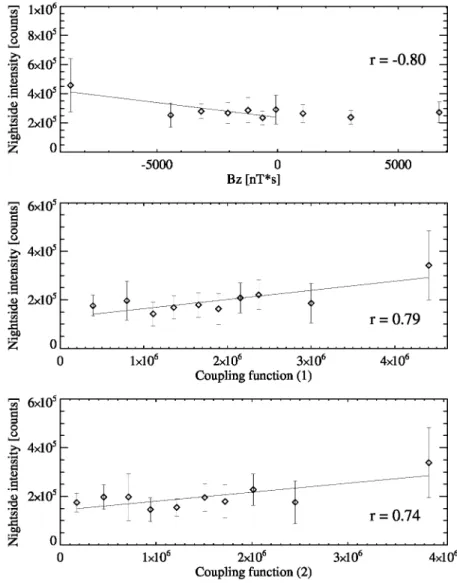
functions (1) and (2) respectively. We also find that the correlation between the nightside intensity during the expansion phase and the coupling functions integrated during the expansion phase is lower but still significant (up to r = 0.80). For the nonbinned data, r = -0.28 for Bz, r = 0.54 and r = 0.53 for coupling functions (1) and (2).
[24] These results imply that both mechanisms contribute to the energy release during substorms. However, the statistically dominant process is the loading-unloading process. We note that Bz and the coupling functions (1)
and (2) integrated over the growth phase on the one hand, and integrated over expansion phase on the other hand, are very well correlated (r ~ 0.97 for Bz, and r = 0.8 0 for the coupling functions) (as shown in Figure 6). This is not unexpected since only about ~25% of the substorm events are triggered by Bz or BY changes [Coumans et al.,
2007]. This result explains why the results in both cases (the loading-unloading and the driven process) are so similar.
4. Discussion
[25] The rather low correlation of the substorm intensity with the amount of open flux prior to the onset is not necessarily surprising. First, in this study, we have not taken into consideration the energy stored in the near Earth plasma sheet. This energy has been stored during the growth phase and is reflected in the stretched field line configuration across the midnight sector inside ~ 12 RE. Dipolarization as detected at geostationary orbit
reflects the release of this energy at the time of expansion phase onset. This stored energy is not reflected in the size of the polar cap, and hence it is not surprising that we find a weak relationship between UAand the amount
of magnetic flux stored in the tail lobes. Second, it appears that in the list of 256 events, a large part of the events are either pseudobreakups or intensifications which do not follow a change in the polar cap size. Onsets can occur even thought the polar cap size does not change during the growth phase. That is, reconnection in the tail balances merging on the dayside during such intervals. Indeed, the comparison of the magnetic flux with the proton precipitation on the list of 256 events shows a very low correlation (Figure 1). A comparison based on a stricter selection, such as the 55 events analyzed by Coumans et al. [2007], which only includes cases exhibiting a significant equatorward motion of at least one of the precipitation boundaries during the growth phase, has been made. It gives higher correlations between the magnetic open flux and the proton precipitation, up to R = 0.74, as illustrated in Figure 7. Furthermore, VBz sin(θc/2)n has been found in the past to be a good estimate of the
dayside reconnection rate and hence, since the ε parameter and the coupling functions are well correlated with the proton precipitation, the rate of opening of magnetic flux should be correlated too with the auroral precipitation. We found that the comparison between the magnetic open flux and the ε parameter provides no correlation (R = 0.16, not shown) for the 256 events, while it provides a much higher correlation (R = 0.72) for the sample of the 55 events. Third, auroral activity rather depends on the amount of flux closed after the onset. This suggests that the activity of the expansion phase of the substorm decays, not as a consequence of a lack of open flux in the magnetosphere as a whole. Instead this decay is observed when the reconnection site stops being fed with open flux by the general dynamics of the coupled solar wind-magnetosphere system, of which
convection is one of the most striking signatures.
[26] The point at which the process that releases energy during the reconfiguration of the open flux-loaded magneto-sphere appears as dependent on other parameters than the single open flux content of the system. Indeed, the coupling functions considered in this study do not only include a contribution related to the solar wind electric field responsible for the open flux production on the dayside, but also other parameters such as the IMF clock angle and the dynamic pressure. In view of the correlations revealed by our sample, including a dependence on the solar wind dynamic pressure (coupling functions (3) and (4) in section 3.3.) does not improve the correlation between the coupling functions estimated during the growth phase and the auroral response. However, a compression of the nightside magnetosphere has the natural consequence of moving the
magnetospheric plasma toward the plasma sheet, thus adapting the pressure balance of the system, and, as a side effect, of moving open flux tubes toward a potential reconnection site. This does however not appear to translate into a higher auroral response in our data set. At least two possible explanations of this apparently odd result can be put forward. Either the inclusion of the dynamic pressure introduces more noise than physical information in our analysis, or the pressure influences the flow in such a manner that the reconnection process becomes more sensitive to some small variations of the properties of the magnetospheric plasma, making the response more chaotic from a statistical standpoint, and thus reducing the correlation coefficients. It is also interesting to mention that the correlations between the ε parameter and the auroral precipitation (corresponding to Figures 2 and 3) applied on the selection restricted to 55 events are very similar than those found in the study of the 256
events: R = 0.88 for the loading-unloading process and R = 0.72 for the driven process (not shown).
Figure 5. Comparison between the nightside intensity during the expansion phase and (top) Bz, (middle)
coupling function (1), and (bottom) coupling function (2) integrated over the expansion phase (driven process case).
[27] As shown in Figure 6, the solar wind properties prior to and after onset are correlated. This introduces some ambiguity in our analysis. The higher correlation of the transfer functions with the auroral response (as compared with that of the open flux with the auroral response) may partly stem from a direct driving of the flux closure process by the solar wind conditions during the expansion phase. From this standpoint, the dependence of the expansion phase properties on the magneto sphere-solar wind interaction would have a double effect. In a first stage, the magnetosphere is loaded in energy during the growth phase. In a second stage, the relaxation of the magnetosphere during the expansion phase would be partly stimulated by the solar wind, whose properties directly influence the magnetospher-ic convection. These two aspects are obviously not mutually exclusive, which partly reconciles our results with those of Pulkkinen et al. [2006]. This latter study was however based on MHD simulations of the space environment, which can also partly bias our view of the problem. Indeed, although the flow and density computation of an MHD model can be considered as very reliable, the study of processes that involve flux opening and closure pushes these models to their limits. As Pulkkinen et al. [2006] pointed it out in their discussion, substorm dynamic includes consideration of current sheets with a thickness comparable with the ion Larmor radius. This is precisely a typical size scale where the MHD hypothesis becomes less accurate. The numerical scheme can then partly contribute to the reconnection process through numerical diffusion, thus producing a complex combination of numerical and physical effects (unless this numerical artifact would have been properly inhibited in the numerical modeling). Detailed modeling of the
reconfiguration of the magneto-spheric field through reconnection in a system having the size and complexity of the magnetosphere remains a challenging task. Nevertheless, considering the statistical results obtained in this study based on a set of more than 250 substorm intervals and the results produced by numerical modeling, a picture like that developed here above implying a double stage coupling between the magnetosphere and the solar wind appears reasonable.
Figure 6. Comparison between (top) Bz, (middle) coupling function (1), and (bottom) coupling function (2)
Figure 7. Same as Figure 1 but based on the 55 events selected by Coumans et al. [2007], which only include cases exhibiting a significant equatorward motion of at least one of the precipitation boundaries during the growth phase.
5. Conclusions
[28] The directly driven process and the loading-unloading process are two physical processes that are
considered to be of importance in the dissipation of this energy input from the solar wind. According to Rostoker et al. [1987], during substorms one or the other of the two above processes may dominate for any individual cases. Most often the two processes operate simultaneously during a given phase of a substorm, e.g., the magnetotail may experience loading as the driven system increases in strength. They also specified that the driven process appears to be dominant on a statistical basis in terms of solar wind-geomagnetic activity relationships.
More recently, Shukhtina et al. [2005] and Pulkkinen et al. [2006] supported each of the two opposite conclusions. Observations from the FUV instruments on board the IMAGE satellite allow us to observe substorm events, from the beginning of the growth phase to the end of the expansion phase. The nightside auroral precipitation has been used in this study as an estimation for the energy deposition (UA) in the Northern
Hemisphere by precipitating electrons and protons for the 256 selected substorms between June 2000, and December 2002, and has been compared with solar wind energy input proxies, such as the magnetic open flux, the ε parameter, or other coupling functions. Thus, correlations have been made between several observational data, without using models, simulations or hypothesis. This way provides robust results, despite the scatter due to the complexity of magneto spheric processes and, to a lesser extent, to experimental measurements.
[29] Our results show that magnetic open flux provides a rather weak correlation with the intensity of auroral precipitation during the expansion phase of a substorm. This was initially unexpected, but as discussed above, this is not necessarily surprising. However, on the basis of a stricter selection which only includes cases
exhibiting a significant equatorward motion during the growth phase, we found a significant correlation between the magnetic open flux and the auroral precipitation. This implies that among the 256 substorm events, a part are onsets occurring without measurable change of the polar cap size, thus without energy storage, during the growth phase. High correlations are found between the intensity of the auroral emission and some coupling functions, especially these which do not have the contribution of the solar wind dynamic pressure: VBt sin(θc/2), and
V Bt sin2(θc/2). Indeed, we found that including a dependence on the solar wind dynamic pressure in the coupling
functions does not improve the correlation between the coupling functions estimated during the growth phase and the auroral response. We finally conclude that the most statistically dominant process is the loading-unloading process, as was supported by Shukhtina et al. [2005]. If the results concerning the driven process are still statistically significant, that is certainly because the solar wind properties prior and after the onset time are correlated, which introduces an ambiguity in our analysis. As discussed before, these two aspects are obviously not mutually exclusive, and both mechanisms certainly contribute to the energy release during substorms.
Acknowledgments
J. C. G. and B. H. are supported by the Belgian National Fund for Scientific Research. The IMAGE-FUV investigation was supported by NASA through SWRI subcontract 83820 at the University of California, Berkeley, contract NAS5-96020. This research was supported by the PRODEX program managed by the European Space Agency in collaboration with the Belgian Federal Science Policy Office and the Fund for Collective and Fundamental Research (grant 2.4517.02). The authors thanks J. Weygand for the propagated ACE data (GEM grant ATM 02-1798, Space Weather grant ATM 02-08501, and NASA Research at 1 AU grant NG-04GA93G). ACE level 2 data were provided by N. F. Ness (MFI) and D. J. McComas (SWEPAM) and the ACE Science Centre.
Zuyin Pu thanks Gordon Rostoker and another reviewer for their assistance in evaluating this paper. References
Akasofu, S.-I. (1964), The development of the auroral substorm, Planet. Space Sci., 12, 273, doi:10.1016/0032.
Akasofu, S.-I. (1981), Energy coupling between the solar wind and the magnetosphere, Space Sci. Rev., 28, 121, doi:10.1007/BF00218810. Arnoldy, R. L. (1971), Signature in the interplanetary medium for substorms, J. Geophys. Res., 76, 5189, doi:10.1029/JA076i022p05189. Axford, W. I., and C. O. Hines (1961), A unifying theory of high-latitude geophysical phenomena and geomagnetic storms, Can. J. Phys., 39,1433.
Baker, D. N, A. J. Klimas, D. Vassiliadis, T. I. Pulkkinen, and R. L. McPherron (1997), Reexamination of driven and unloading aspects of magnetospheric substorms, J. Geophys. Res., 102, 7169, doi:10.1029/ 96JA02627.
Bargatze, L. F., D. N. Baker, R. L. McPherron, and E. W. Hones Jr. (1985), Magnetospheric impulse response for many levels of geomagnetic activity, J. Geophys. Res., 90, 6387, doi:10.1029/JA090iA07p06387.
Coumans, V., J.-C. Gérard, B. Hubert, and M. Meurant (2006), Global auroral proton precipitation observed by IMAGE-FUV: Noon and midnight brightness dependence on solar wind characteristics and IMF orientation, J. Geophys. Res., 111, A05210,
doi:10.1029/2005JA011317.
Coumans, V., C. Blockx, J.-C. Gérard, B. Hubert, and M. Connors (2007), Global morphology of substorm growth phases observed by the IMAGE-SI12 imager, J. Geophys. Res., 112, A11211, doi:10.1029/2007JA012329.
Cowley, S. W. H., and M. Lockwood (1992), Excitation and decay of solar wind-driven flows in the magnetosphere-ionosphere system, Ann. Geophys., 10, 103.
Dungey, J. W. (1961), Interplanetary field and the auroral zones, Phys. Rev. Lett., 6, 47, doi:10.1103/PhysRevLett.6.47.
Frey, H. U, S. B. Mende, T. J. Immel, J. C. Gérard, B. Hubert, S. Habraken, J. Spann, G. R. Gladstone, D. V. Bisikalo, and V. I. Shematovich (2003), Summary of quantitative interpretation of IMAGE far ultraviolet auroral data, Space Sci. Rev., 109, 255,
Frey, H. U., S. B. Mende, V. Angelopoulos, and E. F. Donovan (2004), Substorm onset observations by IMAGE-FUV, J. Geophys. Res., 109, A10304, doi:10.1029/2004JA010607.
Gérard, J.-C, B. Hubert, D. V. Bisikalo, and V. I. Shematovich (2000), A model of the Lyman-α line profile in the proton aurora, J. Geophys. Res., 105, 15,795, doi:10.1029/1999JA002002.
Gérard, J.-C, B. Hubert, M. Meurant, V. I. Shematovich, D. V Bisikalo, H. Frey, S. Mende, G. R. Gladstone, and C. W. Carlson (2001), Observation of the proton aurora with IMAGE FUV imager and simultaneous ion flux in situ measurements, J. Geophys. Res., 106, 28,939, doi:10.1029/ 2001JA900119.
Gonzalez, W. D., and F. S. Mozer (1974), A quantitative model for the potential resulting from reconnection with an arbitrary interplanetary magnetic field, J. Geophys. Res., 79, 4186, doi:10.1029/JA079i028p04186.
Grocott, A, S. W. H. Cowley, J. B. Sigwarth, J. F. Watermann, and T. K. Yeoman (2002), Excitation of twin-vortex flow in the nightside high-latitude ionosphere during an isolated substorm, Ann. Geophys., 20, 1577.
Hubert, B., S. E. Milan, A. Grocott, C. Blockx, S. W. H. Cowley, and J.-C Gérard (2006), Dayside and nightside reconnection rates inferred from IMAGE FUV and Super Dual Auroral Radar Network data, J. Geophys. Res., 111, A03217, doi:10.1029/2005JA011140.
Ieda, A., S. Machida, T. Mukai, Y. Saito, T. Yamamoto, A. Nishida, T. Terasawa, and S. Kokubun (1998), Statistical analysis of the plasmoid evolution with Geotail observations, J. Geophys. Res., 103, 4453, doi:10.1029/97JA03240.
Knipp, D. J., et al. (1998), An overview of the early November 1993 geomagnetic storm, J. Geophys. Res., 103, 26,197, doi:10.1029/98JA00762.
Liou, K., P. T. Newell, C.-I. Meng, M. Brittnacher, and G. Parks (1998), Characteristics of the solar wind controlled auroral emissions, J. Geophys. Res., 103, 17,543, doi:10.1029/98JA01388.
Lu, G., et al. (1998), Global energy deposition during the January 1997 magnetic cloud event, J. Geophys. Res., 103, 11,685, doi: 10.1029/98JA00897.
McComas, D. J., S. J. Bame, P. Barker, W. C. Feldman, J. L. Phillips, P. Riley, and J. W. Griffee (1998), Solar Wind Electron Proton Alpha Monitor (SWEPAM) for the Advanced Composition Explorer, Space Sci. Rev., 86, 563, doi:10.1023/A:1005040232597.
McPherron, R. L. (1970), Growth phase of magnetospheric substorms, J. Geophys. Res., 75, 5592, doi:10.1029/JA075i028p05592. Mende, S. B., et al. (2000a), Far ultraviolet imaging from the IMAGE spacecraft. 1. System design, Space Sci. Rev., 91, 243, doi:10.1023/ A:1005271728567.
Mende, S. B., et al. (2000b), Far ultraviolet imaging from the IMAGE spacecraft. 2. Wideband FUV imaging, Space Sci. Rev., 91, 271, doi:10.1023/A:1005227915363.
Milan, S. E. (2004), A simple model of the flux content of the distant magnetotail, J. Geophys. Res., 109, A07210, doi:10.1029/ 2004JA010397.
Milan, S. E., M. Lester, S. W. H. Cowley, K. Oksavik, M. Brittnacher, R. A Greenwald, G. Sofko, and J.-P. Villain (2003), Variations in the polar cap area during two substorm cycles, Ann. Geophys., 21, 1121.
Milan, S. E., S. W. H. Cowley, M. Lester, D. M. Wright, J. A. Slavin, M. Fillingim, C. W. Carlson, and H. J. Singer (2004), Response of the magnetotail to changes in the open flux content of the magneto sphere, J. Geophys. Res., 109, A04220, doi:10.1029/2003JA010350. Milan, S. E., G. Provan, and B. Hubert (2007), Magnetic flux transport in the Dungey cycle: A survey of dayside and nightside reconnection rates, J. Geophys. Res., 112, A01209, doi:10.1029/2006JA011642.
Perreault, P., and S.-I. Akasofu (1978), A study of geomagnetic storms, Geophys. J. R. Astron. Soc., 54, 547.
Pulkkinen, T. I., M. Palmroth, E. I. Tanskanen, P. Janhunen, H. E. J. Koskinen, and T. V. Laitinen (2006), New interpretation of magneto spheric energy circulation, Geophys. Res. Lett., 33, L07101, doi:10.1029/2005GL025457.
Rostoker, G., S.-I. Akasofu, W. Baumjohann, Y. Kamide, and R. L. McPherron (1987), The roles of direct input of energy from the solar wind and unloading of stored magnetotail energy in driving magneto-spheric substorms, Space Sci. Rev., 46, 93.
Shukhtina, M. A, N. P. Dmitrieva, N. G. Popova, V. A. Sergeev, A. G. Yahnin, and I. V. Despirak (2005), Observational evidence of the loading-unloading substorm scheme, Geophys. Res. Lett, 32, L17107, doi:10.1029/ 2005GL023779.
Siscoe, G. L., and T. S. Huang (1985), Polar cap inflation and deflation, J. Geophys. Res., 90, 543, doi:10.1029/JA090iA01p00543. Smith, C. W., J. L'Heureux, N. F. Ness, M. H. Acuna, L. F. Burlaga, and J. Scheifele (1998), The ACE magnetic fields experiments, Space Sci. Rev., 86, 613, doi:10.1023/A:1005092216668.
Strickland, D. J., R. E. Daniell Jr., J. R. Jasperse, and B. Basu (1993), Transport-theoretic model for the electron-proton-hydrogen atom aurora: 2. Model results, J. Geophys. Res., 98, 21,533, doi:10.1029/93JA01645.
Tsurutani, B. T, J. A. Slavin, Y. Kamide, R. D. Zwickl, J. H. King, and C. T. Russell (1985), Coupling between the solar wind and the magneto-sphere: CDAW6, J. Geophys. Res.., 90, 1191, doi:10.1029/JA090iA02p01191.
Vasyliunas, V. M., J. R. Kan, G. L. Siscoe, and S.-I. Akasofu (1982), Scaling relations governing magnetospheric energy transfer, Planet. Space Sci., 30, 359, doi:10.1016/0032.
Weimer, D. R., D. M. Ober, N. C. Maynard, W. J. Burke, M. R. Collier, D. J. McComas, N. F. Ness, and C. W. Smith (2002), Variable time delays in the propagation of the interplanetary magnetic field, J. Geophys. Res., 107(A8), 1210, doi:10.1029/2001JA009102.
Weimer, D. R., D. M. Ober, N C. Maynard, M. R. Collier, D. J. McComas, N. F. Ness, C. W. Smith, and J. Watermann (2003), Predicting interplanetary magnetic field (IMF) propagation delay times using the minimum variance technique, J. Geophys. Res., 108(A1), 1026, doi:10.1029/ 2002JA009405. (Correction, J. Geophys. Res., 109, doi:10.1029/ 2004JA010961, 2004.)
Wygant, J. R., R. B. Torbert, and F. S. Mozer (1983), Comparison of S3-3 polar cap potential drops with the interplanetary magnetic field and models of magnetopause reconnection, J. Geophys. Res., 88, 5727, doi:10.1029/JA088iA07p05727.
![Figure 7. Same as Figure 1 but based on the 55 events selected by Coumans et al. [2007], which only include cases exhibiting a significant equatorward motion of at least one of the precipitation boundaries during the growth phase](https://thumb-eu.123doks.com/thumbv2/123doknet/6477202.172743/12.892.218.674.162.747/figure-selected-coumans-exhibiting-significant-equatorward-precipitation-boundaries.webp)
