An Acoustical Study of Fricatives in the Speech of
Dysarthric Speakers
by
Helen Chen
Submitted to the Department of Electrical Engineering and
Computer Science
in partial fulfillment of the requirements for the degree of
Master of Engineering in Electrical Engineering and Computer Science
at the
MASSACHUSETTS INSTITUTE OF TECHNOLOGY
June 1998
© Massachusetts Institute of Technology 1998. All rights reserved.
The author hereby grants to MIT permission to reproduce and distribute
publicly paper and electronic copies of this thesis document in whole or in
part, and to grant others the right to do so.
I A
A uthor
... ... ...
Department of Electrical and Computer Science
May 8, 1998
Certified by
...
...
Kenneth N. Stevens
Clarence J. LeBel Profesor of Electrical Engineering
,-~s sis
Sup
visor
Accepted by
...
Arthur C. Smith
Chairnn, Departmental Committee on Graduate Students
MN SACHU'STT iN3" ' LOF '\. ..
JULI1409
E
LIBRARIESAn Acoustical Study of Fricatives in the Speech of
Dysarthric Speakers
by
Helen Chen
Submitted to the Department of Electrical Engineering and
Computer Science on May 8, 1998,
in partial fulfillment of the requirements for the degree of
Master of Engineering in Electrical Engineering and Computer Science
Abstract
The goal of the present study is to better understand dysarthric speakers' speech production through quantitative acoustical analysis of the speech signals. In the past, two acoustical measurements proven to correlate with speech intelligibility in dysarthric speakers are speech rate and slope of the F2 frequency change for certain consonant-vowel syllables. In this thesis, several new spectral parameters from acoustical analysis that reflect neuromotor dysfunctions in production of the fricative /s/ have been devised and are presented. These parameters specify the spectrum shape and relative amplitude of the fricative noise, the presence or absence of voicing, and the time variation of the spectrum preceding, during, and following the fricative. Analysis shows that these parameters are highly correlated with the speakers' overall intelligibility as well as intelligibility of the fricative /s/. The top three parameters that differentiate the intelligibility of speakers are related to the spectral shape (spectral tilt), the amount of variation in spectral energy (time variation within the fricative), and the amount of inadvertent spectral energy present prior to frication (precursor).
The long-term aim of the study is to develop methods for quantifying disordered speech and for determining the deviation from normal speech. In the long run, these methods can be used to objectively measure the effectiveness of speech therapy as well as the amount
of speech degeneration in dysarthric speakers.
Thesis Supervisor: Kenneth N. Stevens
Acknowledgments
The completion of this thesis would not have been possible without the full support of my thesis advisor, Ken Stevens. His patient guidance, warm encouragement, and insightful comments have left a lasting imprint in my mind. He not only took great care in my research work but also cared for me outside of academics. I feel truly blessed to have the chance to work with Ken and the talented group of researchers at the Speech Communications Group.
My deep gratitude goes to Hwa-Ping Chang. His careful doctoral research has laid a solid foundation for my research to build upon. Heartfelt thanks goes to Corine Bickley
for all the assistance with the statistical analysis of the data.
Thanks to AP, JW, LD, KS, ES, KC for taking the time to be my subjects for the study. Thanks to Jeff Kuo for being always available to discuss results, to clarify my thought process, or simply to give me words of encouragement. Thanks to Marilyn Chen for great critique on my thesis work and moral support. Kelly Poort has also given many helpful insights that enabled me to have a better grasp of the data that I was analyzing. Thanks also goes to my wonderful officemate Adrienne Prahler who never failed to bring a smile to my face and keep me to the deadline.
I feel extremely fortunate to have been blessed with two loving roommates who always took great care of me and made me look forward to going home. Thanks also goes to Richard Chung who was always there to help. Thanks to Allen Sun and Mike Sung for helping me to stay awake late at night in order to finish the writing of this thesis.
Special thanks goes to friends I met through Boston Chinese Evangelical Church, especially those at the MIT Chinese Christian Fellowship, the graduate small group, and the China Teaching Team for their faithful prayers, the power of which is a constant
source of renewal for me.
Last but not the least, I sincerely thank my parents who made great sacrifices through the years to enable me to have the best education possible. Their unconditional love and support never cease to amaze me.
CONTENTS
CHAPTER 1 INTRODUCTION...
9
1.1 THESIS M OTIVATION... ... ... 11 1.2 THESIS OUTLINE ... ... 11 CHAPTER 2 BACKGROUND ... 13 2.1 CHARACTERISTICS OF DYSARTHRIAS ... 132.2 FRICATIVE CONSONANTS - ARTICULATORY AND ACOUSTIC EVENTS ... 15
2.2.1 Acoustics of Unvoiced Alveolar Fricative /s/... 15
2.3 PAST STUDIES ... 17
2.4 PRELIMINARY STUDIES ... ... 20
CHAPTER 3 METHODS AND PROCEDURES ... 22
3.1 D ATA ACQUISITION ... 22
3.2
SUMMARY OF SUBJECTS ... ... 233.3 ACOUSTIC ANALYSIS ... .. ... 24
3.3.1 Measurements from Spectra...
... 24
3.3.2 Assessments from Spectrograms ...
... 26
3.4 PERCEPTUAL RATING OF /S/ ... 29
CHAPTER 4 RESULTS AND DISCUSSION ... 30
4.1 ACOUSTIC ANALYSIS BASED ON OVERALL INTELLIGIBILITY FROM HWA-PING' S DOCTORAL STUDIES ... . 31
4.1.1 Assessment of Formation and Release of Fricative from
Spectrograms... 31
4.1.2 Articulatory and Phonetic Features Based on Measurements of
Spectra ...
33
4.1.3 Total Assessment Average vs. Overall Intelligibility ... 36
4.1.4 Data Grouping
-
High and Low Intelligibility Groups... 37
4.2 ACOUSTIC ANALYSIS BASED ON /S/ PERCEPTUAL RATING ...
38
4.2.1 Assessment of Formation and Release of Fricative
from
Spectrogram ...
... 39
4.2.2 Articulatory and Phonetic Features Based on Measurements of
Spectra ...
...
40
4.2.3 Total Average Assessment vs. New Intelligibility Rating ... 42
4.3 STATISTICAL ANALYSIS ... 43
4.3.1 Overall Intelligibility vs. New /s/ Perceptual Rating ... . 43
4.3.2 Pearson Correlation Matrix ...
... 44
4.3.3 D iscrim inant Analysis... 45
4.4
DISCUSSION ON INDIVIDUAL SUBJECTS ...46
4.4.1 Subject Fl ... 47
4.4.2 Subject F3...
... 49
CHAPTER 5 CONCLUSIONS ...
52
5.1
SUMM ARY ... ...52
5.2 FUTURE W ORK ... 53CHAPTER 6 REFERENCES ...
55
APPENDIX A ... 58List of Figures
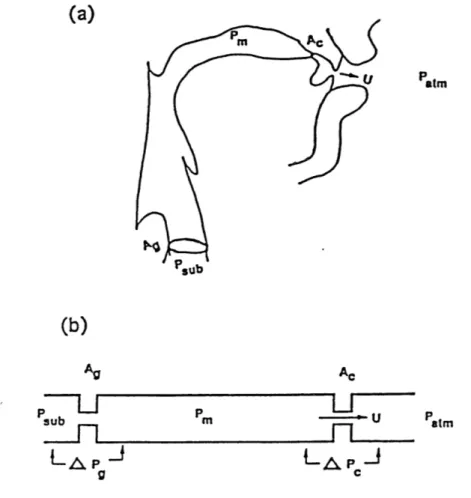
Figure 2.1 a) Midsagittal cross-section of a vocal tract vocal-tract model for an alveolar fricative. b) Vocal tract idealized as a uniform tube with constrictions at the glottis
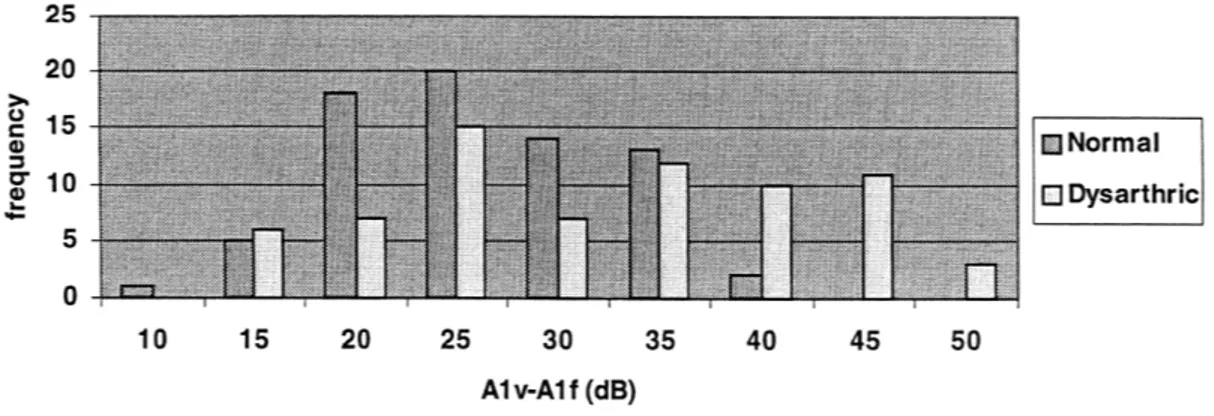
and in the oral region (W ilde, 1995) ... ... 16 Figure 2.2 Histogram of Alv-Alf measures in normal and dysarthric data for /s/ initial
utterances... ... ... ... .... 21 Figure 3.1 a) & b) Example of time-averaged DFT Spectra of /s/ and /i/ in "see" for
normal speakers. Measurements are marked on the plot and the calculations of Alv-Alf (voicing), spectral tilt, and Alv-Ahf are given below the figure...26 Figure 3.2 Example of spectrograms of production of "see" by a normal speaker, a
dysarthric speaker with highly intelligibility and a dysarthric speaker with low intelligibility ... 28 Figure 4.1 a)-e) Plot of assessment of formation and release of fricative I/s/ in relation to
overall intelligibility of individual speakers ... ... 33 Figure 4.2 Plot of three parameters derived from measurements of spectra of fricative I/s/
in relation to overall intelligibility of individual speakers ... 35 Figure 4.3 Plot of spectrogram assessment of voicing characteristic of fricative I/s/ in
dysarthric speakers in relation to overall intelligibility... ... 36 Figure 4.4 Total average assessment of the release and formation of fricative /s/ versus
overall intelligibility of the speakers. The data separate into three distinct groups: low intelligibility, high intelligibility, and normal... ... 36 Figure 4.5 Spectral assessment separated by low and high intelligibility groups. Each bar
represents average data for the speaker group indicated. The thin line on each bar gives the range for one standard deviation above and below the mean value ... 37 Figure 4.6 Measurement of spectra separated by low and high intelligibility groups. Each
bar represents average data for the speaker group indicated. The thin line on each bar gives the range for one standard deviation above and below the mean value ... 37
Figure 4.7 a)-e) Plot of assessment of formation and release of fricative Is/ in relation to /s/ perceptual rating of individual speakers...40 Figure 4.8 Plot of measurements of spectra of fricative I/s/ in relation to /s/ perceptual
rating of individual speakers ... 41 Figure 4.9 Total average assessment of the release and formation of fricative /s/ versus /s/
perceptual rating of the speakers...42 Figure 4.10 Linear correlation between overall intelligibility determined previously by
Hwa-Ping Chang and new /s/ perceptual rating devised in this thesis...43 Figure 4.11 Summary of assessment of formation and release of fricative Is/ of three
speakers, one normal speaker, one dysarthric speaker with high intelligibility, and one with low intelligibility speaker...46 Figure 4.12 Summary of measurements of spectra of fricative Is/ of three speakers as in
F igu re 4 .1 1 ... ... ... 4 7 Figure 4.13 Fl' spectrogram of the word "see"...48 Figure 4.14 Fl' time-averaged DFT spectra of Is/, in the 100 ms period preceding the
boundary between the fricative and the vowel...48 Figure 4.15 F3's spectrogram of the word "see". ... 50 Figure 4.16 F3's time-averaged DFT spectra of/s/, in the 100 ms period preceding the
List of Tables
Table 3.1: Summary pertinent information on dysarthric subjects ... 23 Table 4.1 Summary of spectral parameters and assessments in correlation with
intelligibility. The first eight rows are the disarthric speakers and the bottom two rows are the normals with overall intelligibility of 100% ... 30 Table 4.2 Pearson correlation coefficient matrix for the various spectral measures and
Chapter 1 Introduction
Dysarthrias are types of neuromotor speech disorders that result from damage to the central nervous system. Impairment of the neuromuscular control of speech can affect several or all aspects of speech production: respiration, phonation, resonance, articulation, and prosody (Darley et al., 1975). Extensive clinical research has been performed by Darley, Aronson, and Brown to quantify perceptual impressions based on the psychophysical scaling of multiple dimensions of speech production performance. However, perceptual analysis has limited analytic power, and perceptual judgments are difficult to standardize over time and across different settings. Only clinicians with extensive experience can rely on perceptual assessment alone to evaluate the details of speech production and the consistency of individuals with dysarthria.
In recent years, articulatory and acoustic models for the normal production of various classes of speech sounds have been refined and have led to more quantitative predictions of the properties of the sounds. These models can help to interpret acoustic measurements on speech sounds in terms of the articulatory movements that give rise to the sounds, for both normal and disordered speech production. The broad goal of the present study is to develop improved models of normal as well as dysarthric speakers' speech production and to use these models to interpret acoustic data obtained from the utterances of dysarthric speakers. This study is concerned particularly with the unvoiced alveolar fricative consonant /s/ produced by dysarthric speakers. One reason for selecting
this particular consonant for study is that many dysarthric speakers have been shown to have particular difficulty with the sound (Chang, 1995).
Any articulatory/acoustic model of fricative production should be able to estimate the sound patterns for different fricatives when the subglottal pressure and the time-varying glottal opening and supraglottal movements are known. Such a model must first estimate the flows and pressures, and from these calculate the characteristics of the acoustic sources. Acoustic theory is then used to determine the filtering of these sources by the vocal tract and hence the radiated sound pattern. Generation of the normal acoustic pattern for a fricative consonant requires the coordination of the respiratory system, adjustment of the glottal configuration, closure of the velopharyngeal port, and formation of a constriction by proper placement of the appropriate articulator in the oral cavity. In the case of a voiceless fricative consonant, it can be shown that the cross-sectional area of the constriction formed by the supraglottal articulator should be adjusted to be roughly one-half of the area of the glottis in order to maximize the amplitude of the frication noise
source in the vicinity of the supraglottal articulator.
Using this model we can assess the extent to which the above articulatory and aerodynamic requirements for the consonant are being implemented by speakers with motor disorders, based on acoustic measurements of the sound generated by a fricative consonant. We consider here fricatives in word-initial position, as in the word sat. Buildup of intraoral pressure before the glottal and supralaryngeal articulators are in place will lead to inadvertent sound that precedes the fricative. If the glottis is not sufficiently abducted, glottal vibration will continue through the fricative, and the noise generated at the tongue-blade constriction will be too weak. If the supraglottal
constriction is not sufficiently narrow, frication noise at the constriction will be weak, and the acoustic source at the glottis will be the dominant one. And, if the tongue blade is improperly placed, the filtering of the frication noise source will not be correct, leading to a deviant spectrum of the radiated sound. At the fricative-vowel boundary, incorrect coordination of changes in the glottal and supraglottal constrictions can lead to premature voicing onset or to weak aspiration noise separating the fricative and the vowel.
1.1 Thesis Motivation
A speaker's speech signals provide a tremendous wealth of knowledge on the quality of the speaker's speech. There have been only limited attempts to characterize dysarthric speech with objective acoustic measurements from speech signals. Interpretations from the source-filter acoustic model of speech production suggest the development of a new set of quantitative acoustic assessments and measurements as analytical tools for dysarthric speech. The long-term motivation for this thesis is to develop methods for characterizing dysarthric speech in order to measure the effectiveness of speech therapy as well as the amount of speech degeneration in dysarthric speakers. In addition, this research could lead to methods for automatic recognition of the speech of these individuals, and ultimately to improve their quality of life.
1.2 Thesis Outline
Background information on the characteristics of various types of dysarthria, an acoustical model of fricative consonants, previous work, and preliminary studies are described in Chapter two. Chapter three discusses the data acquisition methods and procedures used to obtain the new acoustic parameters. Chapter four presents the results
of acoustical analysis and the significance of the findings as well as a few case studies on individual subjects. Finally, Chapter five gives a summary and suggestions for future work.
Chapter 2 Background
Different types of dysarthria have generally been categorized by their unique sets of perceptual characteristics (Darley, Aronson and Brown 1975). These perceptual characteristics are related to the specific site of lesion, and to the disease process involved. This chapter will detail the different types of dysarthria, the acoustic and articulatory events involved in the production of fricative consonants, some past acoustical studies of dysarthria and fricatives, and results of a preliminary acoustic study of the fricative /s/ produced by some dysarthric speakers.
2.1 Characteristics of Dysarthrias
Dysarthria is a term used to describe a group of neuromotor speech disorders resulting from impairment in the muscular control of the speech mechanism. Damage to the neuromuscular control of speech can affect respiration, phonation, resonance, articulation, and prosodic aspects of speech. From early works by Darley, Aronson, and Brown (1975), several identifiable types of dysarthria were linked to neurological conditions and damage to certain levels of the nervous system. The following list summarizes the most common dysarthria classification using five categories (LaPointe,
1994):
a) Spastic Dysarthria - Caused by damage to the bilateral motor strip in the brain and resulting in poor articulation and strained or strangled voice.
b) Ataxia Dysarthria - Caused by damage to the cerebellum and resulting in irregular speech and syllable repetition.
c) Flaccid Dysarthria - Originating from neurological involvement in the brainstem and resulting in poor articulation and hypernasality.
d) Hyperkinetic Dysarthria - Caused by damage throughout much of the extra-pyramidal motor system and resulting in unsteady rate, pitch and loudness as well as frequent grunting noises.
e) Hypokinetic Dysarthria - Usually evolving from Parkinson's disease and resulting in reduced loudness and speech rate.
The different subjects in this study exhibit three types of dysarthria: spastic dysarthria, athetoid (hyperkinetic) dysarthria, and ataxia dysarthria. The first two result from cerebral palsy and the last result from cerebellar ataxia. (Chang, 1995). Dysarthria may also accompany aphasia and apraxia, two other types of speech disorder. To reduce the order of complexity for this study, the subjects did not exhibit symptoms of apraxia and aphasia. In addition, the subjects' auditory comprehension and reading skills were intact.
Speakers with cerebral palsy are commonly known to have difficulty in "coordinating" the processes of articulation, phonation, and respiration. Therefore dysarthria is a common symptom of this neurological disorder. Two kinds of cerebral palsy are exhibited by the subjects: spastic and athetosis. "Speech of the athetoid presents varying gradations of a pattern in irregular, shallow, and noisy breathing; whispered, hoarse, or ventricular phonation; and articulatory problems varying from the extremes of complete mutism or extreme dysarthria to a single awkwardness in lingual movement. Spastic dysarthrias result in poor articulation and strain/strangled voiced. Some speech symptoms of the spastic dysarthrias are: (i) slow and labored speech, (ii) consistently
imprecise articulation, (iii) low and monotonous pitch, (iv) harsh and often strained or strangled-sounding voice quality, and (v) hypernasality (but usually no audible nasal emission) (Darley et al., 1968)
2.2 Fricative Consonants - Articulatory and Acoustic
Events
The source-filter acoustic theory of speech production represents the vocal tract as an acoustic tube with varying cross-sectional area. An acoustic source can form the excitation of this tube either at the glottal end or at points along its length, and the shape
of the tube determines how the source is to be filtered.
Fricative consonants are distinguished from other speech sounds by their manner of production. Fricatives are produced by forming a narrow constriction in some region along the length of the vocal tract (Stevens, in press). Air blown through this constriction becomes turbulent in flow, typically near an obstacle in the airstream or at the walls of the vocal tract. The acoustic result of the turbulence is the generation of noise. This noise is then filtered by the vocal tract, with the acoustic cavity in front of the constriction contributing the greatest influence on the filtering. There are eight fricatives in English: labiodentals (f, v), dentals (th, dh), alveolars (s, z), and palato-alveolars (sh, zh).
2.2.1 Acoustics of Unvoiced Alveolar Fricative
Is/
The alveolar fricative I/s/ can be modeled under the assumption of a concatenated tube with two constrictions: one at the glottis and one at the constriction formed by the supraglottal articulators. Acoustically, the system as shown in Figure 2.1 can be decomposed into a quarter-wave resonator representing the cavity in front of the constriction, which contributes some of the system poles, and a half-wave resonator
representing the portion of the vocal tract between the constriction and the pressure source, which contributes the zeros and the remaining poles. The zeros depend on location of the source. As an example, if the front cavity is 2 cm long with the pressure source located 1 cm in front of the constriction, then the first pole of the system in front of the constriction is the first resonance of the quarter-wave resonator, c/41 = 4425 Hz, where c is the speed of sound (354 m/s) and I is 0.02 m. The calculated spectrum of the fricative has a wide bandwidth high frequency peak around 4500 Hz reflecting the filtering of the pressure source by the short cavity in front of the constriction at the alveolar ridge.
(a)
Paatm(b)
Ag subg
9 Ac U _fL_¢ L,6 pCFigure 2.1a) Midsagittal cross-section of a vocal tract vocal-tract model for an alveolar fricative. b) Vocal tract idealized as a uniform tube with constrictions at the glottis and in the oral region (Wilde, 1995).
Patm
2.3 Past Studies
In 1975, Kent and Netsell demonstrated that cineradiographic and spectrographic analysis revealed abnormalities in speaking rate, stress patterns, articulatory placements for both vowels and consonants, velocities of articulator movement, and fundamental frequency contours in the speech of ataxic dysarthria patients. Kent et al. (1979) in another acoustical study observed abnormal timing patterns, with prolonged segments and equalized syllable durations.
Fricative production of a Broca's aphasic subject was analyzed spectrographically and compared to that of a normal subject (Code and Ball, 1982). For the aphasic subject, vocal-fold vibration was absent from 'voiced' fricatives, and vowel duration differences preceding fricatives were maintained normally, although friction duration in both voiced and voiceless phonemes was longer than normal speakers.
In a study of a group of 10 women with amyotrophic lateral sclerosis, the mean slope of the second formant F2 for a variety of consonant-vowel syllables was reduced compared with that of a normal geriatric control group (Kent et al., 1992). This F2 slope reduction is interpreted to reflect loss of lingual motorneurons. Acoustic measures of phonatory function for sustained vowel prolongation demonstrated abnormalities in fundamental frequency, perturbations in frequency (jitter) and amplitude (shimmer), and signal-to-noise ratio. Comparison of the results of this study on the group of women to a similar study on a group of men with ALS showed that men were more likely to have impairments of voicing in syllable-initial position (Kent, 1990).
Assessment of the intelligibility of speech of dysarthria patients has been another focus of past studies. Although it may not be necessary for clinicians to quantify a dyarthric individual's intelligibility, it is nonetheless useful in research studies. A small number of item identification tests have been developed specifically for this purpose. These tests include the Frenchay Dysarthria Assessment (Enderby, 1983). In this test, intelligibility is evaluated with three tasks: word task, sentence task, and conversation. Yorkston and Beukelman's (1981) Assessment of Intelligibility in Dysarthric Speakers test involves item identification at both single-word and sentence level. This test eliminates the need for new listeners every time an intelligibility estimate is desired. Procedures developed by Tikofsky and Tikofsky (1964) and by Tikofsky (1970) estimate single-word intelligibility of dyarthric speakers. Platt, Andrews, and their associates at the Spastic Center of New South Wales in Sydney, Australia, determined the intelligibility of cerebral-palsied speakers with a phonetically balanced list of 50 words (Platt, 1980). Most recently, Kent et al. (1989) designed an intelligibility test correlating dysarthric intelligibility impairment and acoustic properties. The test is based on a database consisting of a 70-word list, and is designed to examine 19 acoustic-phonetic contrasts that are likely to be sensitive to dysarthric impairment and contribute significantly to speech intelligibility. Two parameters that have been proven to correlate with speech intelligibility in dysarthric speakers, are speech rate and slope for F2 frequency change (Kent, 1992).
One study that made use of Kent's intelligibility test is Hwa-Ping Chang's Doctoral Thesis (1995) on speech input for dysarthric computer users. He focused on how best to use speech recognition techniques for augmenting the communication
abilities of dysarthric computer users. He examined in detail the data from eight dysarthric speakers based on four types of analysis: a closed-set intelligibility test, phonetic transcription, acoustic analysis of certain utterances, and an evaluation of the recognition of words by a commercial speech recognizer. One important conclusion from the study, which motivated this thesis, is that more of the articulation errors were found in the production of obstruent consonants. More specifically, many of the errors were place errors for alveolar consonants, particularly fricatives.
Another acoustic-phonetic study was performed on four Swedish dysarthric speakers. The study conducted by Hunnicutt, Nord, and Rosengren (1996) was designed to indicate which of the speech processes seem most affected, the type of dysarthria that correlated with the symptom constellation, and the severity of dysarthria. Both qualitative and quantitative data were collected. Four subjects with dysarthria were given a Swedish test (Hartelius and Svensson, 1990) to assess their speech. For the two male speakers, all consonant clusters beginning with /s/ were articulated with an intrusive schwa vowel. Intense energy down to 2 kHz was observed in the dental fricative I/s/. In one female speaker, initial consonant clusters beginning with /s/ were never realized as intended. Several other results were described in the report. Due to the limited number of test subjects, however, the results may only be taken as describing examples of the subjects' speech.
Most recently, Chiu, Chen, and Tseng (1996) correlated semiquantitative clinical assessment of cerebellar function to quantitative acoustical analysis of cerebellar speech. Results show that overlapping of voice onset time for voiced and voiceless stop consonants highly correlates with truncal ataxia as well as eye movement abnormality
and hand-eye coordination. The prolongation of vowel duration also correlates significantly with tandem walking, dysdiadochokinesia, and eye movement abnormality. The study concludes that the midline structures-vermis and fastigial nucleus-seem to be the primary focus for the coordination of motor speech in the cerebellum.
These studies showed that acoustic analysis can provide objective measurements of abnormalities in dysarthric speech and might be a reliable means of documenting speech changes due to treatment.
2.4 Preliminary Studies
In a preliminary study, averaged spectra were calculated for utterances (from the 70-word list) that contain English fricatives /s/ and /sh/ in four of the male dysarthric speakers. The speakers ranged in age from 38-61. Three of speakers were diagnosed with cerebral palsy, and one with cerebellar ataxia. The intelligibility of the speakers for words beginning with /s/ or /sh/ ranged from 20 to 90 percent. Characteristics of the noise spectra were analyzed with respect to the adjacent vowel spectra. The spectra for /s/ and /sh/ were taken at the midpoint of the fricative, and the spectrum of the following vowel was sampled 20 ms after the fricative-vowel boundary. In the more severe dysarthric cases, the boundary was less defined and therefore the slices were taken more subjectively. More objective methods have been devised in more in-depth studies to be described later in this thesis. From initial data, the relative amplitude difference between the peak value in the high frequency (> 3 kHz) region of the fricative consonant (Alf) and the first peak value in the vowel region (Alv) was highly correlated with intelligibility scores determined by Hwa-Ping Chang for his Ph.D. thesis (1995). Intelligibility decreased as the amplitude difference between the two peak values
increased. It is hypothesized that the decreased amplitude of the frication noise for the fricatives produced by the dysarthric speakers probably is a consequence of incorrect placement and shaping of the tongue blade when it is raised toward the hard palate. Either the constriction is not sufficiently narrow, or the tongue blade is placed too far forward. For some utterances, a strong low-frequency peak in the fricative spectrum indicates that there is presence of voicing for the fricatives. Large duration variation also exists between the speakers. Both time variation, and presence of voicing along with many other variables present many challenges for this thesis. A histogram of the amplitude difference measurements of Alv and Alf for all normal and dysarthric utterances of /s/ in the data is shown in Figure 2.2.This histogram shows that the high-frequency level of the fricative tends to be weaker for the dysarthric speakers than for the normal speakers. From the preliminary analyses involving examination of several acoustic attributes, it appears that it may be possible to devise combinations of several parameters to understand and model impairments in the placing, manner, and voicing of dysarthric speakers' speech. These preliminary results motivated a more extensive and systematic study with more utterances and speakers.
25 20 - 15 4) 0 S10 5 0 IE Normal E Dysarthric 10 15 20 25 30 35 40 45 50 Al v-Al f (dB)
Chapter 3 Methods and Procedures
The databases used, the various methods of obtaining the new acoustical spectral measures, and the procedures for analyzing the significance of the measures are described in this chapter.
3.1 Data Acquisition
Utterances of eight dysarthric speakers and two normal speakers were used for this study. In particular, one repetition of nine words with initial /s/ were selected from the larger database. The nine words are: see, seed, sell, sew, side, sigh, sin, sink, and sip.
The database of the speech of eight dysarthric speakers and a normal speaker was available from previous doctoral thesis work performed by Hwa-Ping Chang at MIT. Hwa-Ping Chang obtained several analogue tape recordings of the speakers. Speech recordings were made in a quiet room with an omnidirectional microphone placed 10 cm away from the mouth of the speaker. The recordings consisted of words taken from a 70-word list published by Kent et al. (1989) for intelligibility testing. Both the overall intelligibility and the intelligibility of the /s/ words were also determined previously by Chang.
A new recording of speech from seven normal speakers of the 70-word list was collected and added to the existing database. The subjects recorded the word list, in a random order, five times each. The speech recordings made with digital tapes were recorded in a quiet room with one omnidirectional microphone 10 cm away from the
mouth of the speaker. Since speech signals of normal speakers exhibit little variation, recordings from only two of the normal speakers (one male, one female) were used in this
study along with recordings of the eight dysarthric speakers' utterances. More normal speaker data is available for analyzed in future studies.
The recordings were digitized using a VAX computer system in the Speech Communication Laboratory. The sampling rate is 16 kHz with a 16-bit A/D board and a 7.5 kHz low-pass filter.
3.2 Summary of Subjects
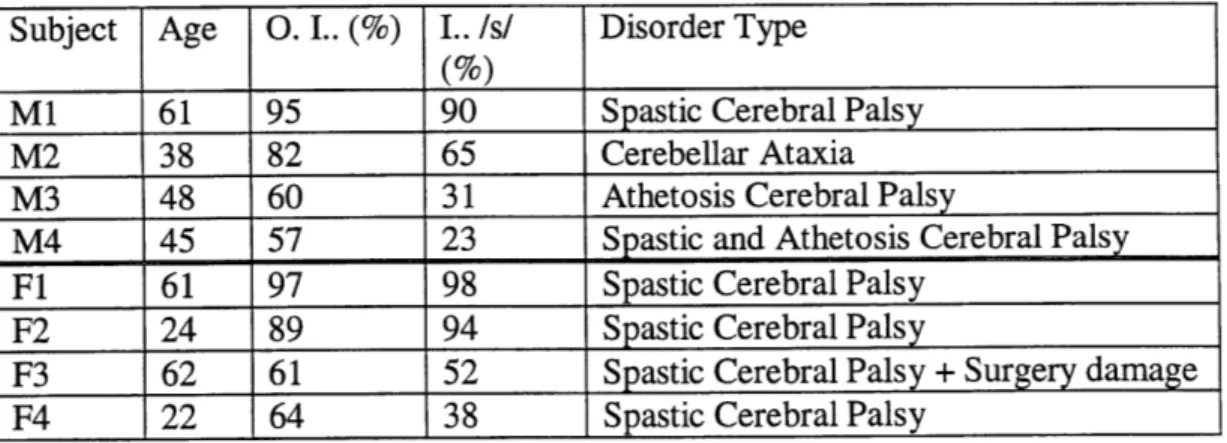
Subject information is obtained from Hwa-Ping's Doctoral Thesis. All the special subjects are individuals who have speech disorder due to neurological damage to the muscular control of the speech production mechanism. Out of the nine speakers who served as subjects for his study, eight are speakers with dysarthria (four male and four female) and one is a normal speaker (male) used as a control subject. All subjects are native speakers of English and have no apparent cognitive deficits. Pertinent information on the eight dysarthric speakers (four male and four female) is summarized in the table below:
Subject Age O.I.. (%) I../s/ Disorder Type (%)
M1 61 95 90 Spastic Cerebral Palsy
M2 38 82 65 Cerebellar Ataxia
M3 48 60 31 Athetosis Cerebral Palsy
M4 45 57 23 Spastic and Athetosis Cerebral Palsy
Fl 61 97 98 Spastic Cerebral Palsy
F2 24 89 94 Spastic Cerebral Palsy
F3 62 61 52 Spastic Cerebral Palsy + Surgery damage
F4 22 64 38 Spastic Cerebral Palsy
Table 3.1: Summary pertinent information on dysarthric subjects. O.I. - Overall Intelligibility; I. Is/
The four males and four female dysarthric subjects range in age from 22 to 62 years. Six of them have cerebral palsy (spastics: 4, athetosis: 1, and spastics plus athetosis: 1), one with spastic cerebral palsy and surgery damage to the brain, and one with cerebellar ataxia. The education level of the subjects range from 5th grade to master's degree.
All seven subjects (four female, three male) for the new recordings of the 70-word list performed for this study are normal native English speakers.
3.3 Acoustic Analysis
Based on preliminary studies, eight measurements were devised to analyze the fricative /s/ in dysarthric speech. Three of them are quantitative measurements obtained from averaged spectra to determine the closeness of the spectral shape to a normative Is/ production model. Five of them are estimates relating to the time course of the formation and release of I/s/. These estimates were obtained by making judgements of particular attributes of spectrograms of utterances from the words of each subject in the database.
3.3.1 Measurements from Spectra
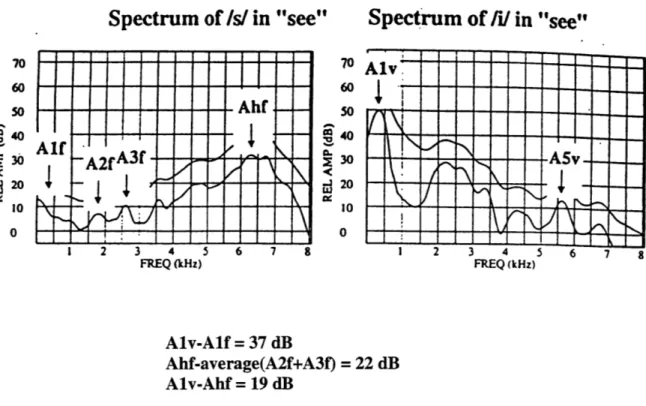
Time-averaged spectra of the fricative /s/ and the adjacent vowel /i/ in the word "see", as produced by a normal speaker, are shown in Figure 3.1. Averaged DFT spectra were obtained by stepping a relatively short Hamming window of 6.4 ms every 1 ms over a 100 ms time interval before the fricative-vowel boundary. An average DFT spectrum for the adjacent vowel was obtained similarly in the 100 ms time interval after the fricative-vowel boundary. An average of 100 ms was chosen to minimize fluctuations due to
insufficient sampling. A duration of 100 ms allows enough averaging to incorporate any time variations that may be present in individual utterances. All spectra are calculated without preemphasis.
From the spectra, the following values were measured: a) Ahf - peak amplitude above 4 kHz region of the fricative /s/, b) Alf, A2f, A3f - Amplitude of first three formants in the frication noise region, c) Alv - amplitude of the first formant in the adjacent vowel. All these amplitudes are measured in decibels (dB). A set of three acoustic parameters was then calculated from these measurements. For a given utterance, these parameters are all amplitude differences in dB within the utterances. The first parameter calculated is the spectral tilt of the I/s/ spectrum (Ahf - average(A2f+A3f)), a measure of the high frequency prominence relative to the mid frequency spectrum amplitude. A sufficiently large positive value for this parameter would indicate that the constriction formed by the tongue blade is no more than about 2 cm posterior to the lips. A major spectral prominence at a frequency below 4 kHz would suggest a constriction in a more posterior location. In the normative model, the value of this parameter is greater than 10 dB. The difference between Alv and Alf, i.e. Alv-Alf, gives a measure of the amount of voicing in the fricative relative to the adjacent vowel. For the voiceless fricative I/s/, this difference is expected to be greater than 20 dB. The third parameter is a
measure of the amplitude of the first formant in the vowel relative to amplitude of high-frequency prominence in /s/ spectrum. The parameter should indicate whether the amplitude of the fricative is sufficiently high in relation to the vowel. It is an indication of whether the supraglottal constriction is sufficiently narrow or whether there is sufficient
airflow through the constriction. An average value for Alv-Ahf for normal speakers is about 20 dB.
Spectrum
of/s/
in "see"
Spectrum of i/ in "see"
Ahf Alf
A2fA3f--
A
1 2 3 4 5 6 7 FREQ (kHz) 70 60 50 40 S30 20 10 O I-KQ (kHz) Alv-Alf = 37 dB Ahf-average(A2f+A3f) = 22 dB Alv-Ahf = 19 dBFigure 3.1 a) & b) Example of time-averaged DFT Spectra of Is/ and /i/ in "see" for normal speakers. Measurements are marked on the plot and the calculations of Alv-Alf (voicing), spectral tilt, and Alv-Ahf are given below the figure.
3.3.2 Assessments from Spectrograms
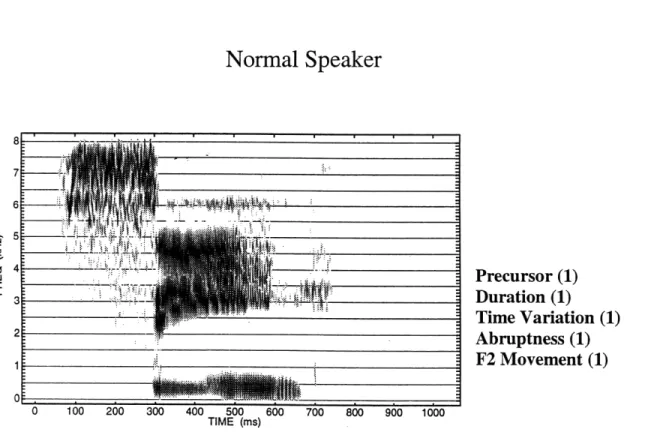
Two experimenters assessed the deviation from normal of the formation and release of the fricatives by examining the spectrogram of each word. Broadband spectrograms (6.4 ms Hamming Window) were made for each of the nine word-initial /s/ utterances by all ten speakers (eight dysarthric, two normal). The assessments made from the spectrograms were on a scale of 1 to 3, with 1 being closest to normal and 3 being most deviant from normal. The experimenters worked together, and arrived at a consensus on the rating
70 60 so 20 10 0
number for each attribute after some discussion. An attempt was made to base the scaling on attributes for which quantitative measures could ultimately be developed. The following five attributes were rated:
1. Precursor - The amount of noise or voicing energy prior to the closure for the
/s/
2. Duration - The duration of the I/s/ noise
3. Time variation - Variation of noise amplitude or spectrum shape within the I/s/ 4. Abruptness - Abruptness of the transition from I/s/ to its adjacent vowel
5. F2 movement - F2 frequency change in the adjacent vowel in the 50-odd milliseconds following the consonant release
Figure 3.2 gives examples of spectrograms of three productions of "see": one by a normal speaker, one by a highly intelligible dysarthric speaker, and one by a dysarthric speaker with low intelligibility. Average assessments by the experimenters are shown with the spectrograms.
Normal Speaker
0 100 200 300 400 500 600 TIME (ms) 700 800 900 1000 Precursor (1) Duration (1) Time Variation (1) Abruptness (1) F2 Movement (1) 8 7 6 5 4 3 2 01 _ _ :I j. illj"
r -ilagHigh Intelligibility
Precursor (1) Duration (2) Time Variation (2) Abruptness (2) F2 Movement (1)Low Intelligibility
Precursor (1) Duration (1) Time Variation (1) Abruptness (1) F2 Movement (1)Figure 3.2 Example of spectrograms of production of "see" by a normal speaker, a dysarthric speaker with highly intelligibility and a dysarthric speaker with low intelligibility. Average assessments (on a scale of 1 to 3) of the different attributes by two experimenters are also given.
3.4 Perceptual Rating of
I/s/
Available from Hwa-Ping Chang's research were data on the overall intelligibility for each dysarthric speaker and the intelligibility for words that begins with /s/. The latter intelligibility was determined based on the entire I/s/ word rather than the I/s/ characteristic alone. In the intelligibility test, listeners had to select one out of four possible choices, one of these was the correct word, and the others differed from the target word in one or more features in the initial or final consonant, or in the vowel. Consequently, an error in a response did not necessarily indicate that /s/ was unintelligible.
A new perceptual rating of based on I/s/ words in the 70-word list was proposed in order to obtain a more accurate perceptual correlate of the spectral acoustic parameters for the I/s/ in each word. The new test was given to four trained speech pathologists or scientists. Each experimenter was asked to listen to an analogue tape of 90 utterances and select the description that best describes the naturalness of the /s/: Good I/s/; some characteristics of /s/ but not a good I/s/; fricative but not /s/; not a fricative. The 90 utterances were composed of nine /s/-initial words from the 70-word list utterance produced by each of the eight dysarthric subjects and two normal subjects (one male, one female). An overall numerical rating was calculated for each utterance. This rating was determined by assigning 4, 3, 2, and 1 respectively to the four categories: "good /s/", "some characteristics of I/s/ but not a good Is/", "fricative but not /s/", and "not a fricative". The experimenters were also asked to judge the voicing characteristic of each utterance.
Chapter 4 Results and Discussion
The new spectral parameters devised in this thesis were examined in relation to intelligibility scores determined previously by Hwa-Ping Chang as well as the new /s/ perceptual rating scores. This chapter summarizes and interprets the results in detail and compares the effectiveness of the new parameters in determining the intelligibility of the fricative /s/ in dysarthric speech. Table 4.1 summarizes the spectral parameter values in relation to the individual intelligibility scores. (See Appendix A for detailed individual data.) The rating scores for the five spectrogram attributes and the three spectral measures were averaged over the nine utterances containing /s/ in initial position.
Subject /s/ I. of/s/ 0.1. Abruptness Duration Time Precursor F2 Total Alv- Spectral Alv-Ahf Perceptual (HP) Variation Movement Average Alf Tilt (dB)
Rating (dB) (dB) M4 1.4 23% 57% 2.2 1.6 2.7 2.9 2.0 2.3 4 -3.3 31.9 F3 1.4 52% 61% 2.4 2.2 2.2 2.9 1.7 2.3 2.4 -1.8 17.4 F4 1.9 38% 64% 1.7 1.3 2.3 1.2 2.3 1.8 32.8 -11.8 43.8 M3 1.9 31% 60% 2.0 1.8 2.1 1.6 1.6 1.8 9.4 -1.4 31 M2 2.1 65% 82% 1.3 1.1 2.0 1.2 1.4 1.4 3.4 -3.8 36.9 F1 2.8 98% 97% 1.2 2.0 1.1 1.0 1.0 1.3 28.4 -0.4 31.6 F2 2.9 94% 89% 1.8 1.3 1.3 1.0 1.0 1.3 21.8 5.9 21.3 M1 3.2 90% 95% 1.2 1.8 1.2 1.0 1.1 1.3 31.5 5.7 28.7 NF 3.4 100% 100% 1.1 1.0 1.0 1.0 1.0 1.0 34.9 15.8 28.9 NM 4.0 100% 100% 1.0 1.0 1.3 1.1 1.1 1.1 35.3 13.2 24.6 Table 4.1 Summary of spectral parameters and assessments in correlation with intelligibility. The first eight rows are the dysarthric speakers and the bottom two rows are the normals with overall
4.1 Acoustic Analysis Based on Overall Intelligibility
from Hwa-Ping's Doctoral Studies
Correlations between the new acoustic parameters and overall intelligibility are presented in this section. The first group of parameters spectrally assesses the proper formation and release of fricative from broadband spectrograms. The second group of parameters describes the acoustic and phonetic deviations from normal based on measurements of spectra.
4.1.1 Assessment of Formation and Release of Fricative from
Spectrograms
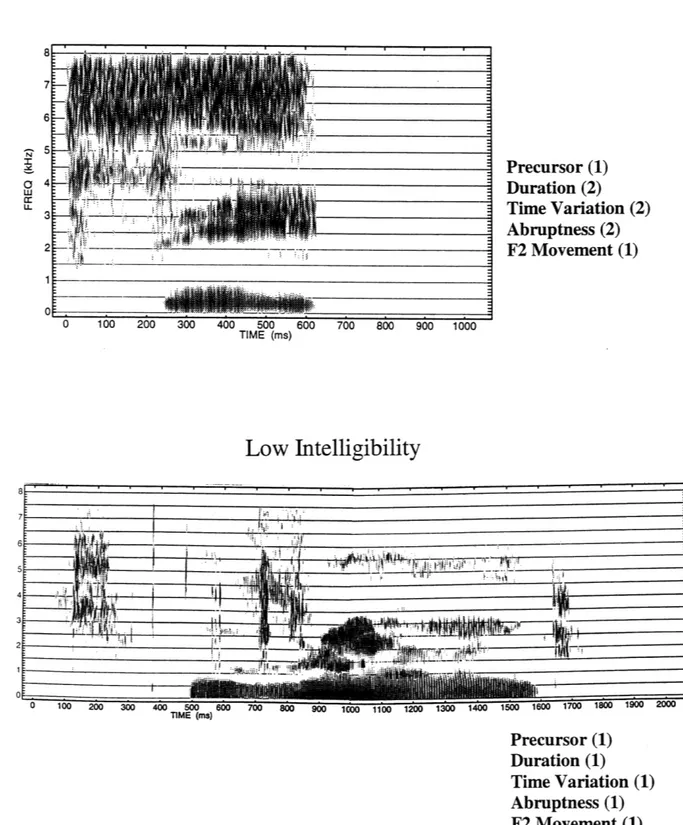
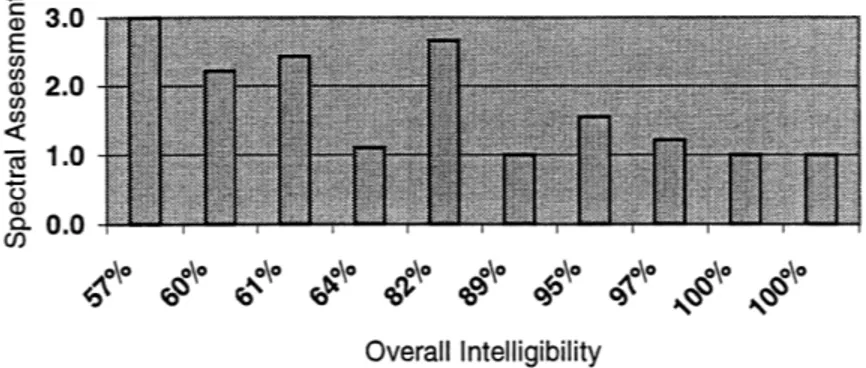
The various parts of Figure 4.1 summarizes the results of spectral assessments of formation and release of fricative /s/ in relation to overall intelligibility. Speakers are labeled by their overall intelligibility, from least to most intelligible, on the horizontal axis. Assessments have values between 1 and 3 as labeled on the vertical axis. Each bar represents assessment averages of the nine /s/ initial words produced by the specified speaker, and judged by two experimenters.
In general, speakers with low intelligibility have a tendency to have poor spectral ratings. Speakers with similar intelligibility can, however, have large individual differences in spectral characteristics. Depending on the speaker, different factors appear to contribute to the decrease in intelligibility.
4.1a) Precursor C 3.0 E2.0 S, 1.0 ' 0.0 Overall Intelligibility 4.1b) Duration * 3.0 E 2.0 < 0.0 Overall Intelligibility 4.1c) Time Variation E 3.0 E 2.0 ) 0 . 1.0 0.0 Overall Intelligibility 4.1d) Abruptness - 3.0 E 2.0 . 1.0 D 0.0 Overall Intelligibility
4.1e) F2 Movement - 3.0 • E 2.0 401.0 < 0.0 Overall Intelligibility
Figure 4.1 a)-e) Plot of assessment of formation and release of fricative I/s/ in relation to overall intelligibility of individual speakers.
4.1.2 Articulatory and Phonetic Features Based on
Measurements of Spectra
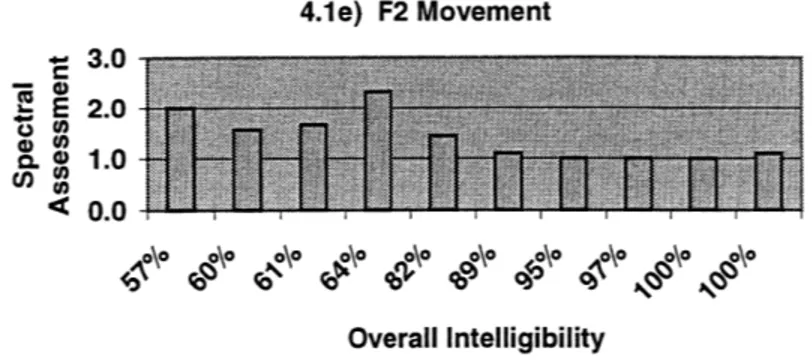
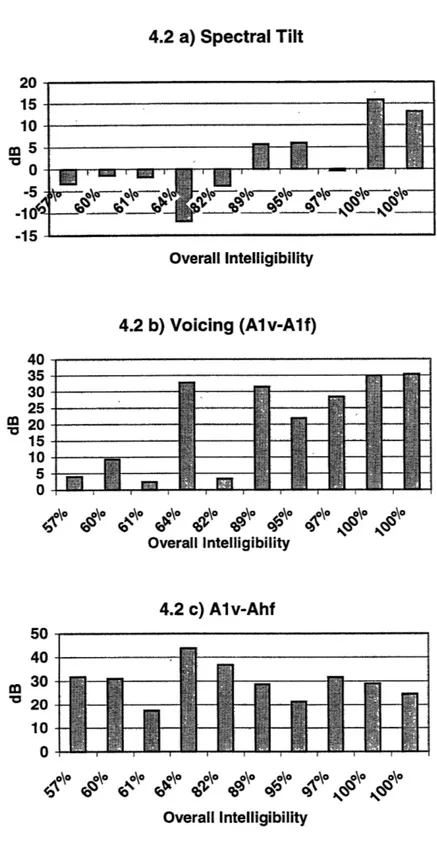
Figure 4.2 summarizes the results for the three parameters derived from spectral measurements of the fricatives and their adjacent vowel spectra. The spectral parameters give an indication of the proper adjustment of the articulators in the production of I/s/.
Speakers are labeled by their overall intelligibility, from least to most intelligible, on the horizontal axis. Vertical axes are labeled with the respective parameters. Each bar represents assessment averages of the nine /s/ initial words produced by the specified speaker.
From the plot of spectral tilt, six out of the eight dysarthric speakers showed more low frequency energy than high frequency energy in the noise spectrum. Four of these speakers have relatively low intelligibility. As discussed earlier in Chapter 2, a normal speaker with a 2-cm front cavity has a front-cavity natural frequency at about 4500 Hz. The energy at the natural resonant frequency is usually significantly greater (>10dB) than energy in the lower frequency region corresponding to the second and third formants
--which, for /s/, are normally the natural frequencies of the vocal tract behind the constriction.
The plot of Alv-Alf shows the amount of voicing that is present in the attempts of individual speakers to produce /s/. Four out of the eight dysarthric speakers voiced their /s/. Normally the amplitude of the first formant (Fl) for the fricative at the onset of glottal vibration in the following vowel is much higher (>30 dB) than the amplitude of in the F1 range for the fricative. However, in the case where speaker voices the fricative, Fl is excited in the fricative and the amplitude difference become much smaller. As expected, categorization of the /s/ produced by dysarthric speakers into voiced and unvoiced using the Alv-Alf measurement is consistent with observations made from spectrograms. Figure 4.3 gives the experimenters' assessment based on examination of spectrograms, and shows agreement with the measurements in Figure 4.2b.
Although preliminary data showed that the relative amplitude difference between high frequency region of fricative and its adjacent vowel F1 measurement was well correlated with intelligibility, results in Figure 4.2c show that, with a larger set of utterances and speakers, there is very little correlation between the two factors. The lack of correlation may be due in part to improper production of the vowel, leading to an
4.2 a) Spectral Tilt Overall Intelligibility 4.2 b) Voicing (Alv-Alf) 40 35 30 25 m 20 15 10 5 0 00 6 \o 00 \0 \O SO Overall Intelligibility 4.2 c) Alv-Ahf 50 40 30 - 20 10 0 Overall Intelligibility
Figure 4.2 Plot of three parameters derived from measurements of spectra of fricative /s/ in relation to overall intelligibility of individual speakers.
) 3.0 E Ci a 2.0 S1. C- 0.0 Overall Intelligibility
Figure 4.3 Plot of spectrogram assessment of voicing characteristic of fricative Is/ in dysarthric speakers in relation to overall intelligibility.
4.1.3 Total Assessment Average vs. Overall Intelligibility
Figure 4.4 shows a plot of the overall average rating for all five assessments (on a scale of 1 to 3) based on spectrograms of/s/ versus overall intelligibility. The data separate into three groups: normal, high intelligibility, and low intelligibility as marked. For the low intelligibility group, the average assessment on a three-point scale is about 2.0.
2.5 ) 2.0 0) tU U) ( 1.0 I-0.5 0.0 50% 60% 70% 80% 90% 100% 110% Overall Intelligibility
Figure 4.4 Total average assessment of the release and formation of fricative /s/ versus overall intelligibility of the speakers. The data separate into three distinct groups: low intelligibility, high intelligibility, and normal.
4.1.4 Data Grouping - High and Low
Intelligibility
Groups
Based on the groupings, spectral assessment and measurement data are summarized in Figures 4.5 and 4.6. M LOW U HIGH 0NORMAL
.6
.6
,O4
0~3 4, ,Figure 4.5 Spectral assessment separated by low and high intelligibility groups. Each bar represents average data for the speaker group indicated. The thin line on each bar gives the range for one standard deviation above and below the mean value.
50 40 30 m 20 10 0 -10 a LOW U HIGH El NORMAL
Figure 4.6 Measurement of spectra separated by low and high intelligibility groups. Each bar represents average data for the speaker group indicated. The thin line on each bar gives the range for one standard deviation above and below the mean value.
The low intelligibility group deviates from the normal more than the high intelligibility group. The assessments on precursor and F2 movement do not differentiate the high intelligibility group from normals. Speakers who are highly intelligible are able to make a
narrow enough constriction with their tongue blade in generating turbulence to produce the I/s/. In these speakers, high energy noise or voicing is not observed prior to frication, i.e. the precursor rating is close to 1.0. With good tongue movement control, speakers with high intelligibility are also able to produce the correct transition of F2 into the adjacent vowel. The duration of /s/ does not seem to differentiate the low from the high intelligibility group of speakers very well. Ratings on time variation and abruptness differentiate all three groups well. The two spectral measures related to voicing and spectal tilt show the expected trends, whereas high frequency peak amplitude in the fricative relative to low frequency peak amplitude in the vowel does not. In general, variability increases with decreased intelligibility.
4.2 Acoustic Analysis Based on
Is/
Perceptual Rating
Correlation between the new acoustic parameters and new perceptual /s/ perceptual rating are presented in this section. The first group of parameters spectrally assesses the proper formation and release of the fricative from observation of broadband spectrograms. The second group of parameters describes the acoustic and phonetic deviations from normal based on measurements of spectra. The new /s/ perceptual rating gives ratings solely on the adequacy of production of the word initial /s/ in dysarthric speaker. We expect the I/s/ perceptual ratings have higher correlation with the new acoustic parameters.
4.2.1 Assessment of Formation and Release of Fricative from
Spectrogram
Figures 4.7 summarizes the results of spectral assessments of formation and release of fricative I/s/ in relation to /s/ perceptual rating. Speakers are labeled by their /s/ perceptual rating, from least to most intelligible, on the horizontal axis. Assessments are on scale from 1 to 3 as labeled on the vertical axis. Each bar represents assessment averages of the nine /s/ initial words produced by the specified speaker.
In general, speakers with low intelligibility tend to have worse spectral ratings. The trend is more evident when correlated with the new /s/ perceptual rating, especially in assessment of precursor and time variation. Again, speakers with similar intelligibility have large individual differences in some spectral characteristics. Depending on the speaker, different factors contribute to the decrease in intelligibility.
4.7 a) Precursor 3.0
SE 2.0
< 0.0
1.4 1.4 1.9 1.9 2.1 2.8 2.9 3.2 3.4 4.0
Is/ Perceptual Rating
4.7 b) Duration S3.0 "E 2.0-g0) 0)0 o. 1.0-0.0. 1.4 1.4 1.9 1.9 2.1 2.8 2.9 3.2 3.4 4.0
4.7 c) Time Variation " 3.0-E 2.0 CL 1.0 <0.0. 1.4 1.4 1.9 1.9 2.1 2.8 2.9 3.2 3.4 4.0 /s/ Perceptual Rating 4.7 d) Abruptness 2 3.0 -E 2.0 . 1.0 S0.0 -1.4 1.4 1.9 1.9 2.1 2.8 2.9 3.2 3.4 4.0 /s/ Perceptual Rating 4.7 e) F2 Movement ' 3.0 E 2.0 CL 1.0 0.0 -1.4 -1.4 1.9 1.9 2.1 2.8 2.9 3.2 3.4 4.0 /s/ Perceptual Rating
Figure 4.7 a)-e) Plot of assessment of formation and release of fricative /s/ in relation to /s/ perceptual rating of individual speakers.
4.2.2 Articulatory and Phonetic Features Based on
Measurements of Spectra
Figure 4.8 summarizes the results of spectral measurement of the fricative and its adjacent vowel spectrum in relation to /s/ perceptual rating. The calculations give an indication as to the proper adjustment of articulators and vocal tract in the production of
/s/. Speakers are labeled by their overall intelligibility, from least to most intelligible, on the horizontal axis. Vertical axes are labeled with the respective parameters. Each bar represents assessment averages of the nine /s/ initial words produced by the specified
speaker.
4.8 a) Spectral Tilt
Is/ Perceptual Rating
4.8 b) Voicing (Alv-Alf) 40 30 S20 10 04 1.4 1.4 1.9 1.9 2.1 2.8 2.9 3.2 3.4 4.0
Is/ Perceptual Rating
4.8 c) Alv-Ahf 50 40 m 30 20 10 0 1.4 1.4 1.9 1.9 2.1 2.8 2.9 3.2 3.4 4.0 /s/ Perceptual Rating
Figure 4.8 Plot of measurements of spectra of fricative /s/ in relation to /s/ perceptual rating of individual speakers.
__II
ZU V 0
--Trends similar to the analysis based on overall intelligibility are seen in the new analysis. As expected, spectral tilt values are better correlated with /s/ perceptual rating. The six speakers that have higher low frequency energy than high frequency energy noise have the lowest perceptual ratings. A combination of factors leads to a decrease in the rating. An example is the speaker with the third lowest perceptual rating. Although this speaker did not exhibit a significant amount of voicing, the spectral shape was more deviant from the normal, and this factor apparently gave rise to lower rating.
4.2.3 Total Average Assessment vs. New Perceptual Rating
Figure 4.9 shows a plot of the total average rating for assessments of spectrograms of /s/ versus /s/ perceptual rating. The data shows a relative linear correlation between intelligibility and the average combination of all spectral assessments.
2.5 2.0 a) E U) U) a) 0) 1.5 u) a) QL 0) S1.0 0 0.5 0.0 1 1.5 2 2.5 3 3.5 4 4.5 5
Is/ Perceptual Rating
Figure 4.9 Total average assessment of the release and formation of fricative Is/ versus Is/ perceptual rating of the speakers.
4.3 Statistical Analysis
4.3.1 Overall Intelligibility vs. New
/s/
Perceptual Rating
Figure 4.10 shows a plot of the overall intelligibility determined previously by Hwa-Ping Chang, and the new /s/ perceptual rating for the eight dysarthric speakers and the two normals. The two sets of data are highly correlated, although there are some deviations. The two data sets have a Pearson correlation coefficient of 0.926. Since the two tests were performed separately by different experienced listeners, the high correlation gives validity to both sets of data. From results presented in the previous sections, the /s/ perceptual rating is indeed better correlated with the new acoustical parameters that assess the proper production of /s/ quantitatively. The two data have a person correlation coefficient of 0.926. 120% 100% 80% Z, -S 60% 40% 200/% 0% 1.5 2 2.5 3 3.5 4 4.5
Is/ Perceptual Rating
Figure 4.10 Linear correlation between overall intelligibility determined previously by Hwa-Ping Chang and new Is/ perceptual rating devised in this thesis.
4.3.2 Pearson Correlation Matrix
The Pearson product moment correlation coefficient, r, is a dimensionless index that ranges from -1.0 to 1.0 inclusive, and reflects the extent to which there is a linear relationship between two data sets. If the correlation is negative, then large values of one data set associate with small values of the other. If the correlation is positive, then large values of one data set are associated with large values of the other. Results are
summarized in Table 4.2.
Overall /s/ Precursor Duration Time Abrupt F2 Spectral Voicing
Intelligibility perceptual Var. ness Move Tilt
rating ment Overall 1.000 Intelligibility Is/ Perceptual 0.926 1.000 Rating Precursor -0.767 (4) -0.750 (6) 1.000 Duration -0.403 (7) -0.496 (7) 0.478 1.000 Time Variation -0.952 (1) -0.887 (1) 0.750 0.213 1.000 Abruptness -0.861 (3) -0.859 (2) 0.845 0.557 0.772 1.000 F2 Movement -0.871 (2) -0.775 (5) 0.778 0.125 0.912 0.603 1.000 Spectral Tilt 0.753 (5) 0.828 (3) -0.374 -0.398 -0.770 -0.546 -0.803 1.000 Voicing 0.695 (6) 0.801 (4) -0.735 -0.375 -0.706 -0.750 -0.383 0.486 1.000 Al v-Ahf -0.220 (8) -0.216 (8) -0.266 -0.294 0.305 -0.229 0.520 0.132 0.132
Table 4.2 Pearson correlation coefficient matrix for the various spectral measures and intelligibility or perceptual rating scores.
Rankings of correlation between the parameter and intelligibility are listed in parentheses. Since the correlation coefficients are extremely close to one another, the rankings should only be taken as a guide and one should not place too much importance on the absolute significance of each of the parameters. The top three parameters that correlate with the I/s/
perceptual rating are: time variation, abruptness, and spectral tilt, compared with time variation, F2 movement, and abruptness when correlating with overall intelligibility. Of some interest, perhaps, is the high correlation between the perceptual rating for /s/ and the overall intelligibility for all 70 words in the test of Kent et al. (1989). The implication is that if a speaker has difficulty in producing /s/, then he or she might also have difficulty with other sounds. Another point of interest is that duration does not seem to correlate well with any of the other parameters and has the lowest correlation with overall intelligibility and I/s/ perceptual rating among all the parameters.
4.3.3 Discriminant Analysis
Given the high correlation coefficients, we proceeded to perform a discriminant analysis. The discriminant analysis was performed to determine the factors that contribute to the classification of the speakers into three intelligibility groups: low intelligibility, high intelligibility, and normal. Speakers (M3, M4, F3, F4) were all classified into the low intelligibility group based on the overall intelligibility score as well as the perceptual ratings. The other four speakers (Ml, M2, Fl, F2) were classified into the high intelligibility group. The contributions of all eight of the measures to this classification were statistically significant. Correlations were calculated between each of the measures and both factors in the discriminant analysis. The three measures that showed the highest
correlation with the first factor are ranked as following: 1) spectral tilt, 2) time variation within I/s/, and 3) precursor.
4.4 Discussion on Individual Subjects
Eight speakers with varying degrees of dysarthria and etiologies were the subjects for this study. In this section, significant findings for two of the speakers will be discussed in detail. One of the subjects, Fl, has the highest overall intelligibility score, but ranked third on the /s/ perceptual rating scale. The other subject, F3, is one of the least intelligible speakers. The ratings based on spectrograms for each of these subjects together with those of a normal speaker are summarized in Figures 4.11 and 4.12.
3.5 S2.0 1.5 1.0 0.5 S0.0 l ES, 97% Overall, 2.8
Is/ Perceptual Rating OCH, 61% Overall, 1.4
/Is Perceptual Rating
-I u Normal SpeaKer,
o ~" 6 100% Overall, 3.4 /s/
4 / Perceptual Rating
Figure 4.11 Summary of assessment of formation and release of fricative Is/ of three speakers, one normal speaker, one dysarthric speaker with high intelligibility, and one with low intelligibility speaker.