HAL Id: hal-03051668
https://hal.archives-ouvertes.fr/hal-03051668
Submitted on 10 Dec 2020
HAL is a multi-disciplinary open access
archive for the deposit and dissemination of sci-entific research documents, whether they are pub-lished or not. The documents may come from teaching and research institutions in France or abroad, or from public or private research centers.
L’archive ouverte pluridisciplinaire HAL, est destinée au dépôt et à la diffusion de documents scientifiques de niveau recherche, publiés ou non, émanant des établissements d’enseignement et de recherche français ou étrangers, des laboratoires publics ou privés.
Eurasian snow in relation to the winter North Atlantic
Oscillation
María Santolaria-Otín, Javier García-Serrano, Martin Ménégoz, Joan Bech
To cite this version:
María Santolaria-Otín, Javier García-Serrano, Martin Ménégoz, Joan Bech. On the observed connec-tion between Arctic sea ice and Eurasian snow in relaconnec-tion to the winter North Atlantic Oscillaconnec-tion. En-vironmental Research Letters, IOP Publishing, In press, �10.1088/1748-9326/abad57�. �hal-03051668�
On the observed connection between Arctic sea ice and Eurasian snow
in relation to the winter North Atlantic Oscillation
To cite this article before publication: María Santolaria-Otín et al 2020 Environ. Res. Lett. in press https://doi.org/10.1088/1748-9326/abad57
Manuscript version: Accepted Manuscript
Accepted Manuscript is “the version of the article accepted for publication including all changes made as a result of the peer review process, and which may also include the addition to the article by IOP Publishing of a header, an article ID, a cover sheet and/or an ‘Accepted Manuscript’ watermark, but excluding any other editing, typesetting or other changes made by IOP Publishing and/or its licensors” This Accepted Manuscript is © 2020 The Author(s). Published by IOP Publishing Ltd.
As the Version of Record of this article is going to be / has been published on a gold open access basis under a CC BY 3.0 licence, this Accepted Manuscript is available for reuse under a CC BY 3.0 licence immediately.
Everyone is permitted to use all or part of the original content in this article, provided that they adhere to all the terms of the licence https://creativecommons.org/licences/by/3.0
Although reasonable endeavours have been taken to obtain all necessary permissions from third parties to include their copyrighted content within this article, their full citation and copyright line may not be present in this Accepted Manuscript version. Before using any content from this article, please refer to the Version of Record on IOPscience once published for full citation and copyright details, as permissions may be required. All third party content is fully copyright protected and is not published on a gold open access basis under a CC BY licence, unless that is specifically stated in the figure caption in the Version of Record.
View the article online for updates and enhancements.
Accepted
manuscript
and Eurasian snow in relation to the winter North
2
Atlantic Oscillation
3
Mar´ıa Santolaria-Ot´ın1,2 & Javier Garc´ıa-Serrano1,3 & Martin
4
M´en´egoz1,2 & and Joan Bech3
5
1Barcelona Supercomputing Center (BSC), Barcelona, Spain 6
2Institut des G´eosciences de l’Environnement (IGE), Universit´e Grenoble Alpes, 7
France
8
3Group of Meteorology, Universitat de Barcelona (UB), Spain. 9
E-mail: santolariaotin.maria@gmail.com
10
December 2019
11
Abstract. Sea ice concentration (SIC) in the eastern Arctic and snow cover extent
12
(SCE) over central Eurasia in late autumn have been proposed as potential predictors
13
of the winter North Atlantic Oscillation (NAO). Here, maximum covariance analysis
14
is used to further investigate the links between autumn SIC in the Barents-Kara
15
Seas (BK) and SCE over Eurasia (EUR) with winter sea level pressure (SLP) in
16
the North Atlantic-European region over 1979-2019. As shown by previous studies,
17
the most significant covariability mode of SIC/BK is found for November. Similarly,
18
the covariability with SCE/EUR is only statistically significant for November, not
19
for October. Changes in temperature, specific humidity, SIC/BK and SCE/EUR in
20
November are associated with a circulation anomaly over the Ural-Siberian region
21
that appears as a precursor of the winter NAO; where the advection of climatological
22
temperature/humidity by the anomalous flow is related to SCE/EUR and SIC/BK
23
anomalies.
Accepted
manuscript
Keywords: North Atlantic Oscillation, Teleconnection, Sea Ice, Snow Cover
25
1. Introduction
26
The North Atlantic Oscillation (NAO) is the most prominent pattern of atmospheric
27
circulation variability in the Euro-Atlantic sector and has a strong influence on the
28
regional surface climate (e.g., ?, ?). Understanding the processes that potentially drive
29
the NAO state is crucial to improve its predictability. Many recent studies have stressed
30
the potential predicting role of eastern Arctic sea ice and continental snow over Eurasia
31
in autumn, with a reduction of sea ice concentration (SIC) in the Barents-Kara Seas
32
and an increase of snow cover extent (SCE) across Siberia that would favor a negative
33
NAO phase during the subsequent winter (e.g., ?, ?, ?, ?, ?).
34
Sea ice reduction acts as a source of heat and moisture fluxes that can impact
35
both local and large-scale atmospheric circulation. Observational studies (e.g., ?, ?)
36
and numerical simulations with both atmospheric general circulation models (AGCMs)
37
(e.g., ?, ?, ?, ?) and coupled climate models (e.g., ?, ?) have found that an anomalous
38
anticyclone over northern Eurasia related to low SIC/BK in late-autumn tends to evolve
39
into a negative NAO-like pattern in winter through a lagged stratospheric pathway.
40
The tropospheric anomalies related to low SIC/BK display a Rossby wave-like anomaly
41
crossing Eurasia, reinforcing the climatological wave pattern. An upward propagation
42
of wave activity finally reaches the stratosphere and weakens the polar vortex. The
43
downward response decelerates the westerlies in the North Atlantic sector shifting the
44
storm-tracks southward, which is tied to a negative NAO phase (e.g., ?, ?). Yet, causality
45
in this chain of processes has to be confirmed (?, ?, ?).
46
Snow cover variations affect the atmosphere via changes in reflected shortwave solar
47
radiation (albedo), emissivity of longwave radiation, insulation of the atmosphere from
Accepted
manuscript
the soil layers below, and latent-heat and water release in association with melting (e.g.,
49
?). Observational studies (e.g., ?) and GCM experiments (e.g., ?, ?, ?, ?, ?, ?, ?)
50
showed that an increase in the continental SCE over Eurasia (SCE/EUR) in late
51
autumn can also favor a negative NAO phase in winter via
troposphere-stratosphere-52
troposphere interactions. The mechanism relies on the regional radiative cooling induced
53
by positive SCE anomalies over central Eurasia, which modifies the structure and
54
vertical propagation of planetary-scale wave activity eventually triggering a similar
55
stratospheric pathway as described above. But again, as for SIC/BK, causality related
56
to SCE/EUR has yet to be fully established (?, ?).
57
The stationarity of the SIC-NAO and SCE-NAO relationships has been questioned
58
(e.g., ?, ?) due to the shortness of the observational record and the modulation of the
59
polar vortex by the Quasi-Biennal Oscillation (?, ?). Besides, the connection between
60
these two potential predictors of the winter NAO, i.e. SIC/BK and SCE/EUR, is still an
61
open question (?). Although previous observational and modeling studies have shown
62
that sea-ice reduction over the eastern Arctic is associated with increased snowfall over
63
Siberia (e.g., ?, ?, ?, ?, ?, ?, ?, ?), the physical processes underlying this relationship are
64
unclear. There is also a lack of consensus to determine both the respective contributions
65
of sea-ice and snow-cover anomalies to the winter NAO predictability and the exact
66
timing of their lagged influence on the atmospheric circulation (e.g., ?).
67
The aim of this study is to comprehensively set the observed statistical relationship
68
between SIC/BK and SCE/EUR with the winter NAO and discuss the associated
69
atmospheric circulation, in order to assist model validation in targeted sensitivity
70
experiments to come (?, ?). The novelty relies on getting insight into the dynamics
71
underlying the SIC/BK and SCE/EUR anomalies linked to the atmospheric precursor
72
of the winter NAO, namely the Ural-Siberian pattern.
Accepted
manuscript
2. Data and Methodology
74
In this study, empirical orthogonal function (EOF; ?) and maximum covariance analysis
75
(MCA; ?) are used to describe the spatio-temporal structure of SIC/BK and SCE/EUR
76
variability as well as their covariability with winter SLP anomalies over the period
1979-77
2019. EOF analysis has been employed to test the robustness of the MCA results. The
78
NAO index is defined as the leading principal component (PC), namely standardized
79
time series, corresponding to the leading mode (first EOF) of sea level pressure anomalies
80
in the North-Atlantic-European region (Figure 1a)(NAE: 20oN − 90oN, 90oW − 40oE;
81
e.g. ?).
82
MCA is a singular value decomposition (SVD) applied to the covariance matrix of two
83
fields that share a common sampling dimension (the actual time) but can be spatially
84
independent. The output consists of pairs of spatial patterns, each one corresponding
85
to a field, and associated standardized time-series called expansion coefficients (ECs).
86
Each MCA mode is characterized by the squared covariance (sc) which is the eigenvalue
87
of the covariance matrix, the squared covariance fraction (scf) which is a measure of the
88
fraction of explained covariance compared to other modes, and the correlation between
89
the expansion coefficients (cor).
90
MCA is respectively applied to SIC in the Barents-Kara Seas (BK: 50oN − 90oN, 30oW − 120oE
91
), and Eurasian SCE (EUR: 20oN − 90oN, 0o− 150oE) for autumn (from September to
92
November) as predictor fields and winter SLP/NAE as predictand field (seasonal
aver-93
age for DJF). The first MCA mode is analyzed in both cases. A Monte Carlo test based
94
on 100 permutations shuffling only the atmospheric field (i.e. SLP) with replacement is
95
performed to determine the statistical significance of these MCA modes. By performing
96
MCA upon each resampling we generate a probability density function (PDF) that is
97
used to compute the significance level (hereafter simply p-value) which corresponds to
Accepted
manuscript
the number of randomized values (sc, scf or cor) that exceed the actual value being
99
tested (e.g., ?).
100
Monthly SIC data are provided by HadISST (Hadley Center Sea Ice and Sea
101
Surface Temperature; ?) at 1.0o× 1.0o resolution and SCE data from the Global Snow
102
Laboratory at Rutgers University (?). For SCE, October is defined as the average of the
103
calendar weeks 40-44 (?), and November of the weeks 44-48. Compared to ? for SCE
104
and ? for SIC, our choice of dataset does not affect results. Monthly data of atmospheric
105
variables are given by ERA-Interim reanalysis available from the European Center for
106
Medium-Range Weather Forecasts (ECMWF) at 2.5o× 2.5o resolution (?).
Forecast-107
accumulated turbulent (sensible plus latent) and radiative (shortwave plus longwave)
108
heat fluxes initialized twice a day (00, 12h) from ERA-Interim are also used; upward
109
is positive, from surface to atmosphere. All anomalies are detrended before analysis
110
to focus on the interannual variability, aiming to exclude any long-term relationship
111
among variables. Different detrending methods (1st-, 2nd- and 3th-order polynomial
112
fits) have been evaluated to assess robustness of the results; in the manuscript we only
113
show cubicly detrended anomalies because of the strong non-linear trends in SIC/BK,
114
but the results are largely insensitive to the detrending method.
115
To explore the dynamics involved in the statistical relationships, regression maps
116
are computed by projecting different anomalous fields onto a time-series, either the NAO
117
index or the MCA expansion coefficients. In this case, the statistical significance of the
118
regressed anomalies is evaluated with a two-tailed Students t-test at 95% confidence
119
level.
Accepted
manuscript
3. Results
121
3.1. Covariability: SIC/BK and SCE/EUR
122
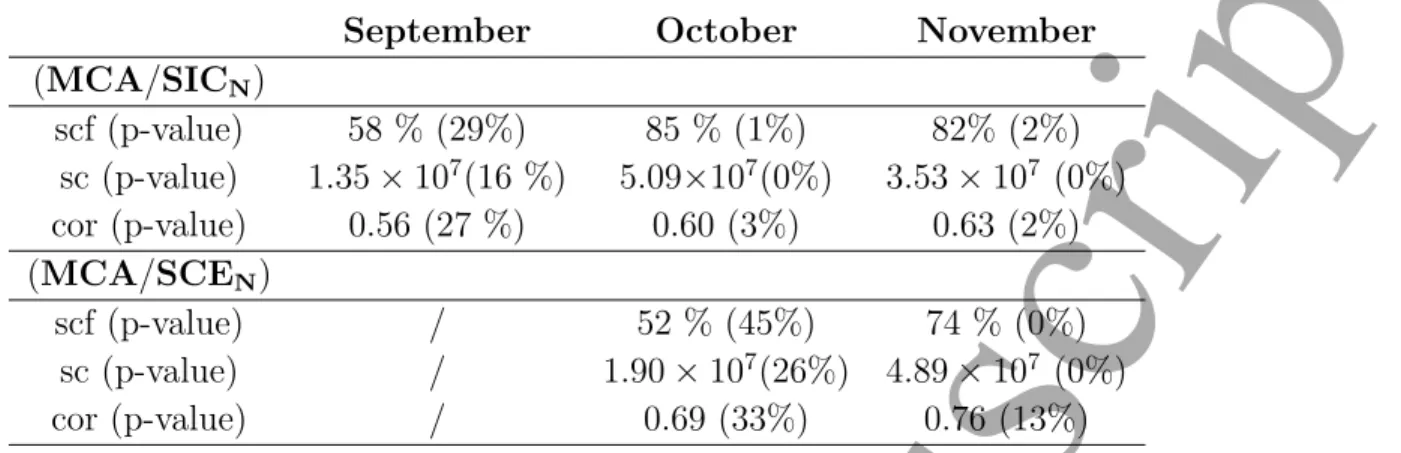
The leading MCA mode based on September SIC/BK anomalies explains 58% of scf
123
(p-value 29%), with a sc of 1.35 × 10⁷ (p-value 16%) and yields a cor of 0.56 (p-value
124
27%)(Table 1). These high p-values indicate a low confidence level for this relationship,
125
associated with a low signal-to-noise ratio and non-significant predictability (e.g., ?, ?).
126
For October, the leading MCA mode explains 85% of scf (p-value 1%), with a sc of
127
5.09 × 10⁷ (p-value 0%),and yields a cor of 0.60 (p-value 3%)(Table 1). The leading
128
MCA mode based on November SIC/BK anomalies explains 82% of scf (p-value 2%),
129
with a sc of 3.35 × 10⁷ (p-value 0%) and yields a cor of 0.63 (p-value 1%)(Table 1).
130
The MCA-SIC/BK in October is also significant, but there is no clear atmospheric
131
mechanism responsible for a lagged relationship with the winter NAO (see ?). According
132
to ?, the potential influence of October SIC/BK anomalies on the winter Euro-Atlantic
133
climate would rely on its contribution to November SIC/BK anomalies. On the other
134
hand, the dynamics associated with SIC/BK anomalies in November are much more
135
plausible and largely reported. It could involve a stratospheric pathway (e.g., ?, ?, ?)
136
and represent a suitable predictability source of the winter Euro-Atlantic climate (e.g.,
137
?, ?, ?, ?). Thereby, the analysis is focused hereafter on November SIC/BK variability.
138
To simplify the nomenclature, we will refer to the MCA covariability mode between
139
SIC/BK in November and SLP/NAE in winter as MCA/SICN.
140
Figure 1b shows the regression map of SIC anomalies in November onto the
141
SIC expansion coefficient of MCA/SICN. The resulting SIC pattern shows negative
142
anomalies (i.e. sea-ice reduction) over the northern Barents Sea and the whole Kara
143
Sea. The SLP covariability pattern of MCA/SICN (not shown) strongly resembles the
144
negative phase of the NAO (Figure 1a). The SLP expansion coefficient of MCA/SICN
Accepted
manuscript
20°N 35°N 50°N 65°N 80°N 80°W 60°W 40°W 20°W 0° 20°E 40°E (a) NAO Pattern (DJF)-5 -4.5 -4 -3.5 -3 -2.5 -2 -1.5 -1 1 1.5 2 2.5 3 3.5 4 4.5 5 hPa 0° 30°E 120°E 150°E 60°E 90°E (b) MCA/SICN -20 -16 -14 -12 -10 -8 -6 -4 -2 -1 1 2 4 6 8 10 12 14 16 20 % 0° 30°E 120°E 150°E 60°E 90°E (c) MCA/SCEN -20 -16 -14 -12 -10 -8 -6 -4 -2 -1 1 2 4 6 8 10 12 14 16 20 %
Figure 1. (a) Leading EOF of detrended sea level pressure anomalies (hPa) in winter (DJF) over the North Atlantic-European (NAE) region, with a fraction of explained variance of 47.9 % ; note that the negative phase of the NAO is shown. Leading MCA mode between (b) SIC over Barents-Kara Seas (%) and (c) SCE over Eurasia (%) in November with winter (DJF) SLP over the North Atlantic-European region (hPa). Statistically significant areas at 95 % confidence level based on a two-tailed Student’s test are contoured. Green contours stand for the climatological sea-ice edge estimated at 15% in (b) and the climatological snow cover edge estimated at 50% in (c); the full field of SIC and SCE climatology can be found in Figure S1.
has indeed a correlation of -0.99 with the winter NAO index, illustrating that the NAO
146
has been effectively captured as predictand.
147
Caution is required to assert cause and effect based on observational data and MCA
148
results. Concerning the former, several studies using AGCM simulations (e.g., ?, ?, ?)
149
have also found a lagged teleconnection between SIC/BK anomalies and the NAO,
150
although the timing may be model dependent (?). As for the latter, we further explore
151
the suitability of SIC/BK as predictor. The SIC expansion coefficient of MCA/SICN is
152
compared with the leading principal component (PC1) of SIC over the eastern Arctic
Accepted
manuscript
and over the Northern Hemisphere in November: the SIC expansion coefficient yields
154
a high correlation with both the regional PC1 (0.98) and the hemispheric PC1 (0.93).
155
Likewise, the lagged regressions of winter SLP onto the two PC1s are almost identical to
156
that of the SIC expansion coefficient (not shown), which is consistent with alternative
157
approaches based on area-averaged SIC indices (?, ?). Hence, the covariability mode
158
of MCA/SICN is associated with a leading mode of SIC variability per se. Note that
159
the SIC pattern of MCA/SICN corresponds to the second EOF of turbulent heat flux
160
in ?, with a strong ocean-to-atmosphere forcing (see also ? and ?); which is unrelated
161
to the so-called “Warm Arctic-Cold Siberia” (WACS) pattern in winter. It follows
162
that November SIC/BK anomalies can be considered as a potential predictor of the
163
subsequent winter NAO. Lagged regression of SIC anomalies in November onto the
164
winter NAO index (Figure S2a) support this conclusion.
165
Analogous to the procedure followed for SIC/BK, MCA based on SCE/EUR
166
anomalies in late autumn (October, November) have been performed. Note that
167
September has not been considered because there is almost no snow cover over the
168
continent at that time of the year (e.g., ?). The leading MCA mode for October
169
SCE/EUR anomalies explains 52% of scf (p-value 45%), with a sc of 1.90 × 10⁷
(p-170
value 26%), and yields a cor of 0.69 (p-value 33%). For November, the leading MCA
171
explains 74% of scf (p-value 0%), with a sc of 4.89 × 10⁷(p-value 0%) and yields a
172
cor of 0.76 (p-value 13%). Extending the period using reanalyzed SCE data (instead
173
of satellite-derived products) would probably not lead to better statistical results (?)
174
especially when considering the potential non-stationarity of the snow-NAO relationship
175
(?). In contrast to previous studies that suggested a statistically significant relationship
176
between October SCE/EUR and the winter NAO (e.g., ?, ?, ?), these results reveal that
177
the covariability of October SCE/EUR with winter SLP/NAE is largely statistically
Accepted
manuscript
non-significant, namely not discernable from noise. However, we found that November
179
SCE/EUR anomalies tend to be followed by NAO-like atmospheric variability, a result
180
consistent with the monthly analysis of ?.
181
This finding is supported by the lagged regression maps of autumn SCE/EUR
182
anomalies onto the winter NAO index, where October does not show statistically
183
significant anomalies over Eurasia (not shown) but November does so (Figure S2b).
184
Thus, in the following the analysis is restricted to November SCE/EUR. As for SIC,
185
we will refer to the leading MCA covariability mode between SCE/EUR in November
186
and SLP/NAE in winter as MCA/SCENfor the sake of readability. Figure 1c shows the
187
covariability mode of SCE from MCA/SCEN, exhibiting statistically significant positive
188
anomalies (i.e. snow cover increase) over central-eastern Eurasia. The SLP covariability
189
of MCA/SCEN displays a negative NAO-like pattern (not shown, but similar to Figure
190
1a) and its expansion coefficient correlates at -0.99 with the winter NAO index.
191
The SCE expansion coefficient of MCA/SCEN attains only a correlation of 0.58
192
(0.30) with the first (second) EOF of November SCE/EUR. The fraction of explained
193
variance of the two leading EOFs is very low (EOF1=15%, EOF2=12%), indicating
194
that they are not well separated statistically (following ?) and illustrating that SCE is
195
a noisy field. This result implies, as opposed to the case of November SIC/BK, that
196
the covariability of MCA/SCEN does not rely on a dominant variability mode of snow
197
cover itself, which questions the feasibility of using SCE/EUR as a potential predictor
198
for the NAO.
199
Repeating the analysis with snow depth (SD) from ERA-Interim yields consistent
200
results: namely, the MCA with October SD not being significant and the one with
201
November SD showing hints of significance. In the latter case, as opposed to using
202
satellite-derived SCE, sc and scf are higher but above 10% significance level, while the
Accepted
manuscript
September October November
(MCA/SICN) scf (p-value) 58 % (29%) 85 % (1%) 82% (2%) sc (p-value) 1.35 × 10⁷(16 %) 5.09×10⁷(0%) 3.53 × 10⁷ (0%) cor (p-value) 0.56 (27 %) 0.60 (3%) 0.63 (2%) (MCA/SCEN) scf (p-value) / 52 % (45%) 74 % (0%) sc (p-value) / 1.90 × 10⁷(26%) 4.89 × 10⁷ (0%) cor (p-value) / 0.69 (33%) 0.76 (13%)
Table 1. Results of the MCA covariability analysis between autumn SIC/BK and SCE/EUR with winter SLP/NAE for the period 1979-2019. The squared covariance fraction (scf), the squared covariance (sc) and the correlation between the expansion coefficients (cor) are listed for each mode, together with the significance level (p-value).
correlation between expansion coefficients is smaller but significant at 3% (cor=0.52).
204
The MCA/SDNpattern (not shown) and the regression of November SD/EUR anomalies
205
onto the winter NAO index (Figure S3) display positive anomalies over central Eurasia,
206
particularly west of the Baikal Lake.
207
3.2. Ural-Siberian anticyclone (SCAND)
208
To shed light on the large-scale atmospheric circulation in November preceding the
209
winter NAO, the climatology and variability of SLP over Eurasia is analysed. This
210
is compared to contemporaneous SLP anomalies associated with MCA/SICN and
211
MCA/SCEN, together with the SLP precursor of the NAO obtained by regressing
212
November SLP anomalies onto the winter NAO index.
213
Figure 2b shows the regression map of Northern Hemisphere (NH) SLP anomalies
214
onto the first EOF of November SLP anomalies over Eurasia (20oN − 90oN, 0o− 150oE;
215
EOF1). This regional EOF1 strongly resembles the hemispheric EOF1 (not shown;
216
r=0.89), which is also a dominant mode of variability later in the season - in winter
217
(?). The pattern is dominated by an anticyclonic circulation anomaly over the subarctic
218
Eurasian region, but exhibits a dipole-like structure with a weaker center of opposite sign
Accepted
manuscript
(a) Climatology SLP (Nov)
990 996 1002 1008 1014 1020 1026 hPa
(b) EOF SLPEUR(Nov)
-11 -9 -7 5 -4 -3 -2 -1 1 2 3 4 5 7 9 11 hPa
(d) SLPNx MCA/SCEN
(c) SLPNx MCA/SICN (e) SLPNx NAODJF
-5.0 -4.0 -3.0 -2.0 -1.0 1.0 2.0 3.0 4.0 5.0 hPa
Figure 2. (a) Climatology (hPa ; shading) and standard deviation (ci=2hPa ; green contours) of SLP in November. Regression map of detrended Northern Hemisphere sea level pressure anomalies (hPa) in November onto (b) the leading PC from the EOF analysis of November SLP over Eurasia (40◦N -90◦N , 0◦-150◦E ; 41.5 % fraction of explained variance), (c) the MCA/SICN expansion coefficient, (d) the MCA/SCEN
expansion coefficient and (e) the winter NAO index - multiplied by -1. Statistically significant areas at 95 % confidence level based on a two-tailed Student’s test are contoured.
over western Europe. The identification of this surface anticyclone has been ambiguous
220
in the literature. It appears to be related to Ural blocking at daily time-scales (e.g.,
221
?, ?), but it also constitutes a prominent mode of variability at monthly and seasonal
222
time-scales (e.g., ?, ?). ? tentatively named it as the Russian (RU) pattern, but here it
223
will be referred to as the Ural-Siberian (U-S) pattern. Interestingly, the centers of action
224
of EOF1 (Figure 2b) tightly project on the areas of maximum interannual variability
225
(i.e. standard deviation; green contours in Figure 2a), as it is also the case for the
226
mid- (500hPa; ?) and upper-tropospheric (200hPa; ?) geopotential height. The leading
Accepted
manuscript
mode of Eurasian geopotential height variability in the mid-upper troposphere, which
228
has a better-defined wave-like signature (Figure S4a at 300hPa; e.g., ?), can be more
229
easily identified as the Scandinavian (SCAND) pattern, a mode of internal variability
230
associated with Rossby wave propagation dynamics and maintained by transient-eddy
231
feedback (e.g., ?, ?). Note that the U-S pattern of SLP corresponds to the surface
232
projection of the SCAND pattern at upper levels, and the other way around, since they
233
show a marked barotropic structure (e.g., ?, ?).
234
The statistically significant SLP anomalies preceding the winter NAO also show a
235
dipole-like structure (Figure 2e), projecting on the centers of the U-S pattern over the
236
Siberian coast and the British Isles (Figure 2b). At 300hPa, the winter NAO is preceded
237
by a wave-like structure over Eurasia, which also projects on the SCAND pattern at
238
upper levels (Figure S4c). These results are consistent with ?, ?, ? and ? who showed
239
that the winter NAO tends to be preceded by a wave-like anomaly over Eurasia, which
240
triggers a stratospheric pathway. These findings suggest that the U-S/SCAND pattern
241
in November may eventually evolve into the winter NAO with a 1-month lead time and
242
might be considered a precursor of the winter NAO. This line of reasoning has been
243
recently confirmed by ?.
244
Figure 2c and 2d show the regression map of contemporaneous SLP anomalies onto
245
expansion coefficients of SIC and SCE from MCA/SICN and MCA/SCEN, respectively.
246
The anomalous dipole-like pattern associated with MCA/SCEN(Figure 2d) has a strong
247
resemblance to EOF1 (Figure 2b), which is consistent with previous studies using other
248
autumnal Eurasian SCE indices (e.g., ?, ?). It is worth noting that there is no signal over
249
the Siberian High region (reddest areas at mid-latitudes of Figure 2a), which would be
250
expected from the radiative feedback linked to Eurasian snow cover anomalies (Figure
251
1c and S2b). However, the anomalous Ural-Siberian anticyclone in Figure 2b has been
Accepted
manuscript
usually interpreted as a north-westward expansion of the Siberian High in response to
253
increased SCE over central Eurasia (?, ?, ?, ?, ?), although the U-S pattern develops
254
over the subpolar low-pressure belt along the Siberian coast (blue shading in Figure
255
2a), linked to local transient-eddy activity (e.g., ?) and cyclone tracks (e.g., ?). In
256
fact, no AGCM study prescribing positive Eurasian SCE anomalies has reported such a
257
circulation response. Instead, they have found a regional baroclinic structure associated
258
with a reinforced Siberian High at surface and cyclonic circulation anomalies in the
259
upper troposphere (?, ?, ?, ?, ?, ?, ?, ?); the most significant being the reinforcement
260
of the Siberian High (?, ?). Thus, there is no modelling evidence supporting the impact
261
or triggering role of SCE/EUR anomalies on the U-S/SCAND pattern. This line of
262
reasoning suggests that the SCE/EUR anomalies in November related to the winter
263
NAO (Figure 1c and S2b) might be potentially driven by the Ural-Siberian anticyclone
264
(Figure 2b) rather than the other way around, which is in agreement with ? and ? and
265
further discussed in Section 3.4.
266
On the other hand, the dipole-like pattern of SLP anomalies associated with
267
MCA/SICN (Figure 2c) is slightly different from the other patterns, as the centers
268
of action are located downstream, with the anticyclonic anomalies shifted toward
269
the continent and the cyclonic anomalies displaced toward the Nordic Seas. The
270
vertical structure of the anticyclonic anomalies over the Siberian coast reveals some
271
baroclinicity(cf. Figure S4a), in agreement with AGCM simulations (e.g., ?), which
272
suggests a possible contribution of SIC/BK variability on the U-S pattern (?) that is
273
further discussed in section 3.4.
274
3.3. Linkage between SIC/BK and SCE/EUR
275
To explore the relationship between November SIC/BK and SCE/EUR in relation to the
276
winter NAO, regional near-surface conditions of temperature (T925), specific humidity
Accepted
manuscript
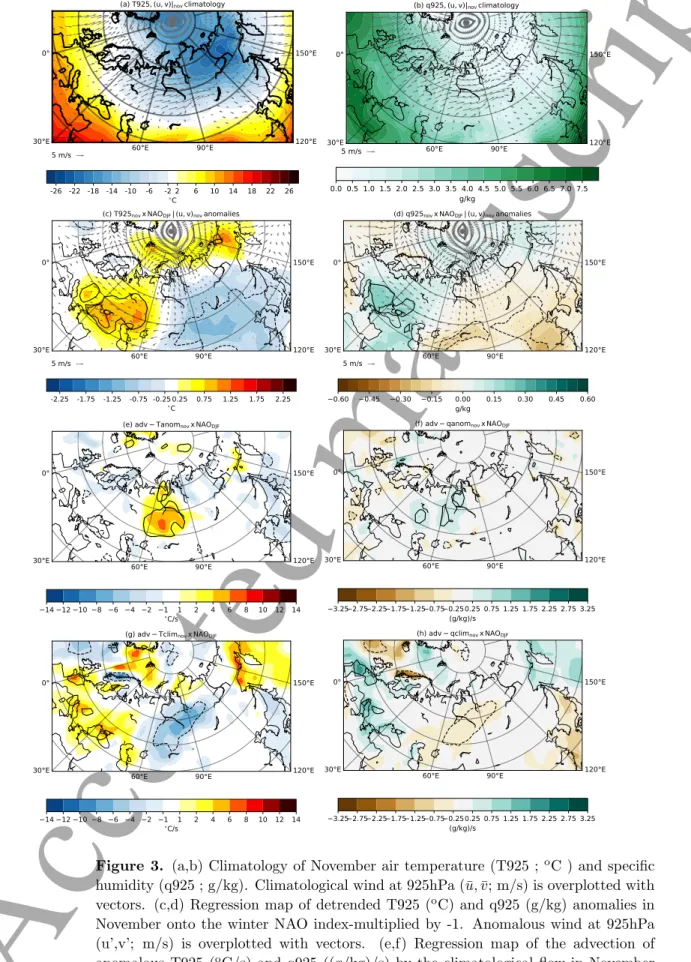
(q925) and horizontal wind are analyzed at 925hPa (Figure 3). As our framework
278
does not allow disentangling cause and effect, the analysis below is focused on lagged
279
regressions in November onto the winter NAO index, thereby assessing the observed
280
NAO precursors in an objective way. Regressions onto the expansion coefficients of
281
MCA/SCEN or MCA/SICN yield very similar results.
282
Climatology in this region shows a cold and dry environment east of Scandinavia
283
(eastern Arctic/eastern Siberia), whereas in western Europe warm and wet conditions
284
prevail (Figure 3a,b). Figure 3c and 3d show regression maps of November T925 and
285
q925 onto the winter NAO index, respectively. Warm and wet anomalies are found
286
over the Barents-Kara Seas in relation to sea-ice reduction (c.f. Figures 1b,S2a) while
287
cold and dry anomalies extend across Eurasia in association with the increase in snow
288
cover (c.f. Figures 1c,S2b), although only the latter is statistically significant. SIC/BK
289
reduction and SCE/EUR increase are source and sink of humidity, respectively, as
290
discussed in previous observational and modelling studies (e.g., ?, ?, ?). Noteworthy, it
291
is usually assumed that the connection between SIC/BK and SCE/EUR is as follows:
292
sea-ice reduction providing extra evaporation, increased moisture flux inland, and
293
enhanced snowfall over Eurasia (e.g., ?, ?). However, model results show that the direct
294
impact of sea-ice reduction on snowfall would mainly apply to the Siberian coast (e.g.,
295
?, ?, ?). Hence, there is room for further exploring the winter NAO-related SIC/BK
296
and SCE/EUR anomalies.
297
The target diagnostics are the linear advection terms of T925 and q925: namely,
298
the advection of climatological T925/q925 by the anomalous flow [−v0. ∇( ¯T , ¯q)] and
299
the advection of anomalous T925/q925 by the climatological flow [− ¯v.∇(T0, q0)]; the
300
non-linear advection terms are negligible in terms of amplitude (not shown) (e.g., ?).
301
The advection of anomalous T925/q925 driven by the southwesterly climatological
Accepted
manuscript
0° 30°E 120°E 150°E 60°E 90°E (a) T925, (u, v)|novclimatology0°
30°E 120°E
150°E
60°E 90°E (b) q925, (u, v)|novclimatology
0°
30°E 120°E
150°E
60°E 90°E
(c) T925novx NAODJF| (u, v)novanomalies
0°
30°E 120°E
150°E
60°E 90°E
(d) q925novx NAODJF| (u, v)novanomalies
Figure 3. (a,b) Climatology of November air temperature (T925 ; oC ) and specific
humidity (q925 ; g/kg). Climatological wind at 925hPa (¯u, ¯v; m/s) is overplotted with vectors. (c,d) Regression map of detrended T925 (oC) and q925 (g/kg) anomalies in
November onto the winter NAO index-multiplied by -1. Anomalous wind at 925hPa (u’,v’; m/s) is overplotted with vectors. (e,f) Regression map of the advection of anomalous T925 (oC/s) and q925 ((g/kg)/s) by the climatological flow in November
onto the winter NAO index - multiplied by -1. (g,h) Regression map of the advection of climatological T925 (oC/s) and q925 ((g/kg)/s) by the anomalous flow in November
Accepted
manuscript
flow (Figure 3e,f), bringing warm and wet air masses from the Mediterranean, yield
303
statistically significant anomalies upstream and over the Ural Mountains, i.e. windward.
304
These warm and wet conditions do not contribute to the snow dipole preceding the NAO
305
shown on Figure 1c. On the other hand, the advection of climatological T925/q925 by
306
the anomalous flow yield statistically significant anomalies downstream (downwind) the
307
Urals, namely over Siberia (Figure 3g,h). It implies that the wind anomalies preceding
308
the NAO transport cold and dry air from the Arctic into Eurasia, indicative of land
309
cooling and humidity sink associated with snowfall, particularly west of Baikal Lake (cf.
310
Figures 1c,S3). This south-eastward transport, together with the induced warm and wet
311
advection over the Mediterranean region (Figure 3g,h), suggests that the anomalous U-S
312
anticyclone is the responsible of pushing the snow edge northward over western Eurasia
313
and southward over eastern Eurasia, thereby generating the anomalous continental-scale
314
dipole of snow cover (Figure 1c) and surface conditions(Figure 3c,d). These results
315
contrast with previous works suggesting that increased SCE/EUR is a consequence of
316
the moisture increase due to SIC/BK reduction (e.g., ?, ?), while our results suggest
317
that the relationship is determined by the advection of climatological cold air from the
318
Arctic, mediated by the anomalous atmospheric circulation.
319
3.4. Causality between SIC/BK, SCE/EUR and the U-S pattern
320
To gain insight on the causality between SIC/BK, SCE/EUR and the regional
321
atmospheric circulation, turbulent (THF; sensible (SHF) plus latent (LHF)) and
322
radiative (RHF; shortwave (SWR) plus longwave (LWR)) surface heat fluxes in
323
November are analyzed (Figure 4).
324
Over the ocean, THF anomalies associated with the U-S pattern are dominated
325
by downward heat flux, that is by ocean heat uptake, over the Norwegian Sea and the
326
southern, ice-free Barents Sea (Figure 4a). These negative THF anomalies are likely
Accepted
manuscript
18 12 6 0 6 12 18 W m 2 8 4 W m0 2 4 8 0° 30°E 120°E 150°E 60°E 90°E(a) THF (LHF+SHF) x EOF SLPEUR
0° 30°E 120°E 150°E 60°E 90°E (c) THF (LHF+SHF) x MCA/SICN 0° 30°E 120°E 150°E 60°E 90°E (e) THF (LHF+SHF) x MCA/SCEN 0° 30°E 120°E 150°E 60°E 90°E (g) THF (LHF+SHF) x NAODJF 0° 30°E 120°E 150°E 60°E 90°E (b) RHF(SWR+LWR) x EOF SLPEUR 0° 30°E 120°E 150°E 60°E 90°E (d) RHF(SWR+LWR) x MCA/SICN 0° 30°E 120°E 150°E 60°E 90°E (f) RHF(SWR+LWR) x MCA/SCEN 0° 30°E 120°E 150°E 60°E 90°E (h) RHF(SWR+LWR) x NAODJF
Figure 4. Regression map of detrended turbulent heat flux anomalies (W · m−2; a,c,e,g) and radiative heat flux anomalies (W · m−2; b,d,f,h) in November onto (a,b) the leading PC from the EOF analysis of November SLP over Eurasia (see Figure 2b), (c,d) the MCA/SICNexpansion coefficient, (e,f) the MCA/SCENexpansion coefficient
and (g,h) the winter NAO index - multiplied by -1. Statistically significant areas at 95 % confidence level based on a two-tailed Student’s test are contoured.
Accepted
manuscript
related to the southerly advection of warm and moist air induced by the anticyclonic
328
circulation in the Siberian coast and the cyclonic circulation over the British Isles (Figure
329
2b); note that both SHF and LHF anomalies contribute almost equally (Figure S5).
330
This anomalous THF pattern strongly resembles the atmosphere-driven THF EOF1
331
of ?. And, consistently with this interpretation, the U-S/SCAND mode also shows
332
negative RHF anomalies (Figure 4b), which are determined by increased downwelling
333
LWR (Figure S6; e.g., ?, and references therein). On the other hand, THF anomalies
334
associated with MCA/SICN display enhanced upward heat flux over the Kara Sea and
335
northern Barents Sea (Figure 4c). These positive THF anomalies, with contribution
336
from both SHF and LHF (Figure S5), are related to sea-ice reduction and its retreat
337
of the edge (Figure 1b). In this case, the anomalous THF pattern projects on the
ice-338
driven THF EOF2 of ?, associated with heat release over the newly-opened oceanic
339
area (e.g., ?). Note that this positive THF anomaly over BK is accompanied by a
340
negative THF anomaly sharply south of the sea-ice edge (cf. Figures 1b,4c), which is
341
the expected response to sea-ice reduction due to the modification of the air mass as
342
it encounters open water (?, ?, ?, ?), although in this framework we cannot discard a
343
role from atmospheric advection as in Figure 4a. Consistent with the ice forcing of the
344
atmosphere, note likewise that there is a positive RHF anomaly over BK (Figure 4d),
345
controlled by emission of LWR (Figure S6). THF anomalies associated with MCA/SCEN
346
(Figure 4e) and the winter NAO (Figure 4g) show contributions from both signals, i.e.
347
ocean heat uptake related to the U-S pattern (Figure 4a) and ocean heat release linked to
348
SIC/BK (Figure 4c), with a larger and statistically significant influence of atmospheric
349
advection/forcing over the Norwegian Sea for the former. It is worth stressing that
350
both MCA/SCEN and the winter NAO display positive THF anomalies over BK, which
351
suggests that SIC/BK anomalies may contribute to tropospheric anomalies projecting
Accepted
manuscript
on S/SCAND-like variability (Figure 2). Several AGCM studies have reported
U-353
S/SCAND circulation anomalies over Eurasia in response to SIC/BK reduction (e.g.,
354
?, ?, ?, ?, ?, ?, ?, ?, ?, ?).
355
Over the continent, the snow-related THF anomalies depict statistically significant
356
upward heat flux over central Eurasia, west of Baikal Lake, consistently among the
357
regression maps onto the four time-series (Figure 4-left column). These positive THF
358
anomalies are the result of the balance between snow melting and sublimation, with
359
negative LHF anomalies (atmospheric cooling; Figure S5), and the heat transfer related
360
to the advection of climatological cold air from the Arctic (Figure 3g) encountering a
361
warmer surface, with positive SHF anomalies (atmospheric warming; Figure S5) that
362
overcome the former. On the other hand, RHF anomalies systematically show downward
363
heat flux over the same central Eurasian region, maybe weaker for the winter NAO
364
(Figure 4-right column). In this case, the downwelling of LWR (atmospheric cooling)
365
is stronger than the reflection of SWR (albedo effect leading to atmospheric warming;
366
Figure S6). Note that over the snow-covered area south of Baikal Lake (Figures 1c,
367
2c-d) LWR and SWR anomalies are fully compensated (Figure S6). Finally, it is worth
368
highlighting that over central Eurasia the net radiative cooling has to counteract the
369
net turbulent warming (Figure 4), which may imply a low signal-to-noise atmospheric
370
response to realistic snow anomalies.
371
4. Conclusions
372
According to previous observational studies (e.g., ?, ?, ?), November SIC/BK represents
373
the most robust “potential” predictor of the winter NAO based on eastern Arctic SIC
374
variability. This work revealed that it corresponds to the leading EOF of SIC at regional
375
and hemispheric scale, i.e. over the whole Arctic.
Accepted
manuscript
Concerning SCE/EUR, the leading covariability with winter SLP in the North
377
Atlantic-European region is not statistically significant for October SCE, in contrast
378
to previous observational studies using different approaches (e.g., ?, ?); while it is
379
marginally significant for November SCE, in agreement with ?. However, SCE/EUR
380
does not display a dominant mode of variability in November which implies that it
381
should not be considered as an “actual” predictor. It seems that the high correlation
382
between November SCE/EUR and the winter NAO relies on the atmospheric precursor
383
of the NAO itself, namely the Ural-Siberian anticyclone, in agreement with ? and ?.
384
Another aspect stressed in this study is that the Ural-Siberian anticyclone appears
385
not to be associated with the Siberian High but with the regional, subpolar low-pressure
386
system. The Ural-Siberian pattern stands for the third most prominent atmospheric
387
pattern in the Northern Hemisphere after the PNA in the North Pacific and the
388
NAO in the North Atlantic (e.g., ?). Particularly in November, the Ural-Siberian
389
anticyclone represents the leading EOF of SLP and is associated with the leading EOF
390
of geopotential height at the upper troposphere (e.g., ?, ?); which corresponds to the
391
SCAND pattern (e.g., ?, ?).
392
Finally, the variability of the Ural-Siberian pattern, which may include some
393
SIC/BK forcing, appears to be responsible for the connection between the winter NAO
394
and November SCE/EUR anomalies via advection of climatological temperature and
395
humidity by the anomalous winds, transporting cold and dry air from the Arctic into
396
Eurasia. The (potential) contribution of SCE/EUR to the Ural-Siberian pattern is
397
questioned due to the competing effect of the associated radiative and turbulent heat
398
flux anomalies over the snow-covered areas.
Accepted
manuscript
5. Acknowledgments
400
The research leading to these results has received funding from the European
401
Commissions H2020 projects APPLICATE (GA 727862) and PRIMAVERA (GA
402
641727).JG-S was supported by the Ram´on y Cajal programme (RYC-2016-21181).
403
MM was supported by the MINECO project VOLCADEC (CGL201570177-R). JB
404
has been supported by MINECO projects CGL2016-81828-REDT (AEI) and
RTI2018-405
098693-B643-C32 (AEI). The authors thank Herv´e Douville (CNRM/M´et´eo-France) and
406
Guillaume Gastineau (LOCEAN/IPSL, France) for useful discussions.
407
6. Data availability statement
408
The data that support the findings of this study are openly available.
409
410
• Sea Ice data HadISST (Hadley Center Sea Ice and Sea Surface Temperature
411
(DOI:10.1029/2002JD002670)
412
• Snow Cover data from the Global Snow Laboratory at Rutgers University (DOI:
413
10.7289/V5N014G9)
414
• Atmospheric variables data from ERA-Interim reanalysis available from the
Euro-415
pean Center for Medium-Range Weather Forecasts (ECMWF)(DOI:10.1002/qj.828).
416
7. References
417
[1] Hurrell JW, Kushnir Y, Ottersen G, Visbeck M. An overview of the North Atlantic oscillation.
418
The North Atlantic Oscillation: climatic significance and environmental impact. 2003;134:1–35.
419
[2] Hurrell JW, Deser C. North Atlantic climate variability: the role of the North Atlantic Oscillation.
420
Journal of Marine Systems. 2010;79(3-4):231–244.
421
[3] Cohen J, Jones J. A new index for more accurate winter predictions. Geophysical Research
422
Letters. 2011;38(21).
Accepted
manuscript
[4] Scaife A, Arribas A, Blockley E, Brookshaw A, Clark R, Dunstone N, et al. Skillful
long-424
range prediction of European and North American winters. Geophysical Research Letters.
425
2014;41(7):2514–2519.
426
[5] Garc´ıa-Serrano J, Frankignoul C, Gastineau G, De La C`amara A. On the predictability of the
427
winter Euro-Atlantic climate: lagged influence of autumn Arctic sea ice. Journal of Climate.
428
2015;28(13):5195–5216.
429
[6] Dunstone N, Smith D, Scaife A, Hermanson L, Eade R, Robinson N, et al. Skilful predictions of
430
the winter North Atlantic Oscillation one year ahead. Nature Geoscience. 2016;9(11):809.
431
[7] Wang L, Ting M, Kushner P. A robust empirical seasonal prediction of winter NAO and surface
432
climate. Scientific reports. 2017;7(1):279.
433
[8] King MP, Hell M, Keenlyside N. Investigation of the atmospheric mechanisms related to the
434
autumn sea ice and winter circulation link in the Northern Hemisphere. Climate dynamics.
435
2016;46(3-4):1185–1195.
436
[9] Kim BM, Son SW, Min SK, Jeong JH, Kim SJ, Zhang X, et al. Weakening of the stratospheric
437
polar vortex by Arctic sea-ice loss. Nature communications. 2014;5:ncomms5646.
438
[10] Nakamura T, Yamazaki K, Iwamoto K, Honda M, Miyoshi Y, Ogawa Y, et al. A negative phase
439
shift of the winter AO/NAO due to the recent Arctic sea-ice reduction in late autumn. Journal
440
of Geophysical Research: Atmospheres. 2015;120(8):3209–3227.
441
[11] Nakamura T, Yamazaki K, Iwamoto K, Honda M, Miyoshi Y, Ogawa Y, et al. The
442
stratospheric pathway for Arctic impacts on midlatitude climate. Geophysical Research Letters.
443
2016;43(7):3494–3501.
444
[12] Sun L, Deser C, Tomas RA. Mechanisms of stratospheric and tropospheric circulation response
445
to projected Arctic sea ice loss. Journal of Climate. 2015;28(19):7824–7845.
446
[13] Kug JS, Jeong JH, Jang YS, Kim BM, Folland CK, Min SK, et al. Two distinct influences of Arctic
447
warming on cold winters over North America and East Asia. Nature Geoscience. 2015;8(10):759.
448
[14] Garc´ıa-Serrano J, Frankignoul C, King M, Arribas A, Gao Y, Guemas V, et al.
Multi-449
model assessment of linkages between eastern Arctic sea-ice variability and the Euro-Atlantic
450
atmospheric circulation in current climate. Climate Dynamics. 2017;49(7-8):2407–2429.
451
[15] Cohen J, Screen JA, Furtado JC, Barlow M, Whittleston D, Coumou D, et al. Recent Arctic
452
amplification and extreme mid-latitude weather. Nature geoscience. 2014;7(9):627–637.
453
[16] Kidston J, Scaife AA, Hardiman SC, Mitchell DM, Butchart N, Baldwin MP, et al. Stratospheric
Accepted
manuscript
influence on tropospheric jet streams, storm tracks and surface weather. Nature Geoscience.
455
2015;8(6):433.
456
[17] Screen JA, Deser C, Smith DM, Zhang X, Blackport R, Kushner PJ, et al. Consistency and
457
discrepancy in the atmospheric response to Arctic sea-ice loss across climate models. Nature
458
Geoscience. 2018;11(3):155–163.
459
[18] Peings Y. Ural Blocking as a Driver of Early-Winter Stratospheric Warmings. Geophysical
460
Research Letters. 2019;46(10):5460–5468.
461
[19] Blackport R, Screen JA, van der Wiel K, Bintanja R. Minimal influence of reduced Arctic sea ice
462
on coincident cold winters in mid-latitudes. Nature Climate Change. 2019;9(9):697–704.
463
[20] Cohen J, Rind D. The effect of snow cover on the climate. Journal of Climate. 1991;4(7):689–706.
464
[21] Cohen J, Barlow M, Kushner PJ, Saito K. Stratosphere–troposphere coupling and links with
465
Eurasian land surface variability. Journal of Climate. 2007;20(21):5335–5343.
466
[22] Gong G, Entekhabi D, Cohen J. Modeled Northern Hemisphere winter climate response to realistic
467
Siberian snow anomalies. Journal of Climate. 2003;16(23):3917–3931.
468
[23] Gong G, Entekhabi D, Cohen J. Relative impacts of Siberian and North American snow anomalies
469
on the winter Arctic Oscillation. Geophysical Research Letters. 2003;30(16).
470
[24] Gong G, Entekhabi D, Cohen J. Orographic constraints on a modeled Siberian snow–tropospheric–
471
stratospheric teleconnection pathway. Journal of Climate. 2004;17(6):1176–1189.
472
[25] Fletcher CG, Kushner PJ, Cohen J. Stratospheric control of the extratropical circulation response
473
to surface forcing. Geophysical Research Letters. 2007;34(21).
474
[26] Fletcher CG, Hardiman SC, Kushner PJ, Cohen J. The dynamical response to snow cover
475
perturbations in a large ensemble of atmospheric GCM integrations. Journal of Climate.
476
2009;22(5):1208–1222.
477
[27] Peings Y, Saint-Martin D, Douville H. A numerical sensitivity study of the influence of Siberian
478
snow on the northern annular mode. Journal of Climate. 2012;25(2):592–607.
479
[28] Orsolini Y, Senan R, Vitart F, Balsamo G, Weisheimer A, Doblas-Reyes F. Influence of the
480
Eurasian snow on the negative North Atlantic Oscillation in subseasonal forecasts of the cold
481
winter 2009/2010. Climate Dynamics. 2016;47(3-4):1325–1334.
482
[29] Henderson GR, Peings Y, Furtado JC, Kushner PJ. Snow–atmosphere coupling in the Northern
483
Hemisphere. Nature Climate Change. 2018;8(11):954–963.
484
[30] Kolstad E, Screen J. Nonstationary relationship between autumn Arctic sea ice and the winter
Accepted
manuscript
North Atlantic oscillation. Geophysical Research Letters. 2019;46(13):7583–7591.
486
[31] Siew PYF, Li C, Sobolowski SP, King MP. Intermittency of Arctic-midlatitude teleconnections:
487
stratospheric pathway between autumn sea ice and the winter NAO. Weather and Climate
488
Dynamics Discussions. 2019;2019:1–23.
489
[32] Peings Y, Brun E, Mauvais V, Douville H. How stationary is the relationship between
490
Siberian snow and Arctic Oscillation over the 20th century? Geophysical Research Letters.
491
2013;40(1):183–188.
492
[33] Douville H, Peings Y, Saint-Martin D. Snow-(N) AO relationship revisited over the whole twentieth
493
century. Geophysical Research Letters. 2017;44(1):569–577.
494
[34] Deser C, Tomas R, Alexander M, Lawrence D. The seasonal atmospheric response to projected
495
Arctic sea ice loss in the late twenty-first century. Journal of Climate. 2010;23(2):333–351.
496
[35] Cohen JL, Furtado JC, Barlow MA, Alexeev VA, Cherry JE. Arctic warming, increasing snow
497
cover and widespread boreal winter cooling. Environmental Research Letters. 2012;7(1):014007.
498
[36] Cohen J, Jones J, FurtadO JC, Tziperman E. Warm Arctic, cold continents: A common pattern
499
related to Arctic sea ice melt, snow advance, and extreme winter weather. Oceanography.
500
2013;26(4):150–160.
501
[37] Ghatak D, Deser C, Frei A, Gong G, Phillips A, Robinson DA, et al. Simulated Siberian snow
502
cover response to observed Arctic sea ice loss, 1979–2008. Journal of Geophysical Research:
503
Atmospheres. 2012;117(D23).
504
[38] Liu J, Curry JA, Wang H, Song M, Horton RM. Impact of declining Arctic sea ice on winter
505
snowfall. Proceedings of the National Academy of Sciences. 2012;.
506
[39] Li F, Wang H. Autumn sea ice cover, winter Northern Hemisphere annular mode, and winter
507
precipitation in Eurasia. Journal of Climate. 2012;26(11):3968–3981.
508
[40] Wegmann M, Orsolini Y, V´azquez M, Gimeno L, Nieto R, Bulygina O, et al. Arctic moisture
509
source for Eurasian snow cover variations in autumn. Environmental Research Letters.
510
2015;10(5):054015.
511
[41] Gastineau G, Garc´ıa-Serrano J, Frankignoul C. The influence of autumnal Eurasian snow cover
512
on climate and its link with Arctic sea ice cover. Journal of Climate. 2017;30(19):7599–7619.
513
[42] Smith DM, Screen JA, Deser C, Cohen J, Fyfe JC, Garc´ıa-Serrano J, et al. The Polar Amplification
514
Model Intercomparison Project (PAMIP) contribution to CMIP6: investigating the causes and
515
consequences of polar amplification. Geoscientific Model Development. 2019;12:1139–1164.
Accepted
manuscript
[43] von Storch H, Zwiers FW. Statistical Analysis in Climate Research. 1st ed. Cambridge: Cambridge
517
University Press; 1999.
518
[44] Bretherton CS, Smith C, Wallace JM. An intercomparison of methods for finding coupled patterns
519
in climate data. Journal of climate. 1992;5(6):541–560.
520
[45] Rayner N, Parker DE, Horton E, Folland C, Alexander L, Rowell D, et al. Global analyses of sea
521
surface temperature, sea ice, and night marine air temperature since the late nineteenth century.
522
Journal of Geophysical Research: Atmospheres. 2003;108(D14).
523
[46] Robinson DA, Dewey KF, Heim Jr RR. Global snow cover monitoring: An update. Bulletin of
524
the American Meteorological Society. 1993;74(9):1689–1696.
525
[47] Dee DP, Uppala SM, Simmons A, Berrisford P, Poli P, Kobayashi S, et al. The ERA-Interim
526
reanalysis: Configuration and performance of the data assimilation system. Quarterly Journal
527
of the royal meteorological society. 2011;137(656):553–597.
528
[48] Koenigk T, Caian M, Nikulin G, Schimanke S. Regional Arctic sea ice variations as predictor for
529
winter climate conditions. Climate Dynamics. 2016;46(1-2):317–337.
530
[49] King MP, Garc´ıa-Serrano J. Potential ocean–atmosphere preconditioning of late autumn
Barents-531
Kara sea ice concentration anomaly. Tellus A: Dynamic Meteorology and Oceanography.
532
2016;68(1):28580.
533
[50] Sorokina SA, Li C, Wettstein JJ, Kvamstø NG. Observed atmospheric coupling between Barents
534
Sea ice and the warm-Arctic cold-Siberian anomaly pattern. Journal of Climate. 2016;29(2):495–
535
511.
536
[51] Yang XY, Yuan X, Ting M. Dynamical link between the Barents–Kara sea ice and the Arctic
537
Oscillation. Journal of Climate. 2016;29(14):5103–5122.
538
[52] Han S, Sun J. Impacts of autumnal Eurasian snow cover on predominant modes of boreal
539
winter surface air temperature over Eurasia. Journal of Geophysical Research: Atmospheres.
540
2018;123(18):10–076.
541
[53] Cohen J, Saito K, Entekhabi D. The role of the Siberian high in Northern Hemisphere climate
542
variability. Geophysical Research Letters. 2001;28(2):299–302.
543
[54] Cohen J, Salstein D, Saito K. A dynamical framework to understand and predict the major
544
Northern Hemisphere mode. Geophysical Research Letters. 2002;29(10):51–1.
545
[55] North GR, Bell TL, Cahalan RF, Moeng FJ. Sampling errors in the estimation of empirical
546
orthogonal functions. Monthly weather review. 1982;110(7):699–706.
Accepted
manuscript
[56] Smoliak BV, Wallace JM. On the leading patterns of Northern Hemisphere sea level pressure
548
variability. Journal of the Atmospheric Sciences. 2015;72(9):3469–3486.
549
[57] Mori M, Watanabe M, Shiogama H, Inoue J, Kimoto M. Robust Arctic sea-ice influence on the
550
frequent Eurasian cold winters in past decades. Nature Geoscience. 2014;7(12):869.
551
[58] Tyrlis E, Manzini E, Bader J, Ukita J, Hisahi N, Matei D. Ural blocking driving extreme Arctic
552
sea-ice loss, cold eurasia and stratospheric vortex weakening in autumn and early winter
2016-553
2017. Journal of Geophysical Research: Atmospheres. 2019;124:11313–11329.
554
[59] King MP, Herceg-Buli´c I, Kucharski F, Keenlyside N. Interannual tropical Pacific sea surface
555
temperature anomalies teleconnection to Northern Hemisphere atmosphere in November.
556
Climate dynamics. 2018;50(5-6):1881–1899.
557
[60] Bueh C, Nakamura H. Scandinavian pattern and its climatic impact. Quarterly Journal of the
558
Royal Meteorological Society: A journal of the atmospheric sciences, applied meteorology and
559
physical oceanography. 2007;133(629):2117–2131.
560
[61] Liu Y, Wang L, Zhou W, Chen W. Three Eurasian teleconnection patterns: Spatial structures,
561
temporal variability, and associated winter climate anomalies. Climate dynamics.
2014;42(11-562
12):2817–2839.
563
[62] Kuroda Y, Kodera K. Role of planetary waves in the stratosphere-troposphere coupled variability
564
in the northern hemisphere winter. Geophysical Research Letters. 1999;26(15):2375–2378.
565
[63] Takaya K, Nakamura H. Precursory changes in planetary wave activity for midwinter surface
566
pressure anomalies over the Arctic. Journal of the Meteorological Society of Japan Ser II.
567
2008;86(3):415–427.
568
[64] Orsolini YJ, Kindem I, Kvamstø N. On the potential impact of the stratosphere upon seasonal
569
dynamical hindcasts of the North Atlantic Oscillation: a pilot study. Climate dynamics.
570
2011;36(3-4):579–588.
571
[65] Cohen J, Furtado JC, Jones J, Barlow M, Whittleston D, Entekhabi D. Linking Siberian snow
572
cover to precursors of stratospheric variability. Journal of Climate. 2014;27(14):5422–5432.
573
[66] Cohen J, Foster J, Barlow M, Saito K, Jones J. Winter 2009–2010: A case study of an extreme
574
Arctic Oscillation event. Geophysical Research Letters. 2010;37(17).
575
[67] Vallis GK, Gerber EP. Local and hemispheric dynamics of the North Atlantic Oscillation, annular
576
patterns and the zonal index. Dynamics of atmospheres and oceans. 2008;44(3-4):184–212.
577
[68] Inoue J, Hori ME, Takaya K. The role of Barents Sea ice in the wintertime cyclone track and
Accepted
manuscript
emergence of a warm-Arctic cold-Siberian anomaly. Journal of Climate. 2012;25(7):2561–2568.
579
[69] Orsolini YJ, Kvamstø NG. Role of Eurasian snow cover in wintertime circulation: Decadal
580
simulations forced with satellite observations. Journal of Geophysical Research: Atmospheres.
581
2009;114(D19).
582
[70] Allen R, Zender C. Effects of continental-scale snow albedo anomalies on the wintertime Arctic
583
oscillation. Journal of Geophysical Research: Atmospheres. 2010;115(D23).
584
[71] Honda M, Inoue J, Yamane S. Influence of low Arctic sea-ice minima on anomalously cold Eurasian
585
winters. Geophysical Research Letters. 2009;36(8).
586
[72] Orsolini YJ, Senan R, Benestad RE, Melsom A. Autumn atmospheric response to the 2007 low
587
Arctic sea ice extent in coupled ocean–atmosphere hindcasts. Climate dynamics.
2012;38(11-588
12):2437–2448.
589
[73] Wallace JM, Hobbs PV. Atmospheric science: an introductory survey. vol. 92. Elsevier; 2006.
590
[74] Magnusdottir G, Deser C, Saravanan R. The effects of North Atlantic SST and sea ice anomalies
591
on the winter circulation in CCM3. Part I: Main features and storm track characteristics of the
592
response. Journal of Climate. 2004;17(5):857–876.
593
[75] Deser C, Magnusdottir G, Saravanan R, Phillips A. The effects of North Atlantic SST and sea ice
594
anomalies on the winter circulation in CCM3. Part II: Direct and indirect components of the
595
response. Journal of Climate. 2004;17(5):877–889.
596
[76] Deser C, Tomas RA, Peng S. The transient atmospheric circulation response to North Atlantic
597
SST and sea ice anomalies. Journal of Climate. 2007;20(18):4751–4767.
598
[77] Grassi B, Redaelli G, Visconti G. Arctic sea ice reduction and extreme climate events over the
599
Mediterranean region. Journal of Climate. 2013;26(24):10101–10110.
600
[78] McCusker KE, Fyfe JC, Sigmond M. Twenty-five winters of unexpected Eurasian cooling unlikely
601
due to Arctic sea-ice loss. Nature Geoscience. 2016;9(11):838.
602
[79] Ruggieri P, Kucharski F, Buizza R, Ambaum M. The transient atmospheric response to a reduction
603
of sea-ice cover in the Barents and Kara Seas. Quarterly Journal of the Royal Meteorological
604
Society. 2017;143(704):1632–1640.
605
[80] Furtado J, Cohen J, Tziperman E. The combined influences of autumnal snow and sea ice on
606
Northern Hemisphere winters. Geophysical Research Letters. 2016;43(7):3478–3485.