Comparing Long-term Antiplatelet Strategies To Prevent Morbidity And Mortality In Patients With Drug-Eluting Coronary Stents
by J. Stewart Evans
MD, Drexel University College of Medicine, 2001
Diplomate in Internal Medicine, American Board of Internal Medicine Submitted to Health Science and Technology in
Partial Fulfillment of the Requirements for the Degree of Master of Science in Biomedical Informatics
at the
Massachusetts Institute of Technology August 6, 2010
©2010 J. Stewart Evans, All rights reserved
The author hereby grants to MIT permission to reproduce and to distribute publicly copies of this thesis document in whole or in part.
Signature of Auth Certified by... Certified by... Certified by...
Accepted by...
Edwa MASSACHUEr"-!N!$ rI I~ IMAR
01
2
BLIRARIES
paper and electronic
o r . ' I- - - - - ... .... ... * ** *** * *
-Post-Doctoral Fellow, Boston-Area Biomedical Informatics Research Training Program August 6, 2010
Alexa T. McCray Program ector, B ston-Area Biomedical Informatics Research Training Program Thesis Supervisor
. .... . . . ...
Stephen G. Pauker Professor of Medicine, Tufts University School of Medicine Thesis Supervisor
John B. Wong
Professor of Medicine, Tufts University School of Medicine
Thesis Supervisor
... . ...
Ram Sasisekharan, PhD/Director Harvard-MIT Division of Health Sciences and Technology/ rd Hood Taplin Professor of Health Sciences & Technology and Biological Engineering
Comparing Long-term Antiplatelet Strategies to Prevent Morbidity and Mortality in Patients with Drug-Eluting Coronary Stents
by J. Stewart Evans
Submitted to the Division of Health Sciences and Technology on August 6, 2010 in partial fulfillment of the
requirements for the Degree of Master of Science in Biomedical Informatics
1.ABSTRACT
Background: The optimal long-term antiplatelet therapy (APT) that balances the benefit of preventing myocardial infarction (MI) with the risk of severe bleeding is unknown in patients greater than one year after drug-eluting stent (DES) placement.
Methods: We modeled life expectancy (LE) using published data by building a Markov model to compare several APT strategies composed of aspirin and clopidogrel, both as monotherapy and in various clinically plausible combinations. The base case examined a 65-year old person treated with a DES then continuous aspirin plus clopidogrel (Dual-Rx) for one year without complications. We considered risk of mortality from myocardial infarction and severe bleeding. We used a lifetime horizon and projected LE without quality-adjustment.
Results: In the base-case analysis, APT yielding greatest LE was a toss-up between Dual-Rx indefinitely (LE of 13.48 years), clopidogrel indefinitely (LE of 13.45 years), and aspirin indefinitely (LE of 13.42 years); of the strategies considered, no APT was least preferred (LE of 13.36 years). All parameters were varied over plausible ranges in sensitivity analyses, including the duration of future treatment with clopidogrel (base-case, life long). The choice of APT remained a toss-up unless: the annual probability of MI fell below 0.0087 (base-case, 0.013) or the relative risk of systemic bleeding exceeded 1.52 (base case, 1.00), in which case clopidogrel indefinitely was preferred; or the efficacy of clopidogrel to prevent MI fell below 0.09 (base case, 0.20) or the relative risk of clopidogrel for severe gastrointestinal hemorrhage exceeded 3.33 (base case, 2.01), in which case aspirin indefinitely was preferred.
Conclusions: For patients with a drug-eluting stent placed greater than one year ago, the anti-platelet therapy which yields the greatest life expectancy is a toss-up between dual antianti-platelet therapy (clopidogrel plus aspirin indefinitely), clopidogrel indefinitely, and aspirin indefinitely. However, additional research (including a clinical trial, subgroup analysis, and modeling) is needed.
Thesis Supervisor: Alexa T. McCray
Title: Associate Professor of Medicine, Harvard Medical School Thesis Supervisor: Stephen G. Pauker
Title: Professor of Medicine, Tufts University School of Medicine Thesis Supervisor: John W. Wong
ACKNOWLEDGEMENTS
I would like to thank for their support: my thesis advisers; the National Library of Medicine; my patients; my family and friends; and the many more who I have not mentioned.
I am deeply grateful to everyone.
TABLE OF CONTENTS
1. A B S T R A C T ... 6
2 . B A C K G R O U N D ... 7
2 .1. Intro d u ctio n ... 7
2 .2 . A im ... 8
3. MATERIALS AND METHODS... 9
3 .1. D ata - O verv iew ... 9
3.2. D ata - M eta-A nalysis... 9
3.2.1.Meta-Analysis - General Principles... ... 9
3.2.2.Meta-Analysis - Selection of Methods... 9
3.2.3.Meta-Analysis - Fixed Effect and Random Effects Methods... 10
3.2.3.1. Meta-Analysis - Fixed Effect Methods... 10
3.2.3.2. Meta-Analysis - Random Effects Methods... 12
3.2.4.Meta-Analysis - Confidence Interval for Overall Effect... ... 13
3.2.5.Meta-Analysis - Test Statistic for Overall Effect... 14
3.2.6.Meta-Analysis - Test Statistic of Homogeneity... 14
3.3. D ata - C ardiovascular Events... 14
3.3.1.Cardiovascular Events - Overview... 14
3.3.2.Cardiovascular Events - Rate of Myocardial Infarction (MI) Incidence... 15
3.3.2.1. Rate of MI Incidence - Overview.. ... 15
3.3.2.2. Rate of MI Incidence - Meta-Analysis... 15
3.3.2.2.1. Meta-Analysis - Study Selection... 15
3.3.2.2.2. Meta-Analysis - Data Extraction... 17
3.3.2.2.3. Meta-Analysis - Data Conversion... 18
3.3.2.2.4. Meta-Analysis - Meta-analytic Methods... 19
3.3.2.2.5. Rate of MI Incidence - Additional Considerations... 20
3.3.3.Cardiovascular Events - Rate of Myocardial Infarction (MI) Mortality... 20
3.4. D ata - H em orrhage... 20
3.4.1. H em orrhage - D efinition... 20
3.4.2. Hem orrhage - Bleeding Sites... 21
3.5. Data - A ntiplatelet Therapy... 21
3.5. I.A ntiplatelet Therapy - Efficacy... 21
3.5.2.A ntiplatelet Therapy - R isk... 23
3.6. D ecision M odel... 23
3.6.1. D ecision M odel - O verview ... 23
3.6.2.D ecision M odel - Structure... 24
3.6.3.D ecision M odel - A ssum ptions... 24
3.7. Sensitivity A nalysis... 26
4. RESU LTS... 27
4.1. M eta-A nalysis... 27
4.1 . .Rate of M yocardial Infarction Incidence... 27
4.1.2.Efficacy of D ual A ntiplatelet Therapy... 27
4.2. Decision M odeling... 29
4.2.1.Base-Case A nalysis... 29
4.2.2.Sensitivity A nalysis... 29
5. DISCUSSION ... 31
5.1. Overview ... 31
5.2. Lim itations... 32
5.3. Com parison w ith Other Studies... 32
5.4. Future Directions... 33
6. REFERENCES ... 35
7. APPEN DICES... 39
7.1. Appendix A : List of Abbreviations... ... ... ... ... 39
7.2. Appendix B: List of Tables and Figures... ... 39
7.3. Appendix C: Tables... 40
7.4. Appendix D : Figures... 52
2.BACKGROUND
2.1. Introduction
Since their approval by the United States Food and Drug Administration in 2003 and 2004 respectively, the paclitaxel and sirolimus drug-eluting coronary stent systems (DES) have quickly become the most commonly deployed type of coronary stent in the United States, together comprising 58% of stents placed. More than one million DES are now placed annually in the
U.S., and over six million have been placed worldwide.
Both types of DES reduce the risk of in-stent restenosis in the first six to nine months post-percutaneous coronary intervention compared to bare-metal stents. However, since Food and Drug Administration approval, DES have been associated with an increased risk of stent thrombosis compared to bare-metal stents, particularly greater than one year post-DES placement [1, 2]. Stent thrombosis is an uncommon complication (estimates vary from 0.2-2.0%), but one that has a high morbidity, mainly myocardial infarction (MI) and mortality, regardless of stent type [3, 4].
The benefits of APT with aspirin or clopidogrel as monotherapy in coronary heart disease are well-known [3, 5]. Due to their complementary antiplatelet effects, combining aspirin and clopidogrel, hereafter referred to as dual antiplatelet therapy (DAT), has been shown to have more benefit than aspirin monotherapy in patients above certain risk thresholds for MI [6]. In 2007, this benefit was expanded to include reducing the risk of MI and death in patients with DES compared to aspirin monotherapy. Moreover, studies have suggested that this risk reduction might progressively increase greater than one year post-DES placement [7]. As a result, guidelines were changed from recommending Dual-Rx from three and six months for sirolimus
and paclitaxel DES, respectively, to DAT at least one year for both, and possibly longer if its benefit of preventing stent thrombosis continues to outweigh the risk of major bleeding [3, 8, 9].
However, the optimal duration of DAT for patients with DES is unknown, in part due to significant evidence that the most commonly prescribed medications in DAT also increase the risk of severe bleeding [5, 10-12]. This balance of risks and benefits is especially complex in patients with certain risk combinations of MI and severe bleeding [7, 12].
While plans are underway to conduct a clinical trial to inform the optimal APT for patients with DES, with the understandable time course of a clinical trial, results are not scheduled to be available until four years after trial initiation. In the meantime, for a significant proportion of the six million patients world-wide who have had DES placed, and many more to follow, important decisions remain in the interim with regard to optimal duration and type of APT.
2.2 Aim
The aim of the current study is to construct a Markov state transition model [13] to examine the optimal APT to prevent MI and death for patients who have had an acute MI treated with DES one year ago.
3.MATERIALS AND METHODS
3.1. Data - Overview
For each data element used in the current study, we applied widely used methods for finding and summarizing estimates, depending on the best evidence available publicly or in published form [14]. These included meta-analyses, systematic reviews of primary studies, 'best' single study, and expert opinion. When there was more than one high quality source, we conducted our own meta-analyses. Meta-analysis was also conducted to manage temporal complexity and uncertainty, as summarized below. Fuller description of meta-analytic principles are in [15, 16].
3.2. Data - Meta-Analysis
3.2.1. Meta-Analysis - General Principles
Meta-analysis is a two-stage process which involves, for a set of N studies, first calculating a summary statistic for each study, then combining these statistics into a weighted average. The weights are chosen to reflect the amount of information each trial contains, and are often the inverse of the variance of the treatment effect, which is closely related to sample size. The precision (confidence interval) and statistical significance of the overall estimate are also calculated. All commonly used methods of meta-analysis follow these basic principles. There are, however, other aspects that vary between methods. None of the methods can compensate for publication bias, nor bias introduced through poor trial design and execution.
3.2.2. Meta-Analysis - Selection of Methods
Selection of a meta-analysis method for a particular analysis should reflect the data type, choice of summary statistic (considering the consistency of the effect and ease of interpretation of the statistic), observed heterogeneity, and the known limitations of the computational methods.
There are three aspects of choosing a method for meta-analysis: identifying the data type (binary, continuous, time to event), choosing an appropriate summary statistic, and selecting a weighting method for combining the studies.
The choice of a summary statistic depends upon the consistency of estimates of the treatment effect across data sets - the more consistent the estimate, the greater the justification for expressing the effect of treatment in a single summary number. A second consideration is that the summary statistic should be in a form that is easily understood and applied. For the purposes of the current application, the choice of summary statistic was based on what form of data was required for input into the model, and what form of data would be understood most easily by those using the results of the analysis were reported to those who may not be as familiar with modeling (e.g., clinicians, policy makers). Selection of a summary statistic for continuous data also requires consideration of whether all data sets report the outcome using the same scale.
The choice of weighting method depends deciding between various fixed and random effects methods. It is important to be aware of circumstances in which methods may give erroneous results. Erroneous results may occur with inverse variance methods when data sets are small or when events rates or very low. In the current application, it was determined that the data sets and events for our use of the inverse variance method were sufficient to provide reliable results.
3.2.3. Meta-Analysis - Fixed Effect and Random Effects Methods 3.2.3.1. Fixed Effects Methods
Fixed effect models average the summary statistics, weighting them according to a measure of the quantity of information they contain. It is assumed that the true effect of treatment is the same value in each study, or "fixed", the differences between study results being due solely to chance. The assumption of a fixed effect can be tested using a test of homogeneity. Several methods are
available, which differ mainly in the computations used to calculate the individual study weights. For the current application, we chose the inverse variance method.
With the inverse variance method, the effect sizes are combined to give a pooled estimate by calculating a weighted average from the individual data sets:
The weights are the reciprocals of the squared standard errors:
SEOI
Thus larger data sets, which have smaller standard errors, are given more weight than smaller studies, which have larger standard errors. This choice of weight minimizes the variability of the pooled treatment effect.
The standard error is given by
SE~
(
The heterogeneity statistic is given by
The strength of the inverse variance method is its wide applicability. It can be used to combine any estimates that have standard errors available. In the current study, we applied this method to
combine event rates for MI and efficacy of Dual-Rx.
3.2.3.2. Random Effects Methods
Random effects methods incorporate an estimate of between study variation (heterogeneity) into the calculation of the common effect. The treatment effects for the individual studies are assumed to vary around some overall average treatment effect. Usually the effect sizes are assumed to have a normal distribution with a certain mean and variance. A test for homogeneity tests whether the variance is zero - the smaller the variance, the more similar are the fixed and
random effects models. Of the methods available, we chose the DerSimonian and Laird method [17]. Under the random effects model, the assumption of a common treatment effect is relaxed, and the effect sizes are assumed to have a normal distribution with a given mean and variance.
The usual DerSimonian and Laird estimate of variance is given by
J-
=Q
-(k-1)
ot
where 0 is the heterogeneity statistic, with the variance T set to zero if 0 < k - 1, and the weights are calculated as in the inverse variance method. If the variance is zero, the weights reduce to those given by the inverse variance method. If the variance is greater than zero, then the weights in the random effects model will be smaller and more similar to each other than the weights in the fixed effect model; this means that the random effects model will be more conservative (the confidence intervals will be wider) than the fixed effect analyses since the variance of the pooled effect is the inverse of the sum of the weights. In addition, the random effects models give relatively more weight to smaller studies than the fixed effects model.
Like the inverse variance method, an advantage of the DerSimonian and Laird method is its wide applicability. It can be used to combine any type of estimates provided standard errors are available.
3.2.4. Meta-Analysis - Confidence Interval for Overall Effect The confidence interval for the overall effect is given by
6-SEO}Q(1-La/2)
to
6+SE{6}0(1-a/2)
3.2.5. Meta-Analysis - Test Statistic for Overall Effect
A test statistic for the overall difference between groups is derived as
I
z
0
SE(6)
Under the null hypothesis that there is no treatment effect, Z will follow a standard normal distribution.
3.2.6. Meta-Analysis - Test Statistic of Homogeneity
For a formal test of homogeneity, the statistic
Q
will follow a chi-squared distribution on k - 1 degrees of freedom under the null hypothesis that the true treatment effect is the same for all data sets being compared:s in1t ott-Y
The Q-statistic provides descriptive information of between-study variation. Tests for
homogeneity can be underpowered, meaning a statistically nonsignificant result may be a false-negative, i.e., between-study variation may be present but not detected by the test. This can be somewhat compensated for by using a random-effects methods, which weigh the outcomes of the study according to both within-study as well as the between-study variance.
We tested for statistically significant differences between eras using chi-square tests. We chose a p-value < 0.05 for statistical significance. For the analyses we used Microsoft Excel 2007 (Microsoft Corporation, Seattle, WA).
3.3. Data - Cardiovascular Events
3.3.1. Cardiovascular Events - Overview
The challenges of defining stent thrombosis in the absence of angiographic confirmation or results on autopsy, particularly in long-term follow-up, are well-documented [1, 2, 4]. Moreover, distinguishing stent thrombosis-associated MI from non-stent thrombosis-associated MI is oftentimes not possible for many reasons, not the least of which is that diagnosis of stent thrombosis requires catherization. As such, after careful consideration of both the clinical significance for patients, as well as the available evidence, rather than stent thrombosis as an outcome measure, we instead chose MI and coronary heart disease (CHD)-mortality as indicative of the overall safety and efficacy profile of DES and APT in treating patients with coronary artery disease [I].
3.3.2. Cardiovascular Events - Rate of Myocardial Infarction (MI) Incidence 3.3.2.1. Rate of MI Incidence - Overview
For estimates of the rate of MI incidence, we included published data on patients involved in the clinical trials (a total of nine trials) used to support FDA approval of the two DES available in the US [1]. In addition, since the application of DES has been extended to population of patients not represented in these trials, we included additional evidence for these patients [2]. We conducted meta-analyses to not only synthesize estimates from these studies, but also to extrapolate MI risk beyond one year.
3.3.2.2. Rate of MI Incidence - Meta-Analysis 3.3.2.2.1. Meta-Analysis - Study Selection
The study by Stone et al. was selected based on the following criteria: the inclusion of patients with strictly on-label use of DES (single, previously untreated coronary lesions) as reflected in the labels for sirolimus-eluting DES and paclitaxel-eluting DES that were approved by the Food and Drug Administration; the length of follow-up (four years after device implantation; at the time of this thesis, the longest follow-up publically available); the overall high-quality of the study; and the authors of the study having obtained of databases for all four trials from Cordis (manufacturer for the sirolimus-eluting DES) and Boston Scientific (manufacturer for the paclitaxel-eluting DES). The latter criteria was considered important because these nine trials are the only double-blind trials that compared each of the DES with bare-metal controls and also served as the basis for the approval of the DES in the United States and Europe.
The study by Schomig et al. was selected for inclusion based on the following criteria: the expansion of patients included in Stone (strict on-label use) to include patients in whom off-label use occurred (estimated to be the majority of DES placement in daily clinical practice at the time of this study); the length of follow-up (two years after device implantation; at the time of this thesis, the second-longest follow-up publically available); and the overall high-quality of the
study.
Stone et al. performed a patient-level pooled analysis of data from nine double-blind trials - four trials in which 1748 patients were randomly assigned to receive either sirolimus-eluting DES or bare-metal stents, and five trials in which 3513 patients were randomly assigned to receive either paclitaxel-eluting DES or bare-metal stents. Three trials were from the United States, two were from Europe, two were global, and one was from Canada. Major clinical end points analyzed included stent thrombosis and MI. The Breslow-Day test for heterogeneity demonstrated that trials involving sirolimus-eluting DES and paclitaxel-eluting stents were sufficiently
homogeneous to justify the pooled analyses performed. The pooled results of the nine studies are given in Table 1 [1].
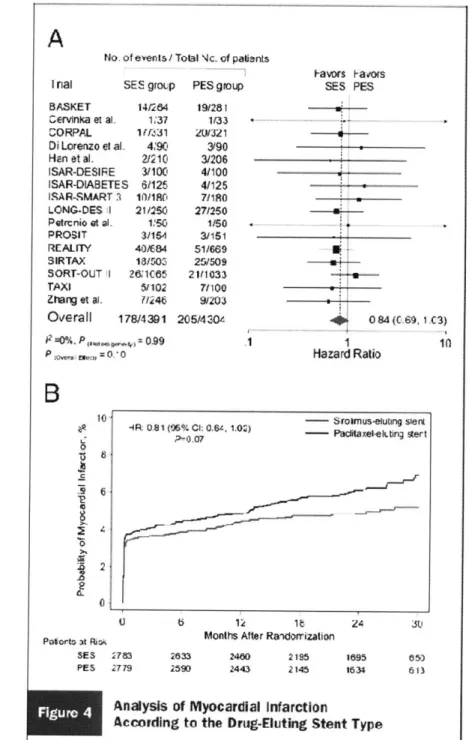
Schomig et al. combined data from sixteen randomized trials of SES versus PES with a total of 8,695 patients in a meta-analysis. These trials were unique from the nine trials analyzed by Stone. Clinical end points analyzed included stent thrombosis and MI. No significant heterogeneity was found across trials. While patient-level data could only be obtained from two-thirds of the trials, the treatment effects on the patient- and population-levels are in accordance with one another. All trials were open-label trials due to the impossibility of blinding different devices from different manufacturers. Results from the pooled studies are shown in Figure 1 [2].
We conducted meta-analysis to not only synthesize estimates from these studies, but also to extrapolate MI risk beyond one year, thereby considering variation both between and within studies.
3.3.2.2.2. Meta-Analysis - Data Extraction
A standard spreadsheet was used to collect the data from the studies. Data was extracted by one reader (J.S.E.) and independently verified by two others (J.B.W., S.G.P.). Discrepancies were resolved by discussion. Readers were not blinded to information about the authors, author affiliation, and journal name. The extracted study characteristics included author, publication year and number of patients. We extracted data from text, tables, graphs and web-based supplemental appendices of the selected studies.
3.3.2.2.3. Meta-Analysis - Data Conversion
Both Stone and Schomig reported cumulative percentages of MI by year after DES implantation. The relevant time intervals applicable to the current study were greater than one year after DES
implantation. The study Stone provided four year follow-up data (i.e., years one-to-two, two-to-three, and three-to four after DES implantation). The study by Schomig provide two year
follow-up data (i.e., years one-to-two after DES implantation). These data were extracted and then converted to average annual event rates.
The conversion was done as follows with an illustrative example. From Stone, the cumulative percent of MI for the time interval year two-to-three post DES implantation is reported to be 6%. After extracting this data, we converted it to the probably of having MI (pMI):
pMI = (cumulative% / 100)
pMI = (6% / 100)= 0.06
Assuming binary outcomes (i.e., pMI + probability of not having an MI = I), we then calculated the probability of not having an MI (pNoMI):
pNoMI= (I - pMI)
We then calculated the relative proportion of patients not having MI (relative) by dividing pNoMI for each time interval by the pNoMI from the previous interval - for example, the pNoMI for time interval two-to-three (pNoMIy2-3) by pNoMI for time interval one-to-two (pNoMlyl-2):
relative = (pNoMIy2-3 / pNoMIy l -2)
relative = (0.94 / 0.95) 0.989
The relative proportion was then converted into an annual event rate of having MI (rMI):
rMI = - ln(relative)/t
rMI = - In(0.989)/1 = 0.0 107
where In is the natural logarithm, and t is the time period in years (in this case one).
3.3.2.2.4. Meta-Analysis - Meta-Analytic Methods
We combined the results from Stone and Schomig using both fixed effect (inverse variance) and random effects methods and tested for heterogeneity. We also used these meta-analytic methods to determine if, for the results from Stone, if the incident rate of MI varied significantly between time intervals.
3.3.2.3. Rate of Myocardial Infarction (MI) Incidence - Additional Considerations
We assumed that all patients were receiving aspirin, thus the resulting annual incidence rate represented patients who were receiving aspirin. We defined the MI rate in patients not treated with APT as the
MI rate untreated MI rate with aspirin
(1 - efficacy of aspirin).
3.3.3. Cardiovascular Events - Rate of Myocardial Infarction (MI) Mortality
A single best study from Mauri et. al. was selected to estimate rate of MI mortality [4]. The study by Mauri et. al. was selected because of its use of patient-level data from eight of the nine trials used for FDA approval of the sirolimus and paclitaxel DES, all events being adjudicated by an independent clinical-events committee (the Harvard Clinical Research Institute), the reporting of events in a form suitable for inclusion in the model; and its overall high quality.
3.4. Data - Hemorrhage
3.4.1. Hemorrhage -Definition
We also estimated bleeding risk. Accurately estimating bleeding risk requires careful consideration of many interrelated factors, including, but not limited to: how bleeding is defined (e.g., definitions set forth by the Thrombolysis In Myocardial Infarction (TIMI) and the Global Utilization of Streptokinase and Tissue Plasminogen Activator for Occluded Coronary Arteries (GUSTO) trials); bleeding site (e.g., gastrointestinal, intracranial, aortic aneurysm, intraocular, epistaxis or hemoptysis); patient subgroups (e.g., age-dependent incidence rates); and potentially confounding variables (e.g., co-morbidities or medication effects). To best represent bleeding risk from the data available, we defined severe bleeding as: fatal bleeding, bleeding requiring transfusion, or intracranial.
3.4.2. Hemorrhage - Bleeding Sites
We focused on bleeding sites which have the greatest impact on mortality, due to their combination of frequency, risk of recurrence and excess mortality. By an order of magnitude, gastrointestinal hemorrhage is the most frequent site of major bleeding, particularly as it related to APT [10, 11]. When severe, it has a significant risk of recurrence and mortality. While certainly less common than gastrointestinal hemorrhage, intracranial hemorrhage has a significant risk of recurrence and high mortality [18].
We also defined a variable which represents a patient's propensity to bleed or thrombose called "systemic risk". It has been suggested that patients on DAT continuously without severe bleeding may have passed a "bleeding stress test" [6]. These patients may have both a decreased risk of bleeding while on Dual-Rx as well as an increased risk of thrombosis if taken off Dual-Rx. For this variable, we defined a relative risk of one as average risk (neither increased risk of bleeding nor thrombosis), greater than one as increased risk of bleeding, and less than one as an increased risk of thrombosis.
3.5. Data - Antiplatelet Therapy
3.5.1. Antiplatelet Therapy - Efficacy
We defined the efficacy of APT in preventing MI in terms of the annual MI rate with and without APT, or the
efficacy of APT = I - (RR of MI with APT) (RR of MI without APT).
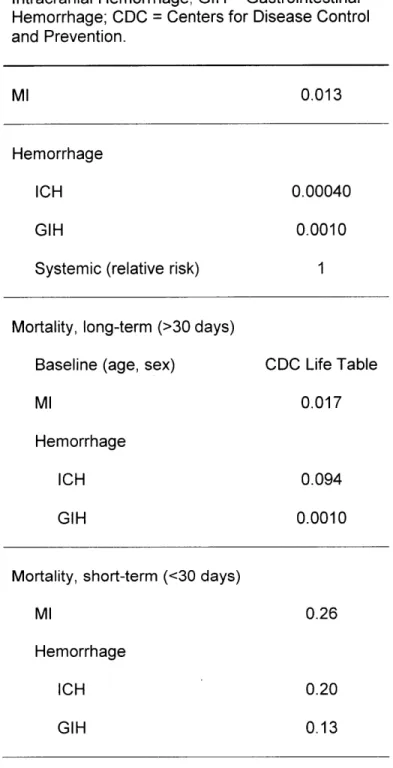
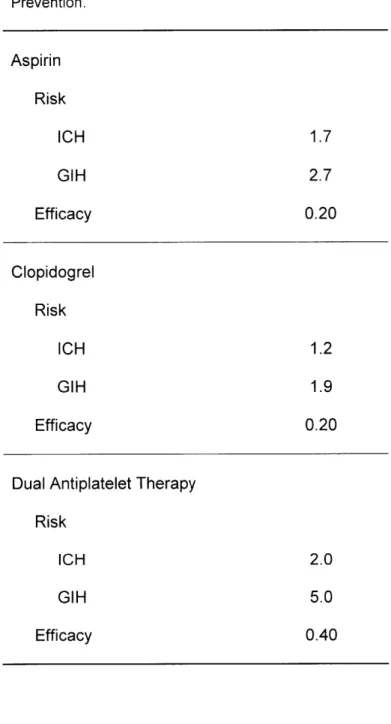
Thus, if APT has an efficacy of one, then the MI rate among patients receiving APT is zero; but if APT has an efficacy of zero, then the MI rate is the same regardless of whether the patient has received APT. The efficacy estimates for the included APT medications (aspirin and clopidogrel) as secondary prevention of MI are summarized in Table 1 [3, 5, 6, 12].
For Dual-Rx, efficacy estimates are more complicated, including possible temporal variation. For example, the efficacy of Dual-Rx increases over time, including greater than one-year post-DES placement [7]. To determine if this increase in efficacy is statistically significant, we used similar methods as described in section 3.2. (titled "Data - Cardiovascular Events"; please see above). Namely, we extracted cumulative percentage of MI, converted these data to annual rates of MI for each of the six-month time intervals reported, and using meta-analytic techniques, to determine if there was statistically significant heterogeneity across time intervals.
Efficacy was then calculated by first converting annual rates of MI while receiving Dual-Rx or control to annual probabilities, assuming the rate is constant over the year, by
p = 1 - exp(- r*t)
where p is the probability, r is the rate and t is the time period (in this case, one year).
The probability of MI while receiving Dual-Rx (pMId) or control (pMIc) were then used to calculate efficacy (or the relative risk reduction):
3.6. Data - Antiplatelet Therapy - Risk
We also estimated the increased risk of gastrointestinal hemorrhage and intracranial hemorrhage with APT. The risk estimates for aspirin and clopidogrel are well-defined in the literature and summarized in Table 1 [3, 5, 6, 12]. For Dual-Rx, bleeding risk estimates are less well-defined. For example, compared to aspirin monotherapy, Dual-Rx risk estimates range from no increased risk [6], to a moderately increased risk [II], to more than a three times increased risk [10]. And all estimates have wide confidence intervals. Given this uncertainty, we used wide ranges in sensitivity analysis. We assumed the bleeding risk for Dual-Rx was a multiplicative model composed of the bleeding risks of aspirin and clopidogrel.
3.7. Decision Model
3.7.1. Decision Model - Overview
Clinical decision-making, including decision modeling, has been identified as one of four core content areas in the evolving subspecialty of clinical informatics, and is in a proposed curriculum for clinical informatics fellowship [19, 20]. Decision modeling, including decision analysis, Markov modeling, Monte Carlo simulation, comparative effectiveness, and other modeling methodologies, have roots which reach to the very beginning of the scientific discipline of biomedical informatics, having been adapted to the health care domain from other domains [13, 21-25]. The use of decision modeling has been and continues to be of value in informing
important decision-making on both population as well as individual patient levels, facilitating the translation of an exponentially expanding biomedical knowledge base into actions which improve human health [26-28].
We built of Markov state transition model [25, 29] using a standard computer program for decision modeling (WinDM, Version 2009.6.1 (Pratt Medical Group, Boston, MA) [30, 31]) which compared several APT strategies composed of aspirin and clopidogrel, both as
monotherapy and in various clinically plausible combinations. The model estimates life expectancy for a hypothetical cohort of patients. All patients in the cohort are 65 years-old with a past medical history significant for MI treated acutely with DES placement, then treated with DAT continuously for one year without complications. They have no history of intracranial hemorrhage or gastrointestinal hemorrhage.
3.7.2. Decision Model - Structure
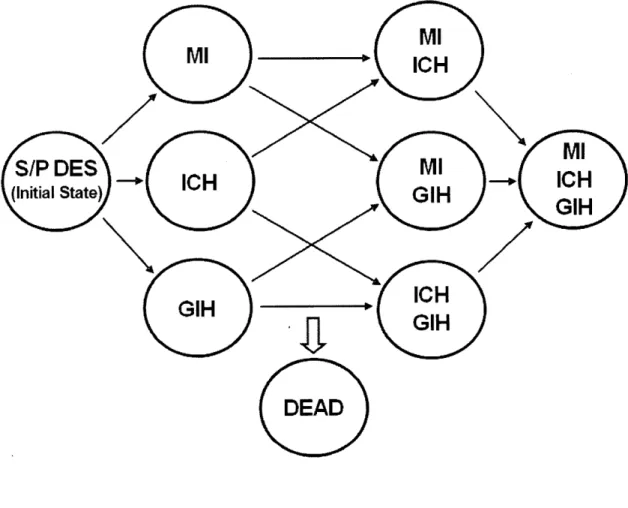
The model is shown in Figure 1 and works as follows. Health states are represented as circles. At the beginning of modeling, each patient in the cohort begins the simulation in the health state called status-post DES (S/P DES) and is followed over time. The other health states are defined by events which may occur in the course of the modeling: MI, intracranial hemorrhage, gastrointestinal hemorrhage, any combination of these events, or death. The passage of time is modeled as a series of cycles (in this case, the cycle length is I month). During each cycle, each cohort member may remain in the same health state or transition to another (represented by arrows between states). The model accounts for time lived by the cohort over the course of modeling, and the simulation continues until all patients in the cohort have died (stopping criteria, less than one patient remaining alive). The average life expectancy for a patient in the cohort is determined by summing the life years lived by the cohort, then dividing by the number of patients in the original cohort. We also performed a half-cycle correction.
3.7.3. Decision Model - Assumptions
In addition to the assumptions inherent in choosing the model's structure, we made the following additional assumptions:
2. At the beginning of modeling, patients have a history of MI (at the time DES of placement), but no history of intracranial hemorrhage or gastrointestinal hemorrhage.
3. If MI, intracranial hemorrhage or gastrointestinal hemorrhage does not occur during modeling, the incidence rates for these events remain constant throughout the course of the modeling. Knowing that these rates may in reality change over time, we explored different rates in sensitivity analysis.
4. If MI, intracranial hemorrhage or gastrointestinal hemorrhage occur during modeling, the incidence rates (rate of recurrence) increase, as is consistent with the respective natural histories of MI, intracranial hemorrhage and gastrointestinal hemorrhage [18].
5. Demographic-related mortality rates, based on age and gender, and disease-specific excess mortality rates were additive.
6. Intracranial hemorrhage during modeling results in patients having all APT discontinued for the remainder of modeling. In contrast, patients who have gastrointestinal hemorrhage during modeling are continued on the APT strategy to which they were allocated at the beginning of modeling.
7. MI during modeling results in patients being started on DAT, if not already being received, unless they have already had intracranial hemorrhage during modeling.
8. The efficacies and risks of different APT are constant throughout the course of the modeling.
3.8. Sensitivity Analysis
To further manage complexity, uncertainty, and potential inaccuracy in baseline estimates and assumptions, we performed extensive structural and deterministic sensitivity analyses. For the latter, the baseline values of key variables are varied over a clinically plausible range to determine to what extent the life expectancy of each APT strategy changes. When available, 95%
confidence intervals (statistically plausible range) guided the defining of clinically plausible ranges. When 95% confidence intervals were not available, we used expert opinion to define clinically plausible ranges.
4.RESULTS
4.1. Meta-Analyses
4.1.1. Rate of Myocardial Infarction Incidence
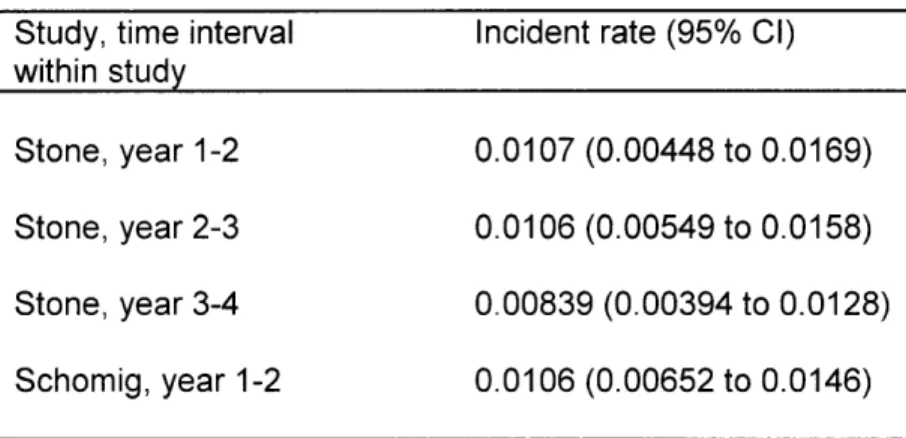
The rates of myocardial infarction (MI) incidence for various yearly time intervals after drug-eluting stent (DES) implantation are shown in Table 2, along with the 95% CIs. Rates are calculated from data extracted from studied by Stone et al. and Schomig et al. where indicated.
The results of meta-analyses of rates of MI are shown in Table 3. The estimated rate of MI resulting from combining rates from the studies by Stone et al. and Schomig et al. (i.e., from each
study, year 1-2 after DES implantation) was 0.0106 (95% CI, 0.00722 to 0.0140). The test for heterogeneity showed that the rates were not statistically significantly different, with a p-value = 0.98. The estimated rate of MI resulting from combining rates from the study by Stone et al. from different time intervals (i.e., from Stone et al., year 1-2, year 2-3, and year 3-4) was 0.00963 (95% CI, 0.00666 to 0.0 126). The test for heterogeneity showed that the rates were not
statistically significantly different, with a p-value = 0.76.
In both cases, since heterogeneity was not found, the random effects model reduces to the fixed effect model (i.e., the estimate rate for the fixed effect and random effects models are equal).
4.1.2. Efficacy of Dual-Antiplatelet Therapy
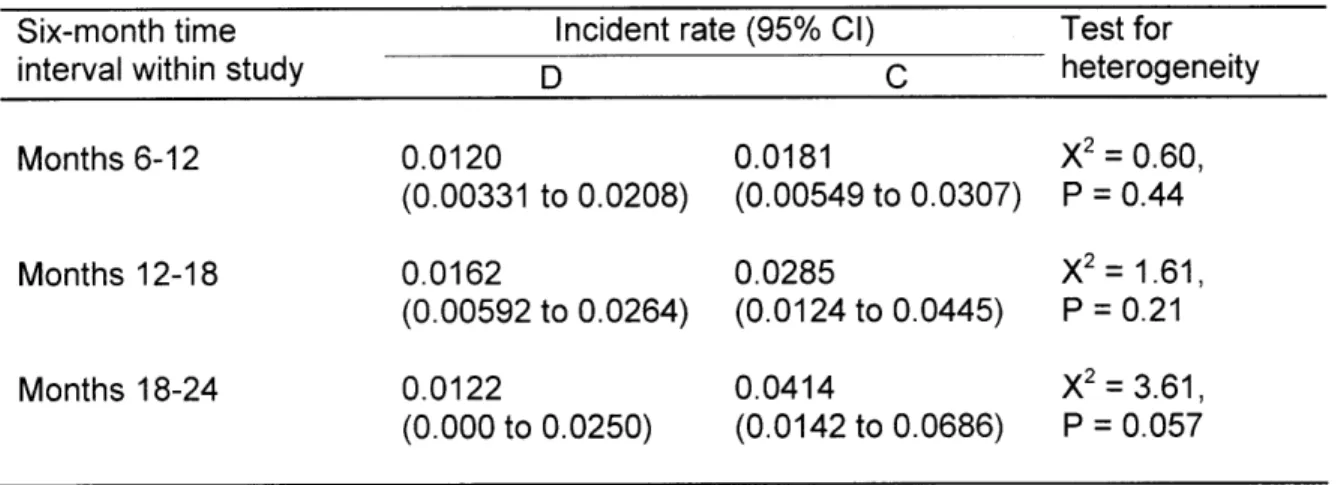
The rates of myocardial infarction (MI) for various six-month time intervals after DES
implantation while receiving either Dual-Rx or control are shown in Table 4, along with 95% CIs. All rates are calculated from data extracted from Eisenstein et al. For months 6-12: the rate of MI while receiving Dual-Rx was 0.0 120 (95% CI, 0.00331 to 0.0208); the rate of MI while receiving control was 0.0181 (95% CI, 0.00549 to 0.0307); the p-value was 0.44; and the efficacy is 0.33.
For months 12-18: the rate of MI while receiving Dual-Rx was 0.0162 (95% CI, 0.00592 to 0.0264); the rate of MI while receiving control was 0.0285 (95% CI, 0.0 124 to 0.0445); the p-value was 0.21; and the efficacy is 0.43. For months 12-18: the rate of MI while receiving Dual-Rx was 0.0 122 (95% CI, 0.000 to 0.0250); the rate of MI while receiving control was 0.0414 (95% CI, 0.0142 to 0.0686); the p-value was 0.057; and the efficacy is 0.70.
The results of meta-analyses of rates of MI while receiving either Dual-Rx or control are shown in Table 5. After combining rates of MI from different time intervals while receiving Dual-Rx (i.e., month 6-12, month 12-18, and month 18-24) the estimate rate of MI while receiving Dual-Rx was 0.0134 (95% CI, 0.00754 to 0.0 193). The test for heterogeneity showed that the rates were not statistically significantly different, with a p-value = 0.82. After combining rates of MI from different time intervals while receiving control (i.e., month 6-12, month 12-18, and month 18-24) the estimate rate of MI were different for the fixed effect model (0.0243 (95% CI, 0.0150 to 0.0336)) than the random effects model (0.0254 (0.0140 to 0.0368)). The test for heterogeneity
showed that the rates were not statistically significantly different, with a p-value = 0.26.
For Dual-Rx, since heterogeneity was not found, the random effects model reduces to the fixed effect model (i.e., the estimate rate for the fixed effect and random effects models are equal). For control, heterogeneity is suggested by the p-value which approaches statistical significance. The fixed effect and random effects models yield slightly different estimates (fixed effect = 0.0243; random effects = 0.0254).
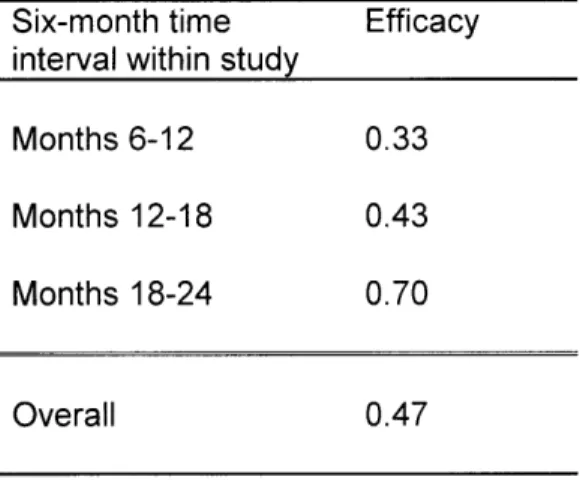
This trend was also reflected in the calculated efficacy of Dual-Rx for various six-month time intervals after DES implantation, as shown in Table 5. For months 6-12, the efficacy is 0.33. For months 12-18, the efficacy is 0.43. And for months 18-24, the efficacy is 0.70. The overall efficacy is 0.47. The range of efficacies was quite wide across time intervals. Given this, and the
challenges inherent in temporal representation of data, we explored alternative assumptions and hypotheses in wide ranges during sensitivity analysis. For our base-case estimates, we drew on supplemental evidence that the baseline efficacy of Dual-Rx as secondary prevention of MI is the sum of its constituents [6]. This value approximates both the efficacy during the 12-18 month time-period and the overall estimate.
4.2. Decision Modeling 4.2.1. Base-Case Analysis
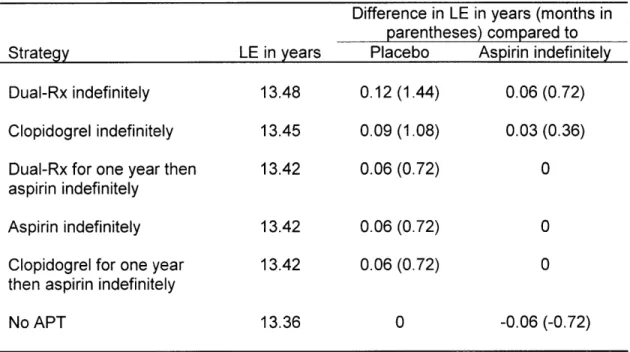
The baseline values for input into the decision model are shown in Table 7. The results of the baseline analysis are summarized in Table 8. The APT strategy Dual-Rx indefinitely yielded a
life expectancy of 13.48 years. Clopidogrel indefinitely yielded 13.45 years. Dual-Rx indefinitely modestly increased life expectancy by 1.44 months compared to no APT, and 0.72 months compared to aspirin indefinitely. Under these circumstances, when the difference in value between two or more therapeutic approaches is so close that none are clearly preferable, the decision is considered a "toss up", or "close call" [32].
4.2.2. Sensitivity Analysis
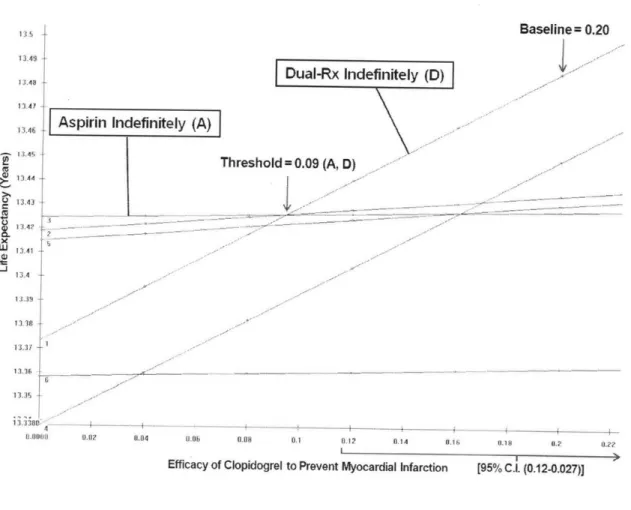
Figure 3 shows a one-way sensitivity analysis of the efficacy of clopidogrel to prevent MI. The horizontal axis shows the efficacy of clopidogrel, and the vertical axis shows the life expectancy in years. Each line on the graph represents an APT strategy (including those labeled "DAT Indefinitely" and "Aspirin Indefinitely"). For each efficacy value, the preferred strategy is represented by the line that is highest on the graph. A portion of the 95% CI for the variable is represented as a bracket near the x-axis. Where two lines intersect is called a threshold. For efficacy values greater than the threshold, one strategy is preferred, and for values less than the threshold, the other strategy is preferred. If a threshold is not found, then the analysis is termed insensitive to that parameter. If a threshold is found and is particularly close to the baseline
value, the analysis is sensitive to that variable. Figure 3 shows the threshold is 0.09, well below not just the baseline value but also the lower limit of the 95% confidence interval.
Figure 4 shows a one-way sensitivity analysis of the relative risk of severe gastrointestinal hemorrhage with clopidogrel. While, at baseline (2.01), DAT indefinitely is the preferred strategy, the threshold value (3.33) is well within the 95% confidence interval (as indicated near the x-axis).
5.DISCUSSION
5.1. Overview
We evaluated the long-term prevention of myocardial infarction and death with antiplatelet therapy in patients with drug-eluting coronary stents (DES) greater than one year post-DES placement. Our analysis indicates that three antiplatelet strategies yield similar life expectancy -Aspirin monotherapy indefinitely, Clopidogrel monotherapy indefinitely, and Dual-Antiplatelet therapy indefinitely.
Compared to placebo, Dual-Rx indefinitely (unless the patient experiences intracranial hemorrhage) increases life expectancy modestly (about 1.5 months). In this comparison, the mortality risk of intracranial hemorrhage or gastrointestinal hemorrhage is outweighed by the mortality benefit of Dual-Rx as secondary prevention of MI. For perspective, this gain in life expectancy approaches that of other accepted medical interventions for a similar target population (patients who have survived an acute MI) when compared to placebo. For example, beta-blocker therapy increases life expectancy by 5.6 months for patients with a high risk of recurrence. And revascularization with coronary-artery bypass grafting increases life expectancy by 1-7 months for patients with one vessel disease, and 0-8 months for patients with two-vessel disease [33].
While the current study's baseline estimates for rates of MI, intracranial hemorrhage, gastrointestinal hemorrhage and death, as well as efficacy and risk of APT (Table 1) included a broad range of patient populations that represents clinical practice, and we explored different assumptions in extensive sensitivity analysis, we have purposely designed the model structure to be generalizable to a variety of patient sub-populations, with a flexible structure that is suitable for future analyses that focus on specific subgroups: patients with off-label use of drug-eluting
stents or multiple stents; women; or the elderly; and many others with varying risks of MI and/or severe bleeding.
5.2.Limitations
Our study has several limitations. We used study-level and synthesis-level data from each published data source, so our projections may be more precise with individual patient-level data. We also made lifetime projections of outcomes which require assumptions based on the best evidence at the time our model was built. Additional evidence and scientific understanding in this rapidly evolving area may require adjustment in our analyses. For our meta-analyses, while we carefully chose our methods and primary data sets, no meta-analysis can compensate if the primary data contain bias - either publication bias or bias from poor study design and execution. And while we conducted extensive structural and deterministic sensitivity analysis, we did not conduct probabilistic sensitivity analysis.
5.3.Comparison with Other Studies
The findings of this analysis are consistent with a trial published in 2010 [34]. However, this trial may have been underpowered to see an effect, only examined the 12 to 24 month period post-DES placement, and, by the authors own conclusions, should be confirmed through larger, randomized clinical trials with longer-term follow-up [34, 35]. Such a trial to address the question of optimal type and duration APT for patients greater than one-year post-DES placement is planned.
Until results from larger trials are available, models like the current analysis can inform important patient-level and policy-level decisions with regard to ongoing management decisions in a number of ways. For example, in other areas of medicine, such as HIV and hyperlipidemia, comparison of models with new and ongoing clinical trials has led to deepening our
understanding of these health conditions. And in absence of trials, models have been compared with other independently-developed models (lending convergence validity), as demonstrated by collaborations such as the U.S. National Institute of Health's and National Cancer Institute's Cancer Intervention and Surveillance Modeling Network [36].
5.4. Future Directions
Future directions for the current work is to refine and validate the model, then implement results to inform health policy and routine clinical practice. There are long-standing and numerous ways comparative effectiveness studies like the current study can inform policy as well as be implemented into routine clinical practice [37]. These have taken the form of clinical practice guidelines, clinical algorithms, clinical balance sheets, and decision aids [28, 38-40].
One example of successful implementation of clinical practice guidelines related to anti-platelet therapy and DES is that of primary percutaneous coronary intervention. Several keys to successful implementation have included providing local institutions several core strategies that define high-quality care, but giving substantial latitude in determining the best method of local application of the strategies. In general, implementation research has demonstrated that approaches which take into account local constraints, infrastructure, and practice patterns are more likely to be successful. While sometimes requiring fundamental changes within complex clinical systems, evidence is emerging on effective practices, including a collaborative team-based approach and data-monitoring systems with prompt, effective feedback on performance [41, 42].
Many of these principles and strategies for efficiently and successfully implementing into routine clinical practice the findings from comparative effectiveness and other evidence-based, outcomes,
and health services research is the Department Veterans Affairs (VA)'s Quality Enhancement Research Initiative (QuERI) [41].
QuERI was launched in 1998 by the VA's Health Services Research and Development Service as a part of a system-wide transformation aimed at improving the quality and outcomes of healthcare for Veterans by implementing evidence-based clinical research findings into routine clinical practice. QuERI is organized into centers, each of which focuses on a condition that is either common among Veterans or places a high burden on patients, family members, and the VA healthcare system [43].
A QuERI center applicable to long-term antiplatelet therapy in patients with DES is the Ischemic Heart Disease (IHD) QuERI, whose mission is to improve the quality of care and health outcomes of Veterans with IHD by enabling implementation of best practices (e.g., guideline-indicated therapies) in acute care, chronic illness care, and secondary prevention [44]. Data resulting from IHD-QuERI analyses have provided additional evidence regarding the risk of stent thrombosis for DES for patients taking and not taking clopidogrel [45].
Follow-up studies for the current study may include collaboration with the IHD-QuERI, along with the QuERI which includes data on intracranial hemorrhage (i.e., Stroke QuERI) [46, 47]. Currently, there is not a QuERI focused on gastrointestinal hemorrhage, but this may be created. Data can be collected from the IHD-QuERI (Table 9) and Stroke QuERI databases, as well as VistA via Bayesian longitudinal histories [48]. These data can be synthesized in a multi-modeling approach [49]. Risk factors for MI, major hemorrhage, and potential discordance with a patient's overall MI/hemorrhage risk profile and her/his APT regimen can be identified. This information would serve as screening and early detection of areas for optimizing a patient's APT and care.
6.REFERENCES
1. Stone, G.W., et al., Safety and efficacy ofsirolimus- and paclitaxel-eluting coronary
stents. N Engi J Med, 2007. 356(10): p. 998-1008.
2. Schomig, A., et al., A ineta-analysis of 16 randomized trials of sirolimus-eluting stents
versus paclitaxel-eluting stents in patients with coronary artery disease. J Am Coll
Cardiol, 2007. 50(14): p. 1373-80.
3. Becker, R.C., et al., The primary and secondary prevention of coronary artery disease:
American College of Chest Physicians Evidence-Based Clinical Practice Guidelines (8th Edition). Chest, 2008. 133(6 Suppl): p. 776S-814S.
4. Mauri, L., et al., Stent thrombosis in randomized clinical trials of drug-eluting stents. N Engl J Med, 2007. 356(10): p. 1020-9.
5. A randomised, blinded, trial of clopidogrel versus aspirin in patients at risk of ischaemic
events (CAPRIE). The Lancet, 1996. 348(9038): p. 1329-1339.
6. Bhatt, D.L., et al., Patients with prior myocardial infarction, stroke, or symptomatic
peripheral arterial disease in the CHARISMA trial. J Am Coll Cardiol, 2007. 49(19): p.
1982-8.
7. Eisenstein, E.L., et al., Clopidogrel use and long-term clinical outcomes after
drug-eluting stent implantation. Jama, 2007. 297(2): p. 159-68.
8. Kushner, F.G., et al., 2009 Focused Updates: ACC/AL4 Guidelines for the Management
of Patients With ST-Elevation Myocardial Infarction (updating the 2004 Guideline and
2007 Focused Update) andACC/AHA/SCAI Guidelines on Percutaneous Coronary
Intervention (updating the 2005 Guideline and 2007 Focused Update): a report of the American College of Cardiology Foundation/American Heart Association Task Force on Practice Guidelines. Circulation, 2009. 120(22): p. 2271-306.
9. Grines, C.L., et al., Prevention ofpremature discontinuation of dual antiplatelet therapy
in patients with coronary artery stents: A science advisory
from
the American HeartAssociation, American College of Cardiology, Society for Cardiovascular Angiography
and Interventions, American College of Surgeons, and American Dental Association,
with representation from the American College of Physicians. J Am Dent Assoc, 2007.
138(5): p. 652-655.
10. Hal las,
J.,
et al., Use of single and combined antithrombotic therapy and risk of seriousupper gastrointestinal bleeding: population based case-control study. BMJ, 2006.
333(7571): p. 726-.
11. Buresly, K., et al., Bleeding complications associated with combinations of aspirin,
thienopyridine derivatives, and warfarin in elderly patients following acute myocardial infarction. Arch Intern Med, 2005. 165(7): p. 784-9.
12. Baigent, C., et al., Aspirin in the primary and secondary prevention of vascular disease:
collaborative meta-analysis of individual participant data
from
randomised trials.Lancet, 2009. 373(9678): p. 1849-60.
13. Pauker, S.G. and J.P. Kassirer, Decision analysis. N Engl J Med, 1987. 316(5): p. 250-8. 14. Hunink, M.G., P., Siegal, J. Weeks, J. Pliskin, J. Elstein, A. Weinstein, M., Decision
making in health and medicine: integrating evidence and values. 2001, Cambridge:
Cambridge University Press.
15. Egger, M., G. Smith, and D. Altman, Systematic Reviews in Health Care: Meta-Analysis
in Context. 2001, London: BMJ Publishing Group.
16. Higgins, J. and S. Green. Cochrane Handbook for Systematic Reviews of Interventions. 2009 [cited Version 5.0.2 [updated September 2009]; Available from: www.cochrane-handbook.org.
17. DerSimonian, R. and N. Laird, Meta-analysis in clinical trials. Control Clin Trials, 1986. 7(3): p. 177-88.
18. Renee, B.V.S., Primary Intracerebral Hemorrhage: Natural History, Prognosis, and Outcomes. 2005. 5(3): p. 163-167.
19. Safran, C., et al., Program Requirements for Fellowship Education in the Subspecialty of
Clinical Informatics. Journal of the American Medical Informatics Association. 16(2): p.
158-166.
20. Gardner, R.M., et al., Core Content for the Subspecialty of Clinical Informatics. Journal of the American Medical Informatics Association. 16(2): p. 153-157.
21. RL Keeney, H.R., Decisions with Multiple Objectives: Preferences and Value Tradeoffs. 1976, New York, NY: John Wiley & Sons.
22. Shortliffe, E.H. and J.J. Cimino, Biomedical Informatics: Computer Applications in
Health Care and Biomedicine. Third ed. 2006, New York, NY: Springer.
23. Keeney, R. and H. Raiffa, Decisions with Multiple Objectives: Preferences and Value
Tradeoffs. 1976, New York, NY: John Wiley & Sons.
24. Barnett, G.O., Computers in patient care. N Engl J Med, 1968. 279(24): p. 1321-7. 25. Beck, J.R. and S.G. Pauker, The Markov process in medical prognosis. Med Decis
Making, 1983. 3(4): p. 419-458.
26. Weinstein, M.C., et al., Principles of good practice for decision analytic modeling in
health-care evaluation: report of the ISPOR Task Force on Good Research Practices--Modeling Studies. Value Health, 2003. 6(1): p. 9-17.
27. Briggs, A., K. Claxton, and M. Sculpher, Decision Modellingfor Health Economic
28. Hunink, M. and P. Glasziou, Decision making in health and medicine: integrating
evidence and values. 2001, Cambridge, UK: Cambridge University Press.
29. Sonnenberg, F.A. and J.R. Beck, Markov models in medical decision making: a practical
guide. Med Decis Making, 1993. 13(4): p. 322-38.
30. Pauker, S.G., et al., Clinical decision analysis by personal computer. Arch Intern Med, 1981. 141(13): p. 1831-7.
31. Lau, J., J.P. Kassirer, and S.G. Pauker, Decision Maker 3.0. Improved decision analysis
by personal computer. Med Decis Making, 1983. 3(1): p. 39-43.
32. Kassirer, J.P., J.B. Wong, and R.I. Kopelman, Learning Clinical Reasoning. 2010, Baltimore: Lippincott Williams & Wilkins.
33. Wright, J.C. and M.C. Weinstein, Gains in life expectancyfrom medical
interventions--standardizing data on outcomes. N EngI J Med, 1998. 339(6): p. 380-6.
34. Park, S.J., et al., Duration of dual antiplatelet therapy after implantation of drug-eluting
stents. N Engl J Med, 2010. 362(15): p. 1374-82.
35. Berger, P.B., Optimal duration of clopidogrel use after implantation of drug-eluting
stents--still in doubt. N Engl J Med, 2010. 362(15): p. 1441-3.
36. Cancer Intervention and Surveillance Modeling Network: Modeling to guide public
health research andpriorities. 2010 30 Jun 2010 [cited 2010 July 15]; Available from:
http://cisnet.cancer.gov/.
37. Ratner, R., et al., Institute of Medicine. Initial national priorities for comparative effectiveness research. 2009, National Academies Pr: Washington, DC.
38. Pauker, S.P. and S.G. Pauker, The amniocentesis decision: an explicit guidefor parents. Birth Defects Orig Artic Ser, 1979. 15(5C): p. 289-324.
39. Eckman, M.H., et al., Making decisions about antithrombotic therapy in heart disease:
decision analytic and cost-effectiveness issues. Chest, 1998. 114(5 Suppl): p. 699S-714S.
40. Pauker, S.G. and S.P. Pauker, Prescriptive models to support decision making in
genetics. Birth Defects Orig Artic Ser, 1987. 23(2): p. 279-96.
41. Naik, A.D. and L.A. Petersen, The neglectedpurpose of comparative-effectiveness
research. N Engl J Med, 2009. 360(19): p. 1929-3 1.
42. Nallamothu, B.K., E.H. Bradley, and H.M. Krumholz, Time to treatment in primary
percutaneous coronary intervention. N Engl J Med, 2007. 357(16): p. 1631-8.
43. QUERI: Quality Enhancement Research Initiative. 2010 July 6, 2010 [cited 2010 July 10]; Available from: http://www.queri.research.va.gov/default.cfim.
44. Ischemic Heart Disease (IHD) Quality Enhancement Research Initiative. 2010 June 14, 2010 [cited 2010 July 10]; Available from:
http://www.queri.research.va.gov/ihd/default.cfm.
45. Ho, P.M., et al., Clopidogrel and long-term outcomes after stent implantationfor acute
coronary syndrome. Am Heart J, 2007. 154(5): p. 846-51.
46. Williams, L.S. and R.L. Roudebush. Stroke QUERIStragetic Plan 2008. 2008 December 2008 [cited 2010 July 16]; Available from:
http://www.queri.research.va.gov/about/strategicplans/str.pdf.
47. Ischemic Heart Disease IHD Cube Manual. June 4, 2010 [cited 2010 July 16]; Available
from:
http://www.visn20.med.va.gov/V20/DataWarehouse/Documents/OLAPMetaData.asp#de fs.
48. Reis, B.Y., I.S. Kohane, and K.D. Mandl, Longitudinal histories as predictors offuture
diagnoses of domestic abuse: modelling study. Bmj, 2009. 339(339): p. b3677.
49. Tsafnat, G. and E.W. Coiera, Computational reasoning across multiple models. J Am Med Inform Assoc, 2009. 16(6): p. 768-74.
7.APPENDICES 7.1. Appendix A: List of Abbreviations
Antiplatelet therapy... APT Drug-eluting stent(s)... DES Dual-antiplatelet therapy... Dual-Rx Life expectancy... LE Myocardial infarction... MI Veterans Administration... VA Veterans Health Administration... VHA
7.2. Appendix B: List of Tables
Table 1: Clinical outcomes at four years (complete results, all pre-specified intervals).
Table 2: Rates of myocardial infarction for various yearly time intervals after drug-eluting stent implantation.
Table 3: Results of meta-analyses of rates of myocardial infarction.
Table 4: Rate of myocardial infarction for various six-month time intervals while receiving either dual-antiplatelet therapy or control.
Table 5: Results of meta-analyses of rates of myocardial infarction while receiving either dual-antiplatelet therapy or control.
Table 6: Calculated efficacy of dual-antiplatelet therapy.
Table 7: Base-case values. Panel A, event probabilities; Panel B, medication risk and efficacy. Table 8: Base-case analysis.
Table 9: Ischemic heart disease cube measures.
7.3. Appendix C: List of Figures
Figure 1: Analysis of myocardial infarction according to the drug-eluting stent type. Figure 2: Markov state transition model.
Figure 3: One-way sensitivity analysis varying the value of the variable efficacy of clopidogrel to prevent myocardial infarction.
Figure 4: One-way sensitivity analysis varying the value of the variable clopidogrel risk associated with severe gastrointestinal hemorrhage.
![Table 9: Ischemic heart disease cube measures. From U.S. Department of Veterans Affairs [47].](https://thumb-eu.123doks.com/thumbv2/123doknet/14406497.510896/48.918.117.797.160.1123/table-ischemic-heart-disease-measures-department-veterans-affairs.webp)