COMPUTER OPTIMIZATION OF THE MIT ADVANCED WET/DRY COOLING TOWER CONCEPT FOR POWER PLANTS
by Michael Choi Leon R. Glicksman
Energy Laboratory Report No. MIT-EL 79-035 Heat Transfer Laboratory Report No. 87162-102
COO-4114-6
COMPUTER OPTIMIZATION OF THE MIT ADVANCED WET/DRY COOLING TOWER CONCEPT FOR POWER PLANTS
by
Michael Choi Leon R. Glicksman
Energy Laboratory and
Heat Transfer Laboratory
Department of Mechanical Engineering Massachusetts Institute of Technology
Cambridge, Massachusetts 02139
Prepared under the support of the Environmental Control Technology Division
Office of the Assistant Secretary for the Environment
U.S. Department of Energy Contract No. EY-76-S-02-4114.AOOl
Energy Laboratory Report No. MIT-EL 79-035 Heat Transfer Laboratory Report No. 87162-102
ii
Abstract
There is a projected water shortage problem in the electrical power industry by the end of this century. Dry and wet-dry cooling towers are going to be the solution of this problem. Our previous study on the combination of separate dry and wet cooling towers indicated that wet-dry cooling is an economical choice over all-dry cooling when some water is available but the supply is insufficient for an evaporative tower. An advanced wet-dry cooling tower concept was experimentally studied at MIT's Heat Transfer Laboratory and a computer model was developed for
predicting the performance of this cooling concept. This study has determined the cost of the cross-flow type of this cooling concept in conjunction with steam electrical power plants. Aluminum is found to be economically preferable to galvanized steel as the cooling plate material. In our base case study using aluminum plates for a 1094 MWe nuclear plant at Middletown, the MIT advanced cooling concept is comparable to conventional wet-dry towers at water makeups larger than 45% and is slightly more
economical at makeup larger than 50%. The incremental costs over the power production cost, 32.3 mills/Kwhr, of zero condenser system are 14, 13 and 12 percent for makeups of 45, 60 and 55 percent, respectively. For an 800 MWe fossil plant at Moline, this cooling concept is more economical than
conventional wet-dry towers at water makeups larger than 27%. The incremental costs over 20.8 mills/Kwhr of zero condenser system are 12.2 and 10.6
percent for makeups of 37 and 50 percent, respectively. For these two makeups, going from conventional wet-dry to MIT advanced concept results in 13 and 21 percent, respectively, savings in the incremental cost. When
the water makeup exceeds 30%, the MIT advanced wet-dry concept is pre-ferable to conventional wet-dry towers for a 1200 MWe nuclear plant at
Moline, Ill. The incremental costs over zero condenser system of 21.1 mills/ Kwhr are 12.8 and 11.5 percent for makeups of 40 and 50 percent, respectively. Using the MIT advanced concept instead of conventional wet-dry towers
results in 28 and 33 percent reduction of incremental power production cost for these two makeups, respectively.
:111
ACKNOWLEDGMENTS
This report is part of an interdisciplinary effort by the MIT Energy Laboratory to examine issues of power plant cooling system design and operation under environmental constraints. The effort has involved participation by researchers in the R.M. Parsons Laboratory for Water Resources and Hydrodynamics of the Civil Engineering Department and the Heat Transfer Laboratory of the Mechanical Engineering Department. Financial support for this research effort has been provided by the
Division of Environmental Control Technology, U.S, Dept. of Energy, under Contract No. EY-76-S-02-4114.A001. The assistance of Dr. William Mott,
Dr. Myron Gottlieb and Mr. Charles Grua of DOE/ECT is gratefully acknowledged.
Reports published under this sponsorship include:
"Computer Optimization of Dry and Wet/Dry Cooling Tower Systems for Large Fossil and Nuclear Plants," by Choi, M., and
Glicksman, L.R., MIT Energy Laboratory Report No. MIT-EL 79-034, February 1979.
"Computer Optimization of the MIT Advanced Wet/Dry Cooling Tower Concept for Power Plants," by Choi, M., and Glicksman, L.R., MIT Energy Laboratory Report No. MIT-EL 79-035, September 1979. "Operational Issues Involving Use of Supplementary Cooling Towers to Meet Stream Temperature Standards with Application to the
Browns Ferry Nuclear Plant," by Stolzenbach, K.D., Freudber:., S.A., Ostrowski, P., and Rhodes, J.A., MIT Energy Laboratory Report No. MIT-EL 79-036, January 1979.
"An Environmental and Economic Comparison of Cooling System
Designs for Steam-Electric Power Plants," by Najjar, K.F., Shaw, J.J., Adams, E.E., Jirka, G.H., and Harleman, D.R.F., MIT Energy
Laboratory Report No. MIT-EL 79-037, January 1979.
"Economic Implications of Open versus Closed Cycle Cooling for New Steam-Electric Power Plants: A National and Regional Survey," by Shaw, J.J., Adams, E.E., Barbera, R.J., Arntzen, B.C., and Harleman, D.R.F., MIT Energy Laboratory Report No. MIT-EL 79-038,
iv
"Mathematical Predictive Models for Cooling Ponds and Lakes," Part B: User's Manual and Applications of MITEMP by Octavio, K.H., Watanabe, M., Adams, E.E,, Jirka, G.H., Helfrich, K.R., and
Harleman, D.R.F.; and Part C: A Transient Analytical Model for Shallow Cooling Ponds, by Adams, E.E., and Koussis, A., MIT Energy Laboratory Report No. MIT-EL 79-039, December 1979. "Summary Report of Waste Heat Management in the Electric Power Industry: Issues of Energy Conservation and Station Operation under Environmental Constraints," by Adams, E.E., and Harltman, D.R.F., MIT Energy Laboratory Report No. MIT-EL 79-040, December
V Table of Contents Abstract Acknowledgements Table of Contents CHAPTER 1 1.1 1.2 1.3 CHAPTER 2 2.1 2.2 2.3 2.4 CHAPTER 3 3.1 3.2 3.3 3.4 CHAPTER 4 4.1 4.2 4.3 CHAPTER 5 5.1 CHAPTER 6 6.1 6.2 6.3 CHAPTER 7 CHAPTER 8 CHAPTER 9 Introduction
Scope of this Study Outline of Presentation
Method of Analysis Plant Model
Base Economic Factors Meteorological Condition
Method of Analysis Plant Model
Base Economic Factors Meteorological Conditions
MIT Advanced Wet/Dry Cooling Tower System Model Introduction
Packing Plates
Evaluation of Off-Design Tower Performance Optimization Procedure
Optimization Procedure Results of Optimization
Results for Middleton using United Engineers Approach and Base Economic Factors
Results of Optimization for the Moline Site Wet Topping
Comparison with United Engineer's Study Sensitivity Study
Conclusions and Recommendations
Page ii iii v 4 4 6 6 7 7 7 7 7 9 9 9 9 9 11 11 16 16 17 17 19 19 22 33 34 38 39
vi
Page
CHAPTER 9 Conclusions and Recommendations 39
9.1 Conclusions 39
9.2 Recommendations 40
9.3 Acknowledgement 40
References 41
Appendix A Plate Cost 42
-4-Chapter 1
1.1 Introduction
A modern-day fossil-fueled electrical power plant has an efficiency of
about 40%; approximately one-half of the heat from the fuel burnt in the boiler
is rejected to the circulating water. The efficiency of a Pressurized Water
Reactor or Boiling Water Reactor nuclear power plant is about 33%; two-thirds
of the nuclear heat generated is rejected as waste heat. Therefore, in the
electrical power industry, the amount of waste heat discharged to the
environ-ment is enormous, and this must be handled safely, economically and without
causing damage to the environment.
For power plants located at a river, ocean or lake where large quantities
of water are available, once-through cooling is often employed. In once-through
cooling, the hot water from the condenser is discharged into the waterway,
result-ing in an increase of water temperature which may have adverse effects on the
ecology of the water bodies.
Conventionally, when water is not sufficient for once-through cooling,
evap-orative towers are used. The circulating hot water is broken into
small
droplets
by splashing it down the fill
in the
cooling tower. More than 75% of the heat
rejection is by evaporation. One major disadvantage of evaporative towers is
the comsumption of a huge amount of water. A 1000 MWe LWR nuclear plant operating
at rated load with an evaporative tower requires about 20,000,000 gallons of
make-up water every twenty-four hours 6].
Because of high cost, dry cooling towers have not been broadly used by the
utility in the United States. By supplementing the dry towers with evaporative
towers the cost of all-dry cooling can be significantly reduced. The first
-5-dry towers have been purchased by Public Service Co, of New Mexico for use at their San Juan site. These units, 450 MWe each, are designed to save 60% of the water consumed by evaporative cooling towers.
Several years ago ERDA (now the DOE) sponsored a study by Westinghouse Hanford Co. to determine the regional requirements for dry cooling. The study concluded that there are economic alternatives to dry and wet-dry cooling up to 1990. From 1990 to 2000, the combined effects of restrictions on coastal siting, state regulations of the purchase and transfer of water rights from agriculture or other uses to cooling supply, together with the rapid and con-tinuous growth in electricity demands, will have the potential of bringing wet-dry or wet-dry cooling to increased use. Nationally, a total of 21,000 to 39,000 MWe will require dry or wet-dry cooling at that time [7].
The development of the MIT advanced wet-dry cooling concept is to meet such needs. Although this concept was experimentally studied in the past sev-eral years, no cost optimization was done at MIT. United Engineers [2] has
per-formed cost optimization on this MIT concept and reported that this concept is comparable to conventional wet-dry towers only at water makeup of about 50%. However, neither tower performance nor detailed comparison between aluminum and steel were rported. In our present work attempt has been made to compare our results with those of United Engineers. Since it is difficult to compare the results of one study to another if the method of analysis, economic factors and site metereological conditions differ, effort has been made to use these
the same as the United Engineers in our computer program. However, cost alog-rithyms of most cooling components are those originally in our program [1].
-6-been added. Aluminum is about 25% more expensive than galvanized steel.
Detailed cost data are given in the Appendix A.
1.2 Scope of This Study
The
cost
optimization of the MIT advanced wet/dry for a LWR nuclear
plant at the Middletown site was performed so that comparisons can be made
between the results of this study and those reported by United Engineers [2].
In addition, our present work also covers the economic optimization of this
cooling concept in both fossil and nuclear power plants at the Moline site.
Economics of the advanced MIT wet-dry concept will be compared to conventional
wet-dry towers. This is a continuation of our previous study prepared for the
Division of Environmental Control Technology, U.S. Department of Energy.
113
Outline of Fresentation
The material in this report is presented in the following sequence. Chapter
2 is a presentation of power plant model, method of analysis and basic economic
factors for the Middletown site. These are reported in Chapter 3 for the Moline
site. Chapter 4 presents the MIT advanced wet/dry cooling tower model. The
optimization procedures are given in Chapter 5 and the results are reported in
Chapter 6. Chapter 7 compares the results of this study with the United
Engin-eers. A sensitivity study of the effect of plate cost on the economic
optimi-zation is presented in Chapter 8. Finally, Chapter 9 gives conclusions and
-7-Chapter 2
This chapter presents the power plant model, method of analysis and base case sconomic factors for the Middletown site. These are the same as those used by United Engineers 2].
2.1 Method of Analysis
The method of analysis is a fixed steam source and fixed demand app-roach. It assumes a constant heat source of 3173 MWT to be coupled to a conventional low back pressure steam turbine and there is a fixed demand of electrical output from the power plant. The reference plant is assumed to operate at 2 inch HgA all year round with an output of 1094 MWe which is then assumed to be the fixed demand. Any deficit between the plant net capacity and the fixed demand is replaced by incremental base load plant. No load pro-file is scheduled for the power plant. It assumes that the average annual capacity factor is 75%.
2.2 Plant Model
The nuclear power plant assumed for the cooling system evaluation at Middletown is a Light Water Reactor (LWR). As mentioned in the previous sec-tion the steam source is fixed and is coupled to a low back pressure turbine. The turbine-generator is a General Electric Tantum Compound Six Flow (TC6F) 38" turbine. The turbine inlet steam condition is 9f5 psig saturated. The fll-load turbine net heat rate vs. exhaust pressure is plotted in Fig. 2.1.
2.3 Base Economic Factors
The base economic factors for the Middletown site are given in Table 2.1. All the costs are in 1985 dollars.
2.4 Meteorological Condition
The dry bulb and wet bulb temperature distributions at the Middletown site are shown in Fig. 2.2.
-8-Table 2.1
Year of Pricing Power Plant Cost Fuel Cost
Fixed Charge Rate
Average Annual Capacity Factor
Capacity Penalty (Incremented Base Load P1 Energy Penalty (Base Load Plant Fuel Cost) Water Cost
Indirect Cost
Base Case Economic Factors for Middletown 1985
$600/KW
$1.53/MM BTU 18% 75% Lant) $600/KW $1.53/MM BTU 27¢/1000 gallons 25% of direct capital costFIG. 2.1
NErT EAT RAE VS. EXiAUST PRESSU}E FOR 3173 MAt NUCLEAR TURBINE
n )A.)n .LJ vU 10200 10000 QQn 0 vv 0 1 2 3 4 5
TURBINE EHAUST PESSURE ( INCH HGA )
0 0 0 O 0o 0 0 o oI'D 0
°0
o 0 .0 o '.0 o N (a f'3 ) Anx~admad
m 0 -4 0
-9-Chapter 3
The power plant model, method of analysis and base economic factors for the Moline site are presented in this chapter.
3.1 Method of Analysis
The method of analysis is a constant steam source and fixed demand app-roach. It assumes a constant heat source to be coupled to a low back pressure
turbine. This heat source is 1862 MWt for the fossil plant and 3577 MWt for the nuclear plant. There is a fixed demand of electrical output from the power plant. This is 800 MWe for the fossil plant and is 1200 MWe for the nuclear plant. Any deficit between the net plant capacity and the fixed demand is re-placed by gas turbines. There is no load profile scheduled for the power plant. The annual capacity factor is 75%.
3.2 Plant Model
The nuclear plant assumed for the cooling system evaluation is a Boiling Water Reactor (BWR). The turbine-generator is a Qeneral Electric TC6F-38 tur-bine with its full-load net heat rate vs. exhaust pressure shown in Fig. 3.1. The turbine inlet steam condition is 965 psig saturated. The fossil plant is assumed to be coal-fired. Its turbine-generator is a General Electric Cross Compound Six Flow (CC6F) with reheat cycle; its inlet steam conditions are 3500 psig 1000°F/100°F. The full-load net heat rates vst exhaust pressure of the fossil turbine is shown in Fig. 3.2.
3.3 Base Economic Factors
The base economic factors for the Moline site are given in Table 3.1. All the costs are in 1977 dollars.
3.4 Meteorological Conditions
The dry bulb and wet bulb temperature distributions at Moline are shown in Fig. 3.'3.
-10-Tal)Ie 3.1.
Year of Pricing Power Plant Cost:
Fossil Nuclear
Iase Economic Factors for tot inc
1977 $500/KW
$600/KW
Fuel Cost: Fossil (coal) ,uclearFixed Charge Rate Annual Capacity Factor
Replacement Capacity (gas turbines) Replacement Energy (gas turbines) Operation and Maintenance
Indirect Cost Water Cost $0.90/-91 BTU $0.47/MM BTU 17% 75% $160/KW 30 mills/KWhr 1% of all capital costs 20% of direct capital cost 20¢/1000 gallons
NEIE T RATE VS. EXHAUST PRESSUR FOR 1862 M4,t FOSSIL URBNE
1 2 3 4 5
'URBINE EIAUST PRESSUtE ( INCH HGA ) FIG. 3.1 8050 7950 F -7850 7750 0
1,
of
iH
p
e
0
1 2 3 4IUJRB3INE EXIAUST P1ESSUIRE ( INCi HIGA ) FIG. '
03 ( a
9ac1
) anL d L H Um Up 6lt
m;
E-1 m i: ;NI-I
nrA
04 tn 1 ) ;4
-11-Chapter 4
ML1T Advanced Wet/Dry Cooling Tower System Model 4.1 Introduction
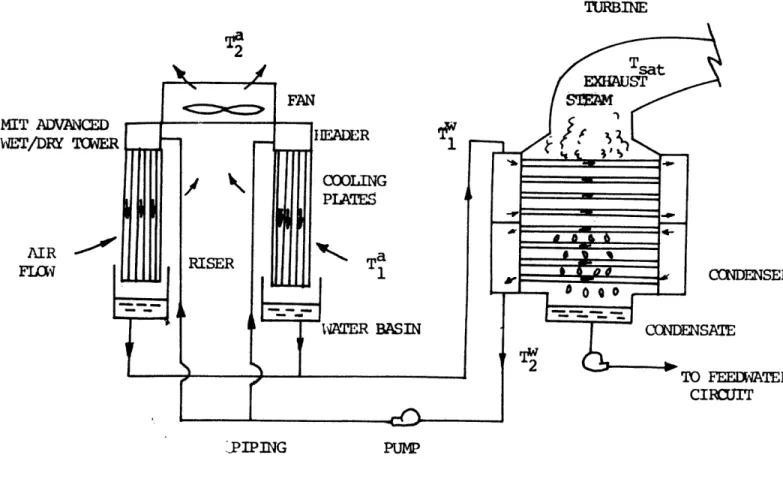
In this study the MIT advanced wet/dry cooling tower system is taken to be an indirect type with surface condensers and tower heat exchangers are packing plates with V-shape water troughs. The air flow in the cooling tower is mechanically induced by fans. The piping system is considered in detail. The various components of the cooling tower system are shown in Fig. 4.1.
Condensation of turbine exhaust steam takes place at the saturated steam temperatures corresponding to a given turbine exhaust pressure. The condensate is returned to the feedwater circuit. Cooling water entering the condenser at a temperature Tw is heated to a temperature T2W on leaving
12
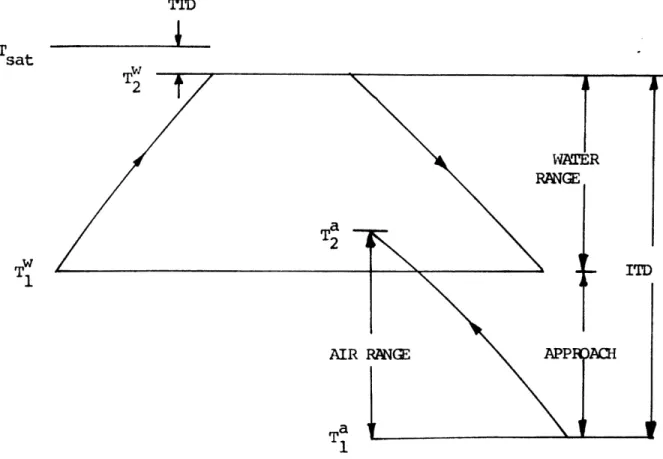
the condenser. Te difference between the saturated steam temperature and the hot water temperature is the terminal temperature difference (TTD). The temperature difference between T 1 and T 2 is the water range. On leaving tile condenser, the hot water is circulated through the piping system to the wet/dry tower. The plates are folded at the top to direct water into the
V-troughs and prevent water from wetting the fins [4,8]. This is illustrated in Fig. 4.6 on te header plate into the V-shape troughs running from the top to the bottom of the plates. The plates are tilted at 100 to the vertical so that the water flows down the troughs under gravity.
Evaporation takes place at the air-water interface. Furthermore, con-vective heat transfer takes place on the dry plate surface where air flows across the plate. On the wetted side of the plates, the dry surface is
-12-roughened with flow disturbers which serve two purposes. First, they break up the boundary layers to increase the heat transfer coefficient and second, they direct the air-water mixing at both ends of the plates back to the troughs.
Because the MIT advanced wet/dry tower has only a single structure, no infinite control of water and air flow rates is required. This is an important advantage over the conventional wet-dry towers which consist of separate wet and dry towers.
The difference between the temperature of the hot water entering the cooling tower and the dry bulb temperature of the incoming ambient air is the initial temperature difference (ITD). After cooling, the water is collected in a water basin and returned to the condenser. The difference
w
between the cool water temperature ,T1 , and the ambient wet bulb tempera-ture is the approach. The temperature relationships are illustrated in Fig. 4.2
The wet/dry towers considered in this study are circular in shape. The cooling plates are arranged around the base of the towers. These are illus-trated in Fig. 4.3.
Crossflow is preferrable to counterflow because of the water-air mixing above and below the plates in the latter which could increase the water ev-aporation. Therefore, only the crossflow type of this cooling concept is considered in this study.
Han's correlations [3] are employed in determining the heat transfer co-efficient and friction factor for the roughened surface of the cooling
-13-plates. They are the following:
R + e e e DhV'2/ f R = 2/-- 2.5 n - - 3.75 e - Dh f h + n 0.35 0.57 R *P (T/90) (a/45) = 4.9 e P/e + -0.4 for e+ < 35 where = { 0 for e > 35 ={ 0.13 for P/e < 10 0.71 0.53 (/90) for P/ > 10 and where and m (e+ /35) Re * Reynold's number p = density of air = viscosity of air V = air velocity Dh = hydraulic diameter f = friction faction e = right height P pitch of ribs a- angle of attack
= angle of inclination of ribs
For e > 35 then H+ Fore~~~ eE.C C
(s-
0-)where C - constant which depends on the surface characteristics The Stantton number is given by:
-14-The Nusselt number is given by: Nu = 0.72 St Re Heat transfer coefficient h + Nu k/Dh
where k - conductivity of air.
Note that each cooling plate has two distinct sides. On the wetted side, the ribs are the flow separators. On the unwetted side, the pro-trusions of the V-troughs naturally become ribs themselves. Therefore, there are two different convective heat transfer coefficients, one for each side of the plate. Similarly, this is also true for the friction factor.
In this study the overall convective heat transfer coefficient is taken to be the mean value. The friction factor is the mean friction factors.
In the above correlations, we have the following:
0.25 inch for the wetted side e =
{
0.2706 inch for the unwetted side
45° for the wetted side 90 for the unwetted side
9u° ror the wLted side {60O° for the unwctted side
10. for the wetted side c =
{13.6604 for the unwetted side
+ +
For e < 35, then H C.
By using these correlations, a comparison between several runs of experi-mental results [8] and theoretical predictions is made in Table 4.1. In general, good agreement is achieved between the data the theoretical results.
' . -15--' un c + oo Ln CN o ,-4 o (vo 0 C -4 r- m all rH *n rH * C o Cn -+ - o Co -. * * v * N-O o3 e - - C4 . 4Z~~~~~O - 'F O~~~~~~~~~~~~r- . O ~ 0 00 T r-4 00 -co qS oO o + o X X N o oo oq ,n~~~~~~me o
~
~
~
~
~ ~ ~
o C~~~~~~~~~C
en 4 -4-4 n- en S -t ,o o o.~o 0 ,-4 a'~ cl OU O +X -.n *~ -H a ·-4 4-J 0o 0 Ln O~
~
0 C J: a en U~ a Q e as C- H ; 1a 1 -,4 N- 0 4 --~1 ~ ,- o ., ci)~
~
~
~ ~ ~ ~ ~ ~~~&
¢/) H u u u H a) =cd oi i ,H U H r/j 0 cd -~ 0~ 0 ) Oi...4 E co ·. $6 ' 4-' .i, ci H. O. ( -Q- 4 &-4 P. r. · ,.~~~~~~~~.4 co lw H ) 4- U) o w .~ ( <2 < 4-i ~ ) ~ H o > U) 4i J c) E -4 0-+-
-16-4.2 Packing Plates
As mentioned in the previous section, the cooling plates are folded at the top to direct water into the V-troughs. In manufacturing these plates, a structure of ten of these plates is bolted together to form a fill pack
[2]. These fill packs are shipped to the construction site where a number of these fill packs form the necessary number of modules. These cooling modules are supported above the water basin by an "I" beam structure. The plates are held at 10° to the vertical by a wedge-shape structure formed from pipes [2].
4.3 Evaluation of Off-Design Tower Performance
The evaluation of the heat rejection capability of the MIT advanced wet/ dry tower at off-design condition is discussed in this section.
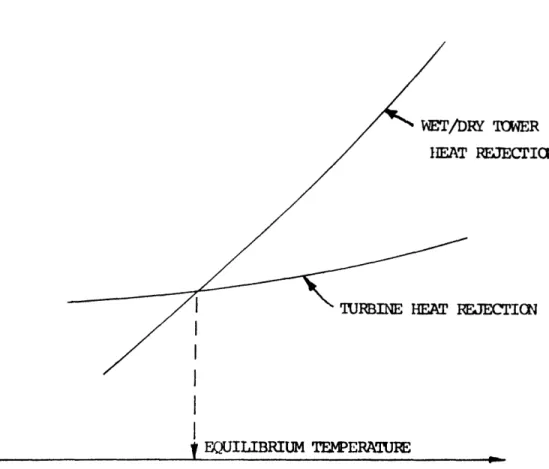
At thermodynamical equilibrium the condenser heat load must be equal to the tower heat rejection rate. Also, the condenser heat load is equal to the rate of heat discharged by the turbine. The determination of the condenser equilibrium temperature requires trial and error. The bulky calculation can be readily handled by the computer. To do this, for each ambient condition under consideration, first, a file of tower heat rejection vs. turbine exhaust steam temperature is created. Second, the turbine heat rejection vs. exhaust steam temperature is determined. Then trial and error is used to determine the equilibrium temperature at which the tower heat rejection rate is equal to the turbine heat rejection rate. This is illustrated in Fig. 4.5.
In this study, the performance of the MIT advanced wet/dry tower is eval-uated over a yearly cycle of temperature and air humidity.
MIT ADVANCED TAR/DY Tm
AIR
-Fll
.PIPING PUMP
FIG. 4.1 MIT ADVANCED WET/DRY COOLING TCIWER SYSTEM
DENSER
IATER IT
TTD Tsa sat w T 1 -1
T = SATURATED STEAM TEMPERATURE AT TURBINE OUTlET sat
TTD = CCNDENSER TERMINAL TEMPERATURE DIFFERENCE ITD = INITIAL TEMPERATURE DIFFERiENCE
T1 = COOL CATER TEMPERATURE
T2 = IOT WATER TMPERATURE
Ta = TEMPERARJRE OF AMBIENT AIR PJ3.RI24G WET/DRY OER T22a = TEMPERAT URE OF AIR LEAVING TOWER
AIR
FLCW Plates Tower FIG. 4.3PLATE
i-
HwI
10 M
Flow to-FIG. 4.4 -~ - 5/16" PLATE - lEIG -vT %L CD)A(Tqt -JLact 7l r
-HEAT IREJECI RATE
EQUILIBRIUM TERATUI
TIDINE EXIAUJST STEAM TEMPERATURE
FIG. 4.5 RY TIMER E.JECTION
I
I
RFJECrICN lCOOLIN
WATER
SIDE VIEW
FIG. 4.6
-17-Chapter 5
Optimization Procedure
The optimization program optimizes the plate spacing, plate packing width, plate height, air flow rate and water flow rate. The number of water troughs per plate is varied to give various water makeup requirements. Illustration of the meaning of the above variables has been given in Fig, 4.4.
5.1 Optimization Procedure
With a given plate material, a given turbine heat rate characteristic, a specified net capacity, a given set of economic parameters, a given set of meteorological data and the variables mentioned above, optimization can then
be performed. The optimization involves sequentially varying one variable while keeping the others constant. The procedures are as follows:
(1) Select a design ambient ondition and a design turbine exhause steam saturated temperature. Although these are rather arbitrary, they should be chosen so that they are economical to the utility. By selecting the maximum ambient and the maximum backpressure of a low back pressure turbine, steam throttling can be avoided. In other words,
the power plant can run at full-load all year long. The difference be-tween the saturated steam temperature and the design condenser terminal temperature difference gives the hot water temperature.
(2) Pick a combination of reasonable values of plate spacing, packing width, plate height, air flow mass velocity ( V) and water flow rate for a given number f plates.
(3) Vary the number of troughs per plate to give different water makeup systems.
-18-(4) Find the power production cost for the various water makeups.
(5) Change the plate spacing while keeping the other variables constant. (6) Plot the power production cost vs. the water makeup for the various
spacings.
(7) Select the rough optimum spacing that gives the least power production cost for a given makeup.
(8) Repeat the above procedures for the other variables. (9) Repeat the above with smaller changes in the variables.
(10) Use further smaller step sizes if noticeable changes in the cost is
observed, This gives the final optimum values. The computer program listing is given in Appendix B.
-19-Chapter 6
Results of Optimization
This chapter presents the results of optimization for both the Middle-town site and the Moline site. They are given in sections 6.1 and 6.2, respectively.
6.1 Results for Middletown Using United Engineers Approach and Base Economic Factors
The power production cost vs. water makeup requirement were plotted in Figs. 6.1 - 6.5 for aluminum plates. In Fig 6.1 we see the effect of plate spacing on the power production cost is quite significant. Bearing in mind that plate spacing should he limited to a minimum of 0.75 inch and to a maxi-mum of 1.5 inches to avoid any manufacturing problems [2], only values within these limits were considered. In this figure we see that for water makeup larger than about 41%, among the three spacings considered, 1 inch is the best. For water makeup less than 41%, 0.75 inch spacing is slightly better than 1 inch. Fig. 6.2 shows the effect of the air velocity. In general, a higher air velo-city would result in a higher heat transfer coefficient but a larger pressure drop. Among the three air flow rates considered, a value of 3000 lb/hr/ft2
is the most economical. It corresponds to a velocity of about 12 ft/sec. Because pressure drop is proportional to the square of the air velocity, a high air velocity gives a very large pressure drop or fan power.
Fig. 6.3 is a plot of power production cost vs. water makeup for three different packing widths. It appears that a packing width of 5 ft. is the best in almost all water makeups. The number of troughs per foot of packing width might be limited to a maximum of eight to avoid any manufacturing
-20-packing width is limited to 40. For -20-packing widths of 7 ft. and 9 ft., the
maximum number of troughs are 56 and 72, respectively.
Fig. 6.4 shows the effect of the plate height on the cost. Among the
three hights considered, 28 ft. is the most economical. Note that a larger
plate height would result in a higher pumping head.
The effect of the water flow rate on the cost can be seen in
Fig. 6.5
For makeups larger than about 46%, a water flow rate of 3000 lb/hr/plate is the
best. For makeups less than 46%, 2000 lb/hr/plate is the most preferrable.
After using smaller changes in the variables, the fine optimum power
production cost vs. water makeup curve was plotted in Fig. 6.11.
Using galvanized steel plates, the results were plotted in Figs. 6.6
-
6.10,
and the fine optimum curve is also shown in Fig. 6.11.
In employing the Han's correlations, the total heat transfer area should
be larger is all the faces of the ribs on the wetted ide of the plates were
included. It
would increase the dry surface area by about 10%. The effect of
this increase in surface area can be seen in Fig. 6.11. Because an increase
in the heat transfer area results in a higher convective heat transfer, the
effect is economically very favorable.
A comparison between aluminum plates and steel platescan be made in
Fig. 6.11. Because the thermal conductivity of aluminum
is six
times that
of steel, the fin efficiency of aluminum plates is much higher for low water
makeups.
Note that for aluminum plates, although the MIT advanced et/dry concept
-21-larger than about 50%, it does not differ much in cost from the conventional wet-dry towers at makeups between 40 and 50 percent.
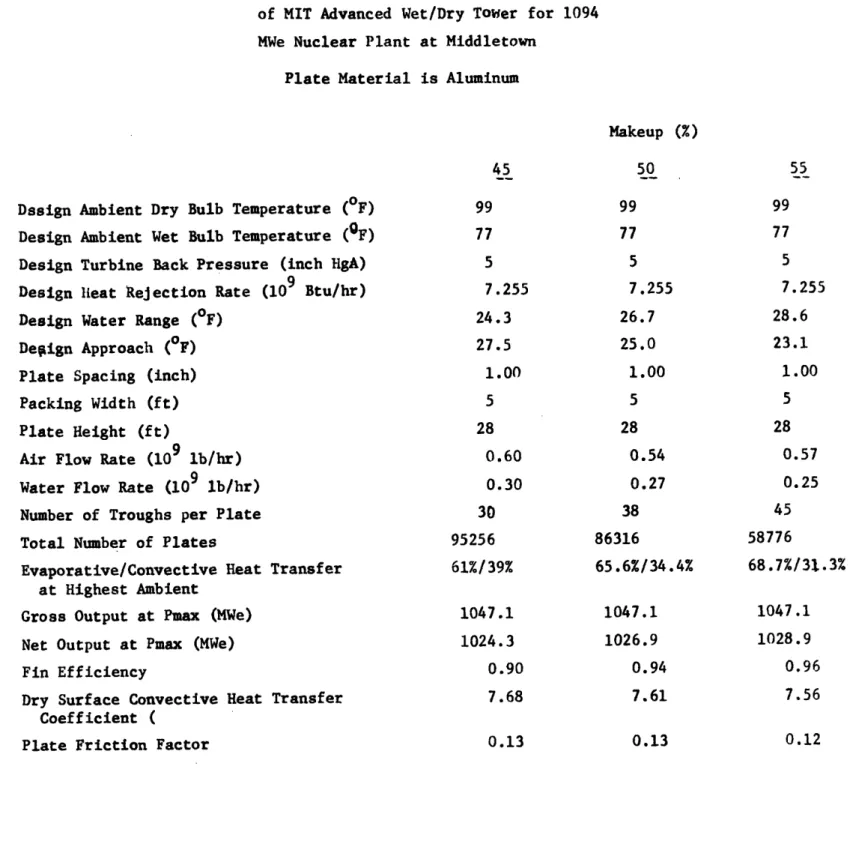
The optimum design parameters for the MIT advanced wet/dry concept using
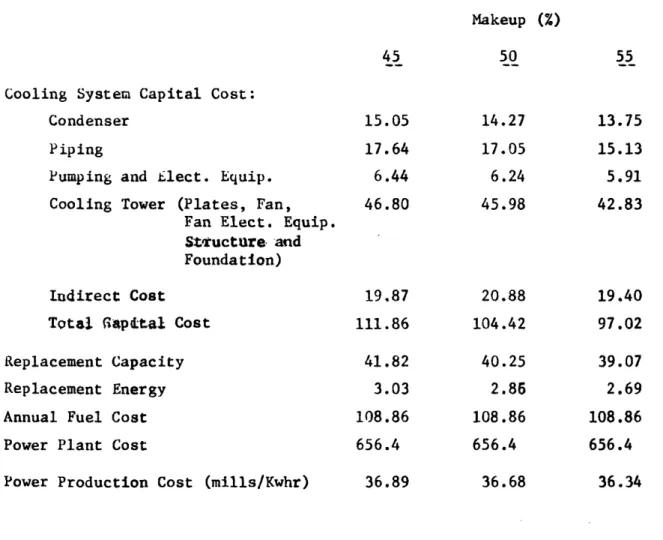
aluminum plates are shown in Table 6.1 for water makeups of 45, 50 and 55 percent. The cost breakdowns are shown in Table 6.2. Note that for these three water makeups, the incremental power production costs over zero-condenser systems are 11.6, 13.2 and 12.4 percent, respectively. Using conventional wet-dry towers, these incremental costs are 13.2, 13.0 and 12.6 percent. Therefore, for makeup between 45 and 55 percent, the cost of the MIT advanced wet/dry concept would be essentially the same as the conventional wet-dry
towers.
The heat rejection capabilities of the MIT advanced wet/dry concept are illustrated in Figs. 6.12 - 6.14, with the heat rejection rate vs. condenser saturated steam temperature for various ambient conditions. The tower heat rejection curve intersects the turbine heat rejection curves at the equilibrium condenser steam temperature. Because the turbine is allowed to operate at
the maximum allowable back pressure (5 inch gA) at the maximum ambient tempera-ture, the condenser steam temperature for all makeups is the same at the high-est ambient, namely 133.760F. Note that for a given condenser steam tempera-ture, the tower heat rejection rate increases as the ambient temperature de-creases.
Fig. 6.15 shows how the water makeup rate increases with ambient dry bulb temperature for water makeups of 45, 50 and 55 percent. For a given ambient temperature, the water evaporation rate of a larger makeup system is
-22-The power plant net capacity vs. ambient dry bulb temperature for three different water makeup cooling systems is shown in Table 6.3. The net capacity is the difference between the gross capacity and the auxili-ary power for fans and pumps.
6.2 Results of Optimization for the Moline Site
The results in the previous section are for the Middletown site using the base economic factors presented in Chapter 2. In this section, the results of optimization for the Moline site will be presented separately.
Starting with the optimum values of plate spacing, plate packing width, plate height, air flow rate and water flow rate obtained in the previous section, optimization for the Moline site were similarly performed. The optimum power production cost vs. water makeup curves were plotted in Fig. 6.16 for the fossil plant and in Fig. 6.17 for the nuclear plant. Again, we see that aluminum is significantly advantageous to galvanized steel as the plate material. Using aluminum plates, the MIT advanced wet/dry concept is more economical than conventional wet-dry towers at water makeups larger than 30% for either the fossil or the nuclear plant. Using steel, this is
40% for the fossil plant and 41% for the nuclear plant.
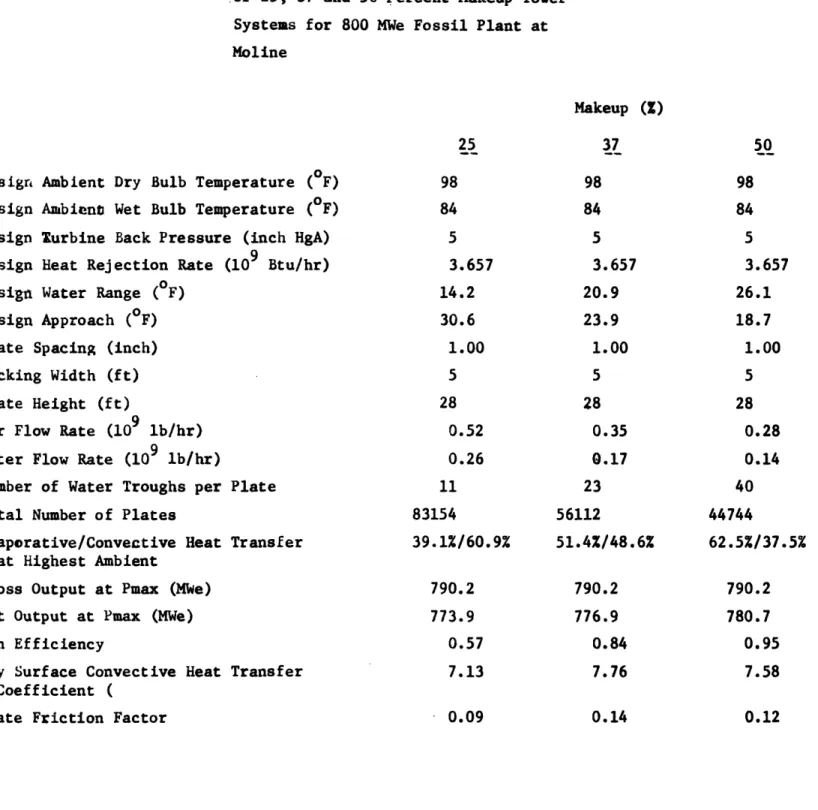
For the fossil plant, the incremental power production costs of this MIT concept using aluminum plates over zero condenser cost system are 14.8,
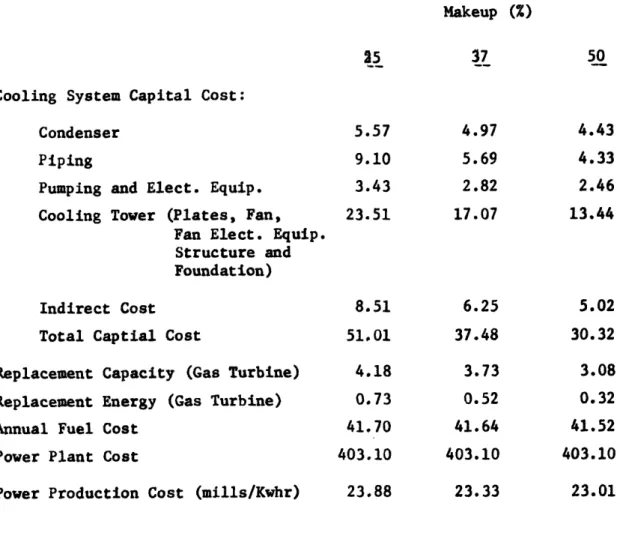
12.2 and 10.6 percent for water makeups of 25, 37 and 50 percent because the power production cost of the zero-condenser system is 20.8 mills/Kwhr. These incremental costs are 14.4, 14.0 and 13.5 percent for conventional wet-dry towers. Therefore, the savings obtained by using the MIT advanced wet/dry tower are rather significant.
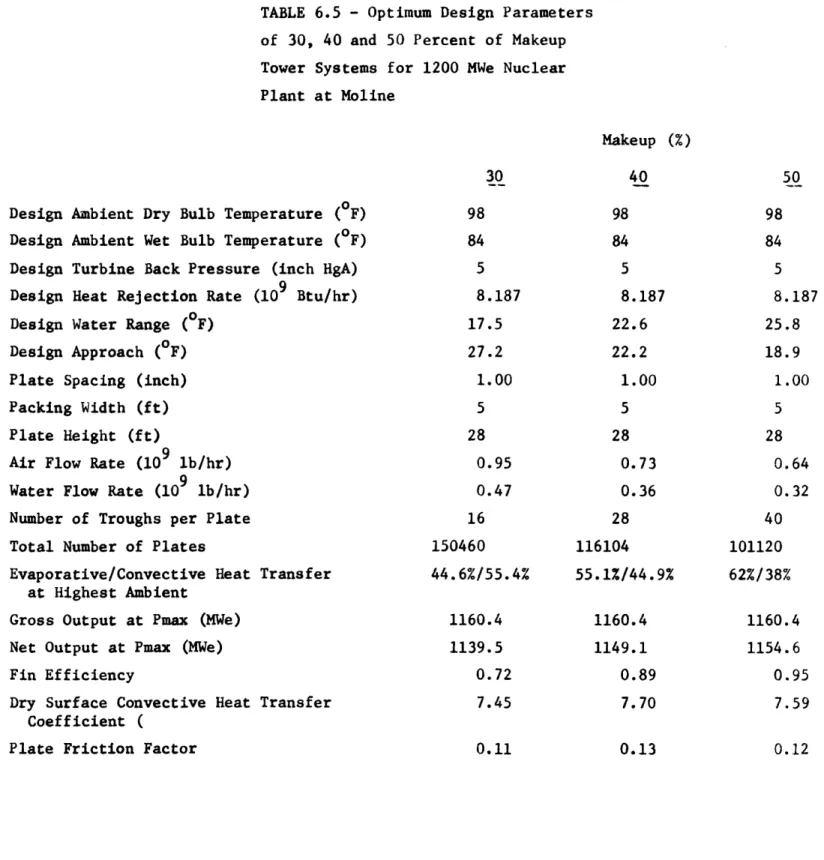
-23-For the nuclear plant, the power production cost of the zero-condenser system is 21.1 mills/Kw-hr. The incremental power production costs for water makeups of 30, 40 and 50 percent are 15.9, 12.8 and 11.5 percent, respectively. These incremental costs are 15.9, 15.2 and 14.8 percent for the conventional wet-dry towers. Again, the savings obtained by using the MIT advanced concept are significant.
The optimum design parameters for these three water makeups are shown in Table 6.4 for the fossil plant and in Table 6.5 for the nuclear plant. The cost breakdowns are given in Tables 6.6 and 6.7. The plant net capacity vs. ambient temperature i presented in Table 6.8 for the fossil plant and in Table 6.9 for the nuclear plant.
-24-TABLE 6.1 - Optimum Design Parameters of MIT Advanced Wet/Dry Tower for 1094 MWe Nuclear Plant at Middletown
Plate Material is Aluminum
Makeup (%)
45 50
Dssign Ambient Dry Bulb Temperature (OF)
Design Ambient Wet Bulb Temperature (OF)
Design Turbine Back Pressure (inch HgA) Design Heat Rejection Rate (109 Btu/hr) Design Water Range (F)
Design Approach (F)
Plate Spacing (inch) Packing Width (ft) Plate Height (ft)
Air Flow Rate (109 lb/hr) Water Flow Rate (109 lb/hr) Number of Troughs per Plate Total Number of Plates
Evaporative/Convective Heat Transfer at Highest Ambient
Gross Output at Pmax (MWe) Net Output at Pmax (MWe) Fin Efficiency
Dry Surface Convective Heat Transfer Coefficient (
Plate Friction Factor
99
77
57.255
24.3 27.5 1.00 5 28 0.60 0.30 30 95256 61%/39% 1047.1 1024.3 0.90 7.68 99 77 57.255
26.7 25.0 1.00 5 28 0.54 0.27 38 86316 65.6%/34.4% 1047.1 1026.9 0.94 7.61 55 99 77 5 7.255 28.6 23.1 1.00 5 28 0.57 0.25 45 58776 68.7%/31.3% 1047.1 1028.9 0.96 7.56 0.13 0.12 0.13
-25-TAbLE 6.2 - Cost breakdown for Optimum Design 45%, 50% and 55% Water Makeup Tower System for 1094 jiWe Nuclear Plant at Middletown
All costs are in million dollars except the power production cost
Makeup (%)
45 50 55
Cooling System Capital Cost:
Condenser 15.05 14.27 13.75
Piping 17.64 17.05 15.13
Pumping and Elect. Equip. 6.44 6.24 5.91
Cooling Tower (Plates, Fan, 46.80 45.98 42.83 Fan Elect. Equip.
Structure and Foundation)
Indirect Cost 19.87 20.88 19.40
Total apital Cost 111.86 104.42 97.02
Replacement Capacity 41.82 40.25 39.07
Replacement Energy 3.03 2.86 2.69
Annual Fuel Cost 108.86 108.86 108.86
Power Plant Cost 656.4 656.4 656.4
-26-TABLE 6.3 - Plant Net Capacity vs. Ambient Temperature for 45, 50, 55 Percent Water Makeup Tower Systems
Ambient Dry Bulb (0F) Net CapacityMWE)
Makeup (%) 45 50 55 20 1070.2 1072.8 174.8 30 1070.2 1072.8 1074.8 37 1070.2 1012.8 1074.6 42 1070.0 1072.2 1073.9 47 1069.3 1071.5 1073.2 52 1068.4 1070.7 1072.4 57 1067.5 1069.0 1071.0 62 1065.6 1066.4 1067.5 67 1061.9 1063.4 1065.4 72 1058.3 1059.7 1061.7 77 1055.8 1057.1 1057.5 82 1051.2 1051.9 1053.9 87 1044.9 1045.4 1047.5 92 1037.5 1035.7 1037.7 96 1028.0 1030.6 1032.6 98 1024.3 1026.9 1028.9
-27
TABLE 6.4 - Optimum Design Parameters of 25, 37 and 50 Percent Makeup Tower Systems for 800 MWe Fossil Plant at Moline
Makeup (Z)
50 Design Ambient Dry Bulb Temperature (F)
Design Ambient Wet Bulb Temperature
(
F) Design turbine Back Pressure (inch HgA) Design Heat Rejection Rate (109 Btu/hr) Design Water Range ( F)Design Approach ( F) Plate Spacing (inch) Packing Width (ft) Plate Height (ft)
Air Flow Rate (109 lb/hr) Water Flow Rate (109 lb/hr)
Number of Water Troughs per Plate Total Number of Plates
Evaporative/Convective Heat Transfer at Highest Ambient
Gross Output at Pmax (MWe) Net Output at Pmax (MWe) Fin Efficiency
Dry Surface Convective Heat Transfer Coefficient (
Plate Friction Factor
98 84 5 3.657 14.2 30.6 1.00 5 28 0.52 0.26 11 83154 39. 1%/60.9% 790.2 773.9 0.57 7.13 98 84 5 3.657 20.9 23.9 1.00 5 28 0.35 0.17 23 56112 51.4%/48.6% 790.2 776.9 0.84 7.76 98 84 5 3.657 26.1 18.7 1.00 5 28 0.28 0.14 40 44744 62.5%/37.5% 790.2 780.7 0.95 7.58 0.14 0.12 * 0.09
-28-TABLE 6.5 - Optimum Design Parameters of 30, 40 and 50 Percent of Makeup Tower Systems for 1200 MWe Nuclear Plant at Moline
Makeup (%)
Design Ambient Dry Bulb Temperature ( F) Design Ambient Wet Bulb Temperature (F) Design Turbine Back Pressure (inch HgA) Design Heat Rejection Rate (109 Btu/hr) Design Water Range (F)
Design Approach (F) Plate Spacing (inch) Packing Width (ft) Plate Height (ft)
Air Flow Rate (109 lb/hr) Water Flow Rate (109 lb/hr) Number of Troughs per Plate Total Number of Plates
Evaporative/Convective Heat Transfer at Highest Ambient
Gross Output at Pmax (MWe) Net Output at Pmax (MWe) Fin Efficiency
Dry Surface Convective Heat Transfer Coefficient (
Plate Friction Factor
30 98 84 5 8.187 17.5 27.2 1.00 5 28 0.95 0.47 16 150460 44.6%/55.4% 1160.4 1139.5 0.72 7.45 40 98 84 5 8.187 22.6 22.2 1.00 5 28 0.73 0.36 28 116104 55.1%/44.9% 1160.4 1149.1 0.89 7.70 50 98 84 5 8.187 25.8 18.9 1.00 5 28 0.64 0.32 40 101120 62%/38% 1160.4 1154.6 0.95 7.59 0.13 0.12 0.11
-29
TABLE 6.6 - Cost Breakdown for 25,
37 and 50
Percent Makeup Tower Systems
for 800 MWe Fossil Plant at Moline
All costs are in millon dollars except the power production cost
Makeup (%)
25
37
50
Cooling System
Capital Cost:
Condenser
5.57
4.97
4.43
Piping
9.10
5.69
4.33
Pumping and Elect. Equip.
3.43
2.82
2.46
Cooling Tower (Plates, Fan,
23.51
17.07
13.44
Fan Elect. Equip.
Structure and
Foundation)
Indirect
Cost
8.51
6.25
5.02
Total Captial Cost
51.01
37.48
30.32
Replacement Capacity (Gas Turbine)
4.18
3.73
3.08
Replacement Energy (Gas Turbine)
0.73
0.52
0.32
Annual Fuel
Cost
41.70
41.64
41.52
Power Plant Cost
403.10
403.10
403.10
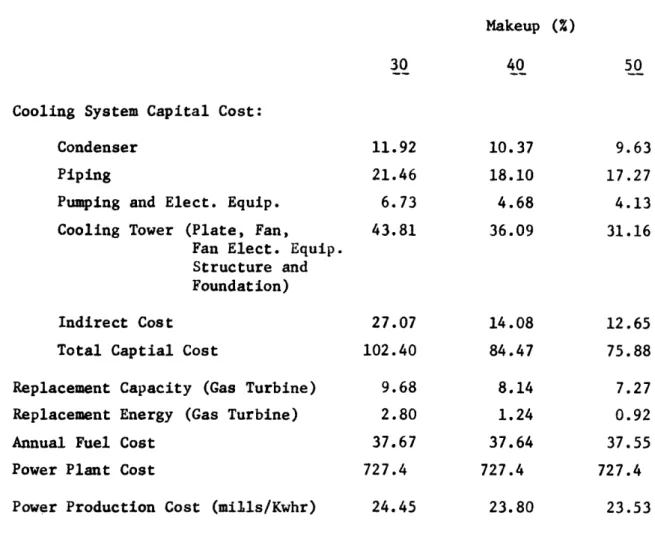
-30-TABLE 6.7 - Cost Breakdown for 30, 40 and 50 Percent Makeup Tower Systems for 1200 MWe Nuclear Plant at Moline
Makeup (%)
30 40 50
Cooling System Capital Cost:
Condenser 11.92 10.37 9.63
Piping 21.46 18.10 17.27
Pumping and Elect. Equip. 6.73 4.68 4.13
Cooling Tower (Plate, Fan, 43.81 36.09 31.16 Fan Elect. Equip.
Structure and Foundation)
Indirect Cost 27.07 14.08 12.65
Total Captial Cost 102.40 84.47 75.88
Replacement Capacity (Gas Turbine) 9.68 8.14 7.27 Replacement Energy (Gas Turbine) 2.80 1.24 0.92
Annual Fuel Cost 37.67 37.64 37.55
Power Plant Cost 727.4 727.4 727.4
-31-TABLE 6.8 - Net Capacity vs. Ambient Temperature for 25, 37 and 50 Percent Makeup Tower Systems for 800 MWE Fossil Plant at Moline
Ambient Dry Bulb (0F) Net Capacity (MWe)
Makeup (%)
25 37 50 20 800.1 802.9 807.0 30 800.1 802.9 806.6 37 800.1 802.6 806.1 42 799.8 802.2 805.7 47 799.2 801.5 805.2 52 798.7 801.1 804.5 57 798.1 800.5 803.9 62 799.0 799.0 802.4 67 795.9 798.3 801.2 72 793.8 795.6 798.9 77 790.3 791.7 795.0 82 785.8 787.6 789.8 87 782.9 784.7 788.8 92 779.5 782.4 784.4 96 775.0 777.8 781.9 98 773.8 776.7 780.7
-32-TABLE 6.9 - Net Capacity vs. Ambient Temperature for 30, 40 and 50 Percent Makeup Tower Systems for 1200 MWe Nuclear Plant at Moline
Ambient Dry Bulb Net CapcitL (MWe)
0 Temperature (OF) MaeU
(%)
30 40 50 20 1192.1 1201.7 1207.2 30 1192.1 1207.7 1207.0 37 1192.1 1201.5 1206.8 42 1192.0 1201.2 1206.3 47 1191.4 1200.6 1205.8 52 1190.9 1200.3 1205.2 57 1190.4 1199.4 1204.4 62 1188.8 1197.2 1201.8 67 1186.8 1194.1 1198.2 72 1181.2 1190.1 1194.3 77 1174.3 1182.2 1185.5 82 1165.5 1170.4 1173.5 87 1158.5 1165.7 1171.2 92 1150.7 1156.5 1162.0 96 1142.1 1151.7 1157.2 98 1139.5 1149.1 1154.6
-33-6.3 Wet Topping
From the results in sections 4.1 and 4.2, it can been seen that the cost goes up very rapidly when the place surface becomes very dry, that is,
when the number of troughs on each plate is small such that the fin efficiency becomes very small. Attempt was made to see if there would be any savings by topping this tower with a conventional evaporative tower. The results are shown in Fig. 6.17. Using wet topping there are savings obtained but still are not cost competitive with conventional wet--dry towers.
0
H
co
( UH-M/SqTIIW ) SOD NOIflnGOUId HaMOd U H Z 0 H U P4 r E-4 Lr
-Co
1) LO~ Ln rgEd4 Z 04 z H Eq zH U z (34 H H C) E-4 H z 1 0 E~ H z 3 H E~ H H U dP E-4 CZ 1 :E-9 A H W a4 1 H. 0 o .) 4 I I I I IN E4
m
I--, 0 CQ U X E4 9 :3 X X H F: 0 0 0 0 C) 0 0 LA C4 0 0 0 Cl I( H-MM/SIIW ) ILSOD NOILDnGOTd HHMOd
LA w0 U, UL) H
z
H D4 : < Z :D < i1. EA z >1 H Z H 0 E~ 4: U H U) z 0z1 H HC) i-1 H dP LO -E-4z
W Hw
4 Ln Cn D4 XDWi
N C,-0 sr Ul 0N I I Io ( 0H-M/sI ) OI o %SO Mod
( H-MX/S%'IIW ) ITSOD NOI.I.DfGOHd HMOd
m:i z H H 3 L) E-Z H Pi U U 1241 0%H o [d H C) 0Ez as
So
EA HU 4 E-1 a H Ln %D dP E-f z L% H tr o :J E-4 a LAc,3: u4 LA un c. A; Xn X V'IO r1l
( H-MX/SqIIN ) SOD NOILDflGOtd HMOd
iP H E-04 :2: z H Eq Z Pa z Ed $q H E34 Ed SoH U) Co4 H tI Lzi H O gr H
z
H ~d fC4 H rD Ct C4 E4 3 P4 H, HH E4 H z i-1 E4 :Z r~ U z E4 H H [Pz0 < u E4 aH E H O3
z
0 H 3: H C) OH-M/SI ) SO OIfOd O( UH-MM/SqqI ) SOO NOIlnGnOUd
uamoa
Lu I'D Ln Ln dP E4 Z Ed: 2 H 01 E4 Kc Ln H Lu LfA (N
. IIHI
~~~~~~~~~~~~~~~~~~~~~~~~~~~~~~~~~~~~~~l,
un u7 H dP E-rz:XrpA
H Ln :D soOl
XX
7; kD X X E4W :: H A:4 44 U3 [4 Ln LA 0 cD ' q i)( H-MX/S'IIW ) LSOO NOIlGOnIOd MOd
H -4 i1. H4 H. wz w
z-H H-4 E-4 U H1;
z
H U4 H E4 H H HoD
CV)
( HH-M/STII ) SOD NOIDflGOnod H3mod
L %o F4 UE 4 (4 ZE4 H H UE4 N z ,4 H cnH U) H£ rz t10 H N-a~ Li0 Ln UL dP H E-1z H :3 Ola C~ W u:3c,Pu cn C-o
Ln kD Ln LO cdo H p E-4 A: W Ln* 1r.4 rv Cl W H E E-4 a U
z
>4 H W H U A f) Hz
-1 C HH4 U)4 H4 H o %r 0o . .~ 1 NOD~ Cl
( H-M/SIqI ) SOD NOIDlOnOUd MOd
UL) LO w H4 P4 E-1 U) E-1 c) :4 z
~H
E-4 H UC) a4 U ) a' Nr 0 EA H U) z 0 H w H 0 .4. dP EH z H Un X 44 d E4 3 ON '. LO IC' I'D tClLn 'IO Ln LA dO H z w H w Ln P doD N N-H3 Ln LU C14 %D rtn
( H-MM/STIIW ) SOD NOTIDJCfO'd 1aMOd w E---l 04 N w W EA n) z p< O 0) Z l< U Z o
z
HE-4 H u r-) W H z H £N b-I H 0 'IO 0o r-i 6 HN 4:
R~~~~~~
Q t~~~~~~~~~~~~ CD 0 c 0M koM .( W14D~/5-I/
) ISM
)LnCId
E3d
r. Oi r4 t3 H
I
Ln Ln LA dpI
LAv
Z
Ln
Ln
FIG.
6.12
HEAT REJECrION CAPABILITY OF A 45% WIATER aKEUP HIT
ADVANCED WET/DRY TX-MER.
MIDDULqN SITE 1094 Me NET CAPACITY NUCLEAR PANT ALMINUM PLATE
MIT ADVANCED WET/DRY TOWER HEAT REJECTION Cl, TURBI REJEC'
I
80 90 100 110 I i I 120CCNDNSER SATURATED STEAM E TEMRE (DEG. F)
1.4
1.2
1.0 To0 ,-4, C30 ,-4 v HAb
0.8 0.60.4
0.2
O.70
130 _ _ _ B-I
FIG. 6.13
HEAT REJECTION CAPABILITY OF A 50% WATER MAKEUP MIT ADVANCED WET/DRY TOWER.
MIDDLETOWN SITE 1094 MWe NET CAPACITY NUCLEAR PLANT ALUMINUM PLATE
MIT ADVANCED WET/DRY TOWER HEAT REJECTION RATE
RIR
RE
I I I I I ,
90 100 110 120 130
CONDENSER SATURATED STEAM TEMPERATURE ( DEG. F) 1.4 1.2 1.0 E~ z m Ho CQ C_ 0 '-4 0 H E~z H H U P4 H EH 1 0.8 0.6 0.4 0.2 0 70 80 -_.
FIG. 6.14
HEAT REJECTION CAPABILITY OF A 55% WATER MAKEUP MIT ADVANCED WET/DRY TOWER.
MIDDLETOWN SITE 1094 MWe NET CAPACITY NUCLEAR PLANT ALUMINUM PLATE
MIT ADVANCED WET/DRY TOWER HEAT REJECTION RATE \
TU REJ
80 90 100 120
CONDENSER SATURATED STEAM TEMPERATURE (DEG. F) 1.4 1.2 0 1-q C) O E~ 'A Z O H H U H E~ pW ~3 Ew 1.0 0.8 0.6 0.4 0.2 0 70 130 _ _ _ -I I
1094 MWe NET CAOACITY NUCLEAR PLANT
AMBIENT DRY BULB TEMPERATURE (DEG. F)
MAKEUP WATER FLOW RATE VS. AMBIENT DRY BULB TEMPERATURE
FIG. 6.15 0. 0. ix: oz 09 z 0 H 0 H X v E-4 ni
g
1: p4I
O. 0. MIDDLETOWN SITE%D i
(Ni
( HH-MM/STI ) SOD NOILoncOud MOd
O CD 0 Lu a4 t4 H u) In H U U E EA: o So H za) C) C) 0 0 E-4 H z H 14 [t dP o E-Z rzi H O H 0K e. 3 a :D m W :4 0
( tn-M/SII) SOD NO fOd MO ('dH-M>I/S1IIW) SOD
NOiionCOUd
UaMOdE-f a4 H C4 3 Z So So H el U V) z >4 H H HU 0 z C) C) H 0 ra CN H HEAz rz H 3D Ofi E4 W 3 r-I
El
3 'i'N
a 0 00 q qr m A M( all-mVgm ) 1soo MIL-xIGcd Hawd
Fi 0
I
0% 0 '-4 H UW 4 14 tLr U) dP In rA IM I nII
I
I I I I i I I C14-
-34-Chapter 7
Comparison with United Engineer's Study
As mentioned in earlier chapters one major task in this study is to compare our results with those reported by United Engineers. This will be done in this chapter.
According to United Engineers [2], galvanized steel plate is preferrable to aluminum. However, the results in our study indicate that aluminum is much more economical than steel, especially for low water makeups. Since they only reported the results of optimization for steel, we are only able to com-pare these results for the MIT advanced wet/dry tower concept using steel plates.
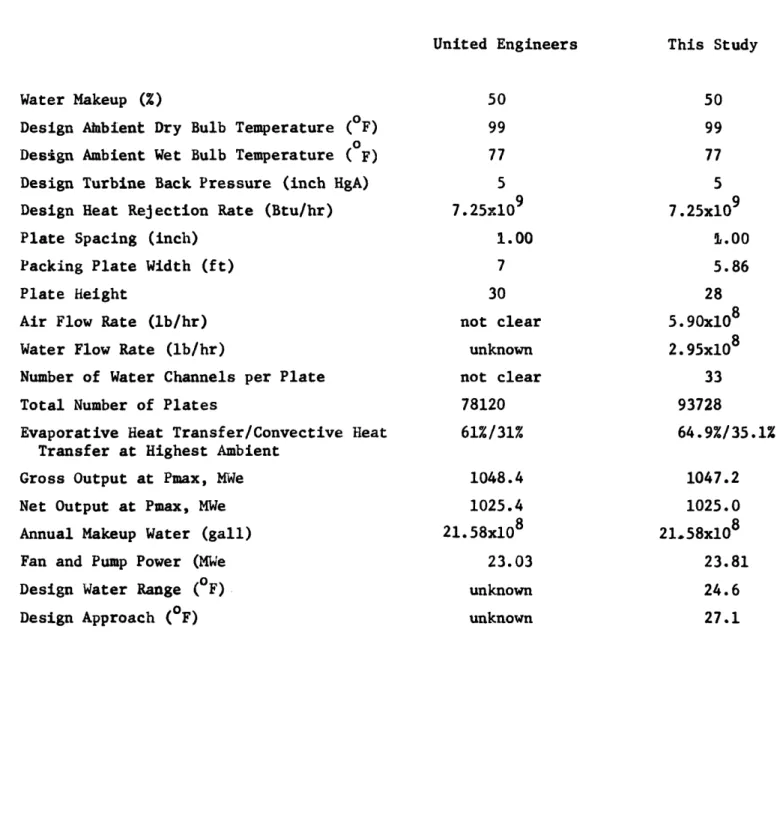
A comparison of the optimum design parameters for a 50% makeup tower
system between these two studies are shown in Table 7.1. Note that the results are rather comparable.
The cost breakdowns are compared in Table 7.2 We see that the capital costs of the condenser and cooling tower in these two studies are close.
However, the costs of the water circulating system in our study is much higher because piping design is considered in detail. On the other hand, only main circulating pipe cost was considered in United Engineers' study. Our piping cost included main pipes, tower distribution pipes, risers, as well as all pipe fittings. As a result, our power production cost is higher than United Engineers.
The penalty cost in this study is essentially the same as United Engineers.
-35-plate area, we see that it is $1.8/ft2 for United Engineers and is $2.3/ft2
-36-TABLE 7.1 - Comparison of Optimum Design Parameters between United Engineers and this study for Middletown
United Engineers This Study
Water Makeup (%)
Design Abient Dry Bulb Temperature (°F)
Design Ambient Wet Bulb Temperature
(
F) Design Turbine Back Pressure (inch HgA) Design Heat Rejection Rate (Btu/hr) Plate Spacing (inch)Packing Plate Width (ft) Plate Height
Air Flow Rate (lb/hr) Water Flow Rate (lb/hr)
Number of Water Channels per Plate Total Number of Plates
Evaporative Heat Transfer/Convective Heat Transfer at Highest Ambient
Gross Output at Pmax, HWe Net Output at Pmax, MWe Annual Makeup Water (gall)
Fan and Pump Power (MWe
Design Water Range ( F)
Design Approach ( F) 50 99 77 50 99 77 5 7.25x10⁹ 1.00 7 30 not clear unknown not clear 78120 61%/31% 1048.4 1025.4 21.58x10⁸ 23.03 unknown unknown 5 7.25x10⁹ $.00 5.86 28 5.90x10⁸ 2.95x10⁸ 33 93728 64.9%/35.1% 1047.2 1025.0 21*58xl08 23.81 24.6 27.1
-37-TABLE 7.2 - Comparison of Cost Breakdowns between United Engineers and this Study for Middletown for Steel Plate
All the costs are in million dollars except last three items
50% Water Makeup
United Engineers This Study Cooling System Capital Cost:
Condenser
Piping and Pumping
14.74 11.36 Cooling Tower.(Plates, Fan, Structure
and Foundation) Electrical Equipment
Indirect Cost
Total Cooling System Capital Cost
(Elect, Equip. not included) 33.91 4.92 16.23 81.46
(Fan & Pump)
14.94 23.77 (Elect. Equip. not included) 35.17 35.17 20.50 102.50 Penalty Cost: Capacity
Fan and Pump Power
Replacement Energy and Auxiliary Energy Make-up Water
Cooling System Maintenance Total Penalty
Incremental Power Production Cost (mills/Kwhr) Incremental Power Production Cost ()
Cooling Tower per ft2 of Plate ($/ft
)
27.36 13.82 15.69 3.20 4.24 64.32 3.80 11.7 27.,08 14.29 16.22 3.20 5.37 66.16 4.33 13.4 1.8 2.3
-38-Chapter 8
Sensitivity Study
The cooling plates in the MIT advanced wet/dry concept are not current-ly offered by manufacturers. Therefore, the cost of these plates is un-certain. In the base case study, the total plate cost is assumed to be twice the plate material cost. However, if the cost changes the results of optimi-zation would also change. Therefore, a sensitivity study of the plate cost is necessary and is given in this chapter.
The sensitivity parameters are 2 and 3 times the base case plate cost for the Moline site. The results are shown in Fig. 8.1 for .the fossil plant and in Fig. 8.2 for the nuclear plant using aluminum plates. From these two figures we can see that the MIT advanced wet/dry concept would entirely not be cost competitive with conventional wet-dry towers only when the plate cost is more than two times the base case cost. Although the plate cost is rather uncertain at this step, it is very unlikely that the plate cost would be more than twice the base cost. Hence, this MIT advanced wet/dry concept is economically rather encouraging. Of course, a lower plate cost would make this MIT concept further favorable.
-39-Chapter 9
Conclusions and Recommendations 9.1 Conclusions
This study has determined the cost of the MIT advanced wet/dry cooling concept in both fossil and nuclear power plants. Aluminum is superior to galvanized steel as the cooling plate material. In our base case study for the Middletown site 1094 MWe nuclear plant and using aluminum plates, the MIT concept is slightly more economical than conventional wet+dry towers at water makeups larger than 50%. For a 55% water makeup system, for instance, using the MIT advanced concept reduces the incremental power production cost from the conventional wet-dry towers by about 0.15 mills/Kwhr.
In our base case study at the Moline site, for an 800 MWe fossil plant the MIT advanced wet/dry tower with aluminum plates is more economical than conventional wet-dry towers when water makeup is larger than 27%. For makeups of 25, 37 and 50 percent, the optimum power production costs are 23.88, 23.33 and 23.01 mills/Kwhr, respectively, cmpared to 23.82, 23.70 and 23.6 mills/
Kwhr. for conventional wet-dry towers. When these are compared to 20.8 mills/ Kwhr. for zero-condenser system, the incremental costs for makeups of 37 and 50 percent using MIT advanced wet/dry instead of conventional wet-dry would be reduced by 13 and 21 percent, respectively.
For a 1200 MWe nuclear plant the MIT advanced wet/dry tower with aluminum plates is more economical than conventional wet-dry towers when water makeup is larger than 30%. For makeups of 30, 40 and 50 percent, the optimum power production costs are 24.45, 23.80 and 23.53 mills/Kwhr., respectively, com-pared with 24.95, 24.84 and 24.75 mills/Kwhr. for the conventional wet-dry
I I I I
r-N LO CN
CN 3 c.'J (N (.
(HH-MX/SIqIN) LISOD NOInflQOUd {HMOd
E-4 N a4 H u) to -0 >4 H E-4 H C) 0; E-1 o o H 0oE-4 U) z H 0 0
Ln
0 dP 0~ c'3 HEI 0 o C4 zi 33 m 1 XD W I i I Iw 4 U( m E-4 HII I. -CN
I /
LO (N oC L)(UH-MM/SqIw) LSOD NOIlDlQnOUd HUMOd
EA 0 N Z: z >4 HE H U < U E-H z * 4 (9 H O 0E-q H H izl H 0 o u9 o Z H 0z H H a4 0 [d E4 3 O4 :~~~~~~~~~~~~~~~~~~~~~~~~~~~~~~~~~: W Cn 4 Cm4 09 04 IIII ->
I
I
I
-40-towers. When these are compared to 21.1 mills/Kwhr for zero-condenser system, the incremental costs for makeups of 40 and 50 percent using MIT advanced wet/dry instead of conventional wet-dry would be reduced by 28 and 33 percent,
respectively.
Our sensitivity study indicates that only when the plate cost is higher than twice the base case cost would the MIT advanced tower entirely not be competitive with conventional wet-dry towers.
Soon the water shortage problem would be common in the electrical power industry. if this is the case, then the MIT advanced wet/dry cooling tower concept provides the utility a useful tool in the heat sink problem.
9.2 Recommendations
Pressure drop measurements were not experimentally done in the previous studies. In future work, this should be performed and compared ith theoretical results. Te thermal performance of the MIT advanced wet/dry tower presented in the previous chapters have to be verified by operating such a cooling mod-ule in existing plants. Finally, the cost of manufacturing the packing plates has to be ascertained before this cooling concept can be recommended for vendors. 9.3 Acknowledgement
This study is supported by the Division of Environmental Technology, U.S. Depnrtment of Energy under contract No. EY-76-S-02-4114-AOO1. It is much appreciated.
-41-References
1. Choi, M.K., "Computer Optimization of Dry and Wet/Dry Cooling Tower Systems for Large Fossil and Nuclear Power Plants", M.S. Thesis,
Department of Mechanical Engineering, M.I.T., Cambridge, MA., August 1978. 2. United Engineers, "Preliminary Report on the Cost Evaluation of the
MIT Advanced Wet/Dry Concept", 1977.
3. Hon, J.C., Ph.D. Thesis, Department of Mechanical Engineering, MI.T., Cambridge, MA., 1977.
4. Walker, D., M.S. Thesis, Department of Mechanical Engineering, M.I.T., Cambridge, MA., 1977.
5. Snyder, T., M.S. Thesis, Department of Mechanical Engineering, M.I.T., Cambridge, MA., 1977.
6. Larinoff, M.W. and Fosta, L.L., "Dry and Wet- peaking Tower Cooling Systems for Power Plant Applications", J. Engrg. Power, Trans. ASME, 98 (3),
July 1976.
7. Surface, M.O., "System Designs for Dry Cooling Towers", Power Engrg., Sept. 1977, pp. 42-45.
8. Snyder, T. et al, "Advanced Wet-Dry Cooling Tower Concept Cross-Flow Tests", Energy Lab. Report No. MIT-EL-77002, Jan. 1977, Vol I and II.
-42-Appendix A
Plate Cost
In 1979, the material cost of 0.025 inch thick aluminum plates is $0.45/ft2. The total plate cost is assumed to be twice the material cost. It is the sum of plate material, manufacture and erection costs. There-fore, it is $0.90/ft . Allowing 10% for the contractors profit and 4% for
2 2
shipping, then the total direct cost is $1.03/ft2 This is $0.81/ft for galvanized steel plates of the same thickness. To estimate these costs in years other than 1979, an inflation of 7% per year is allowed. Cost algorithms of other cooling system components are given in Ref. 1.
-43-Appendix B
Computer Pogram Lsting
The computer program with input data for the 1200 MWe nuclear plant at Moline site is given. Also, several samples of the computer ourput are presented. To execute this program for the 800 MWe fossil plant at Moline, some numerics have to be changed. In the data inputs, turbine heat rates
at lines and 6 have to be changed to 5 7777,7782,7789,7809,7841 at and 6 have to be changed to lines 5 7882,7930,7984,8012,8040
The value of boiler efficiency EFFE in line 22 has to be changed from 1.0 to 0.9. In line 24, the number representing the plant capacity 1200, has to be replaced by 800. In line 25, the numbers 0147, 600 and 200 rpresent the fuel cost, plant cost, turbine-generator cost and steam-generator cost, re-spectively, they have to be replaced by 0.90, 500, 167 and 167, respectively. In line 93 to 95, the numbers are turbine heat rates, they have to be replaced by 7770, 7770, 7770, 7770, 7777, 7783, 7789, 7800, 7809, 7825, 7841, 7862, 7882, 7907, 7930, 7955, 7984, 8012, 8040. In the main program, to determine the make-water requirement in the statement ALOSS = ALOSS x 7.48 *100./(62.4*5.9628E09) the number 5.9628rln9 has to be replaced by 2.6187EOQ because this is the all-evaporative tower annual water makeup.
In subroutine POWER P, in the statement IIEATIN = 3577.5 * 1000. * 3413., the number 3577.5 has to be replaced by 1861.8 because this is the heat source. Also, in the statement PS1 NW = 1212.4, the number 1212.4 has to be changed to 806.5 because it is the plant capacity at the turbine rating back pressure.