Comprehensive condensation flow regimes in air gap
membrane distillation: Visualization and energy efficiency
The MIT Faculty has made this article openly available. Please share how this access benefits you. Your story matters.
Citation Warsinger, David M. et al. “Comprehensive Condensation Flow Regimes in Air Gap Membrane Distillation: Visualization and Energy Efficiency.” Journal of Membrane Science 555 (June 2018): 517–528 © 2018 Elsevier B.V.
As Published http://dx.doi.org/10.1016/j.memsci.2018.03.053
Publisher Elsevier
Version Author's final manuscript
Citable link http://hdl.handle.net/1721.1/115268
Terms of Use Creative Commons Attribution-Noncommercial-Share Alike Detailed Terms http://creativecommons.org/licenses/by-nc-sa/4.0/
1
Comprehensive condensation flow regimes in air gap membrane distillation:
visualization and energy efficiency
David M. Warsinger, Jaichander Swaminathan, Lucien L. Morales, John H. Lienhard V* Rohsenow Kendall Heat Transfer Laboratory
Department of Mechanical Engineering Massachusetts Institute of Technology
77 Massachusetts Avenue, Cambridge MA 02139-4307 USA
* Corresponding Author: lienhard@mit.edu
ABSTRACT
The thermal performance of air gap membrane distillation (AGMD) desalination is dominated by heat and mass transfer across the air gap between the membrane and the condensing surface. However, little is known about the impact of condensate flow patterns in some design variations of the air gap. In this study, air gap membrane distillation experiments were performed at various inlet temperatures, varying module inclination angle, condensing surface hydrophobicity, and gap spacer design to identify the effect of each on the permeate production rate and thermal
efficiency of the system. Energy efficiency modeling was performed as well. Additionally, this study is one of the first with enhanced visualization of flow patterns within the
air gap itself, by using a transparent, high thermal conductivity sapphire plate as the condenser surface. System-level numerical modeling is used to further understand the impact of these flow regimes on overall energy efficiency, including flux and GOR. A brief review of membrane distillation condensation regimes is provided as well. For tilting the AGMD flat-plate module, permeate flux was barely influenced except at extreme positive angles (>80ᵒ), and moderate negative angles (<-30ᵒ), where condensate fell onto the membrane surface. The surface with the hydrophobic coating (for dropwise condensation) was shown to have better droplet shedding (with very small nearly spherical droplets) and fewer droplets bridging the gap. Superhydrophobic surfaces (for jumping droplet condensation) were similar, with much smaller droplet sizes. Meanwhile, the hydrophilic surface for small gap sizes (< 3 mm) often had pinned regions of water around the hydrophilic surface and plastic spacer. Overall, the various results imply that the common assumption of a laminar condensate film poorly describes the flow patterns in real systems for all tilt angles and most spacer designs. Real system performance is likely to be between that of pure AGMD and permeate gap membrane distillation (PGMD) variants, and modeling shows that better condensing in air gaps may improve system energy efficiency significantly, with strong relative advantages at high salinity.
D.M. Warsinger, J. Swaminathan, L.L. Morales, and J.H. Lienhard V, “Comprehensive condensation flow regimes in air gap membrane distillation: visualization and energy efficiency,” J. Membrane Science, 555:517-528, 1 June 2018.
2
GRAPHICAL ABSTRACT
KEY WORDS
Membrane distillation, hydrophobic surface, air gap, condensation, visualization
filmwise dropwise wicking permeate gap
Enhances mass transfer, empties gap. Variations by droplet size AGMD floods at extreme tilt angles, small gap sizes Spacers can
wick, trap fluid plugs, cause water bridging the gap Classical MD model, too simplistic Flow visualized with transparent sapphire condensing plate Condenser regimes influence efficiency
3
1. INTRODUCTION
Membrane distillation (MD) is a relatively new and rapidly developing thermally-driven desalination technology with notable advantages for small scale systems, the ability to increase recovery after reverse osmosis [1-5], and the potential for competitive energy efficiency [6-9]. MD designs resemble counter-current heat exchangers with a liquid-repelling membrane and channel on the hot fluid side [10-12], where heat transfer across the membrane ideally occurs mostly by evaporation and condensation of pure water [13-17]. Of the MD configurations developed, air gap MD (AGMD) is one of the most common and has been shown to have the greatest potential for high thermal efficiency under more saline conditions [6, 18-25].
Configurations of MD primarily differ by the design of the gap itself [26], which may be air-filled (as in the case of AGMD) [19, 27-29], flooded with permeate (permeate gap or PGMD) [30-32], or held at a partial vacuum (VMD) [33, 34].
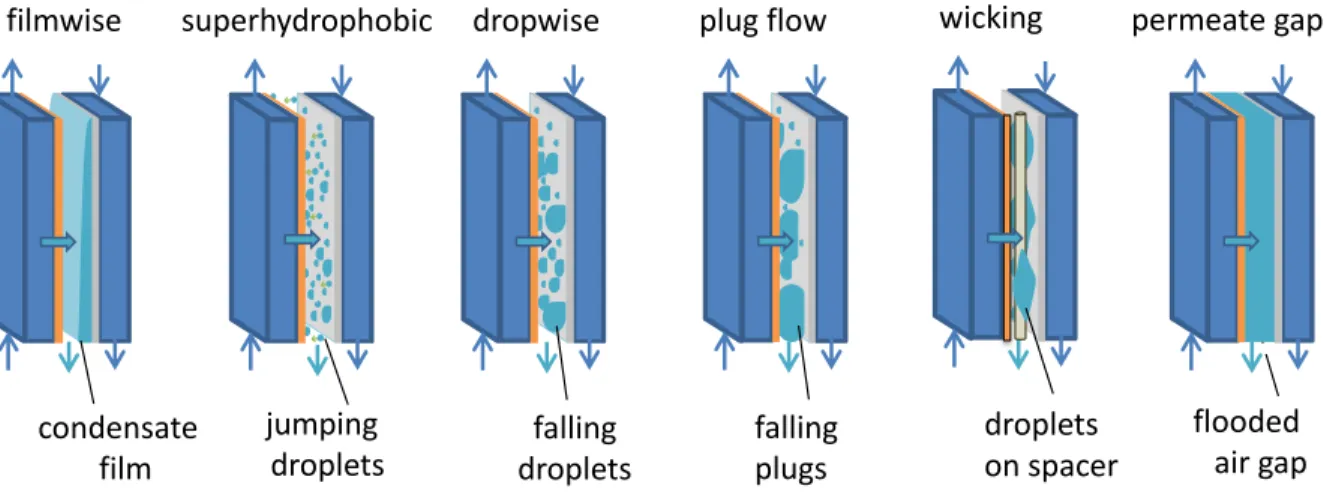
Several types of condensation may occur in AGMD systems, depending on the condensation rate, module height, air gap width, and surface hydrophobicity, among other parameters (see Figure 1[35, 36]. Standard AGMD modules are presumed to condense distillate in the laminar film regime, a well-characterized process [27, 37]. The primary factor that can change this is the presence of the spacer which can impact the water flow. The length of condenser can have a smaller impact, where regimes such as wavy laminar or turbulent films are possible [38], though unlikely for the dimensions of typical systems. Hydrophobic surfaces can induce dropwise condensation in MD, first implemented by Warsinger et. al [39, [, 35]. With superhydrophobic condensing surfaces, jumping droplets may occur [35, 40-42], with droplet sizes of ≈ 10−100 µm [35, 43]. Hydrophobic and superhydrophobic surfaces are of interest because they can increase the heat transfer coefficient of condensation by up to factors of 3-7 [44-46], while also affecting the effective thickness of the air-gap region.
Figure 1. Droplet condensation regimes seen in AGMD. In each example, the channel on the far left is the feed (dark blue), followed by the membrane (orange), air gap with condensate (aqua), condensing
plate (grey), and cooling channel for feed preheating (dark blue).
filmwise superhydrophobic dropwise plug flow permeate gap
condensate film
jumping
droplets dropletsfalling fallingplugs flooded air gap
wicking
droplets on spacer
4 A concern in AGMD systems, especially those with thin air gaps, is flooding and associated increases in heat conduction losses across the gap [37, 47]. Flooding of the air gap may occur when the permeate production rate is greater than the rate of condensate removal from the air gap, causing the gap to fill with permeate [48]. This effectively reduces the mass transfer resistance associated with the air gap, which tends to increase permeate production rate, while the heat transfer resistance of the gap is also reduced, leading to higher heat conduction loss across the membrane, larger temperature polarization in the channels, and lower thermal efficiency [49]. Since thermal bridging is unsteady and localized, it cannot be readily modelled in typical 1-D numerical models [50]. Forced flooding occurs when the permeate fills air gap, and can be caused by small gap size (where it fills to quickly to drain) or hydrostatically with a drain point above the active membrane area [51].
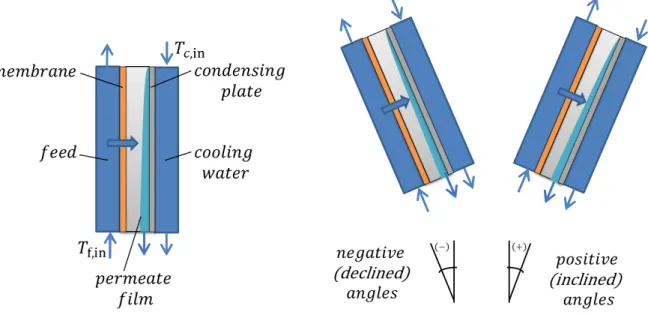
The impact of surface inclination angle has been studied in many condensation technologies [52, 53], although with little study in MD (Figure 2). While vertical (0°) module orientation has been standard in most AGMD studies[27], a horizontal module orientation has also been studied in some cases [54]. Meanwhile, spiral wound modules may have one tilt angle if situated vertically, or cycle through many angles in any other orientation. Here, we define the horizontal orientation as approaching 90° from the vertical axis as seen in Figure 2. The literature generally lacks data from other tilt angles especially for AGMD. However, for direct contact membrane distillation (DCMD), 45° tilt angles have been tested where bubbles were introduced to encourage turbulence and reduce fouling [55], and angle studies paired with biofouling have shown that tilt angles can strongly influence the fouling of buoyant oils[56]. Additionally, that study showed that orientation can influence feed-side natural convection currents to DCMD improve flux, which are a result of density variation by temperature and salinity [56] . Notably, feed-side such effects are expected to be less important in AGMD, as the gap resistance dominates, and turbulent Reynolds numbers are used here.
Figure 2. Diagram of the AGMD module and its orientation at negative and positive angles, respectively. The blue arrow on the module (left to right) indicates the direction of vaporization, diffusion through the
5 The present study examines the effects of AGMD module tilt angle, surface hydrophobicity, and air gap spacer orientation, which are mainly applicable to the flat-sheet module configuration. This study is among the first to examine the impact of spacer filaments’ orientation within the air gap, and it partially includes and expands upon our initial report of the impact of module inclination angle in AGMD [51], and our initial reports on hydrophobic condensing[35]. To the authors’ knowledge, no other work has reported the effect of the air gap spacer orientation in AGMD systems.
2. EXPERIMENTAL METHODOLOGY
To visualize the effects of varying the inclination angle of the module and reorienting the mesh spacer, several experiments were performed on an AGMD test bed with fully developed liquid flow on the feed side. The MD apparatus consists of two controlled fluid loops supplying hot saline and cold water to the angle-variable module.
2.1 Apparatus Design
The system consists of a hot saline feed that is constantly circulated through the fluid loop as it is in contact with the hydrophobic membrane, and a second fluid loop of cold water which keeps the condensation plate at a low enough temperature for water vapor to condense. The apparatus has been previously described [51] and used in other studies [57].
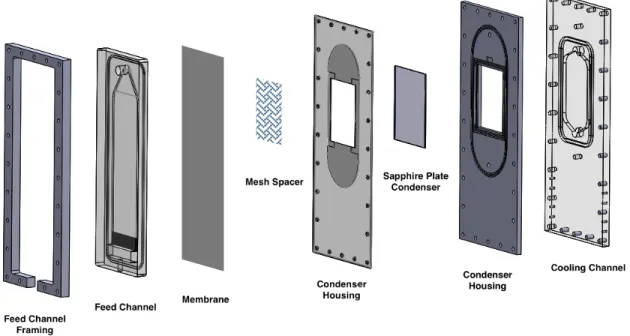
Figure 3. AGMD module plate system with novel visualization methods (exploded view). In the feed channel (left), feed flow enters a plenum at the bottom, passes through a developing flow region and then over the active area (defined by the mesh spacer), and exits through a tapered depth-expanding outlet, which ensures uniform flow. Condensing occurs on the sapphire plate, which is directly cooled by the
6
cooling channel (right) on the opposite face. For visualization, both the feed channel plates and cooling channel plates are transparent (polycarbonate), as is the condensing surface (grown sapphire crystal). To visualize, photos are taken from one channel (feed or cooling) with LED backlighting from the other.
As seen in Figure 3, the module is composed of several plates for the various channels. The feed channel and cooling channel plates are made of a polycarbonate sheet from which fluid channels have been machined[51]. A transparent sapphire condenser plate is used to enable visualization of the condensation within the air gap. The plate was grown as a solid crystal by Swiss Jewel, taking 9 months to arrive. Some data included here used a modified setup with an aluminum condensing plate (only fig. 12-15), which was previously published [51]. Modeling results were added to these figures, and all other experimental results are new.
Table 1 summarizes the dimensions[51].
Table 1. Parameters describing the AGMD module channels
Parameter Value Variation Units
Active Area 16x12 - cm
Developing Length 23 - cm
Feed Depth 4 ±0.2 mm
Effective Air Gap Depth 0.5-2.0 - mm
Feed Pressure 1.34 ±0.03 bar
Gap Pressure 1 ±0.01 bar
Feed Pressure 1.34 ±0.5 bar
Coolant Temperature 20-55 ±0.75 °C
Permeate Flux 150-250 ±5 L/m2day
Sapphire window 18.82x14.08x0.05 ±0.01 cm
The depth of the air gap is changed by changing the spacers that hold the membrane away from the condensation plate. The measured dimensions for the thicknesses and approximate hole size of the three different meshes considered are shown in Table 2.
Table 2. Parameters describing the different woven mesh spacers used and combined to create an air gap by preventing the membrane to contact the condensation plate [43].
Mesh Thickness
(mm) Opening Size (mm)
Fine mesh (perforated sheet) 0.54 ± 0.10 1.4 x 2.0
Rectangular woven mesh 1.24 ± 0.10 2.5 x 7.5
Square woven mesh 1.54 ± 0.10 3.3 x 3.3
Table 3 shows which spacers were used in the various experiments. In the cases where multiple mesh spacers were used, they are stacked on top of one another and as such, respective thicknesses and errors of the mesh spacers are superimposed.
Table 3. Parameters describing the set of experiments and the respective mesh spacer(s) used.
7
Gap (mm)
Varied angle with fine mesh Fine mesh, rectangular mesh 1.78 ± 0.20
Varied angle without fine mesh Rectangular mesh 1.24 ± 0.10
Square mesh (diagonal) Square mesh 1.54 ± 0.10
Square mesh (vertical) Square mesh 1.54 ± 0.10
A fine mesh stacked on top of the coarser spacer helped minimize deflection of the membrane from hydrostatic pressure (Figures 13-16), but impaired camera focus, so was not included in all trials (Figures 8-12). Corresponding high deflections from the membrane resulted in smaller effective air gap thicknesses, which were calculated by matching process measurements and flux with the model. Thicknesses are reported in Table 5.
Hydrophobic Immobilon-PSQ membranes made of Polyvinylidene Fluoride (PVDF) are used in the experiments [10]. Table 4 shows the parameters for the membrane that are relevant to numerical modeling [51].
Table 4. Parameters for the Immobilon-PSQ membrane [51].
Membrane parameter Value
Average Pore Size 0.2 µm
Max Pore Size 0.71 µm
Thickness 0.2 mm
Porosity 79.2%
Membrane Coefficient, B 1.6 x 10⁷ s/m
The condensing plate is made of sapphire, which was selected for its high thermal conductivity and relatively high optical transparency. This plate was grown as a single crystal by the Swiss Jewel Company. Sapphire (single crystal Al2O3) has a thermal conductivity of ~32 W/(m-K) at 25°C, which is about 30-70 times higher than most transparent glass or plastic alternatives. The sample was slightly optically diffusive as a result of imperfections, but enough light passes through to illuminate and capture images from the opposing, membrane side. As seen in Figure 3, the sapphire plate is sealed by a series of O-Rings between two polycarbonate plates, allowing it to have one side exposed to the air gap and the other exposed to the circulating cold water. Images were captured using a Nikon Coolpix P530 with the lens pressed against the hot feed side, where backlighting through the sapphire allowed visualization through the membrane. An iPhone 6 flashlight was used for illumination, positioned ~4 cm behind the sapphire side of the module. Additional images captured from the sapphire plate side while illuminating from the membrane side can be found in Morales [58].
3.1 Varied Module Orientation
The experimental permeate flux rate under varying tilt angle, adjusting for small differences in temperature (0.3-1.5°C) between tests, are now presented. For simplicity of comparison, flux results are normalized for comparison to an un-tilted module:
normalized flux = !"#$(&/0°,(!"#$(&,()/+,-!.(&/0°,()
8 where 𝑇0 is the temperature level in the vertical (𝜃 = 0°) test.
3.2 Varying Mesh Spacer Orientation
When measuring the effect of different gap spacer orientations, tests were conducted at multiple temperature levels keeping ΔT between the hot and cold channels constant. The temperatures measured at the feed and cold channel inlets are controlled by adjusting the tank set-point temperatures to account for heat losses in various parts of the system. While attempting to maintain a constant temperature difference of 15° C between the hot and cold streams, the maximum deviation from this value was 1°C. The model is used to account for these variations. All experiments measuring the effect of varied mesh spacer orientation were conducted with the module angle at 0°, or in the vertical orientation.
3.3 Uncertainty Quantification
An uncertainty analysis was executed using the EES code which modeled the heat and mass flow of the system. The largest source of uncertainty were temperature fluctuations. The feed side’s temperature has a nonlinear impact on vapor flux, causing variations to be significant, but the cold side was also important as it varied more in the experimental system. The uncertainty in temperature was conservatively taken as the standard deviation in temperature during the experiment plus the maximum measurement uncertainty of the thermistors (±0.2°C). Uncertainty from permeate flow variations over time was also an important factor. The uncertainty in permeate production rate is related to the uncertainty in mass measurement and the time over which permeate mass is collected. The uncertainty in time is taken as 10 seconds (twice the data collection rate), whereas the total duration of the tests was about 10-15 minutes after steady state is reached. An additional uncertainty for mass collection over this time interval was added as ±0.2 g, to account for evaporation. Overall, uncertainty assumptions were conservative and erred towards larger estimates. Still, the uncertainty remained low enough after these assumptions to make consistent conclusions. Maximum uncertainty in permeate flux reached was as high as ±5%, although most points were within ±2% [51].
4. NUMERICAL MODELING
4.1 Modeling Methods and Feed Channel Modeling
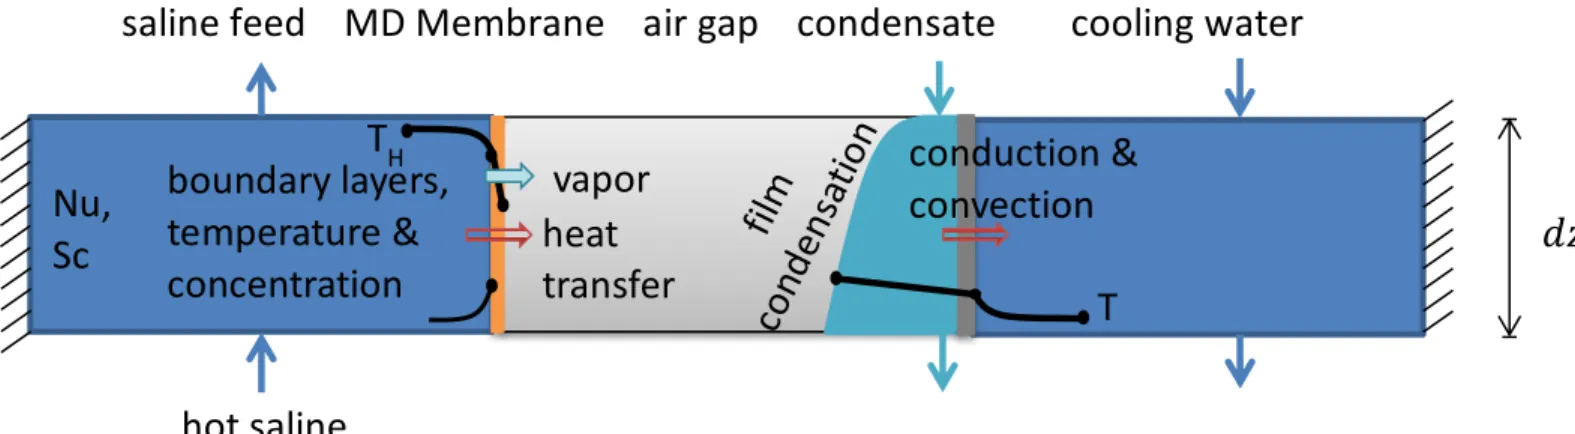
Mathematical modeling of AGMD allows for comparison to classical filmwise condensation and investigating the impact of air gap transport on full scale systems. Modelling can achieve reasonable accuracy in modeling the simpler flow regimes. The theoretical permeate production of the AGMD system with respect to a changing module angle is estimated using numerical modeling methods implemented using Engineering Equation Solver (EES) [59], an iterative equation solver with built-in thermodynamic functions. A model was created which calculates the simultaneous heat and mass transfer in a series of computational cells [30], as seen in Figure 4. The model incorporates convection in the feed and cold channels, conduction and vapor
9 transport across the membrane and the air gap, and film condensation on the condensing surface. The model has been explained in detail and validated previously[15, 51], so only key equations for interpreting results are discussed here.
Figure 4. A differential control volume as a computational cell for the AGMD model
The condensation film thickness increases as pure water condenses onto the film. The rate of vapor production is governed by the vapor pressure difference across the membrane as
𝐽 = 𝐵 × (𝑃<=#,>,+− 𝑃<=#,@,+) (1) where J is the mass flow or permeate flux, B is the membrane permeability, 𝑃<=# is the vapor pressure, the subscripts “f,m” represent the feed side of the membrane, and “g,m” represent the gap side of the membrane.
4.2 Air Gap and Condensing Channel Modeling
Proper modeling of the air gap is especially important as the air gap accounts for the most significant transport resistance that affects the performance of the AGMD module, and it is the focus of this study. Varying the tilt angle of the module can affect the process physically. Following other numerical models in the literature, the mesh spacer is not explicitly modeled, but instead a free air gap is modeled to provide a comparison to classical filmwise condensation and permeate gap MD [21].
During operation, part of the membrane is deflected as a result of hydrostatic pressure in the channel and it tends to press itself into the gaps of the mesh, thus reducing the effective air gap thickness. The membrane is considered to be flat for simplicity of modeling. An effective depth of the air gap is determined, by fitting against experimental data, at a value lower than the design value to account for the membrane deflection. Table 5 shows the effective air gaps for each experiment as compared to the thickness of the mesh spacers. Note that the “Square Mesh” experiments have a lower effective air gap than the “Varied Angle without Fine Mesh” experiment despite being a thicker mesh; this is likely to be a result of the angle experiments
𝑑𝑧
saline feed MD Membrane air gap condensate cooling water
boundary layers,
temperature &
concentration
Nu,
Sc
vapor
diffusion
heat
transfer
hot saline
feed
fil
m
co
nd
en
sa
tio
n conduction &
convection
T
T
H10 being run at a feed inlet pressure of 6.9 kPa while the experiments with “Square Mesh” for woven mesh orientation were run at a feed inlet pressure of 34.5 kPa.
Table 5: A comparison of the nominal thickness of the spacers and the effective air gaps that are a result of fitting the model
Experiment Run Nominal Air Gap (mm) Effective Air Gap (mm)
Varied Angle with Fine Mesh 1.78 ± 0.20 1.20 Varied Angle without Fine Mesh 1.24 ± 0.10 0.98 Square Mesh (Diagonal) 1.54 ± 0.10 0.85 Square Mesh (Vertical) 1.54 ± 0.10 0.85
The vapor flux that permeates through the membrane diffuses through the air gap and reaches the condensation plate to condense onto the film. The air gap that it diffuses through is less than 1 mm in depth and as a result, any convection effects in the air can be also considered to be negligible [51].
The thickness of the air gap decreases as condensate film grows in thickness and displaces the air more. The growing film thickness can be characterized by
𝛿i+13 = 𝛿i3+𝑔 cos 𝜃3 𝐽i 𝑑𝐴 𝜈O𝜌 f,i
f−𝜌gR𝑤
(2)
where δ is the condensation film thickness, θ is the module tilt angle (θ=0 vertical), Ji is the aforementioned flux through the membrane, dA is a differential unit of area, vf, is the fluid kinematic viscosity, g is the gravitational constant, ρf is the liquid water density, ρg is the gas density of the combined air and water vapor, and w is the width of the condensation film [51]. The subscripts, i, represents the ith computational cell, f, represents the condensate, and g, represents the vapor phase.
Equation 2 indicates that for the same film thickness at the top of the condensing surface (close to zero), a significantly thicker film is formed only at very large tilt angles (θ). At mild angles, significant changes in film thickness or flux are not expected based on this model, and could be caused by forced flooding of the gap, thermal bridging at negative (declined angles) where water may fall onto the membrane, or by impacts of the spacer.
The condensate film thickness δ directly impacts the mass transport in the module [60], increasing flux at higher thickness, which is evident from the following physics. The vapor flux through the membrane varies with respect to the vapor fraction at the membrane interface on the air gap side. The vapor then diffuses to the water condensate interface on the other side of the air gap. This diffusion is governed by binary mass diffusion through the relationship shown in Equation 3, as described by Lienhard and Lienhard [61],
𝐽m 𝑀w= 𝑐a𝐷w−a 𝑑gap−𝛿 𝑙𝑛]1 + 𝑥i−𝑥a,m 𝑥a,m−1_ (3)
11 where Jm is the flux through the membrane, Mw is the molecular weight of water, ca is the concentration of air in the air gap, Dw-a is the diffusivity of water vapor in air, dgap is depth of the air gap, xi is the water mole fraction at the condensing liquid interface, and xa,m is the water mole fraction at the vapor-membrane interface [51].
The conduction resistance of heat through the permeate film is given by
𝑄abcd,e = fghij,h
kh ⋅ 𝐴m𝑇e,e− 𝑇nopp,eq (4) where Qcond,i is the heat conduction to the air gap, A is the area, kfilm is the thermal conductivity of the film, and the temperatures represent the temperature difference across the condensation film. As the conductivity of water is higher than that of air, the total conduction resistance of the gap decreases with a thicker film, enhancing both conductive heat transfer and evaporative heat transfer.
An important parameter for understanding the performance of membrane distillation is the thermal efficiency, 𝜂st, which describes what fraction of heat input to the system is used for desalination,
𝜂st =
u̇wxyz
u̇wxyz{u̇|}~•{u̇i}€€ (5)
where 𝑄̇•‚oƒis the rate of heat transfer from vapor condensation, 𝑄̇abcd is the heat transfer rate across the gap, and 𝑄̇pb„„ represents other heat transfer losses. Note that this quantification judges membrane performance, not system efficiency, and is not comparable to efficiency metrics used for other technologies, such as the second law efficiency for RO [62-65]. Another relevant parameter is the overall energy efficiency or GOR (gained output ratio), which compares the enthalpy of simply evaporating water to the heat input 𝑄̇… actually used:
GOR =‰̇zŠg‹((|)
u̇Œ (6)
Where 𝑚̇ƒis the mass flow rate of permeate, ℎ•• is the enthalpy of evaporation of water, and 𝑇0 is the environmental temperature.
Equations 2, 3, 4, and 5 paint a clear picture on the impacts of increasing the film thickness, which is a result of high tilt angles, and can be impacted by spacer design. Thicker films will decrease 𝑑@=#− 𝛿, which reduces the transfer resistance and which can increase flux in some cases. However, these thicker films will also increase 𝑄̇abcd, which will reduce 𝜂st in many cases. This tradeoff between permeate flux and efficiency dominates design decisions for MD. These equations in context in series with the other (smaller) resistances to heat transfer and full model are explained in detail in previous work [21].
12
5.1 Modeling Inputs
The numerical model takes the following inputs from the experimental setup: geometry of each of the channels including the respective lengths, widths, and depths; the flow rate and temperature of the hot feed channel at module inlet; and the flow rate and temperature of the coolant at the module inlet [51, 66].
5.2 Effect of Module Tilt Angle
The theoretical effect of inclination of the AGMD module on permeate flux is shown in Figure 5. The permeate production rate is given as the ratio of the flux when the module is at a tilt angle θ, to the flux when the module is in the vertical orientation. Thus, by this normalization, normalized permeate rate at θ = 0 is 1. The permeate production rate is plotted against the inclination angle. Referring to Equation 1, with all other conditions the same, the model predicts that the thickness of the condensate film is affected by the tilt angle through an inverse cube root relation to cos θ. A thicker film reduces 𝑑@=#− 𝛿 (Equation 2), thus increasing flux. The model predicts that the effect is independent of whether the tilt angle is positive or negative since cosθ is symmetric about θ = 0° [51].
The model predicts mild flux impacts from tilt angle, up to 4% at an angle of 85°. Figure 5 shows that this effect is more pronounced when for Tc=12.5, Th=50 °C where the distillate flux,
J, is higher, and the permeate slightly more viscous due to the colder temperature.
Figure 5. Effect of module tilt angle on filmwise AGMD flux as predicted the model [51].
5.3 Impact on Efficiency
0.95 0.97 0.99 1.01 1.03 1.05 -90 -60 -30 0 30 60 90 N o rm al ize d p er m ea te r at e [-] Tilt angle θ [o]Hot inlet T=60°C, Cold inlet T=40°C Hot inlet T=50°C, Cold inlet T=12.5°C
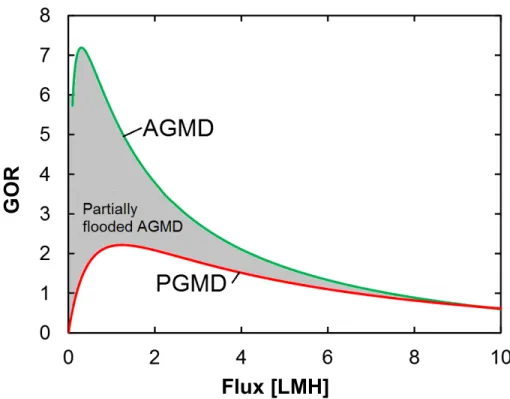
13 The trends of tilt angle and varying condensing surface hydrophobicity influence the degree of fluid held inside the gap. Therefore, these systems tend to behave as air gap MD when well-drained and permeate gap MD when flooded. When partially flooded, these systems perform somewhere in between these two. Therefore, PGMD and AGMD set bounds for the performance for MD systems where impacts on the gap may reduce or increase flooding. The overall
efficiency is best indicated by GOR [67], while the capital expenses it competes with can be described by flux, which is linked to membrane area and thus system size. This comparison of flux versus GOR for PGMD and AGMD is shown in Figure 6 and Figure 7, where these models are described in other work [23].
Figure 6. Permeate flux versus GOR tradeoff for air gap membrane distillation (AGMD) compared to a flooded permeate gap (PGMD) system at high salinity. Unflooded AGMD systems perform significantly better at low flux. Assumes a feed salinity of 175 g/kg NaCl, dgap = dchannel = 1 mm, dmembrane = 0.2 mm,
B0=B×dm=1.5x10⁻¹⁰ s, kmembrane = 0.2 W/mK, Tf = 85°C, Tc = 25°C [23].
The performance of MD can be compared in GOR (energy efficiency) and permeate flux axes, which are inversely linked to the energy costs and membrane area costs respectively [23]. As seen in Figure 6, at high salinity, AGMD significantly outperforms PGMD. When AGMD systems cannot drain permeate fast enough, they flood and become PGMD. With mild flooding and some air still in the gap, performance lies between the two. At lower salinities, the benefit of AGMD is smaller.
Flux [LMH]
GO
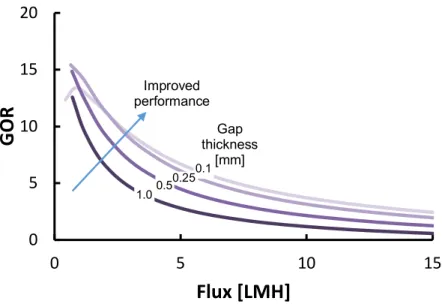
14 An efficiency benefit of systems with better drainage of permeate (possibly by hydrophobic condensing surfaces) is that AGMD can be attained under new operating conditions. This is especially beneficial for very small gap sizes, as these gaps in real systems are often larger than optimal for the express purpose of avoiding flooding and thus becoming PGMD systems. As shown in Figure 7, thinner gap sizes can result in much improved efficiency, but these sizes are below those feasible for current filmwise AGMD systems, and below the natural sizes of large falling water droplets (which are limited by the capillary length) .
Figure 7. Impact of gap thickness on efficiency and flux in AGMD at seawater salinity. Assumes Cf = 35
g/kg, with other conditions as in Figure 6. Gap sizes of 1.0 mm are common in real systems, while <0.5 mm is a theoretical possibility with better water removal.
These results indicate that it is highly desirable for membrane distillation to improve permeate removal from the system, and hydrophobic surface design provides promise for doing so.
0 5 10 15 20 0 5 10 15
GO
R
Flux [LMH]
Improved performance 0.1 1.0 0.5 0.25 Gap thickness [mm]15
6. EXPERIMENTAL RESULTS AND DISCUSSION
6.1 Effect of multilayer spacers
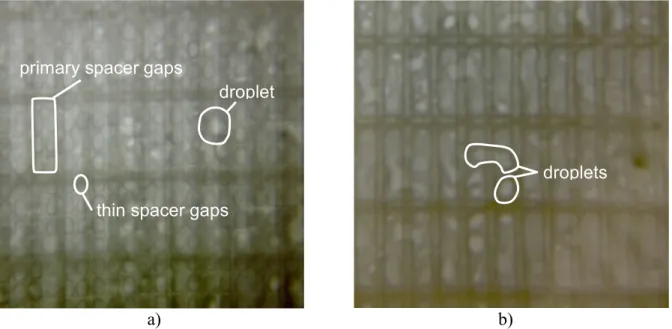
Figure 8 shows a side-by-side comparison image of the condensation visualized through the clear
sapphire condensing surface. Droplets were easier to visualize without the additional spacer in case a). Interestingly, droplet positioning seemed to be dictated by the large spacer on the condensing plate, with little influence from the smaller one.
a) b)
Figure 8. Side by side comparison of AGMD experiments where Tf,in » 50°C, Tc,in » 20°C: a) with the
rectangular and fine mesh spacers; b) with only the rectangular spacer
6.2 Impact of hydrophobic condensing
Clear hydrophobic and hydrophilic films on top of the sapphire plate were used to examine the impact of condensing surface hydrophobicity (Fig. 8a and 8b). The clear hydrophobic film consisted of a relatively hydrophobic plastic, PVDF (McMaster part number 8675K21, 0.003” thick) coated with the highly hydrophobic and optically clear compound PPFDA (poly-1H,1H,2H,2H-perfluorodecyl acrylate), prepared using iCVD (initiated chemical vapor deposition). The hydrophilic film was composed of polyester, a relatively hydrophilic plastic. The thicknesses were chosen to match their respective conduction resistances.
thin spacer gaps primary spacer gaps
droplet
16
Figure 9. Comparison of hydrophobic and hydrophilic condensing
As seen in Figure 9, the difference between the hydrophilic and hydrophobic film condensation rates was small. This is in contrast to past studies on far more hydrophobic surfaces for jumping droplets (<160°), where the hydrophobic trial exhibited much higher flux [35].
While it is possible that mild film hydrophobicity has a minimal impact on flux, it could also be that the contributions that act to impede versus enable higher flux are similar in magnitude, and significantly cancel out for the conditions tested. First, flux is enhanced by the higher heat transfer coefficients of hydrophobic condensing, which reduce temperature gradients across droplets and cause better mixing and theoretically improved MD thermal efficiency. On the other hand, droplets exit the system more readily, so flooding, plug-flow, and droplets bridging across the gap are all reduced. In contrast, at higher feed salinity, where maintaining a large gap thickness is important to prevent significant heat conduction losses (see Sec. 5.3), the positive effects of the hydrophobic surface are likely to dominate.
0 0.02 0.04 0.06 0.08 0.1 40 50 60 70
Permeate Production Rate [g/s]
Hot Inlet Temperature [°C ]
With Hydrophobic Film
17
Figure 10. Hydrophobic surface picture with temperature conditions at TH = 70°C, TC= 20°C showing the small droplets found on the surface.
As seen in Fig. 10, for the hydrophobic membrane much less water is in the gap, even with extremely high driving temperature differences. This means that air gap operation (as opposed to flooded gap) can be better maintained with condensing surface hydrophobicity. Practically, this may mean that the air gap depth can be decreased with hydrophobic surfaces, improving system performance, especially regarding increasing flux while maintaining good thermal efficiency η for high feed salinity. Notably, rough hydrophobic or superhydrophobic condensing surfaces may experience droplet pinning and subsequent flooding [35] (including for conditions seen in this trial). This means that for very high permeate flux, smooth hydrophobic surfaces may be superior to rough superhydrophobic ones for maintaining air-gap operation. It may be possible that hydrophilic spacers can more effectively help wick away water in cases with hydrophobic condensing.
18
Figure 11. Superhydrophobic condensing surface picture, visualized by melting portions of the membrane to consolidate pores. Tiny droplets are visible, ranging from 10 µm to 100 µm, and
camera focus can be a challenge. This method allows for visualization on non-transparent condensing surfaces, such as those for superhydrophobic jumping droplet surfaces, whose rough coatings (necessary for superhydrophobicity) preventing seeing through the condensing surface.
As seen in Figure 12, alternative visualization methods, by making the membrane itself transparent, can be used when the condensing surface is not transparent. Here, small
superhydrophobic droplets are visible, the smallest ones are capable of superhydrophobic droplet ejection. These surfaces, and their performance enhancement, have been studied previously by the authors. This method to make a small portion of the membrane transparent to enable visualization of the condensation regime involved using a metal surface at a controlled temperature, 2-5ᵒC above the melting temperature of the PVDF substrate, to consolidate the pores, thereby eliminating light scattering. The method is membrane specific, risks membrane damage, results in membrane property variations, and will reduce local permeate flux, thus giving an imperfect view of condensation phenomena. However, it is useful for determining the flow regime by creating very small non-leaking windows, and checking for flooding.
6.2 Impact of tilt angle on permeate flux
The experimental data shows a minimal effect of small module tilt angles until angles were severe, at which point flux increased dramatically. This finding is supported by the theoretical analysis of the relationship between the mass transfer resistance in the air gap, film thickness δ, and most importantly, permeate flux.
droplets 1 cm White MD membrane Spacer mesh
19 As seen in these visualization images, there is very often some water that is stagnant at the
junctions of where the spacers touch the condensing plate, even at 0° tilt angle.
a) b) c)
Figure 12. Side by side comparison of angle experiments where Tf,in » 50°C, Tc,in » 20°C at the following
angles: a) 0° b) 45° c) 85°
Figure 12 shows a comparison of three different angles. Droplets are visible in the first two images but towards the higher angle, some unforced flooding is observed as evident by a majority of the air gap being filled with water, with some air bubbles present as well. Figure 12c, the nearly horizontal case, shows very clear water bridging along all the spacer filaments, for both horizontal and vertical ones. Also, the bridged water seems to extend out away from the filaments themselves, so that the effective region inside the rectangle without water bridging is smaller – all of this can lead to a higher flux, but not as high as for a fully flooded gap. Figure 12 parts a and b still have significant water bridging, with comparable amounts but large variations at different regions. The very high ΔT (30°C) causes much higher flux and flooding, while efficiently designed systems would have a 5-10°C ΔT. As shown later, systems with low flux (e.g., Figure 18) have relatively minimal flooding or trapped droplets.
Additional experiments were run previously by Warsinger et al., which were limited to filmwise tilt angle tests [51]. These figures are given below (Figures 13-16), but now with modeling for both the predicted filmwise condensation rate (in orange) and the prediction for a fully flooded gap (dotted blue) [51]. The normalized permeate ratio is calculated as the permeate production rate for a given tilt angle after having been processed for temperature variations, divided by the permeate production rate a 0° tilt angle. Error bar calculations are explained in section 3.3: Uncertainty quantification.
droplets
droplets water along spacer filaments
20
Figure 13. Effect of module tilt angle on permeate production: Tf,in » 50°C, Tc,in » 12.5°C [51].
Figure 14. Effect of module tilt angle on permeate production: a) Tf,in » 60°C, Tc,in » 40°C [51]. Modeling
results for filmwise condensation (orange) and a fully flooded gap (dotted blue) are shown.
As seen in Fig. 13, the experimental data show a significant increase in permeate flux at 85°; this jump is attributed to air gap flooding [51]. Notably, data from the angle trials (Figures 13-16) were included in previous work [51], without the modeling component.
Figure 14, for a trial run at a significantly higher temperature than in Figure 13, shows that tilt angle played a relatively small role in positive and moderate negative module tilt angles. However, the permeate flux increased significantly at high negative angles. This increase in flux may be suggestive of thermal bridging at relatively small negative tilt angles such as −30°, rather
0.7
0.9
1.1
1.3
1.5
1.7
1.9
-90 -60 -30 0 30 60 90 No rma lize d pe rme ate ra te [ -] Tilt angle θ [o]Flooded gap MD (Model) Air gap MD (Experiment) Air gap MD (Model approx)
0.4 0.6 0.8 1 1.2 1.4 1.6 -90 -60 -30 0 30 60 90 No rma lize d pe rme ate ra te [ -] Tilt Angle θ [o]
Flooded gap MD (Model) Air gap MD (Experiment) Air gap MD (Model approx)
21 than flooding, and a tendency to flood, as the tilt angle becomes more negative and approaches −60° [51].
Since observations showed that thermal bridging and other effects of module tilt angle changes, such as flooding, are effectively absent at low tilt angles, subsequent trials reduced the number of angles tested in the lower angle range [51].
Figure 15. Effect of module tilt angle on permeate production: Smaller air gap. Tf,in » 60°C, Tc,in » 40°C
[51].
To further explore the hypotheses of thermal bridging and flooding, more trials were performed by Warsinger et al. for a smaller effective air gap thickness of two-thirds the original thickness
[51]. This was accomplished by using only one mesh spacer instead of two (Fig. 15). While the absolute value of the permeate flux increased over previous trials, due to the decreasing of the effective air gap and the corresponding decrease in diffusion length for vapor, the relative effect of module inclination on permeate flux remains similar. At small module tilt angles and large positive angles, the flux stays constant, but at −60°, permeate flux increases significantly, and fits within the results predicted by a fully flooded gap. In some cases, the effect of thermal bridging can be detected at angles as low as −30°. These observations suggest that changes in the effective air gap thickness do not have a significant impact on the stimulation of thermal bridging effects at various tilt angles in AGMD. Notably, the higher temperature trial experienced relatively significant thermal bridging starting at only −30°, indicating that the risk for thermal bridging has a temperature dependence [51].
0.7
0.8
0.9
1
1.1
1.2
1.3
-90 -60 -30 0 30 60 90 No rma lize d pe rme ate ra te [ -] Tilt angle θ [o]Flooded gap MD (Model) Air gap MD (Experiment) Air gap MD (Model approx)
22
Figure 16. Effect of module tilt angle on permeate production: Comparison with modified experiment where hydrostatically forced flooding is avoided. Tf,in » 50°C, Tc,in » 20°C [51].
When further care is taken to avoid forced flooding of the air gap at the negative inclination angles, the effect of water bridging due to the film falling onto the membrane can be isolated (Fig. 15). At low negative angles (around −30°C), partial flooding starts to occur; whereas when the tilt angle is further decreased (around −60°C), most of the active membrane area was under the permeate outlet and hence filled with liquid water. Identical tests were performed where care was taken to ensure no forced hydrostatic flooding over the active membrane area. The results taken in tandem showed that forced flooding, where the entire air gap is filled with liquid water, significantly increased the permeate flux (Figure 16). In the tests where forced flooding was avoided, one can see that even at -30°, the permeate flux rate does not change relative to the vertical baseline. At higher negative angles, we see an increase in relative flux but the increase is relatively smaller than in the case of forced flooding, pointing to the possibility of water falling back onto the membrane from the condensation plate and related local thermal bridging. This further shows that both flooding and thermal bridging are possibilities in AGMD at high tilt angles and that the relative increase in permeate flux is greatly affected by the extent of thermal bridging [51].
6.3 Thermal Bridging
Thermal bridging may happen if liquid water falls from the condensing plate onto the membrane, forming a liquid bridge across the air gap. This bridging phenomenon is not incorporated in the numerical model and is too complex and poorly understood to model accurately. Thermal bridging is particularly likely for negative tilt angles, and hence the experimental permeate flux results are asymmetrical about the vertical 0° module orientation. As the mass transfer resistance is dominated by the air gap width, the bridging phenomena should be easily observed by an increase in permeate flux at negative tilt angles. Thermal bridging was observed with the imaging techniques. Thermal bridging began at significantly negative angles (<-30ᵒ), likely due
0.4 0.6 0.8 1 1.2 1.4 1.6 1.8 -90 -60 -30 0 30 60 90 No rma lize d P erme ate Rate [ -] Tilt Angle θ [o]
Hydrostatic FloodingHydrostatic flooding
No hydrostatic flooding Air gap MD (Model approx) Flooded gap MD (Model)
23 to the hydrophilicity of the condensing surface. The aluminum condensing surface is hydrophilic with a contact angles of about 5° surface [68], and the sapphire surface is also very hydrophilic. On the other hand, MD membranes are hydrophobic. Thin films of water can stay on the underside of inclined hydrophilic surfaces up to very high tilt angles [69-71]. Additionally, in small air gaps where droplets can exceed the size of the gap, droplets on the hydrophobic surface may touch and be reabsorbed into the liquid film on the hydrophilic condensing plate. Therefore, large inclination angles, which favor thicker liquid films, may be required before thermal bridging effects occur.
6.4 Spacer Mesh Orientation
Varying the orientation of the spacer mesh, no significant difference was found in having the spacer in the vertical orientation versus having it in the diagonal orientation, rotated 45° from the vertical position (figs. 17, 18).
Figure 17. Comparison of diagonal and vertical permeate production rates. The temperature difference between cold and hot sides was kept at 20°C.
Surprisingly, it was found that the vertical or diagonal orientation of the spacer did not significantly impact permeate flux. Essentially, the horizontal orientation was thought to have more potential to hold water in the mesh (thus increasing flux through reduced transport resistance), because droplets could rest on the edge of the spacer. However, both configurations drained readily, perhaps because the woven mesh had consistent gaps for flow, and the rounded spacer wire allowed for passage of drops.
Figure 18 shows side-by-side visualizations of the two orientations at similar experimental conditions. Both orientations trap significant water in similar quantities. The diagonal orientation does show more consistent patterns of large droplets, but the impact of this is unclear.
0 2 4 6 8 10 12 40 50 60 70 Permeate Flux (LMH)
Hot Feed Temperature [°C]
Diagonal
Horizontal
24
a) b)
Figure 18. Side by side comparison of the: a) diagonal orientation; and b) vertical orientation of the square mesh spacer at Tf,in = 40°C, Tc,in = 25°C.
7. CONCLUSIONS
This study used experiments and numerical analysis to study how surface hydrophobicity, spacer orientation, and module tilt angle impacted the performance of air gap membrane distillation. This study is one of the first to visualize flow within the air gap itself, accomplished by using condensation on an optically transparent, high conductivity sapphire plate[51].
Several conclusions were reached:
• The hydrophobic visualization results showed smaller droplets and reduced water in the gap, indicating that smaller gap sizes are attainable without flooding. As this improves flux by reducing mass transfer resistance, AGMD systems should use hydrophobic surfaces with smaller gap sizes (e.g., < 1 mm) for improvements in energy efficiency and flux, especially for high salinity feed streams. Full scale trials are recommended for further validation of this result.
• Inadequate draining and water bridging across the gap may be a significant challenge in most AGMD systems and will make the performance tradeoffs (GOR versus flux) behave more like PGMD than anticipated. Better spacer design and hydrophobic condensing may counter this issue.
• At moderate angles of inclination, up to ±15°, there is little impact of tilt angle on permeate flux, which varied less than 5%. Air gap systems should remain in this range. • Permeate production increases at highly declined (negative) (<−30°) and highly inclined
25 permeate from the condensing surface to the membrane. In some cases, flooding caused flux increases of greater than 40%.
• During tests, flooding was generally found to occur for large temperature differences across the air gap, at small gap sizes (<0.7 mm), and at extremely inclined or declined angles.
• Varying the mesh spacer orientation had no significant effect on the permeate production rate. Flow visualization revealed that the spacer may alter water flow, causing liquid to wick towards it. This may act to trap water as well, and in some cases, can increase the average film thickness. This occurred with varied spacer designs and implies that the common filmwise condensation model does not adequately account for the intricacies of AGMD. Accounting for air gap spacers and improving their design may be a major area for further improving the technology.
26 NOMENCLATURE
A area [m2]
B membrane permeability [s/m]
dgap air gap width [mm]
c concentration [g/L]
Dw-a diffusivity of water vapor in air [m2/s]
hfg latent heat of vaporization [J/kg]
g gravitational constant [m/s2]
k thermal conductivity [W/m-K]
J flux [kg/m2s]
MW molecular weight [g/mol]
𝑚̇ mass flow rate [kg/s]
Pvap vapor pressure [N/m2]
𝑄̇abcd conductive heat transfer [W]
𝑄̇•‚oƒ conductive heat transfer [W]
T temperature [K] w width [m] x mole fraction 𝛿 film thickness [m] ξ porosity [%] ηMD MD thermal efficiency [-] ρ density [kg/m3] ν specific volume [m3] Subscripts a air c cold/environment f feed g gap
i ith cell in computation
m membrane
w water
Acronyms
AGMD air gap membrane distillation DCMD direct contact membrane distillation GOR gained output ratio
iCVD initiated chemical vapor deposition PGMD permeate gap membrane distillation VMD vacuum membrane distillation
ACKNOWLEDGMENTS
This work was funded by the Cooperative Agreement Between the Masdar Institute of Science and Technology (Masdar University), Abu Dhabi, UAE and the Massachusetts Institute of
27 Technology (MIT), Cambridge, MA, USA, Reference No. 02/MI/MI/CP/11/07633/GEN/G/00. The authors would also like to thank Margaret Bertoni for assisting with experiments.
REFERENCES
1. J. H. Lienhard, D. M. Warsinger, G. P. Thiel, and L. D. Banchik, Low Carbon
Desalination: Status and Research, Development, and Demonstration Needs. Abdul Latif Jameel World Water and Food Security Lab, MIT, 2016. http://web.mit.edu/lowcdesal 2. Z. Yan, H. Yang, F. Qu, H. Yu, H. Liang, G. Li, and J. Ma, “Reverse osmosis brine
treatment using direct contact membrane distillation: Effects of feed temperature and velocity,” Desalination, vol. 423, pp. 149–156, 2017.
3. D. M. Warsinger, E. W. Tow, L. A. Maswadeh, G. Connors, J. Swaminathan, and
J. H. Lienhard, “Inorganic fouling mitigation by salinity cycling in batch reverse osmosis,” Water Research, accepted 2018. https://doi.org/10.1016/j.watres.2018.01.060
4. V. Karanikola, A. F. Corral, P. Mette, H. Jiang, R. G. Arnoldand, and W. P. Ela, “Solar membrane distillation: desalination for the Navajo nation,” Reviews on Environmental Health, vol. 29, no. 1-2, pp. 67–70, 2014.
5. J. Sanmartino, M. Khayet, M. Garcá-Payo, H. El-Bakouri, and A. Riaza, “Treatment of reverse osmosis brine by direct contact membrane distillation: Chemical pretreatment approach,” Desalination, vol. 420, pp. 79–90, 2017.
6. J. Gilron, L. Song, and K. K. Sirkar, “Design for cascade of crossflow direct contact membrane distillation,” Industrial & Engineering Chemistry Research, vol. 46, no. 8, pp. 2324–2334, 2007. http://pubs.acs.org/doi/abs/10.1021/ie060999k
7. F. He, J. Gilron, and K. K. Sirkar, “High water recovery in direct contact membrane distillation using a series of cascades,” Desalination, vol. 323, pp. 48–54, 2013. http://-linkinghub.elsevier.com/retrieve/pii/S0011916412004365
8. H. C. Duong, P. Cooper, B. Nelemans, T. Y. Cath, and L. D. Nghiem, “Optimising thermal efficiency of direct contact membrane distillation by brine recycling for small-scale
seawater desalination,” Desalination, vol. 374, pp. 1–9, 2015.
9. L. D. Tijing, J.-S. Choi, S. Lee, S.-H. Kim, and H. K. Shon, “Recent progress of membrane distillation using electrospun nanofibrous membrane,” Journal of Membrane Science, vol. 453, pp. 435–462, 2014.
10. D. M. Warsinger, A. Servi, G. B. Connors, M. O. Mavukkandy, H. A. Arafat, K. Gleason, and J. H. Lienhard, “Reversing membrane wetting in membrane distillation: comparing dryout to backwashing with pressurized air,” Environmental Science: Water Research & Technology, vol. 3, pp. 930–939, 2017. http://dx.doi.org/10.1039/C7EW00085E
11. R. D. Gustafson, J. R. Murphy, and A. Achilli, “A stepwise model of direct contact membrane distillation for application to large-scale systems: Experimental results and model predictions,” Desalination, vol. 378, pp. 14–27, 2016.
28 12. M. Khayet, M. Garcá-Payo, L. Garcá-Fernández, and J. Contreras-Martnez, “Dual-layered
electrospun nanofibrous membranes for membrane distillation,” Desalination, vol. 426, pp. 174–184, 2018.
13. E. Shaulsky, S. Nejati, C. Boo, F. Perreault, C. O. Osuji, and M. Elimelech,
“Post-fabrication modification of electrospun nanofiber mats with polymer coating for membrane distillation applications,” Journal of Membrane Science, vol. 530, pp. 158–165, 2017. 14. M. Rezaei, D. M. Warsinger, J. H. Lienhard, and W. M. Samhaber, “Wetting prevention in
membrane distillation through superhydrophobicity and recharging an air layer on the membrane surface,” Journal of Membrane Science, vol. 530, pp. 42–52, 2017.
http://dx.doi.org/10.1016/j.memsci.2017.02.013
15. E. K. Summers and J. H. Lienhard, “A novel solar-driven air gap membrane distillation system,” Desalination and Water Treatment, vol. 51, pp. 1344–1351, 2013. http://-www.tandfonline.com/doi/abs/10.1080/19443994.2012.705096
16. A. Carrero-Parreño, V. C. Onishi, R. Ruiz-Femenia, R. Salcedo-Dáz, J. A. Caballero, and J. A. Reyes-Labarta, “Multistage membrane distillation for the treatment of shale gas flowback water: Multi-objective optimization under uncertainty,” in Computer Aided Chemical Engineering. Elsevier, 2017, vol. 40, pp. 571–576.
17. V. Karanikola, A. F. Corral, H. Jiang, A. E. Sáez, W. P. Ela, and R. G. Arnold, “Effects of membrane structure and operational variables on membrane distillation performance,” Journal of Membrane Science, vol. 524, pp. 87–96, 2017.
18. A. Alkhudhiri, N. Darwish, and N. Hilal, “Membrane distillation: A comprehensive review,” Desalination, vol. 287, pp. 2–18, 2012. http://linkinghub.elsevier.com/retrieve/-pii/S0011916411007284
19. R. Chouikh, S. Bouguecha, and M. Dhahbi, “Modelling of a modified air gap distillation membrane for the desalination of seawater,” Desalination, vol. 181, no. 1-3, pp. 257–265, 2005.
20. M. Khayet, “Membranes and theoretical modeling of membrane distillation: A review,” Advances in Colloid and Interface Science, vol. 164, no. 1-2, pp. 56–88, 2011. http://-www.ncbi.nlm.nih.gov/pubmed/21067710
21. E. K. Summers, H. A. Arafat, and J. H. Lienhard, “Energy efficiency comparison of single-stage membrane distillation (MD) desalination cycles in different configurations,”
Desalination, vol. 290, pp. 54–66, 2012. http://linkinghub.elsevier.com/retrieve/pii/-S0011916412000264
22. J. Swaminathan, H. W. Chung, D. M. Warsinger, and J. H. Lienhard, “Membrane
distillation model based on heat exchanger theory and configuration comparison,” Applied Energy, vol. 184, pp. 491–505, 2016. http://dx.doi.org/10.1016/j.apenergy.2016.09.090 23. J. Swaminathan, H. W. Chung, D. M. Warsinger, and J. H. Lienhard V, “Energy efficiency
of membrane distillation up to high salinity: evaluating critical system size and optimal membrane thickness,” Applied Energy, vol. 211, pp. 715–734, 2018.
29 24. D. M. Warsinger, A. Servi, S.Van Belleghem, J. Gonzalez, J. Swaminathan, J. Kharraz, H.
W. Chung, H. A. Arafat, K. K. Gleason, J. H. Lienhard, “Combining air recharging and membrane superhydrophobicity for fouling prevention in membrane distillation,” Journal of Membrane Science, vol. 505, pp. 241–252, 2016.
http://dx.doi.org/10.1016/j.memsci.2016.01.018
25. H. C. Duong, P. Cooper, B. Nelemans, T. Y. Cath, and L. D. Nghiem, “Evaluating energy consumption of air gap membrane distillation for seawater desalination at pilot scale level,” Separation and Purification Technology, vol. 166, pp. 55–62, 2016.
26. A. Alkhudhiri, N. Darwish, and N. Hilal, “Membrane distillation: A comprehensive review,” Desalination, vol. 287, pp. 2–18, 2012. http://linkinghub.elsevier.com/retrieve/-pii/S0011916411007284
27. G. L. Liu, C. Zhu, C. S. Cheung, and C. W. Leung, “Theoretical and experimental studies on air gap membrane distillation,” Heat and Mass Transfer, vol. 34, no. 4, pp. 329–335, 1998.
http://www.springerlink.com/openurl.asp?genre=article&id=doi:10.1007/-s002310050267
28. G. Meindersma, C. Guijt, and A. de Haan, “Desalination and water recycling by air gap membrane distillation,” Desalination, vol. 187, no. 1-3, pp. 291–301, 2006. http://-linkinghub.elsevier.com/retrieve/pii/S0011916406000087
29. B. L. Pangarkar and M. G. Sane, “Performance of Air Gap Membrane Distillation for Desalination of Ground Water and Seawater,” International Journal of Environmental, Chemical, Ecological, Geological and Geophysical Engineering, vol. 5, no. 3, pp. 177– 181, 2011.
30. K. G. Nayar, J. Swaminathan, D. M. Warsinger, and J. H. Lienhard, “Performance limits and opportunities for low temperature thermal desalination,” in Proceedings of the 2015 Indian Water Week, New Delhi, India, Jan. 2015.
31. J. Swaminathan, H. W. Chung, D. M. Warsinger, F. A. Al-Marzooqi, A. H. Arafat, and J. H. Lienhard, “Energy efficiency of permeate gap and novel conductive gap membrane distillation,” Journal of Membrane Science, vol. 502, pp. 171–178, 2016.
http://dx.doi.org/10.1016/j.memsci.2015.12.017
32. J. Swaminathan, H. W. Chung, D. M. Warsinger, and J. H. Lienhard, “Simple method for balancing direct contact membrane distillation,” Desalination, vol. 383, pp. 53–59, 2016. http://dx.doi.org/10.1016/j.desal.2016.01.014
33. H. W. Chung, J. Swaminathan, D. Warsinger, and J. H. Lienhard, “Multistage vacuum membrane distillation (MSVMD) system for high salinity application,” Journal of Membrane Science, vol. 497, pp. 128–141, 2016.
http://dx.doi.org/10.1016/j.memsci.2015.09.009
34. G. Rao, S. R. Hiibel, A. Achilli, and A. E. Childress, “Factors contributing to flux
improvement in vacuum-enhanced direct contact membrane distillation,” Desalination, vol. 367, pp. 197–205, 2015.
35. D. M. Warsinger, J. Swaminathan, L. Maswadeh, and J. H. Lienhard, “Superhydrophobic condenser surfaces for air gap membrane distillation,” Journal of Membrane Science, vol. 492, pp. 578–587, 2015. http://dx.doi.org/10.1016/j.memsci.2015.05.067
30 36. D. M. Warsinger, J. Swaminathan, L. L. Morales, and J. H. Lienhard, “Visualization of
droplet condensation in membrane distillation desalination with surface modification: hydrophilicity, hydrophobicity, and wicking spacers,” in 4th International Workshop on Heat Transfer (IWHT), April 2-5, 2017, Las Vegas, Nevada, USA, 2017.
37. M. Khayet and C. Cojocaru, “Air gap membrane distillation: Desalination, modeling and optimization,” Desalination, vol. 287, no. 0, pp. 138 – 145, 2012, special Issue in honour of Professor Takeshi Matsuura on his 75th Birthday. http://www.sciencedirect.com/science/-article/pii/S0011916411007983
38. A. F. Mills, Heat Transfer, 2nd ed. Prentice Hall, Inc., 1999.
39. D. M. Warsinger, J. Swaminathan, and J. H. Lienhard, “Hydrophobic air-gap membrane distillation,” US Patent 9,751,047, September 2017.
40. H. Cha, A. Wu, M.-K. Kim, K. Saigusa, A. Liu, and N. Miljkovic,
“Nanoscale-agglomerate-mediated heterogeneous nucleation,” Nano letters, vol. 17, no. 12, pp. 7544– 7551, 2017.
41. S. M. R. Razavi, J. Oh, S. Sett, L. Feng, X. Yan, M. J. Hoque, A. Liu, R. T. Haasch, M. Masoomi, R. Bagheri et al., “Superhydrophobic surfaces made from naturally derived hydrophobic materials,” ACS Sustainable Chemistry & Engineering, vol. 5, no. 12, pp. 11362–11370, 2017.
42. D. J. Preston, “Enhanced condensation heat transfer for water and low surface tension fluids,” Ph.D. dissertation, Massachusetts Institute of Technology, 2017.
43. McMaster-Carr. Chemical-resistant polypropylene mesh, part number 9275t65. http://-www.mcmaster.com/#9275T65
44. Q.-Y. Zhang, D.-K. Sun, Y.-F. Zhang, and M.-F. Zhu, “Numerical modeling of condensate droplet on superhydrophobic nanoarrays using the lattice boltzmann method,” Chinese Physics B, vol. 25, no. 6, p. 066401, 2016.
45. N. Miljkovic, R. Enright, Y. Nam, N. Lopez, Ken an Dou, J. Sack, and E. N. Wang, “Jumping-droplet-enhanced condensation on scalable superhydrophobic nanostructured surfaces,” Nanoletters, vol. 13, pp. 179–187, 2012.
46. N. Miljkovic and E. N. Wang, “Condensation heat transfer on superhydrophobic surfaces,” Materials Research Society, vol. 38, pp. 397–406, 2013.
47. A. Deshmukh and M. Elimelech, “Understanding the impact of membrane properties and transport phenomena on the energetic performance of membrane distillation desalination,” Journal of Membrane Science, vol. 539, pp. 458–474, 2017.
48. B. L. Pangarkar, M. G. Sane, and S. B. Parjane, “Flux enhancement of air gap membrane distillation for desalination of groundwater by surface modification of membrane,” vol. 3, no. 4, pp. 1816–1820, 2011.
49. L. Cheng, Y. Zhao, P. Li, W. Li, and F. Wang, “Comparative study of air gap and permeate gap membrane distillation using internal heat recovery hollow fiber membrane module,” Desalination, vol. 426, pp. 42–49, 2018.
31 50. M. Shakaib, S. Hasani, M. E.-u. Haque, I. Ahmed, and R. Yunus, “A CFD study of heat
transfer through spacer channels of membrane distillation modules,” Desalination and Water Treatment, vol. 51, no. 16-18, pp. 3662–3674, 2013.
51. D. M. Warsinger, J. Swaminathan, and J. H. Lienhard, “Effect of module inclination angle on air gap membrane distillation,” in Proceedings of the 15th International Heat Transfer Conference, IHTC-15, Paper No. IHTC15-9351, Kyoto, Japan August 2014. http://-web.mit.edu/lienhard/www/papers/conf/IHTC15-9351_Warsinger.pdf
52. W. Ambrosini, N. Forgione, and F. Oriolo, “Statistical characteristics of a water film falling down a flat plate at different inclinations and temperatures,” International Journal of Multiphase Flow, vol. 28, no. 9, pp. 1521–1540, 2002.
53. H. Hussein, M. Mohamad, and A. El-Asfouri, “Theoretical analysis of laminar-film condensation heat transfer inside inclined wickless heat pipes flat-plate solar collector,” Renewable Energy, vol. 23, no. 3, pp. 525–535, 2001.
54. A. Alkhudhiri, N. Darwish, and N. Hilal, “Produced water treatment: Application of air gap membrane distillation,” Desalination, pp. 46–51, 2013.
55. G. Chen, X. Yang, R. Wang, and A. G. Fane, “Performance enhancement and scaling control with gas bubbling in direct contact membrane distillation,” Desalination, vol. 308, pp. 47–55, 2013. http://linkinghub.elsevier.com/retrieve/pii/S001191641200389X
56. Y. Z. Tan, L. Han, W. H. Chow, A. G. Fane, and J. W. Chew, “Influence of module orientation and geometry in the membrane distillation of oily seawater,” Desalination, vol. 423, pp. 111–123, 2017.
57. A. T. Servi, E. Guillen-Burrieza, D. M. Warsinger, W. Livernois, K. Notarangelo, J. Kharraz, J. H. Lienhard, H. A. Arafat, and K. K. Gleason, “The effects of iCVD film thickness and conformality on the permeability and wetting of MD membranes,” Journal of Membrane Science, vol. 523, pp. 470–479, 2017.
http://dx.doi.org/10.1016/j.memsci.2016.10.008
58. L. L. Morales, “Visualization and measurement of filmwise and dropwise air gap
membrane distillation at varied module inclination angle and gap spacer orientation,” S.B. Thesis, Massachusetts Institute of Technology, 2016.
59. S.A.Klein, “Engineering equation solver version 9,” F-Chart Software.
60. V. Karanikola, A. F. Corral, H. Jiang, A. E. Sáez, W. P. Ela, and R. G. Arnold, “Sweeping gas membrane distillation: numerical simulation of mass and heat transfer in a hollow fiber membrane module,” Journal of Membrane Science, vol. 483, pp. 15–24, 2015.
61. J. H. Lienhard,V and J. H. Lienhard, IV, A Heat Transfer Textbook, Fourth Edition. Dover Publications, Inc, 2011. http://ahtt.mit.edu
62. D. M. Warsinger, E. W. Tow, K. Nayar, L. A. Masawadeh, and J. H. Lienhard, “Energy efficiency of batch and semi-batch (CCRO) reverse osmosis desalination,” Water Research, vol. 106, pp. 272–282, 2016. http://dx.doi.org/10.1016/j.watres.2016.09.029 63. E.W. Tow, R.K. McGovern, and J.H. Lienhard, “Raising forward osmosis brine
concentration efficiency through flow rate optimization,” Desalination, vol. 366, pp. 71-79, 15 June 2015. http://dx.doi.org/10.1016/j.desal.2014.10.034
32 64. K. Mistry and J.H. Lienhard, “Generalized least energy of separation for desalination and
other chemical separation processes,” Entropy, vol. 15, no. 6, pp. 2046-2080, May 2013. http://dx.doi.org/10.3390/e15062046
65. G.P. Thiel, R.K. McGovern, S.M. Zubair, and J.H. Lienhard, “Thermodynamic
equipartition for increased second law efficiency,” Applied Energy, vol. 118, pp. 292-299, April 2014. http://dx.doi.org/10.1016/j.apenergy.2013.12.033
66. D. M. Warsinger, E. W. Tow, J. Swaminathan, and J. H. Lienhard, “Theoretical framework for predicting inorganic fouling in membrane distillation and experimental validation with calcium sulfate,” Journal of Membrane Science, vol. 528, pp. 381 – 390, 2017.
//-www.sciencedirect.com/science/article/pii/S0376738817301916
67. D. M. Warsinger, K. H. Mistry, K. G. Nayar, H. W. Chung, and J. H. Lienhard, “Entropy generation of desalination powered by variable temperature waste heat,” Entropy, vol. 17, pp. 7530–7566, 2015. http://www.mdpi.com/1099-4300/17/11/7530/pdf
68. J. Bernardin, I. Mudawar, C. Walsh, and E. Franses, “Contact angle temperature
dependence for water droplets on practical aluminum surfaces,” International Journal of Heat and Mass Transfer, vol. 40, no. 5, pp. 1017–1033, 1997.
69. B. J. Chung and S. Kim, “Film condensations on horizontal and slightly inclined upward and downward facing plates,” Heat Transfer Engineering, vol. 29, pp. 936–941, 2008. 70. J. A. Howarth, G. Poots, and D. Wynne, “Laminar film condensation on the underside of
an inclined flat plate,” Mechanics Research Communications, vol. 5, no. 6, pp. 369–374, 1978.
71. H. R. Nagendra, “Effect of inclination on laminar film condensation,” Applied Scientific Research, vol. 28, pp. 261–277, 1973.
![Table 1 summarizes the dimensions[51].](https://thumb-eu.123doks.com/thumbv2/123doknet/14426563.514322/7.918.219.706.429.646/table-summarizes-the-dimensions.webp)
![Table 4. Parameters for the Immobilon-PSQ membrane [ 51 ] . Membrane parameter Value](https://thumb-eu.123doks.com/thumbv2/123doknet/14426563.514322/8.918.141.776.110.208/table-parameters-immobilon-psq-membrane-membrane-parameter-value.webp)
![Figure 5. Effect of module tilt angle on filmwise AGMD flux as predicted the model [51]](https://thumb-eu.123doks.com/thumbv2/123doknet/14426563.514322/13.918.236.683.627.964/figure-effect-module-angle-filmwise-agmd-predicted-model.webp)