HAL Id: hal-02060737
https://hal.archives-ouvertes.fr/hal-02060737
Submitted on 7 Mar 2019
HAL is a multi-disciplinary open access
archive for the deposit and dissemination of
sci-entific research documents, whether they are
pub-lished or not. The documents may come from
teaching and research institutions in France or
abroad, or from public or private research centers.
L’archive ouverte pluridisciplinaire HAL, est
destinée au dépôt et à la diffusion de documents
scientifiques de niveau recherche, publiés ou non,
émanant des établissements d’enseignement et de
recherche français ou étrangers, des laboratoires
publics ou privés.
To cite this version:
C. Bariki, F. Halter, S.-Y Lee, F. Thiesset, C. Chauveau, et al.. Interaction of a Laminar
Pre-mixed Flame with a Vortex. 8th European Combustion Meeting, Apr 2017, Dubrovnik, Croatia.
�10.13140/RG.2.2.33198.36166�. �hal-02060737�
Interaction of a Laminar Premixed Flame with a Vortex
C. Bariki
1, F. Halter
1,*, S.-Y Lee
2, F. Thiesset
1, C. Chauveau
1, I. Gökalp
11
CNRS-ICARE, Avenue de la Recherche Scientifique, 45072 Orléans Cedex 2 France
2
MEEM, Michigan Technological University, 1400 Townsend Dr., Houghton, MI 49931, USA
Abstract
Effect of a toroidal vortex on a laminar flame surface and inner structure is investigated using Rayleigh scattering and shadowgraph techniques. Vortex characteristics are kept identical whereas flame parameters are varied. Based on the flame surface observations, two distinct phases are observed. In the first phase, the flame undergoes a passive perturbation where the local flame apex curvature is driven by the vortex size. In the second phase, driven by the fuel reactivity, the laminar burning velocity is responsible for generating a structure with a very large negative curvature, thickening the flame inner structure. Only the thermal zone is modified during the flame-vortex interaction whereas the reaction zone remains unchanged.
Introduction
*Interactions between a flame and turbulence are
of primary importance to understand the combustion mechanisms in all practical combustion systems. Numerical simulations [1, 2] have shown that the flamelet regime where the flame front behaves like a quasi-laminar flame can be extended away from the Klimov-Williams criterion where small turbulent eddies enter the preheat zone but are not energetic enough to disturb the reaction zone.
Bray [3] discussed combustion diagrams taking into account these extensions. Peters [4] proposed a new regime of premixed combustion based on the fact that small turbulent eddies are able to enter the preheat zone of the flame front. He introduced a characteristic mixing length, arguing that eddies of this dimension are able to interact with the propagating reaction front and thus transport preheated fluid from the reaction zone over a distance corresponding to their own sizes. Eddies of smaller sizes act in a similar way, although their contribution is reduced because of their reduced sizes and reduced strengths. Experimentally, Buschmann et al. [5], using 2D Rayleigh thermometry combined with 2D laser-induced fluorescence in a turbulent premixed Bunsen flame, observed a large increase of instantaneous flame thermal thicknesses when the Karlovitz number was greater than 5. They pointed out that an increase of the strain rate acting on the flame front results in a reduction of the flamelet thickness. The work of Sankaran et al. [6] supports the Damkohler’s hypothesis showing that even for very large turbulence intensities (𝑢′ 𝑆
𝐿= 10
⁄ ),
turbulence increases the flame surface area but does not significantly alter the internal structure of the layers. They also pointed out that the thermal preheat layer of the flame was thickened due to the action of turbulence, but the reaction zone thickness was not significantly affected. Tanahashi et al. [7] performed direct numerical simulations of hydrogen/air turbulent premixed flames propagating in a three-dimensional turbulence. They concluded that even
*
Corresponding author: [email protected]
Proceedings of the European Combustion Meeting 2017
with large intensity levels (𝑢′ 𝑆 𝐿= 3.4
⁄ ), the increase observed in heat release rate compared to the laminar case was not due to eddies inside the flame but were associated with thermos-diffusive effects in the regions of negative curvature.
To our knowledge, there is no experimental verification that eddies actually enter the flamelet and increase the diffusivity while it is postulated that increasing the turbulence level favors the formation of even thinner highly strained reaction layers. The studies to date have demonstrated that the flamelets are not thicker than laminar unstretched flames in most cases, but in some experiments the preheat zone is 2-4 times thicker than an unstretched flame. The reason for the preheat zone broadening observed in some cases is still not clear. Although possible broadening due to turbulent eddies cannot be ruled out, one could also expect the thickening to be due to the coupled effect of the strain rate and thermal diffusion.
A simple prototype of a highly negative stretched flame is the flame tip of laminar premixed Bunsen flame [8]. The flame tip is not restrained by boundaries and is free to move in the flow-field to escape regions of intense strain. Tip opening of the laminar premixed Bunsen flame is closely related with some fundamental and critical factors, such as stretch rate and preferential diffusion. This phenomenon can provide useful information for the understanding of local flamelet properties in turbulent flames. In Vu et al. [9], the measurements of velocity and temperature fields showed no abrupt change across the tip opening condition, though a thicker preheat zone for a richer mixture could be identified at flame tip. The preheat zone thickness at the flame tip is increased by the preheating effects of the flame side on the central stream tube. It does not affect the structure of the reaction zone but it plays a significant role in the hydrodynamic and diffusion processes.
The current study investigates the inner flame structure of a stagnation premixed flame during its interaction with a toroidal vortex. The axisymmetric vortex forms the flame front bulge through the vortex wake, leading to possible local extinctions at the
2 vortex apex where the strain is highest. The local extinction depends on the vortex strength, mixture conditions and local strain rate. Therefore, the vortex-induced internal premixed flame structure can be strongly modified together with reaction rates, leading to highly strained structures and thicknesses. In the present study, the flame-vortex interaction is characterized by the laser induced Rayleigh scattering technique. Since the Lewis number plays a significant role in modifying the internal flame structure, methane and propane are selected to quantify these fundamental properties.
Experimental Set-up
The apparatus consists of the single jet stagnation burner, a toroidal vortex generator, and a Rayleigh scattering diagnostic as shown in Fig. 1. The 4-mm thick stagnation plate is attached to an alumina foam plug selected for its insulating properties. The fuel and oxidizer are first introduced through the burner side. The nozzle plenum is filled with 6-mm glass beads to ensure a homogeneous mixture where the reactive mixture is introduced through a 5-mm thick aluminum laminarization grid. Premixed mixture is accelerated in the converging section with a 15 mm outflow diameter (D), creating an upward-oriented jet with a top hat velocity profile. The burner-to-stagnation plate distance (L) was fixed to 25 mm, given a L/D ratio greater than unity as recommended [10]. To avoid external perturbations and improve flame stability, a laminar coaxial shroud of nitrogen is used.
Figure 1 : Stagnation burner and Rayleigh scattering
set-up. CL: cylindrical lens, DM: dichroic mirror, MF, mass flowmeter, SL: spherical lens, S: solenoid valve.
The toroidal vortex is generated by applying a pressure discharge of the reactive mixture of same equivalence ratio as the main flow in a tube of 2-mm diameter located on the burner centerline and 35 mm upstream the burner outlet. The 10 ms discharge is controlled by two electro-valves connected by series. The ejected volume of mixture corresponds to the volume between the two valves. The intensity of the vortex is controlled by varying the magnitude of the pressure (with a precision of 100 Pa) within a pressured tank located upstream the valves. In all
experiments, an over-pressure of 1000 Pa was fixed to ensure identical conditions. The vortex may be characterized by three parameters: the vortex size, the rotational velocity, and convection velocity [11]. Based on previous measurements performed using high-speed tomography [12], the three parameters were evaluated to be approximately equal to 4 mm, 0.5 m/s and 0.5 m/s, respectively, before the interaction with the flame. The repeatability of the vortex generation has been validated.
The 2D Rayleigh techniques consists of a 532-nm Nd-Yag laser with a typical energy of 560 mJ/pulse (Quantel) and 16-bit intensified CCD camera (PI-IMAX 3). The laser sheet is formed by using a combination of a spherical lens (fl=500 mm) and a cylindrical lens (fl=25.4 mm) denoted SL and CL respectively in Fig. 1. The ICCD intensifier is gated at 50 ns to minimize the flame luminosity combined with a 532±10 nm interference filter in front of f#/2.8 macro camera lens and the final spatial resolution is 73 pixel/mm, which is notably greater than previous experimental studies [5, 12–15]. The experimental uncertainty results from the pixel-to-pixel variations of laser sheet intensity due to inhomogeneous laser sheet profile and vortex generation variations. The final experimental uncertainty of the Rayleigh system was about 12% and vortex shot-to-shot variations were about 5%, leading to a total experimental uncertainty of ~13%.
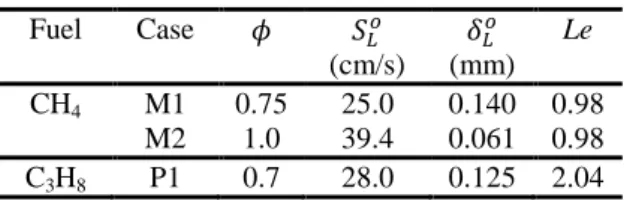
Three experimental conditions were selected to scrutinize the effect of a turbulent perturbation on a laminar premixed stagnation flame front. The ratio between the rotational velocity of the vortex and the laminar flame speed is known to have a leading effect on the flame response. To vary this ratio, two different equivalence ratios were selected for the methane-air flame, ϕ = 0.75 and 1.0. The vortex parameters (size and strength) remain identical for all flame conditions. Both methane-air mixtures have a Lewis number close to unity, meaning that thermal and molecular diffusivities are counterbalanced. To assess the effect of the Lewis number, a lean propane-air mixture has been selected (ϕ = 0.7). Flame characteristics (laminar burning velocity and thermal flame thickness) are close to those of the lean methane-air mixture. By doing so, the comparison between the two lean cases will emphasize the Lewis number effect. Table 1 reports the conditions for the three selected mixtures. Flame characteristics were estimated based on the PREMIX code [17] and the CHEMKIN-II database [18] using GRI-Mech. ver.3.0 [19]. The laminar flame thickness was defined as the ratio between the thermal diffusivity and the laminar burning velocity Zeldovich definition. Lewis numbers were evaluated using the methodology proposed by Bechtold et al. [20]. In all tests, flat flames were located approximately 10-12 mm donwstream the burner outlet by modifying the inlet flow rates. This change in flow rate does not impact the vortex generation.
3
Table 1: Flame conditions
Fuel Case 𝜙 𝑆𝐿𝑜 (cm/s) 𝛿𝐿𝑜 (mm) Le CH4 M1 0.75 25.0 0.140 0.98 M2 1.0 39.4 0.061 0.98 C3H8 P1 0.7 28.0 0.125 2.04
A multiple steps procedure has been applied to extract the temperature flame profile from Rayleigh images, as similarly done in Lafay et al. [16]. Laser beam profile, background noise, and scattering cross-sections of molecules formed across the reaction zone are considered to correct the raw Rayleigh signal. Averaged laser beam profile was obtained using the fresh gas mixture. The background signal level can only be estimated by imaging the scattered light from a fluid with a very low Rayleigh cross section. Helium was selected as it presents the main advantage of being easily used and having a Rayleigh cross section 66 times lower than that of a methane/air mixture [16]. Cross sections depend on gas composition and therefore vary across the flame front. The contribution of individual molecule cross-sections [20, 21] on Rayleigh signals was calculated based on the species formation in the stagnation flame model [23]. The normalized cross-section evolution across the flame front is plotted in Fig. 2 for all selected test conditions. The correction, relatively small for methane-air flames, is more noticeable for propane-air flames.
Figure 2: Normalized cross-sections across the flame
with conditions in Table 1.
The progress variable and the temperature can be obtained from the original flame Rayleigh signal, 𝑆𝑓(𝑥, 𝑦). Experimental normalized Rayleigh
signal, 𝑆𝑅𝑛𝑜𝑟𝑚𝑒𝑥𝑝 , can be obtained using: 𝑆𝑅𝑛𝑜𝑟𝑚𝑒𝑥𝑝 (𝑥) =
𝑆𝑓(𝑥,𝑦)−𝑆̅̅̅̅̅̅̅̅̅̅̅̅̅𝐻𝑒(𝑥,𝑦)
𝑆𝑈𝑀(𝑥,𝑦)
̅̅̅̅̅̅̅̅̅̅̅̅̅̅−𝑆̅̅̅̅̅̅̅̅̅̅̅̅̅𝐻𝑒(𝑥,𝑦) Eq. (1)
The upper bar denotes an average value evaluated over 20 images. 𝑆𝐻𝑒 corresponds to the background noise and 𝑆𝑈𝑀 to the laser beam profile obtained with
the unburnt mixture.
Experimental Rayleigh signal-based progress variable, 𝐶𝑆 𝑅𝑛𝑜𝑟𝑚𝑒𝑥𝑝 , is defined as 𝐶𝑆 𝑅𝑛𝑜𝑟𝑚𝑒𝑥𝑝 = 1 − 𝑆𝑅𝑛𝑜𝑟𝑚𝑒𝑥𝑝 (𝑥) . 𝜎𝑁−𝑆̅̅̅̅̅̅̅̅̅̅̅̅̅̅̅̅𝑅𝑛𝑜𝑟𝑚𝑒𝑥𝑝 (𝑥)𝐵𝑀 𝑆𝑅𝑛𝑜𝑟𝑚𝑒𝑥𝑝 (𝑥) ̅̅̅̅̅̅̅̅̅̅̅̅̅̅̅̅𝑈𝑀−𝑆 𝑅𝑛𝑜𝑟𝑚𝑒𝑥𝑝 (𝑥) ̅̅̅̅̅̅̅̅̅̅̅̅̅̅̅̅𝐵𝑀 Eq. (2)
where superscript BM is the burnt gas and UM the fresh gas. 𝜎𝑁 corresponds to the normalized
cross-section ratio of species present in the scattering gas to that of the species present in the unburnt mixture. Temperature may be obtained using the following relation:
𝑇(𝑥, 𝑦) = 𝑇𝑜(𝑥, 𝑦)𝑆̅̅̅̅̅̅̅̅̅̅̅̅̅̅−𝑆𝑈𝑀(𝑥,𝑦) 𝐻𝑒(𝑥,𝑦) ̅̅̅̅̅̅̅̅̅̅̅̅̅
𝑆𝑓(𝑥,𝑦)−𝑆̅̅̅̅̅̅̅̅̅̅̅̅̅𝐻𝑒(𝑥,𝑦) 𝜎𝑁 Eq. (3)
where 𝑇𝑜(𝑥, 𝑦) corresponds to the ambient
temperature.
In a first step, the experimental progress variable profile has been evaluated for the stoichiometric methane-air flame. This condition was selected as it exhibits the thinnest flame thickness (see Table 1) and is consequently the best initial test to assess the measurements quality. In Fig. 3, the experimental progress variable profile is compared to a computed profile obtained using the stagnation premixed flame model of the CHEMKIN PRO Package [22] with the GRIMech 3.0 mechanism [19]. The spatial resolution is clearly sufficient, even for this restrictive condition. A fairly good agreement is observed between experimental and numerical results, confirming the reliability of the diagnostic.
Figure 3: Comparison between computed (solid line)
and experimental (symbols) progress variable profiles with CH4 𝜙 = 1.0.
Results and Discussion
- Flame response to a turbulent perturbation Because of the low temporal resolution of our Rayleigh system (10Hz), in order to observe the time evolution of the flame-vortex interaction, the delay between the laser pulse and the vortex generation needs to be precisely controlled. This can be achieved by knowing exactly both the time needed by the vortex to be generated after the over-pressure in the tube and the convection time of the vortex to reach the flame surface. Due to the flow instabilities induced by intrinsic flow delivery system, slight changes in the flame position are observed. Moreover, although the vortex generation is a very repeatable process, we were not able to ensure accuracy better than 0.5 ms.
4 Figure 4 reports a series of Rayleigh images to illustrate the temporal evolution of the flame-vortex interaction. For the initial time, t0, the flame is nearly
flat. The slight positive curvature towards fresh gases is due to the presence of the tube in the burner, which slightly modifies the streamlines. The total sequence duration illustrated in Fig. 4 is10 ms. This sequence may be splitted into two distinct phases. Between t0
and 6 ms, the local curvature of the flame apex is mainly driven by the vortex size. The flame surface fits closely the flow field modification. During this phase the flame behaves as a passive propagating interface. Then, the vortex size and strength decrease because of the velocity and viscosity jump across the flame front. When the vortex is not energetic enough, the flame tends to retrieve its original position. This is the second phase. This mechanism is driven by the laminar burning velocity and generates structures with very large negative curvatures.
Figure 4: Progress variable inferred from Rayleigh
images for M2 case: blue color stands for fresh mixture (c=0) and red color for combustion product (c=1).
To assess the reliability of the Rayleigh phasing, temporal evolutions obtained using a high-speed shadowgraph system are superimposed for the stoichiometric condition (methane/air). The flame imaging was realized with a high-speed camera (Vision Research Phantom V1210; 768 pixels2; frame rate=20 kHz). A progress variable equal to 0.75 was selected to represent the flame surface in the Rayleigh images. This value corresponds to the position of the maximal heat release rate. The evolutions of the relative changes in the flame surface obtained for the three selected conditions are plotted in Fig. 5. Note that with our experimental configuration, we are limited to 2D information (flame length). Based on this measured flame length, the flame surface was evaluated taking benefit from the axisymmetry of the system (Pappus's centroid theorem).
Figure 5: Time evolution of the relative flame
surface for the three conditions. Symbols corresponds to Rayleigh measurements for the stoichiometric methane-air flame (c=0.75). Solid lines were obtained with high-speed shadowgraph technique. Dashed line: M1, full line: M2, dash-dot line: P1.
The flame deformation is the highest for the lean conditions which can be readily explained by the increasing ratio between the vortex rotational velocity and the laminar flame speed. The Lewis number effect may be inferred by comparing the two leanest cases. We observe that the propane flame is more influenced by the flow perturbations. The higher Lewis number value modifies the local flame response in reducing the burning velocity. As a result, the real ratio between the rotational velocity and burning velocity seen by the flame front is higher than the theoretical (unstretched) one.
Based on the flame surface evolution, the total stretch acting on the flame has been derived. The global stretch acting on the flame is largely positive during the first phase of the flame-vortex interaction and then becomes negative when the flame returns to its initial position [12]. The time needed by the flame to recover its original position mainly depends on the laminar burning velocity. On the contrary, the initial phase is mainly driven by the ratio between the rotational velocity of the vortex and the laminar burning velocity. We can identify the leading phenomenon of these two successive phases corresponding to respectively a kinematic interaction during the first phase and a thermo-chemical interaction during the second one. This will be discussed later.
- Thickening of the laminar flame induced by a turbulent perturbation
Rayleigh images were used to evaluate the evolution of the inner flame surface during the interaction with the vortex. The temporal evolutions of the flame surfaces conditioned by different progress variables (between 0.3 and 0.9) are plotted in Fig. 6 (for the M2 case). Each conditional surface is initially set to zero by subtracting the initial flame surface at t=t0.
5
Fig. 6: Temporal evolution of the relative flame
surface conditional by the local progress variables (c=0.3 to 0.8). M2 case.
During the initial phase of the interaction, almost no difference in the conditional flame surface areas is observed. This initial phase was identified as the passive phase when the flame undergoes the perturbation (before 6ms). In the second phase driven by the reactivity, when the flame returns to its original position, the conditional relative surface areas are substantially modified, emphasizing a change in the flame inner structure. The maximum flame surface area corresponds to the burnt gases side (c=0.9).
To correctly predict flame turbulence interactions, numerous turbulent combustion models have been suggested by evaluating efficiency functions. Efficiency functions are widely used in LES of turbulent premixed combustion in order to model the subgrid scale wrinkling factor [24]. For the canonical configuration of a vortex interacting with a flame, this function compares the vortex strain and flame stretch. The flame stretch evaluation may be dependent on the flame surface selection. As in [24], the maximal flame stretch is reached during the initial phase of the flame-vortex interaction, where the flame thickness remains unchanged. Based on our experimental observations, one can assess that the isotherm selection does not modify the efficiency function evaluation.
During the second phase, the flame apex exhibits large curvature values. For the laminar Bunsen flame, Poinsot et al. [8] used direct numerical simulations to demonstrate that the total stretch acting on the flame tip is mainly due to curvature effects. The strain rate in this region is significantly lower. Consequently, the stretch rate acting on the top of the flame may be evaluated based on local curvature only. The objective here is to establish a potential correlation between the flame inner structure and local stretch. The total flame thickening defined as the normal distance between c=0.3 and c=0.9 is plotted against the stretch based on the local curvature in Fig. 7 for each time step and for the three selected conditions. The stretch is defined as the product between the curvature and laminar burning velocity [25]. The stretch associated with curvature effects is negative
on the flame apex. The absolute value is thus considered in Fig. 7. Higher curvature values are observed at the end of the interaction between the flame and vortex (High stretch values).
Figure 7: Total flame thickening, defined between
c=0.3 and c=0.9, plotted against the local curvature. As the stretch rate evaluation is only based on the local curvature measurements, we focus our analysis when the flame has already been curved by the turbulent perturbation. Experimental results corresponding to this condition are located on the bottom left of the figure. The absolute stretch reported is certainly biased as strain effects may still be efficient. Then the vortex strength reduces and curvature effects are predominant. One observes a fairly nice correlation between the local curvature increase and the thickening of the flame front.
Figure 8: Temporal evolutions of the conditional
thicknesses. M2 case.
- Thickening of the preheat zone
Several numerical and experimental studies have concluded that the reaction zone is not influenced significantly by turbulent perturbations. Only the thermal zone is enlarged. The current study has focused on evaluating precisely how the inner flame structure is modified by turbulent effects. The c=0.75 has been selected as the reference progress variable contour. The apex of the flame where the curvature reaches its highest value is considered and information is extracted along the normal to the flame surface. Local thicknesses corresponding to the distances between c=0.75 and the other progress
6 variables are evaluated. Conditional thicknesses are normalized by the value of the steady case. These results are reported in Fig. 8 for the M2 case.
The distance of the preheating zone defined as the normal distance between c=0.75 and the lower c values slightly decreases in the beginning of the interaction. This implies that the thermal flame thickness is slightly reduced during the passive phase. During this phase, the vortex strength still remains intact and the flame surface is mainly impacted by strain effects. Contrary to curvature effects, strain effects induce a reduction of the flame inner structure in terms of thickness. In the second phase, the thermal flame thickness is notably increased due to flame curvature effects discussed previously. On the contrary, the distance between c=0.75 (reference) and higher c values does not increase significantly during this second phase, attesting that the reaction zone remains unchanged. Only the preheating zone is thickened.
Conclusions
The present study was devoted to the exploration of the flame modifications induced by a vortex dipole. Both surface and inner structure of premixed flames were experimentally characterized using Rayleigh scattering and shadowgraph techniques. A stagnation configuration has been selected to generate very repeatable vortex dipoles. Three different mixture conditions were selected. The two methane cases allow varying the ratio between the rotational velocity of the vortex and the laminar flame speed. The two lean flame conditions (for propane and methane) are almost similar in terms of burning velocity and flame thickness but have very different Lewis numbers.
Rayleigh technique gives access to the local structure of the flame. This structure was characterized in terms of progress variable. Methodology accuracy was first validated by comparing experimental profiles of progress variable to numerical results of stagnation premixed flames. Based on the flame surface investigation, two distinct phases were observed. In the first phase the flame undergoes a passive perturbation where the local flame apex curvature is driven by the vortex size and no significant modification on the flame structure was observed. In the second phase, driven by the fuel reactivity, the laminar burning velocity is responsible for generating the structure with a very large negative curvature. The flame thickening occurs during the second phase, where it is mainly piloted by the local curvature. Only the thermal zone is modified during the flame-vortex interaction. The reaction zone remains unchanged.
Acknowledgements
The financial support from the Agence National de la Recherche under the project IDYLLE is gratefully acknowledged. We are also thankful to the CNRS, the University of Orléans, and the French
Government Program “Investissements d’avenir” through the LABEX CAPRYSSES.
References
[1] T. Poinsot, S. Candel, A. Trouvé, Prog. Energy
Combust. Sci. 21 (1996) 531–576.
[2] T. Poinsot, D. Veynante, S. Candel, Symp. (Int.)
Combust. 23 (1990) 613–619.
[3] K.N.C. Bray, Symp. (Int.) Combust. 26 (1996) 1–26.
[4] N. Peters, J. Fluid Mech. 384 (1999) 107–132. [5] A. Buschmann, F. Dinkelacker, T. Schafer, M.
Schafer, J. Wolfrum, Symp. (Int.) Combust. 26 (1996) 437–445.
[6] R. Sankaran, E.R. Hawkes, J.H. Chen, T. Lu, C.K. Law, Proc. Combust. Inst. 31 (2007) 1291–1298.
[7] M. Tanahashi, Y. Nada, Y. Ito, T. Miyauchi,
Proc. Combust. Inst. 29 (2002) 2041–2049.
[8] T. J. Poinsot, T. Echekki, M.G. Mungal,
Combust. Sci. Technol. 81 (1992) 45–73.
[9] T.M. Vu, M.S. Cha, B.J. Lee, S.H. Chung,
Combust. Flame 162 (2015) 1614–1621.
[10] F.N. Egolfopoulos, H. Zhang, Z. Zhang,
Combust. Flame 109 (1997) 237–252.
[11] W.L. Roberts, J.F. Driscoll, M.C. Drake, L.P. Goss, Combust. Flame 94 (1993) 58–69. [12] F. Thiesset, G. Maurice, F. Halter, N. Mazellier,
C. Chauveau, I. Gökalp, Proc. Combust. Inst. (2017) in press.
[13] O. Dégardin, B. Renou, A.M. Boukhalfa, Exp.
Fluids 40 (2006) 452–463.
[14] F. Dinkelacker, A. Soika, D. Most, D. Hofmann, A. Leipertz, W. Polifke, K. Dobbeling, Symp. (Int.) Combust. 27 (1998) 857–865.
[15] C. Kortschik, T. Plessing, N. Peters, Combust.
Flame 136 (2004) 43–50.
[16] Y. Lafay, B. Renou, G. Cabot, M. Boukhalfa,
Combust. Flame 153 (2008) 540–561.
[17] R. Kee, J. Grcar, M. Smooke, J. Miller, Rep.
No. SAND85-8240, Sandia Natl. Lab. (1993).
[18] R.J. Kee, F.M. Rupley, J.A. Miller, Rep. No.
SAND89-8009B, Sandia Natl. Lab. (1998).
[19] G.P. Smith, D.M. Golden, M. Frenklach, N.W. Moriarty, B. Eiteneer, M. Goldenberg, T. Bowman, R.K. Hanson, S. Song, W. C. Gardiner, V. V Lissianski, Z. Qin, (1999). [20] J.K. Bechtold and M. Matalon, Combust. Flame
127 (2001) 1906–1913.
[21] M. Sneep and W. Ubachs, J. Quant. Spectrosc.
Radiat. Transf. 92 (2005) 293–310.
[22] H. Schwarz, L. Zimmer, D. Durox, S. Candel,
hal-00514496v1, 2010.
[23] Chemkin-Pro 15131, React. Des. San Diego, 2013.
[24] S. Bougrine, S. Richard, O. Colin, D. Veynante,
Flow Turbul. Combust. 93 (2014) 259–281.
[25] T. Poinsot, D. Veynante, S. Candel, J. Fluid