HAL Id: hal-01132385
https://hal.inria.fr/hal-01132385v2
Submitted on 16 Oct 2015
HAL is a multi-disciplinary open access
archive for the deposit and dissemination of
sci-entific research documents, whether they are
pub-lished or not. The documents may come from
teaching and research institutions in France or
L’archive ouverte pluridisciplinaire HAL, est
destinée au dépôt et à la diffusion de documents
scientifiques de niveau recherche, publiés ou non,
émanant des établissements d’enseignement et de
recherche français ou étrangers, des laboratoires
Diala Naboulsi, Marco Fiore, Stephane Ribot, Razvan Stanica
To cite this version:
Diala Naboulsi, Marco Fiore, Stephane Ribot, Razvan Stanica. Large-scale Mobile Traffic
Analy-sis: a Survey. Communications Surveys and Tutorials, IEEE Communications Society, Institute of
Electrical and Electronics Engineers, 2016, 18 (1), pp.124-161. �10.1109/COMST.2015.2491361�.
�hal-01132385v2�
ISRN INRIA/RR-–-FR+ENG
RESEARCH
REPORT
N°
March 2015Traffic Analysis: a Survey
Diala Naboulsi, Marco Fiore , Stephane Ribot , Razvan Stanica
RESEARCH CENTRE GRENOBLE – RHÔNE-ALPES Inovallée
Diala Naboulsi
∗, Marco Fiore
† ∗, Stephane Ribot
‡, Razvan Stanica
∗Project-Teams
Research Report n° — March 2015 — 61 pages
Abstract: This article surveys the literature on analyses of mobile traffic collected by operators within their network infrastructure. This is a recently emerged research field, and, apart from a few outliers, relevant works cover the period from 2005 to date, with a sensible densification over the last three years. We provide a thorough review of the multidisciplinary activities that rely on mobile traffic datasets, identifying major categories and sub-categories in the literature, so as to outline a hierarchical classification of research lines. When detailing the works pertaining to each class, we balance a comprehensive view of state-of-the-art results with punctual focuses on the methodological aspects. Our approach provides a complete introductory guide to the research based on mobile traffic analysis. It allows summarizing the main findings of the current state-of-the-art, as well as pinpointing important open research directions.
Key-words: Mobile traffic, data analysis, cellular networks
∗Universit´e de Lyon, INRIA, INSA-Lyon, CITI-INRIA, F-69621, Villeurbanne, France, [email protected] †CNR – IEIIT, Corso Duca degli Abruzzi 24, 10129 Torino, Italy, [email protected]
de r´eseaux cellulaires sur leurs infrastructures. Ce domaine de recherche est assez r´ecent, la majorit´e des travaux date d’apr`es 2005, avec une concentration assez forte sur les trois derni`eres ann´ees. Notre article couvre des ´etudes pluridisciplinaires, que nous classifions en des cat´egories majeures ainsi que des sous-cat´egories significatives. En plus, notre synth`ese ne se limite pas seulement `a la discussion des r´esultats des diff´erents travaux, mais englobe aussi les m´ethodologies appliqu´ees. Ainsi, nous fournissons aux lecteurs un guide d’introduction assez complet au domaine de recherche de l’analyse de trafic mobile, r´ecapitulant les principaux r´esultats d´ej`a trouv´es aussi bien que les pistes de recherche futures possibles. Mots-cl´es : Trafic mobile, analyse de donnees, r´eseaux cellulaires
1
Introduction
There is no doubt that personal mobile communication technologies are amongst the most successful innovations of the new millennium. An increasing number of people completely rely on mobile devices not only for work, but also for their personal life and entertainment. In turn, the huge popularity of mobile services has lead to an explosion of mobile traffic, whose compound annual growth rate (CAGR) attained 146% between 2006 and 2013: such a performance surpassed even that of fixed traffic over the turn of the millennium, i.e., when the Internet first started to pervade our lives [1].
An indirect consequence of the success of this technology is that mobile subscribers represent today a vast fraction of the population, a trend that is consistent across developed and developing countries [2]. Also, mobile devices are continously interacting with the network infrastructure, and the associated geo-referenced events can be easily logged by the operators, for different purposes, including billing and resource management. Combining the two elements above leads to the implicit possibility of monitor-ing a large percentage of the whole population with minimal cost: no other technology provides today an equivalent coverage. This rich source of knowledge represents a clear opportunity to many reseach communities, allowing scaling up studies across disciplines such as physics, sociology, epidemiology, transportation, and networking.
As a result, mobile traffic analysis is a rapidly emerging research field that encompasses a wide range of disciplines. We summarize its scope as the study of massive traffic datasets collected by mobile network operators to improve the understanding of natural or technological phenomena occurring at large scales, and to design solutions to issues they may yield.This definition is necessarily generic, as it has to accommodate works that exploit mobile traffic of different type, in diverse ways, and for many and varied purposes.
Yet, our definition traces a clear boundary on the mobile traffic sources we consider in this survey, which solely concerns datasets collected at the operator’s side of the mobile communication system. Therefore, works dealing with data gathered on the subscribers’ side via dedicated monitors running at the user equipment are out of the scope of our review: this concerns, e.g., the works carried out by Eagle and Pentland [3] within the MIT Reality Mining project1, or by De Domenico et al. [4] in the Nokia
Mobile Data Challenge2, just to mention two popular examples. Similarly, we focus on analyses of data
collected within cellular networks: as a matter of fact, mobile traffic datasets referring to other access technologies, such as Wi-Fi, do not currently achieve the desired coverage of large-scale user populations, even in presence of significant data collection efforts, such as that by Meneses and Moreira [5].
The aim of this manuscript is to provide an introductory guide to the state of the art in mobile traffic analysis. To the best of our knowledge, there exist only three previous efforts in that direction, all very recent. A first work reviewing mobile phone data analyses is that by Saramaki and Moro [6]. Unlike the survey we compile in our document, this work focuses on one specific topic, i.e., social graphs extracted from mobile traffic datasets. It thus represents an interesting and more technical reading for researchers interested in that precise subject, which we present in Sec. 4.1.
Closer to our approach, Shang et al. [7] provide an overview of several works that collect and em-ploy cellular phone data for studies on social networks, mobility, monitoring and estimation, or business applications. Blondel et al. [8] compile an even more extensive review of results on the analysis of mo-bile phone datasets, considering research on social networks, mobility, geography, urban planning, help towards development, and security. We believe that our survey extends both these works, introducing more comprehensive classification and discussion. On the one hand, we include in our study the vast literature on networking analyses that is neglected in previous reviews, and which is of capital interest to technology-oriented (e.g., computer science, telecommunications, engineering) research communities. On the other hand, we provide a compact treatise, focusing on major findings and methodologies rather
1http://realitycommons.media.mit.edu/realitymining.html.
100 101 102 103 104 105 2002 2004 2006 2008 2010 2012 2014 Users (thousands) Year 100 101 102 103 104 105 2002 2004 2006 2008 2010 2012 2014 Geographic area (km 2) Year 0 100 200 300 400 500 600 2002 2004 2006 2008 2010 2012 2014 Duration (days) Year Papers 40 30 20 10 5 1
(a) Dataset users (left), area (center) and duration (right) over time
0 20 40 60 80 100 120 140 160 180 200 1997 1998 1999 2000 2001 2002 2003 2004 2005 2006 2007 2008 2009 2010 2011 2012 2013 2014 Publications Year Network Mobility Social Graph 0 20 40 60 80 100 120 140 160 180 200 1997 1998 1999 2000 2001 2002 2003 2004 2005 2006 2007 2008 2009 2010 2011 2012 2013 2014 Publications Year NetMob’13 NetMob’11 NetMob’10
(b) Publication volume over time
Figure 1: Evolution of mobile traffic literature. (a) Main features of mobile traffic datasets. Circle color and size denote the number of papers with identical properties. We remark the dataset heterogeneity up to date, with the unique exception of the Ivory Coast dataset making the object of the 2013 Orange D4D Challenge. (b) Cumulated publications based on mobile traffic analysis. Different color shades map to the four main categories we identify in our survey. Vertical lines pinpoint major dedicated events, as per the labels.
than discussing highlight results; in the same spirit, we also include per-category tables that provide an immediate guidance through the many and varied works on mobile traffic analysis, by summarizing the nature of the datasets they employ, and the popularity and intertwining of the research topics they address.
2
Overview of the research field
Although only recently emerged as a research field, mobile traffic analysis has rapidly matured, with a sensible densification of activity over the last three years. We sketch the evolution of mobile traffic analysis in Sec. 2.1, where we also investigate the main reasons for its success. Then, we propose a struc-tured classification of the related literature in Sec. 2.2, which builds on the identification of a hierarchy of multidisciplinary subjects. Finally, we outline the organization of the survey in Sec. 2.3.
2.1
Evolution and driving factors
Mobile traffic conveys information concerning the movement, interactions, and mobile service consump-tion of individuals at unprecedented scales. Fig. 1a provides some representative numbers in this sense, as it shows scatterplots of the main features of mobile traffic datasets studied in the literature: these typically include data on hundreds of thousands or even millions of mobile subscribers, and cover wide geographical regions, i.e., cities to whole nations, over long timespans, i.e., weeks to months. Traditional data collection techniques, e.g., census, population surveys, phone interviews, or volunteer recruitment, cannot offer an even remotely comparable perspective on human activities.
As a consequence, as soon as the surge in mobile communications became evident – one decade ago approximately – sociologists, epidemiologists, physicists, transportation and telecommunication experts saw in the datasets collected by mobile network operators a clear opportunity to bring their analyses to an unprecedented scale while retaining a high level of detail on each individual.
The first, seminal studies exploiting mobile traffic datasets of significant size started to appear in 2006. Since then, the growth of mobile traffic analyses has been dramatic, swelling at a 90% compound annual growth rate, as shown by the representative numbers in Fig. 1b. The nature of mobile traffic datasets, enabling large-scale research that is pertinent to different disciplines, is the main reason for this phenomenon. However, it is not the only one, and other aspects contributed to foster the success of mobile traffic analyses.
A first supporting cause behind the increase in the volume of research works is the growing avail-ability of datasets. As mentioned above, mobile operators have been always monitoring mobile traffic in their networks, for troubleshooting, efficiency, and billing purposes. Yet, they have been traditionally very cautious about sharing the collected data. This attitude has been changing over the last years, as operators have become more and more prone to open their data to the wider research community. Such a shift was possible also thanks to seminal works that proved how mobile traffic data can be an extremely valuable asset for fundamental research with a return for the operators themselves. Collaborations be-tween academic research groups and network operators based on the analysis of real-world mobile traffic datasets have been florishing, with a consequent rise in the number of research results and publications.
A second factor favoring the success of the research field is the increasing quality of the datasets. On the one hand, operators, pushed by the value that mobile traffic data may have, are deploying ever more advanced probes in their networks, allowing for finer measurements of subscribers’ activities. On the other hand, mobile services have evolved from simple calling and texting to Cloud-based always-on applications: this results in much more frequent interactions between users (or their devices) and the network, which, in turn, leads to a significantly higher granularity of the activity samples recorded at the operator side. Clearly, the improved accuracy of mobile traffic datasets enables additional and more complex analyses, and thus attracts an even wider research community.
A third key element, originating from the first two above, is indeed the emergence of a very active and interdisciplinary community that brings together researchers and industrial actors. The cohesion of academic-industrial partnerships has important consequences: e.g., mobile operators are now fostering fundamental and applied research on mobile traffic through targeted challenges. Significant examples are the Data for Development (D4D) Challenges by Orange3, and the Telecom Italia Big Data Challenges4. Within these initiatives, mobile operators publicly disclose datasets of mobile traffic, and ask the research community to carry out analyses that can answer specific societal or technical challenges.
The impact of operators’ challenges is indeed notable. In Fig. 1b, we mark the dates of the main international venue dedicated to mobile traffic analysis, i.e., NetMob5. The jump in the number of publi-cations observed in early 2013 corresponds to the 2013 edition of that conference, where the results of the
3http://www.d4d.orange.com.
4http://www.telecomitalia.com/bigdatachallenge/.
Figure 2: Proposed classification of the mobile traffic analysis literature, including the spectrum of disci-plines related to topics.
first D4D Challenge were presented. This gives a rather clear idea of how similar initiatives can prompt research activities in the field. An event like NetMob is also interesting in that it captures the hetero-geneity of applications of mobile traffic analysis. Sessions span over many domains, from transportation systems to graph theory, from health to privacy, from social structures to network management.
Considering that all the trends identified above are currently reinforced, the future of mobile traffic analysis as a research field appears promising enough. The quantity and relevance of open directions for investigation is such that the dedicated community has still space to expand significantly. As a result, if the expectations are respected, there are significant chances that the mobile traffic analysis will evolve into a very popular, highly transdisciplinary domain of research.
2.2
Literature classification
The literature on mobile traffic analysis is very heterogeneous – a consequence of the large number of disciplines for which datasets collected by mobile network operators represent an important asset. Struc-turing the relevant works in a comprehensive way is not trivial: one needs to harmonize research originat-ing from domains such as physics, sociology, epidemiology, transportation, and, obviously, networkoriginat-ing. At the same time, forcing a neat separation among results obtained in each of such domains is a limiting approach, which would lose the significant overlaps and reciprocal references existing across disciplines. Our classification is thus organized around research subjects, each of which features multidisciplinary contributions. The global outline of the proposed hierarchy is shown in Fig. 2. At the top layer, we identify three macro-subjects of research at the interface of multiple domains: they deal with the analysis of social, mobility, and network properties, respectively. Then, a tree of topics is developed within each macro-subject. Below, we provide an overview of the themes addressed across the classification.
Social analysesinvestigate the relationships between mobile traffic and a wide set of social features. The major research focus is on the characterization of the social structure of mobile users’ interactions, and on the study of how demographic, economical, or environmental factors influence the way users consume mobile services. We also consider in this category works that leverage social features, inferred from mobile traffic, for the characterization and mitigation of disease epidemics.
Mobility analysesdeal with the extraction of mobility information from mobile traffic. Mobility is intended here in its broadest acceptation, and includes generic human movements at both individual or
aggregate levels, as well as specialized patterns that concern specific users, e.g., traveling on transporta-tion systems. We also review in this sectransporta-tion the quite extensive literature on the dependability of mobile traffic data as a source of mobility information.
Network analysestake a more technical perspective, as they focus on understanding the dynamics of the mobile traffic demand, and how to evolve the mobile network infrastructure to better accommodate it. Works in this category thus focus on either the characterization of mobile service usages or on the exploitation of such knowledge to devise improved technological solutions of diverse nature.
The vast majority of the categories outlined above are interdisciplinary by their own nature. In the lower portion of Fig. 2, we provide a representation of the relevance of five major research domains to the different topics of mobile traffic analyses. Relationships are necessarily not sharp, but we can remark that mobility studies are those attracting the highest variety of contributions. Most categories are significant to two or three disciplines. The only non-multidisciplinary subjects concern the development of novel solutions for mobile networks: being quite specific and very technical topics, it is understandable that they attract contributions solely from the networking community.
2.3
Survey organization
Since mobile traffic data collected by mobile operators in cellular networks is the cornerstone of all works we review, we start our survey by introducing some basic notions about such kind of data. Sec. 3 provides a primer of the cellular network architecture, and presents different solutions to record mobile traffic information within its access and core portions. The same section puts forward an important problem of the data collection process, i.e., the preservation of subscriber privacy, and outlines current approaches to the anonymization of mobile traffic datasets. These discussions are relevant to the whole body of works related to mobile traffic analysis, independently of the subject they address and of their specific target. We thus believe that the section provides a useful technical basis that eases the understanding of the actual examination of the literature.
Sec. 4–6 represent the core of our contribution, and thoroughly survey mobile traffic analysis ac-cording to our proposed classification. Specifically, works that concern social, mobility, and networking analysis, are presented in Sec. 4, Sec. 5 and Sec. 6, respectively. The internal structure of each section follows the hierarchy of classes identified in Sec. 2.2 above. As a quick reference guide, we report in Fig. 2 the number of the (sub-)section where each classification subject is addressed.
Throughout our discussion of the literature in these sections, we try to balance two aspects: (i) the comprehensive overview of the main results achieved by mobile traffic analyses in the considered theme, across disciplines; (ii) the introduction to significant details of the methodology adopted to obtain such results. The former represent the primary output of the research activities, and are presented in the main text. Methodological aspects that go into some technical depth are instead introduced only when required and in footnote, so as not to break the flow of the text. We thus suggest that readers interested in grasping fundamental outcomes of state-of-the-art research in mobile traffic analysis go through the main text, skipping technical footnotes. Readers willing to dig into some detail on a specific subject may instead refer to the technical footnotes associated to that topic.
Finally, we summarize our review in Sec. 7, which provides a general discussion of the results achieved in the research field. The section gives us the opportunity to highlight outtakes and point at main open issues and future research directions.
Figure 3: Simplified architecture of the cellular network encompassing different 2G, 3G and LTE tech-nologies, and positions of probes for passive monitoring.
3
Mobile traffic data collection
The scope of this survey encompasses works dealing with data collected by probes that record traffic at different locations within the cellular network infrastructure6, whose architecture is outlined in Fig. 3. Such a network grants access to telecommunication services and to the Internet by a wide range of de-vices: not only portable devices carried by mobile users, such as smartphones or tablets, but also meters or other types of machine-to-machine (M2M) communicating devices, as well as femtocells and cellular-connected Wi-Fi access points that bring local connectivity without the need for cabling.
3.1
Cellular network architecture: an overview
The network is composed of two main parts: a Radio Access Network (RAN), which provides wireless access to the individual devices, and a Core Network (CN), which manages all operations needed to transfer voice and data among different portions of the RAN as well as to and from external networks, including the Internet. The RAN is composed of base stations, each in charge of one or multiple cell sectors that jointly cover the geographical surface the network serves. End devices connect to the base station overseeing the cell section they are currently located in. Mobile devices may trespass the cell sector boundaries while exchanging data with the RAN, which generates a handover (HO) event to the new serving base station. Moreover, cell sectors are clustered into Location Areas (LA)7that represent the spatial granularity at which the device position is known at all times by cellular network, and it is thus used for paging. As a consequence, devices moving to a different LA are required to inform the network via a location update (LU) event, even if they do not have any ongoing communication at that time.
6According to the definition of Smoreda et al. [9], this corresponds to passive monitoring of mobile traffic, in contrast to active
collection performed by operator-side platforms that periodically query end devices, typically for positioning information intended to enable location-based services.
7The notion of Location Area, introduced originally in 2G networks, evolved with the development of new generations of mobile
networks. Similar concepts, such as Routing and Tracking Area are described in 3G and LTE systems. However, in this paper, we use Location Area as a generic term, denoting all these different technical definitions.
From a more technical perspective, base stations are referred to as Base Station Subsystem (BSS) and Radio Network Subsystem (RNS) in 2G (GSM, GPRS, and EDGE) and 3G (UMTS and HSPA) archi-tectures, respectively. In both cases, base stations are composed of separated antennas (Base Transceiver Station, i.e., BTS, or NodeB) and controlling hardware (Base Station Controller, i.e., BSC, or Radio Net-work Controller, i.e., RNC). In the LTE architecture, the eNodeB gathers all base station functionalities.
At the CN, and considering 2G and 3G architectures, voice and texting services are managed via the Circuit Switched (CS) Core, whereas data (i.e., IP-based) services are handled by the Packet Switched (PS) Core. The main entities of the CS Core are the Mobile Switching Center (MSC) and the Gateway MSC (GMSC), which enable voice/text switching within the mobile network and with networks of differ-ent operators, respectively. In the PS Core, Serving Gateway Support Nodes (SGSN) and Gateway GPRS Support Node (GGSN) are the interfaces towards the devices and the Internet, respectively, and take care of packet-switched data transfers. In LTE, new entities are introduced to form the Evolved Packet Core (EPC). These manage the device control (Mobility Management Entity, or MME) and data (Serving Gate-way, or SGW) planes, and interface them with other IP-based networks (Packet Data Network GateGate-way, or PGW).
Finally, a set of logical charging function are implemented in the network for billing and inter-operator accounting procedures. They are responsible for collecting network resource usages by each customer. The main functions are the following: the Charging Trigger Function (CTF), which generates charging events based on the observation of network resource usages; the Charging Data Function (CDF), which receives charging events from the CTF to construct Call Detail Records (CDR), providing for each user reports concerning his communications; and the Charging Gateway Function (CGF), responsible for val-idating, reformatting and storing CDRs before sending them to the billing domain.
3.2
Mobile traffic probes
Monitoring probes can be deployed at different locations within the architecture described above. RNC probes, marked as A in Fig. 3, can be used to capture signaling events concerning any Radio Re-source Control (RRC) operation. This allows to record fine-grained state changes of each device, and thus to detect device network attach and detach operations, start and conclusion of sessions, HO and LU events, related to any call, texting, or data transfer activity. Moreover, it allows collecting performance indicators on data transmission, such as the uplink and downlink throughput experienced by the device. MSC probes, marked as B in Fig. 3, are similar to RNC probes, in that they can collect similar statistics. However, as MSCs are located in the CS Core, these probes can only track signalling related to voice and texting (and not to data traffic). Moreover MSCs control multiple base stations and thus events that are managed locally by a BSC or RNC (e.g., intra-base station handovers occurring among cell sectors under control of a same BSC or RNC) are transparent to the probe.
GGSN/PGW probes, marked as C in Fig. 3, tap at links at Gn/S5 interface of data gateways on the PS Core or EPC8. They inspect messages tunnelled in the core network via the user data part of the
GPRS Tunnelling Protocol (GTP-U); this maps to the IP traffic generated or received by mobile devices. Operators typically have measurement infrastructures already in place to monitor IP-level statistics from such GTP-U message exchanges. Collected information include the IP session start and end time, device and user identifiers, traffic volume, type of service (i.e., transport- and application-layer protocols, class of service – such as web, email, streaming audio/video – and name of the application in some cases). In addition, GGSN/PGW probes can associate location information to the data traffic statistics above. To that end, they monitor the control data part of the GPRS Tunnelling Protocol (GTP-C), which carry Packet Data Protocol (PDP) Context messages. These messages are transmitted by the SSGN or MME/SGW to the data gateway to establish, update or tear down IP sessions (i.e., IMSI-to-IP address mappings) of end devices. PDP Context messages include, among other attributes, the cell sector where the mobile device
is located when the IP session is started or updated, which can be used to localize the data traffic. In current network configurations, no information concerning voice or texting activities can be collected by GGSN/PGW probes.
CGF probes, marked as D in Fig. 3, retrieve data from the CGF. The latter is responsible of providing Call Detail Records (CDR) information to the billing domain of the mobile operator, where fees to be charged to the owners of the end devices are determined. It is precisely CDR that are collected by CGF: these contain start timestamp, duration, and originating cell sector of each voice, texting and data traffic activity of every device. Less frequently, CDR include additional information on the last cell sector of the activity and on HO events occurred during the activity.
Discussion. The probes listed above all have strengths and weaknesses. As a general rule, probes located closer to the end devices (i.e., following the alphabetical order in Fig. 3) provide a more detailed view of the mobile traffic, but are more difficult to deploy and often less dependable in terms of uptime.
As an example, RNC probes deployed at all RNS allow observing all significant events occurring in the network, and thus provide accurate information about which cell sector each device is associated to at all times9. This represents the ideal data for any study of user mobility or mobile traffic
con-sumption. However, not all RNC equipment is designed to support probes, which, in any case, induce non-negligible computational and storage overhead on the RNC hardware. Moreover, RNCs are geo-graphically distributed, which forces (i) the deployment and maintenance of a large number of probes10
to cover a significant geographical area, and (ii) significant additional long-haul capacity to transfer all events to a central server.
On the contrary, a small number of GGSN/PGW probes deployed at the few data gateways necessary to cover a whole country allows to monitor mobile traffic much more efficiently. In addition, the infor-mation provided by such probes provides a rather detailed description of the IP traffic generated by each device, largely sufficient for studies on mobile traffic consumption. On the downside, no voice or texting data is currently recorded by GGSN/PGW probes. More critically, these probes only yield very approxi-mated positioning information, updated only at the establishment of the PDP Context by an end device11, or when the device moves across different SGSN or 2G/3G/LTE coverage areas. The latter events are quite rare, whereas cell sector changes that trigger HO or even LU events – instead very frequent in cel-lular networks – are not reported up to GGSN or PGW and thus go unnoticed. As a result, GGSN/PGW probes often have stale views of device locations.
The tradeoff is shifted in the case of CGF probes. On the one hand, the CDR they collect do not provide any insight on the type of data traffic generated by the devices: the rich information on protocol-and service-level operations granted by GGSN/PGW probes is lost at CGF probes, which only observe traffic volumes. On the other hand, however, CDR are readily available to mobile operators, typically at a single server for the whole network, and contain clean, well formatted information on millions of devices. This makes such kind of mobile traffic source extremely popular in research. In addition, the mobility information yielded by CDR is more accurate than that provided by GGSN/PGW probes: despite the fact that CDR only include the starting cell sector of each activity, they track voice and texting sessions in addition to data ones, which leads to a higher sampling frequency of device position. Clearly, this also implies that voice and texting behaviors can be studied using CDR, which is instead not possible with PDP Context data.
As a concluding remark, we underscore that the heterogeneous nature of probes presented above
re-9We recall that cell sectors represent the finest spatial granularity achievable by passive monitoring in cellular networks, at
least unless complex triangulations based mechanisms, using transmit power or timing advance information, are performed by the operator.
10This number can be two orders of magnitude larger than that of, e.g., CGF probes, at comparable geographical coverage. 11This maps to the time at which the device opens a data connection to the network. We remark that, once the connection
established, a device may keep it open even if it switches to an idle state, and thus does not actually transfer data. The device can then become active again, and generate traffic over the same connection that was never closed. This leads to PDP Contexts that are not updated for hours even if the devices change location.
flects into a staggering diversity across the mobile traffic datasets studied in the literature. As a matter of fact, the works we review in this survey rely on information that describes user position with spatial granularities that range from cell sectors to whole cities, and with temporal granularities that span from milliseconds to hours. In some cases, the datasets contain no or minimal notion of the actual service provided to each subscriber (e.g., voice, texting, data), whereas in other cases they detail the protocols, applications, and URLs involved in each network transaction. Differences also emerge in terms of cus-tomer base, geographical and temporal coverage. A clear demonstration of such a variety is provided by Fig. 1a, which shows how: (i) the number of subscribers, the geographical surfaces and the timespan cov-ered by mobile traffic datasets can differ by several orders of magnitude; (ii) there is no clear trend over time, and the growing number of points, i.e., works, just leads to more diversity; (iii) with one notable exception12there is a tendency for each paper to use its own mobile traffic dataset.
3.3
Mobile traffic anonymization
Independently of collection location, mobile traffic data contain information on many aspects of sub-scribers’ life, including their activities, interests, schedules, movement, and preferences. It is precisely the possibility of accessing to such information at unprecedented scales that proves of critical importance for studies in many and varied research fields.
However, accessing such a rich source also raises concerns about potential infringements of the pri-vacy rights of mobile customers: among others, individuals can be identified, their movements can be tracked, and their mobile traffic can be monitored. As a result, regulators have been working on laws intended to protect the privacy of mobile users. As an example, the European Data Protection Directive 95/46/EC mandates that all mobile traffic datasets be anonymized so that no individual is identifiable, be-fore any cross-processing can be run on the data. Moreover, Directive 2002/58/EC states that anonymized data shall be analyzed only for the time necessary to provide the intended value-added service.
However, directives such as those above do not indicate any precise anonymization technique or privacy preservation model to be adopted during or after data collection. The reason is that there is still a high degree of uncertainty on this subject. On the one hand, there are many different notions of privacy that are not necessarily subset of each other, such as k-anonymity [11], l-diversity [12], t-closeness [13], and differential privacy [14], just to cite a well-known few. Which definition should be adopted, and under which conditions, is open to discussion. On the other hand, current anonymization algorithms aimed at guaranteeing the different privacy notions above are thought for standard tabular databases of static attributes, which are quite different in nature from mobile traffic datasets of subscribers’ spatio-temporal activity. In fact, even the debate on whether user re-identification represents an actual threat to subscribers or not is still on-going [15, 16].
Overall, no definitive solution exists today to protect mobile users from privacy breaches that represent a certain risk – in the first place because the latter are not yet clearly defined. The result is that, so far, operators have considered naive techniques to preserve the privacy of customers. In most of the previous works, subscribers are anonymized by replacing their unique identifiers13 with random sequences that allow to pinpoint a single user but hide his/her actual identity. Several works have focused on the issues of such an approach, and proposed solutions based on generalization and suppression of data. We refer the reader to Sec. 6.2.3 for a technical discussion of the topic.
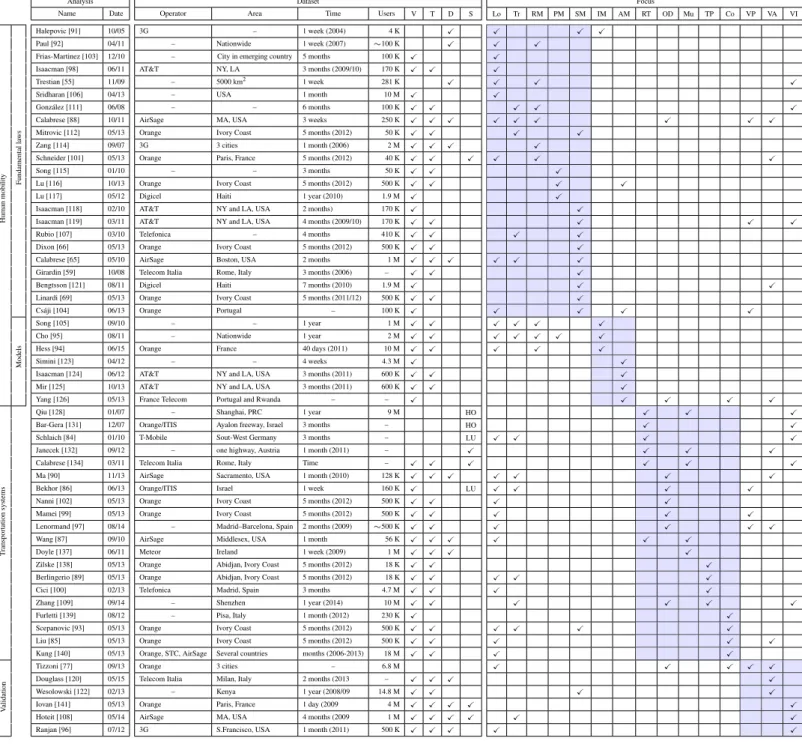
Analysis Dataset Focus
Name Date Operator Area Time Users V T ED FT Di GS GM AG EL EF Ge UL SE EC PC
Mobile
call
graph
Nanavati [17] 11/06 – 4 Indian regions 1 month 2.7 M X – From X X X
Doran [18] 12/12 – Unknown country 3 weeks (2011) 3 M X – From X X
Onnela [19] 02/07 – European country 18 weeks 7.2 M X – From X X
Lambiotte [20] 09/08 Mobistar Belgium 16 months 2.5 M X X – From X X X X
Seshadri [21] 08/08 Sprint 4 USA regions 2 months 2 M X – From X X
Karsai [23] 02/14 – European country 18 weeks 6.2 M X – From X X
Onnela [24] 05/07 – European country 18 weeks 7.2 M X – From X X
Hidalgo [25] 05/08 – Unknown country 1 year (2004/05) 2 M X – From X
Miritello [26] 04/13 Telefonica Spain 19 months 20 M X – From X X
Palla [27] 04/07 – – 1 year 4 M X – From X
Demographics
Yang [30] 06/09 – Chinese city 6 months 300 K X Demographic To X
Sarraute [31] 08/14 – Mexico 3 months 500 K X X Demographic To X
Stoica [32] 11/10 Mobistar Belgium 6 months (2006/07) 3.3 M X X – To X
Mehrotra [33] 03/12 – Rwanda 4 years (2005/09) 1.2 K X X Demographic To X
Wang [34] 05/13 Sprint USA 1 month (2010) 20 M X Demographic From X
Brea [35] 08/14 – Mexico 3 months 70 M X X Demographic From X
Blondel [36] 03/08 Mobistar Belgium 6 months 2.04 M X X Demographic From X X
Toomet [37] 05/12 – Tallin, Estonia 1 year (2009) 32 K X X – From X X
Blumenstock [38] 04/15 EMT Estonia 5 years (2007/12) 48 K X X Demographic To X
Morales [39] 05/13 Orange Ivory Coast 5 months (2011/12) 500 K X X Demographic From X
Bucicovschi [40] 05/13 Orange Ivory Coast 5 months (2011/12) 500 K X X Demographic From X
Soto [41] 06/11 – City in Latin America 6 months (2010) 500 K X X Demographic From X
Smith [42] 05/13 Orange Ivory Coast 5 months (2011/12) 500 K X X Economicindicators From X X
Mao [43] 05/13 Orange Ivory Coast 5 months (2011/12) 500 K X X Economicindicators From X X
Wakita [44] 05/13 Orange Ivory Coast 5 months (2011/12) 500 K X X – From X X
Fajebe [45] 05/13 Orange Ivory Coast 5 months (2011/12) 500 K X X Commodity prices From X
Lim [46] 05/13 Orange Ivory Coast 5 months (2011/12) 500 K X X Economicindicators From X
Frias-Martinez [47] 01/12 Telefonica City in Latin America 6 months 500 K X X Demographic From X
Krings [48] 05/13 – Brazil 2 months 6 M X X Employment details From X X
En
vironment
Onnela [49] 04/11 – European country 1 month 3.4 M X X – To X X
Wang [50] 04/15 – European country 2 years 10 M X X – To X
Krings [51] 07/09 Mobistar Belgium 6 months (2006) 2.5 M X User billing address To X
Schmitt [52] 05/13 Orange Ivory Coast 5 months (2011/12) 500 K X X – From X
Eagle [53] 08/09 – African country 4 years (2005/08) 1.4 M X Regional census From X X X
Almeida [54] 09/99 Telecel Lisbon 3 days (1997) – X – From X
Trestian [55] 11/09 – 5000 km2 1 week 281 K
X Data traffic From X X
Vieira [56] 08/10 Telefonica 2 metropolis 4 months 1 M X – From X
Pulselli [57] 06/08 Telecom Italia Milan, Italy 2 months (2004) – X – From X X
Naboulsi [58] 04/14 Orange Abidjan, Ivory Coast 5 months (2011/12) 18 K X X – From X X
Girardin [59] 10/08 Telecom Italia Rome, Italy 3 months (2006) – X X – From X X
Bajardi [60] 04/15 Telecom Italia Milan, Italy 2 months (2013) – X X Points of interest From X X
Toole [61] 08/12 AirSage Boston, USA 3 weeks 600 K X X Land usage To X
Soto [62] 06/11 Telefonica Madrid and Barcelona 1 month (2009) 3 M X X Land usage From X
Cici [63] 06/15 Telecom Italia Milan, Italy 2 months (2013) – X X Land usage From X X
Candia [64] 07/08 – 230,400 km2 – – X – From X
Calabrese [65] 11/10 AirSage Boston 6 weeks (2009) 1 M X X Event list From X
Dixon [66] 05/13 Orange Ivory Coast 5 months (2011/12) 500 K X X – From X
Gowan [67] 05/13 Orange Ivory Coast 5 months (2011/12) 500 K X X Event list From X
Bagrow [68] 03/11 – European country 3 years 10 M X X Event list From X X
Linardi [69] 05/13 Orange Ivory Coast 5 months (2011/12) 500 K X X Event list From X
Epidemics
Wesolowski [70] 05/13 Orange Ivory Coast 5 months (2011/12) 500 K X X Health surveys From X
Enns [71] 05/13 Orange Ivory Coast 5 months (2011/12) 500 K X X Demographic From X
Gavric [72] 05/13 Orange Ivory Coast 5 months (2011/12) 500 K X X Health surveys From X
Baldo [73] 05/13 Orange Ivory Coast 5 months (2011/12) 500 K X X Demographic From X
Ndie [74] 05/13 Orange Ivory Coast 5 months (2011/12) 500 K X X Health surveys From X
Chunara [75] 05/13 Orange Ivory Coast 5 months (2011/12) 500 K X X Health surveys From X
Azman [76] 05/13 Orange Ivory Coast 5 months (2011/12) 500 K X X Health and meteosurveys From X X
Tizzoni [77] 09/11 Orange 3 countries – 6.8 M X Demographic From X X
Frias-Martinez [78] 05/12 Telefonica Mexico 6 months (2009) 1 M X Health surveys From X
Frias-Martinez [79] 09/11 Telefonica Mexican city 6 months (2009) 2.4 M X Health surveys From X X
Saravanan [80] 05/13 Orange Ivory Coast 5 months (2011/12) 500 K X X Health surveys From X X X
Leidig [81] 05/13 Orange Ivory Coast 5 months (2011/12) 500 K X X Health surveys From X X
Kafsi [82] 05/13 Orange Ivory Coast 5 months (2011/12) 500 K X X Demographic From X X X
Lima [83] 05/13 Orange Ivory Coast 5 months (2011/12) 500 K X X – From X X
Table 1: Main features of works that leverage mobile traffic data for social analysis. In the analysis columns, date is the publication month/year. In the dataset columns, V is voice, T is texting, and ED is complementary external data. In the focus columns, FT indicates if the paper studies social properties appearing in the dataset (From) or the impact of societal issues on mobile phone data (To), Di is mobile call graph distributions, GS is graph structure, GM is graph generative models, AG is age and gender, EL is ethnicity and language, EF is economic factors, Ge is geography, UL is urbanization and land use, SE
4
Social analysis
The scale and granularity of social studies has been historically limited by the considerable costs of col-lecting meaningful data. Extensive, statistically reliable population surveys require significant economic and organization efforts, may take a long time, and cannot be guaranteed to be free of biases introduced by the sample selection or survey methodology.
From this perspective, the availability of datasets describing the dynamics of millions, such as those collected by mobile operators, is a definite game changer. Still, social studies often require information that is not present in mobile traffic data: the latter is thus complemented with traditional surveys, including national and regional demographics and statistics, or supplementary personal notions, including users’ age, gender, employment, or revenue.
We identify four main research directions where social studies have enjoyed particular benefit from mobile traffic analysis. The first is the investigation of the structure of interactions among mobile sub-scribers, typically represented as a so-called mobile call graph. Results on properties and models of such particular graphs are surveyed in Sec. 4.1. The second subject is the exploration of the interactions among demographic factors and mobile communications, by means of cross-correlation of mobile traffic and personal subscriber information databases. The main results on this subject are presented in Sec. 4.2. The third topic concerns the relationships between the environment, in terms of both geographical and temporal features, and the communication structure. We review the related works in Sec. 4.3. The fourth research direction relates to epidemiology, since mobile traffic provides massive information on human movements and interactions that are critical to better understanding how viral diseases propagate. We discuss these latter works in Sec. 4.4.
To ease the reader’s access to the studies on his/her topic of interest, we give an overview of the works discussed in this section in Tab. 1. The table also provides a quick access regarding the size and geographical coverage of the used datasets, as well as information regarding the supplementary data used in these studies.
4.1
User interactions
Understanding the complex structure of mobile user interactions is a challenging task that has implications in physics, sociology and also networking, since this knowledge can be used to, e.g., understand service adoption or anticipate evolutions in the customer base (see also Sec. 6.2.2 on this subject).
The vast majority of studies on mobile data characterization employ graph representations that allow adopting well-known analysis techniques issued from graph theory. We present the main results of these studies in Sec. 4.1.1. Another significant research line aims at understanding the reasons behind the structure of such graph representations, and develop so-called graph generative models. Such models can create synthetic graphs of mobile data whose features mimic those of graphs extracted from real-world datasets. Sec. 4.1.2 is dedicated to works in the field of graph generative models.
4.1.1 Mobile call graph properties
Mobile traffic datasets are very often represented as mobile call graphs. A mobile call graph G = (V, E) is a mathematical structure describing a set of mobile users, which map to the set of vertices V, and their interactions (i.e., exchanged voice calls or text messages), which correspond to the set of edges E connecting pairs of vertices. This generic definition can accommodate a number of variations, depending on whether, e.g., edges are directed or undirected, weighted or unweighted, or subject to filtering rules.
12The larger circle in Fig. 1a maps to the fourty-some papers using the 2014 Data for Development (D4D) Challenge dataset. 13Typically, IMSI, IMEI, or the phone number.
In fact, there is no unique definition of a mobile call graph, and a variety of alternatives is found in the literature, as presented next. However, independently of the graph construction methodology, there exists a limited set of metrics that yield most of the significant information about the mobile call graph structure. We employ these metrics to classify relevant works in the following.
Degree distribution. The vertex degree distribution is the statistical distribution of the number of ver-tices connected by edges to a single other vertex. It conveys information about the basic structure of communications among mobile users.
In a seminal work, Nanavati et al. [17] construct an unweighted directed graph, which preserves the caller-callee relationship (as edges point to the latter), but loses any information on the number or duration of interactions between pairs of users (as edges do not depend on the intensity of the interactions). The authors observe that the in- and out-degree of vertices14 both follow power law distributions15. The parametrization of the power law is however different for the in- and out-degree, with an exponent taking values between 2.7 and 2.9 for the in-degree, and between 1.5 and 2 for the out-degree. Nevertheless, the correlation between the two metrics at a same node is strong, implying that mobile users that call more people also tend to be called by a larger set of individuals. However, vertices with a very high in-degree (e.g., customer service numbers) or out-degree (e.g., salesmen) lose that correlation. Similar conclusions are drawn by Doran et al. [18], although with slightly different power law parameters (an exponent of 3.41 for the in-degree and 2.63 for the out-degree).
The node degree power law distribution seems to be consistent over different modeling choices, as shown by Onnela et al. [19], where the authors consider a mutual mobile call graph, with an undirected edge connecting two vertices if at least one reciprocated pair of calls was exchanged between the cor-responding users. In this graph, the notions of in- and out-degree coincide, and the node degree is characterized by a power law with a much faster decay, an exponent of 8.4, implying that the number of high-degree vertices is much lower than that measured when including one-way interactions.
In yet another different approach, Lambiotte et al. [20] consider a constrained mobile call graph, where an undirected edge connects two vertices if a minimum number of reciprocated calls exists between the corresponding users during a given time period. Specifically, the authors consider that at least 6 reciprocated calls must be present in a 6-month dataset for the relative edge to be present. The vertex degree distribution follows a power law in this case as well, with an exponent of 5.0. Yet, the results indicate that the power law models accurately only the tail of the empirical distribution, but not its head. A similar conclusion is drawn by Seshadri et al. [21] on multiple versions of an undirected mobile call graph. The authors consider both unweighted and weighted versions of the graph, with two types of edge weights: the total call duration between the pair of users, and the total number of calls they exchanged. In all cases, power laws are found to fit the tail of the degree distributions, but not the head. Instead, a Double Pareto Log Normal (DPLN) distribution16yields a good fit for the full vertex degree range.
Other power law distributions. Power laws characterize not only the tail of the vertex degree distribu-tion, but other features of mobile call graphs as well. A first example is that of edge weights, as shown by Karsai et al. [23] in undirected weighted graphs, with the edge weight representing the number of calls between pairs of users. However, Onnela et al. [19] find that a different weight definition, the total call du-ration between two users, can introduce a cutoff in the distribution, leading to an exponentially-truncated power law17.
14The in-degree of a vertex, d
in, is the number of directed edges that end at the vertex. Equivalently, out-degree of a vertex,
dout, is the number of directed edges that originate at the vertex.
15Denoting as d the in- or out-degree, then P (d) ∼ d−γ, where the exponent γ is inversely proportional to the presence of
highly connected vertices (also referred to as hubs) in the graph.
16The DPLN distribution is a mixture of lognormal distributions. Its complete formulation is rather complex, and, for the sake of
brevity, we do not provide it here. A detailed discussion is provided in [22].
17Denoting as w the edge weight, then P (w) ∼ w−γe−w/k, where k is the weight at which the exponential cutoff occurs, i.e.,
for which it becomes very unlikely to find edges. In [19], γ = 1.9 whereas k is equal to 3.4 · 105s, implying that reciprocated
A second case is that of spatio-temporal properties. Karsai et al. [23] disaggregate the mobile call graph over time, and study the users’ activity rate, i.e., the probability of a vertex to be involved in an interaction at each unit time. They find the distribution of the activity rate to be heavy-tailed, with an exponent of 2.8. On the spatial side, Lambiotte et al. [20] associate geographical information from billing ZIP codes to the vertices of the graph, and find that a power-law gravity model18well approximates the
probability that two mobile users living at a given distance are connected in the graph, i.e., call each other. Assortativity. A graph is assortative if its vertices tend to connect to other vertices with similar degree. This property, also known as assortative mixing, is typical of social networks. On the contrary, in a disassortative network high-degree nodes tend to connect to low-degree ones and vice versa.
In the case of directed mobile call graphs, Nanavati et al. [17] show that assortative mixing is only present for the in-degree, whereas the out-degree graph is even weakly disassortative. Undirected graphs appear instead to be always assortative, as shown by Onnela et al. [19].
In [19], the authors extend the assortativity analysis to edge weights, comparing the average weight of a vertex’s edges to that of its neighbors. The outcome is dependent on the definition of edge weight: the graph is weight-assortative if edges are associated with the number of calls exchanged by mobile user pairs, but it is not in case total call durations are used as edge weights.
Structural role of vertices and edges. Several studies have focused on the identification of vertices and edges that are especially important within the structure of the mobile call graph, so as to pinpoint mobile users and calling interactions that play key roles in the communication network.
The PageRank19 algorithm is used by Nanavati et al. [17] to assess the importance of vertices in the
mobile call graph. The results show that the rank, i.e., importance, of a user is tightly correlated to the in-degree of its vertex, or, in other words, to the volume of calls it receives.
Onnela et al. [19] focus on the importance of edges, rather than vertices. Specifically, they map edge significance to the role that an edge plays in maintaining the mobile graph structure robust, i.e., well connected. They find that several measures allow to rank edges according to their importance for the graph robustness: removing edges with the lowest weight, the lowest overlap20, or the highest betweenness centrality21 results in a rapid disintegration of the graph. In a follow-up, Onnela et al. [24] delve deeper into the relevance of the edge weight, which they name the strength of the tie between a pair of users. Interestingly, they find that the weight is correlated to the logical positioning of the edge within the mobile graph structure. High-weight edges, i.e., strong ties, connect members of a same community, whereas weak ties tend to build links among communities. This explains why weak ties are critical to the graph connectivity. The result is confirmed in a recent work by Karsai et al. [23].
Instead, Doran et al. [18] are only in partial agreement with the conclusion above. They rank edges according to their outlying behavior, i.e., how significantly the edge weight and overlap20 deviate from
the mean value in the graph, either positively or negatively. Their results suggest that the mobile call graph is composed of well-connected communities featuring non-outlying edges. These communities are kept together by a backbone of outlying edges.
Finally, Hidalgo and Rodriguez-Sickert [25] identify a relationship among the importance of vertices and edges in the mobile call graph structure. They measure the former as the vertex degree and the
18The gravity model commends that a measure decreases as a power of distance. Denoting as d
ijthe geographical distance
between mobile users i and j, their probability to be connected is P (dij) ∼ d−γij . In [20], γ = 2.
19PageRank is a random-walk-based algorithm used to rank webpages in the Google search engine. PageRank computes the rank
r(i) of a vertex i as r(i) = q/N + (1 − q)P
j:j→ir(j)/dout(j), where N is the total number of vertices in the graph, j → i
indicates an edge from j to i, dout(j) is the out-degree of vertex j, and 1 − q is the damping factor, i.e., the probability to stop the
random walk and start it again at a random graph vertex – the latter being modeled by the term q/N .
20The overlap of an edge connecting two vertices i and j is defined as o
ij= nij/[(d(i) − 1) + (d(j) − 1) − nij], where d(i)
is the degree of vertex i, and nijis the number of neighbors common to i and j. 21The betweenness centrality of an edge connecting vertices i and j is defined as b
ij = Pv∈V
P
w∈V/vσvw(i, j)/σvw,
where σvw(i, j) is the number of shortest paths between vertices v and w that traverse the (i, j) edge, and σvwis the total number
latter as the frequency with which an edge appears in graphs constructed over different periods, i.e. edge persistence, and find that low-degree vertices tend to create more persistent edges.
Cluster structure. Real-world networks typically have non random organizations that are the outcome of, e.g., social interactions, or spatio-temporal constraints. As a result, their vertices and edges build precise internal structures that are not found in random graphs.
A classical feature of real-world networks is the presence of clusters, i.e. groups of vertices that are more tightly connected with each other than with other vertices in the graph. A typical metric for the level of clustering in a graph is the clustering coefficient22. Nanavati et al. [17] and Onnela et al. [19]
measure the average clustering coefficient of either directed or undirected mobile call graphs, and find it to be similar to that of many other empirical networks that have non-random structures, such as email communication graphs or the World Wide Web. Lambiotte et al. [20] add a geographical dimension to the analysis, by studying the distribution distances between ZIP areas of mobile users whose vertices form a triangle in the mobile call graph. They find that triangles are typically characterized by shorter geographical distances and call durations than the average network behavior.
Another measure of the cluster structure within a graph is the presence of cliques, i.e. complete sub-graphs in which all the nodes are connected to each other. Onnela et al. [19] confirm that this feature holds in mobile call graphs as well, as the number of cliques they observe is much more important than what expected in a random graph.
Temporal dynamics. A few studies have considered the evolution of mobile call graphs over time. Miritello et al. [26] perform a massive study on the temporal dynamics of a mobile call graph, using a 19-month dataset covering more than 20 million mobile customers in Spain. The authors show that subscribers tend to renew their social circle slowly, as more than 75% of the ties remain active over the full timespan of the dataset. Moreover, a conservation principle of the social network size is observed, with a very similar number of activated and deactivated ties per individual. The results are also related to user demographics, since male users display larger social circles than women, and younger users have more contacts than older ones. Palla et al. [27] complement these results, by showing that large groups persist in time even in the presence of important membership turnovers, while small groups have a significant lifetime only if their composition remains unchanged.
4.1.2 Mobile call graph models
The natural step beyond the characterization of a complex network is the definition of models that capture its most significant properties. This has been the case with, e.g., classical models of the Internet or World Wide Web, such as Jellyfish [28] and Bow-Tie [29] models. A correct model of the mobile call graph has a number of applications, including: (i) explaining the generative process behind the formation of mobile call graph structures; (ii) creating call interaction networks from synthetic populations of mobile users; (iii) anticipating the evolution of the mobile demand.
Treasure-Hunt model. Nanavati et al. [17] were the first to propose a model of directed mobile call graphs. Their Treasure-Hunt model divides graph vertices into three groups, depending on whether they belong to the graph strongly connected component (SCC), are able to reach such a component (IN), or are reached by it (OUT). It then tells apart edges that connect IN-IN (entry), IN-SCC (in-tunnel), SCC-SCC (maze), SCC-OUT (out-tunnel), OUT-OUT (treasure), or IN-OUT (shortcut) pairs. The Treasure-Hunt model is shown to fit the directed mobile call graphs from mobile traffic datasets collected in four different regions.
Lognormal multiplicative process. Seshrandi et al. [21] propose a method to build a synthetic mo-bile call graph, by studying the generative process of such a graph. To that end, the authors leverage
22The clustering coefficient of a vertex i is defined as c
i= 2ti/di(di− 1), where diis the degree of i and tiis the number of
datasets from two different time periods, and study the evolution of the user population and interactions. They conclude that the temporal growth of the graph follows a lognormal multiplicative process, al-ready successfully used to model income distributions. Lognormal multiplicative processes result in the DPLN distributions that the authors found to characterize the vertex degree distributions, as discussed in Sec. 4.1.1.
Migration model. Lambiotte et al. [20] argue that classical models neglect the geographical distances associated to edges present in mobile traffic datasets. They thus propose a generative model where vertices are represented by agents, which can migrate from one region to another. Upon migration, an agent can either maintain its previous edges, or create new ones with vertices in the new region it moved to. The authors show that the migration model captures the geographical diversity of triangles in the graph, which are mostly composed of short-distance edges, yet at time include long-distance edges, as mentioned in Sec. 4.1.1.
4.2
Demographics
The most direct usage of mobile traffic for sociology purposes is probably the study of how communica-tion and mobile device usage patterns relate to demographics. A number of such factors can be expected to shape the behavior of mobile users, including, e.g., their age, gender, and interpersonal ties. Below, we review the main studies that focus on such issues.
Age and gender. Age and gender are among the primary features from demography that play a major role in defining the behavior of a user. This was first indicated by Yang et al. [30], in an early study where they unveil a strong correlation between social and demographic elements. Using a six-month mobile traffic dataset covering a large Chinese city, and mixing it with subscribers’ age and gender information, the authors find out that people in the same age group communicate among them more often and for a much longer time, a result that holds throughout all age classes. Gender also plays a significant role, the results showing that calls between female users have a much longer duration than calls between male users.
Sarraute et al. [31] confirm the age homophily at a country scale, considering 500,000 users over the entire Mexico. However, cultural differences seem to play an important role on gender-related patterns, as men make more and longer calls than women in Mexico, i.e., the opposite of what happens in PRC. Gender impact on mobile communications has been further investigated in a number of other countries. Stoica et al. [32] study an even larger dataset of 3 million subscribers in Belgium, and show once again differences between genders, with average call duration longer for women. Mehrotra et al. [33] outline that gender also affects intra-day and inter-day calling dynamics in Rwanda. Specifically, they prove women to call much more than men at nighttime, whereas the trend is reversed during daytime. Gender differences also emerge with respect to special events, with women increasing their activity in proximity of, e.g., Valentine’s Day or political elections, and men doing the same during Year’s End holidays.
The significant impact of demographic factors on phone usage implicitly invites to develop techniques to automatically infer personal data of mobile subscribers from their calling profiles. Wang et al. [34] identify social characteristics like the age group, income level, and residential region of 20 million indi-viduals, by leveraging homophily properties of the mobile call graph in combination with ground-truth data on a small user subset. The accuracy is in the 70-80% range in all cases. A similar approach is adopted by Brea et al. [35], who focus on age prediction of 74 million Mexican citizens. By using the correlation between demographic properties of users that are connected in the mobile call graph, the authors successfully classify up to 72% of the population into four age categories.
Ethnicity and language. In addition to genetic characteristics, also social features characterizing large groups of individuals have attracted significant attention in terms of mobile traffic analyses. In this per-spective, most works have addressed the problem of recognizing ethnic groups from the network data, and understanding their properties and dynamics.
In a seminal work, Blondel et al. [36] analyse mobile traffic of 2 million users in Belgium, and show that the two main ethnic groups in the country, i.e., Walloons and Flemish, can be clearly inferred from the mobile call graph. To that end, they extract communities, i.e., sets of subscribers with strong communication ties between each other and with weaker connections to individuals outside the set. The problem of community detection, computationally expensive to solve in large graphs, is addressed by proposing an original technique, called Louvain method23, which has hence risen to become the standard
approach for community detection in all types of large datasets, not necessarily limited to mobile traffic. Toomet et al. [37], followed by Blumenstock et al. [38], study a mobile traffic dataset of Tallinn, Estonia, and identify two separate ethnic groups in the city. In addition, they investigate the spatial segregation between the two communities, and find that, while segregation exists in residential and work neighborhoods, driven by an ethnic composition, the rest of the activities, e.g., shopping or entertainment, take place in a virtually non-segregated environment.
Morales et al. [39] separate24 ethnic communities in Ivory Coast. Linguistic identity plays, rather unsurprisingly, a fundamental role in the ethnical separation. Also, mobile communication is shown to occur by preference within ethnic groups. An equivalent analysis is carried out by Bucicovschi et al. [40] in the same country, using a spatial approach25.
Economic factors. The socio-economic status of subscribers is characterized by three main factors: income, education and occupation. If measured at an individual level, these measures can indicate the role the person plays in the society. If averaged over a certain population, they are an important instrument to measure the development of a country or a region.
Soto et al. [41] define a comprehensive list of 279 mobile user features, and use machine learning methods to show that the economic levels of a customer can be predicted with an accuracy higher than 80% with only 38 such features26. As the result is obtained by still combining a quite large number of features, Smith et al. [42] argue that such a micro-measurement approach is too complicated and may lack transparency in the end. Therefore, the latter authors also use machine learning techniques, but target regions rather than individuals, and limit their analysis to four properties only: the sum of communication flows between the regions, the gravity residuals27, the diversity28, and the introversion29. They show that a limited training sample, as low as 10% of the total mobile traffic data, allows determining the poverty index of Ivory Coast regions, although the spatial granularity can be improved significantly with more complete training. In fact, correlations between poverty and mobile traffic on a per-region basis can be also found using simpler metrics, e.g., the volume of outgoing calls. Indeed, Mao et al. [43] find a negative relationship of the latter with economic indicators such as the poverty rate and annual income of 19 regions in Ivory Coast. The authors explain this result by the fact that the communication fee is generally paid by the initiator of the call, and people in richer regions have greater means to start a call. Also, by exploring communities in the mobile call graph of each region, they show that rich areas
23The Louvain method is a scalable heuristic based on modularity, i.e., a benefit function designed to measure the strength of
a possible partition of a network into components. The Louvain method efficiently detects communities through an iterative two-steps process, repeated until the maximum modularity is achieved: the first step aims at optimizing the modularity locally, while the second step aggregates the nodes in the same community to create a new network.
24In [39], individual trajectories and language maps are employed to draw ethnical links among users. Then, a K-means
cluster-ing is run on the resultcluster-ing graph, so as to identify the groups of users sharcluster-ing strong interactions of ethnical nature. K-means is a partitional clustering algorithm that allows separating a set of items into K disjoint categories.
25In [40], a combination of gravity and Potts models is employed. A q-state Potts model is a spin model used to represent
multi-body systems in statistical mechanics, and has important applications in segmentation problems.
26Key features include the number of weekly calls, the reciprocity of communication, the median of total number of calls, the
individual area of influence, the radius of gyration, the total number of towers used, and the traveled distance.
27The gravity residuals are the errors between the real and estimated flows among each pair of regions u and v. The latter is
Fuv = gmumv/d2uv. There, g is a constant, muis the population of region u, and duvis the euclidean distance between the
centroids of regions u and v.
28Considering v
ij to be the fraction of region i flow that goes to region j, the diversity of i is ∆(i) =
−P
jvijlog(vij) log(vij)/ log(ki), where kirepresents the number of regions to which region i is connected. 29The introversion of a region i is I(i) = f
ii/
P