Publisher’s version / Version de l'éditeur:
Canadian Geotechnical Journal, 8, 1, pp. 77-93, 1971-02
READ THESE TERMS AND CONDITIONS CAREFULLY BEFORE USING THIS WEBSITE.
https://nrc-publications.canada.ca/eng/copyright
Vous avez des questions? Nous pouvons vous aider. Pour communiquer directement avec un auteur, consultez la
première page de la revue dans laquelle son article a été publié afin de trouver ses coordonnées. Si vous n’arrivez pas à les repérer, communiquez avec nous à PublicationsArchive-ArchivesPublications@nrc-cnrc.gc.ca.
Questions? Contact the NRC Publications Archive team at
PublicationsArchive-ArchivesPublications@nrc-cnrc.gc.ca. If you wish to email the authors directly, please see the first page of the publication for their contact information.
NRC Publications Archive
Archives des publications du CNRC
This publication could be one of several versions: author’s original, accepted manuscript or the publisher’s version. / La version de cette publication peut être l’une des suivantes : la version prépublication de l’auteur, la version acceptée du manuscrit ou la version de l’éditeur.
Access and use of this website and the material on it are subject to the Terms and Conditions set forth at
The Empress Hotel, Victoria, British Columbia sixty-five years of
foundation settlements
Crawford, C. B.; Sutherland, J. G.
https://publications-cnrc.canada.ca/fra/droits
L’accès à ce site Web et l’utilisation de son contenu sont assujettis aux conditions présentées dans le site LISEZ CES CONDITIONS ATTENTIVEMENT AVANT D’UTILISER CE SITE WEB.
NRC Publications Record / Notice d'Archives des publications de CNRC:
https://nrc-publications.canada.ca/eng/view/object/?id=b334182f-6799-41ca-9327-39e7ae8611a1 https://publications-cnrc.canada.ca/fra/voir/objet/?id=b334182f-6799-41ca-9327-39e7ae8611a1The Empress Hotel, Victoria, British Columbia. Sixty-Five Years
of Foundation Settlements
C. B. CRAWFORD
Division of Building Research, Natior~al Research Colrncil of Canada, Ottawa, Canada
AND
J. G. SUTHERLAND~
Etzgirreer of Buildirrgs, Carladiarl Pacific Railway, Montreal, Quebec Received September 21, 1970
Construction of the Empress Hotel began in 1904 o n a site reclaimed from the sea. The combined load of the fill and the structure has caused several feet of compression in the under- lying marine silty clay. Fortunately, settlement observations have been made regularly since 1912 and the nature of the foundations and the structure allow reliable extrapolation back to the first loading. This paper describes the site, the applied loading, the settlements observed, and the results of laboratory tests o n samples recently obtained. The observed primary and secondary consolidation settlements are compared with computed values.
L a construction de l'hbtel Empress a dCbutC en 1904 sur un terrain remblayC sur le lit de la mer. L a surcharge composee du remblayage et de la structure a causC une consolidation sur une profondeur de plusieurs pieds dans l'argile marine linoneuse sous-jacente. Heureuse- ment, des observations rCgulitres du tassement ont CtC faites depuis 1912 et, de plus, la nature des fondations et les details de la structure permettent une extrapolation assez pricise allant jusqu'i la charge initiale. Le prCsent mCmoire dCcrit l'emplacement, les charges et surcharges en place, les observations du tassement et les rtsultats de laboratoire sur des Cchantillons ricents. Les tassements de consolidation primaire et secondaire sont cornparks aux tassements prCvus par les calculs.
Introduction
The Empress Hotel in Victoria, British Co- lumbia, opened its doors on 20 January 1908, four years after the site was reclaimed from the sea. Even during its construction the building was settling differentially due to the varying thickness of compressible clay beneath its foundations. Today it slopes approximately 30 in. (75 cm) from north to south, although this will not be noticed by the casual visitor. The Empress is no ordinary hotel; in Vic- toria it is an institution. Its charm is eloquently described in a recent book entitled The Ein-
press o f Victoria (Holloway 1968). Neverthe-
less, after 50 years of service the owners had to decide whether to extend its life or to re- place the building with a modern structure. The many admirers of the Empress were greatly relieved when it was announced in 1966 that the hotel would be renovated and refurbished in a multi-million dollar program under the singularly appropriate name "Operation Tea-
CUP.''^
IRetired."'Afternoon tea at the Empress" has become a Canadian tradition.
The decision to modernize the hotel was taken only after a thorough examination and study of the effects of settlement on the in- tegrity of the structure now and in the future. On the basis of a comprehensive study by Dr. R . M. Hardy, it was concluded that the settle- ments were within acceptable limits, that the rate of settlement was decreasing and that the settlements estimated for the next 25 years will also be within acceptable limits.
When the Empress was built, the science of soil mechanics had not yet begun to influence foundation engineering. As a consequence it became one of many similar structures which experienced large differential settlements. For- tunately, the engineers responsible for the building began, at an early date, to measure foundation movements on a regular and syste- matic basis, resulting in almost 60 years of continual observations. This magnificent record has now been made available for study by the Canadian Pacific Railway Company.
In this paper the foundation design, con- struction, and performance are described and an attempt is made to reconstruct the loading sequence and to relate observed settlements with computed values.
78 CANADIAN GEOTECHNICAL JOURNAL. VOL. 8, 1971 Choosing the Site
The Canadian Pacific Railway, guided by its president, Sir Thomas Shaughnessy, in 1903 selected Victoria, the capital of British Columbia, as the location of its most westerly hotel. The railway had been operating trans- continental passenger and freight trains in regular service for some 17 years from Mont- real to Vancouver, and the passenger business was flourishing. It was also operating trans- Atlantic steamships, and its new hotels at Que- bec City, Banff, and Vancouver were doing well. The success of its hotels then operating, in providing rest and good accommodation for travellers to and from Europe, showed the desirability of having similar accommodation on the Pacific Coast. The Vancouver Hotel, opened in 1887, was not adequate for this service. Furthermore, an increase in traffic was anticipated with the awarding, in 1889, by the Imperial Government at Westminster of a £60 000 subsidy for handling mail from Eng- land to the Orient and Australia by an all- Empire route.
Political considerations may also have played a part in the decision to build a hotel at Vic- toria. Because of the threat to British Columbia from Russia and the United States, the terms of the Imperial subsidy to the C.P.R. for the Pacific mail service called for the ships to be fast twin-screw steamers capable of being con- verted to armed cruisers in time oY war. British warships were based at Victoria and it was a logical base for the C.P.R.'s Pacific ships. Considerable pressure had been exerted to have the provincial capital moved from Victoria to the fast growing city of Vancouver, but this move was quashed in 1898 by the opening of the costly new legislative buildings. All of these factors no doubt helped the C.P.R. to decide to build an impressive new hotel at Victoria. Sir Thomas Shaughnessy selected James Bay, a mud flat near the new parliament buildings, at the easterly end of the harbor, as the site for the hotel. From his point of view, it was an excellent location for the hotel, commanding an unobstructed view of the harbor, and being close to the steamship docks, parliament build- ings, and the center of town. The architect for the parliament buildings, Mr. F. M. Ratten- bury, was engaged to design the hotel.
Site Conditions
From an engineer's point of view, the site was considerably less than impressive. It was a low-lying swamp, flooded at high tide and separated from the harbor by a long timber bridge. The president could, however, visualize it as it was to be, with a massive stone seawall and paved street replacing the bridge, lawns, and rose gardens and a fine hotel replacing the swamp.
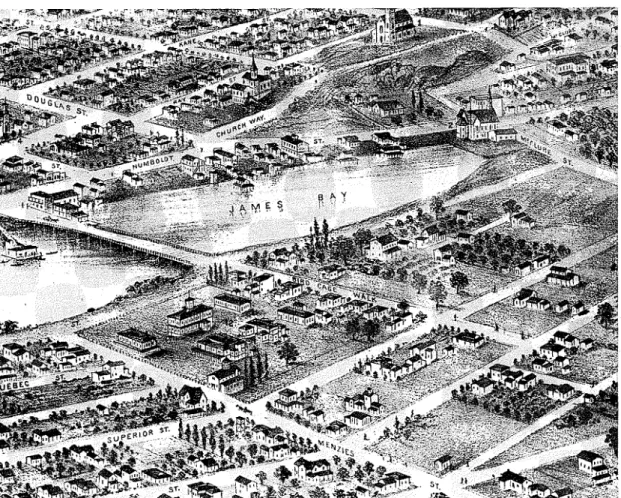
Figure 1 shows an artist's concept of the James Bay area as it was in 1878 and Fig. 2 is a view looking northeasterly across James Bay in the early 1900's just prior to filling. The present street layout around the hotel is shown in Fig. 3. The church on Blanshard Avenue and the row of houses on Penwell Street can also be identified in Fig. 2. The 100-ft (30-m) contour in Fig. 3 describes the land surface as it is today. The 80-ft (24-m) contour describes approximately the shore line in 1903 as estimated from Fig. 2. The 70-ft (21 -m) contour corresponds approximately with the bottom of the Bay according to original C.P.R. drawings. At present the grounds around the hotel are generally at eleva- tions between 94 and 102 ft (29 and 31 m ) . All elevations are relative to a bench mark
(brass plug in solid rock at elevation 102.73) immediately west of the new north wing
(Fig. 3 ) .
On 15 September 1903, the citizens of Vic- toria approved a by-law authorizing the city to transfer the necessary land to the C.P.R., to build a stone seawall on the line of the trestle bridge, and to place fill behind it.
When the situation was reviewed by C.P.R. Engineering officials in April 1904, the city had already constructed a concrete and stone retaining wall supported on 60 ft (18.3 m) timber piles and had filled in the bay behind the wall with soft mud dredged from the har- bor bottom. The pressure from this fill had caused the wall to move out some 8 in. (20 cm). The Chief Engineer objected vigor- ously to building a hotel at this location and recommended that a nearby site be purchased at the corner of Birdcage Walk and Belleville Street, across the street from the Parliament Buildings, where solid rock was visible and a good foundation assured. The provincial mu- seum was built there in 1968.
CRAWFORD AND SUTHERLAND: THE EMPRESS HOTEL 79
FIG. 1. Bird's-eye view o f James Bay area o f Victoria, British Columbia, 1878 ( f r o m the collection o f the Provincial Archives o f Victoria).
Despite the objections of his Chief Engineer, Sir Thomas could not be dissuaded from build- ing at the site he had selected, and in July 1904 the vice-president at Winnipeg, Sir William Whyte, arranged for E . C. and R. M. Shankland, outstanding foundation engineers of Chicago, to visit the site and submit their recommendations. In their report of 20 and 29 July 1904, they made certain recommenda- tions for hotel foundations at the original location and stated that if followed, the build- ing would be absolutely safe. One of the recommendations was as follows: "all the foundations, not only for the building to be erected now, but also for any proposed exten- sions, must be put in now. It would not be advisable to drive piles for any future exten- sions after this building is erected."
Geology and Soil Conclitions
When the Georgia Strait glacier melted from the Victoria region of Vancouver Island about 13 000 years before present (B.P.) , the sea flooded the land to an elevation of 275 ft (84 m ) (geodetic), and a blanket of marine silty clay, locally known as Victoria Clay, was deposited to a thickness ranging from a few feet to more than 100 ft (30 m ) . The land rose rapidly when the weight of the glacier ice was removed and by 12 000 years B.P. the sea had withdrawn below the present shoreline so that the bottom of Victoria Harbour which is now covered with 30 to 40 ft ( 9 to 1 2 m) of water was exposed to sub-aerial weathering. The weathering processes produced a brown oxidized and desiccated crust about 15 ft (4.5 m ) deep on the Victoria Clay. About
80 CANADIAN GEOTECHNICAL JOURNAL. VOL. 8, 1971
FIG. 2. View looking north easterly across James Bay in early 1900's (from the collection of the late Duncan D. McTavish of Victoria).
9000 years B.P. the sea level began to rise slowly to the present shoreline and a layer of "recent" sediments were deposited on top of the weathered crust.3
The Empress Hotel is resting on one of the deep deposits of Victoria Clay. As described earlier the natural soil at the site was covered in 1904 with varying amounts of dredged material to bring the general level up to eleva- tion 89 ft (27 m ) . Two borings at locations "M" and "N" (Fig. 4 ) were made in 1904 to establish foundation conditions for the hotel, The log of boring "M" shows 19 ft (6 m ) of dredged material over the original surface, then 11 ft (3.3 m ) of "soft mud," 1 ft (0.3 m ) of "hard pan," 8 ft (2.4 m) of "hard yellow FIG. 3. Plan of James Bay area. 3H. W. Nasmith, private communication 1969.
CRAWFORD AND SUTHERLAND: THE EMPRESS HOTEL 8 1
FIG. 4. Location of borings and soil profiles. clay" and 45 ft (14 m ) of "blue clay on gravel and sand." The log of boring "N" is similar.
As part of the foundation investigations in 1913 five wash borings (Nos. 1 to 5 ) and a hand-excavated shaft were made at locations shown on Fig. 4. The shaft had to be stopped at a depth of 89 ft (27 m ) but probing from the bottom found refusal at 109 ft (33 m ) . The wash borings gave a general impression of subsoils at the site.
In 1961 three borings were made for the C.P.R. Bus Depot located about 300 ft ( 9 2 m) southeast of the hotel (Fig. 3 ) . These revealed uniform soil conditions with about 18 ft (5.4 m ) of fill over old beach material and several feet of stiff brown clay, and:then soft blue clay extending to bedrock at a depth of 100 ft
(30 m ) .4
In 1968 the Division of Building Research contracted for sampling at four locations (68-1 to 68-4 on Fig. 4 ) and for the installation of two piezometers at depths of 30 and 60 ft ( 9 and 18 m ) near borehole 68-2. A few weeks after installation the water level in the two piezometers came to equilibrium at eleva- tion 83.5 ft (25.4 m). Samples were obtained using a thin-walled piston sampler in which the piston was fixed during insertion but was
.'A. E. Insley, private communication 1969.
uncontrolled during the sampling push. On first examination the samples appeared to be quite satisfactory, but on drying some distor- tion of the layers at the outside edge of the samples was apparent. Sampling was repeated at location 69-1 (Fig. 4 ) in 1969 using the NGI 5 0 mm fked piston sampler, but unfor- tunately it was not possible to control the piston movement satisfactorily during the sampling push owing to the nature of the drill rig. The samples obtained are completely ade- quate for profile interpretation but, as will be discussed later, their disturbance may have influenced certain test results.
On the basis of all borings, but with special emphasis on the undisturbed samples, cross- sections of the subsurface soils are shown in Fig. 4 in relation to the foundations. For con- venience, only typical foundation piles are shown but it is quite clear that most of the piles did not reach firm bearing strata.
General soil test results on the recently ob- tained samples from the southeast corner of the building are plotted on Fig. 5 to a depth of about 90 ft (27 m ) . Water contents vary from about 20 to 60 % with the liquid limit at or slightly above the water content. Consolida- tion tests indicate that the subsoil is approxi- mately normally consolidated under existing overburden and the strength measured by un- confined compression and field vane is almost constant with depth at about 0.5 tons per sq ft (0.5 tsf) (0.5 kg/cm2). The sensitivity of the Victoria clay averages about 4 when mea- sured with a laboratory static cone. It has about 40 % day-size particles.
Builclirzg Fourzdations
.On 7 September 1904 a contract was signed for construction of the foundations for the main building, as well as for contemplated future additions. The contract called for 22 000 cu yd of excavation, 2853 timber piles 50 ft (15 m ) long, 500 piles 20 ft ( 6 m) long for cofferdams, 60 500 FBM planking and timber, and 9000 cu yd concrete. Between November 1904 and March 1905, foundations for essentially the entire present hotel, except the new north wing, shown on Fig. 3 were built. The area excavated and the construction schedule are shown in Fig. 6.
82 CANADIAN GEOTECHNICAL JOURNAL. VOL. 8, 1971
FIG. 5. Log of test results.
1904, included the main central portion, the foundations put down in 1904. The extent of south wing, and the small north wing, which the building in 1908 is shown in Fig. 7. The now serves as a connection to the new north baIlroom wing was not envisaged in 1904 and wing. These were all completed by 1914 on no foundations were then put down for it but
CRAWFORD AND SUTHERLAND: THE EMPRESS HOTEL 83
- A r e 0 Excavated f o r F o u , r d a t i o r > r i n 1 9 0 4
FTG. 6. Construction schedule.
in 1912 a ballroom was considered necessary for the hotel operation. To minimize the dis- turbance to existing foundations, the portion of the ballroom between the north and south wings was carried on the 1904 foundations for those wings. The portion of the ballroom pro- jecting beyond them was carried on founda- tions built in 1914, one at each corner, with 25 timber piles at each foundation.
The new north wing extension built in 1929 on Humboldt Street is generally on good foun- dation material. Some 13 test holes were put down by churn drill, and bedrock was found at from 24 ft to 113 ft (7 m to 34 m ) below the surface, with 10 ft (3 m ) of hard packed sand and gravel above. The consultants who carried out the soil investigation for this ex- tension reported on 3 October 1928 that "Piles
84 CANADIAN GEOTECHNICAL JOURNAL. VOL. 8, 1971
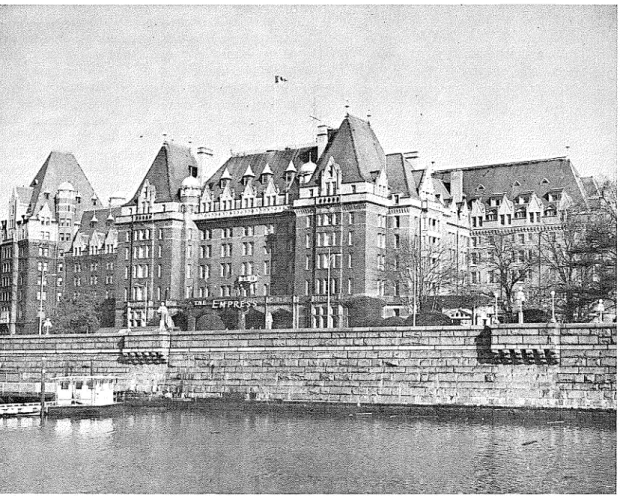
FIG. 8. The Empress Hotel, 1969. driven 5 to 7 ft ( 1.5 to 2.1 m ) into the fine gra-
vel sand strata will carry an equal load as those driven to bedrock" and "A safe working load for piles to 60 ft (18 m ) in lengths is 15 tons (13 600 kg) per pile, if longer piles are used, this should be decreased to 10 tons (9000 kg) per pile due to the bending moment in the pumped strata of the soft clay silt." In addi- tion to the piles, eight caissons 6 ft (1.8 m ) in diameter and two 7 ft (2.1 m ) in diameter were drilled to rock. The building as it is today is shown in Fig. 8.
Level Surveys
When work on the main building was started in July 1905 the footings at the south end of the building were found to be 3.5 in. ( 9 cm) lower than the other footings and they were levelled up, on the incorrect assumption that the concrete had been carelessly levelled. The
main building, as well as the basement and ground floors of the north wing, were com- pleted in 1908. The upper floors of the north wing were added in 1909 and 1910.
Plans for the south wing, prepared by another architect, Mr. W. Painter, were com- pleted in the fall of 191 1. Construction of this wing was started in October 191 1. Between then and March 1912, evidence of serious settlement of the main building was observed. The condition was so serious that Lord Shaughnessy arranged for the engineering firm of Westinghouse, Church, Kerr and Co. of New York to report on the matter.
Westinghouse, Church, Kerr and Co. im- mediately began a study of the foundation conditions, established bench marks and monu- ments around the building and grounds, ex- amined the building for level, plumb, and lateral movement, sank a timbered shaft to
CRAWFORD AND SUTHERLAND: THE EMPRESS HOTEL 85
TIME, Y E A R
FIG. 9. Time-settlement curves, 1912-1968
within 20 ft ( 6 m) of bedrock to examine soil conditions at various depths, made wash borings at 5 locations, and established move- ment indicators at a number of points around the building.
Levels were taken at 12 points at least once a month from April 1912 until September 1915 and, with few exceptions, once a year up to the present time. During 19 1 2 and 19 13, levels were taken on the exterior masonry of the building. Late in 1913, brass plugs were established around the building as permanent level monuments, and on 7 January 1914 the first set of levels on the brass plugs were taken, as well as a complete set of levels on the old points to provide correlation between the old and new readings. By this time, there were 15 points on which readings were being taken, and by 5 January 1915, there were 20 points. The record of levels from 1914 to date at 16 of these points is shown in Fig. 9.. Readings were taken by competent engineers, using rail- way levels and rods with targets, to the nearest 0.001 ft (0.03 cm).
In addition to these observations on the building, 21 points were established on the grounds around the building. Several of these
were destroyed but regular measurements were made on twelve of them from January 1914 until January 1920. Six of the original points were located on the bases of the lamp posts along Government Street and surveys on these were again carried out from 1932 until 1936. They were later destroyed due to the reconstruction of Government Street.
The greatest settlement measured on these points occurred at the lamp post approximately 130 ft (40 m ) west of point "C" on the hotel. Here the settlement was 0.34 ft (10 cm) during the 6 years beginning in January 1914 and by December 1936 the total settlement was 0.73 ft ( 2 2 cm). During this same period (1914 to 1936) point "C" settled a total of 0.44 ft (13 cm).
From time to time, between 1930 and 1958, some concern was felt about the effect of settlement on the structure, especially after regional earthquakes. At such times, the hotel staff and the Railway engineering staff made a thorough examination of the building, run- ning new levels around the building, checking tell-tale indicators at roof truss bearings, ex- amining for cracks in masonry and plaster, all in addition to the annual check of levels and
86 CANADIAN GEOTECHNICAI L JOURNAL. VOL. 8, 1971
structure. At no time was there any evidence that the building was unsafe at any point. The consultants also established reference lines for determining lateral movement, but no lateral movement of the building has yet been detected.
Settlement Contours
Records of large building settlements are almost always incomplete because they are begun only after serious distortion has been observed. The amount of movement that oc- curred during and immediately after construc- tion must, therefore, be estimated. The Empress record began in April 1912, about 5 years after the major load of structure had been applied to the underlying soil.
Fortunately, the new brass observation points installed in 1914 were carefully placed exactly at the middle of a stone "belt course" which is a prominent architectural feature all around the building, just below the ground floor windows. When the first survey was made on 5 April 1912, point "C" was already more than 1.6 ft (50 cm) lower than point "Q." Because point "Q" is located at the northeast corner where piles extend into sand and gravel, it can be assumed that it would not have settled appreciably and therefore, by 19 12, foundations under point "C" had settled more than 1.6 ft ( 5 0 cm) since construction. I t has already been noted that the footings at the south end had settled 3.5 in. ( 9 cm) more than those at the north end during the 3 or 4 months before building construction began in July 1905. It is probable that some adjust- ment was made in order to construct a level belt course while the footings were settling at different rates, in which case an unknown amount of additional settlement could have occurred at point "C."
In February 1968, level surveys were made
original level of bay mud. The lower half of the fill remained beneath the groundwater table, adding an effective load of about 0.75 TSF (kg/cm2). This load remained for about 6 months when the entire building area was excavated to elevation 76, reducing the effec- tive stress at the original level to about 0.15 TSF (kg/cm".
Wooden piles were then driven over the entire site at spacings of 2 to 3 ft (60 to 90 cm) under perimeter walls and interior foot- ings. Well over half the foundation area was covered with pile caps on which large battered piers were built to carry ,the building loads. The tops of the piers were made at about elevation 95 f t (29 m ) and the spaces between were filled with earth to elevation 86.5 ft (26.4 m ) . The ground in front of the building was graded to about elevation 100 ft (30 m ) and at the south end to about elevation 102. The foundation construction and filling were carried out from about 1 February until 1 June 1905 raising the effective stress at the original level to about 0.85 TSF (kg/cm2) under the building, and to about 1.55 TSF (kg/cm2) to the south. Most of the structural loads were added between June 1905 and June 1907 adding a further average stress of 1.1 TSF (kg/cm2) to the entire building area and rais- ing the average effective stress on the original ground (elevation 70) to about 1.95 TSF
(kg/cm2).
The estimated loading curve is shown on Fig. 11. For simplicity of calculations a single load of fill to elevation 86.5 ft (26.3 m ) is assumed to act for about 8 months followed by a constantly increasing building load until mid-1907. It is assumed that relatively little additional load was added during the finishing period of construction.
on the grounh floor and on the-second floor, and these accurately confirmed the magnitude of the slope of the building from north to south. Locations of all survey points are shown on Fig. 10 together with an interpretation of settlement contours based on an assumed settle- ment of 0.2 ft ( 6 cm) at point
''$"
"4'Loading Estimates
When the site was filled early in 1904 the surface level was brought to about elevation 89 ft (27 m ) , some 19 ft (6 m ) above the
Rates of Settlement
Point "Q" is now at an elevation of 110.4 ft (33.5 m) and is assumed to have settled about 0.2 ft (6 cm) due largely to immediate settle- ment during construction. We can also assume that every effort was made during construction to build the belt course to a constant elevation of about 110.6 ft (33.5 m ) even while the building was settling differentially. This estab- lishes point "P" on the time settlement curves in Fig. 11 at an elevation of 110.6 ft (33.5 m)
CRAWFORD AND SUTHERLAND: THE EMPRESS HOTEL
FIG. 10. Contours of settlement.
FIG. 11. Loading curve and settlements of selected points.
0 10 20 3 0
5
40 5 0 6 0 70: 8 0 : 90 1 0 0 -' 2 . 0 - S t r e s s A d d e d a t E l . 70 b y F i l l a n d S 1 r u c l ~ : r c - S t r e s s D u e t o F ~ l l a t E l . 1 0 2 ' \ L 1 . 5 - - - - -7 - -I
L F i l l a 1 E I . 8 2 ' -. 1 1 2 1 1 1-
u u L Z - z 1 1 0 - --
u > u 2 1 0 9 1 0 8 107 I 1 I I -.+-k++--+-i---+--- i - - - i - I \ \ -\? -?,+
!e"le 0 . 3"
l n 4 h i o n t h s _ E n d o i P r i m a r y C o n s o l i d a t i o n . P o i n t C1
[ S e e F i g . 121 - 'i,p I O--
- \---
Q - \ \ - \ \ - \ - \ '.
.
.---.-
- : d 8 \ : -, --
-.
-.-.-. , --. \.-, H-., - \. - - - . . -. , \. .' ---- .-.-.-.-, J-.'
--
:,c-. \ ' \.-.-.-.,
,
- -'-. -. D-.\ x. - \: - [ B e g i n S o u t h W i n g \ \. - - r E x c a v a l e t o R e l i e v e S t r e s s e s - 1 9 0 4 1 1 9 0 5 1 1 9 0 6 1 1 9 0 7 1 1 9 0 8 1 1 9 0 9 / 1 9 1 0 1 1 9 1 1 / 1 9 1 2 1 1 9 1 3 1'1914 / 1 9 1 5 / 1 9 1 6 1 1917 1 1 9 1 8 1 1 9 1 9 / 1 9 2 0 1 / 1 9 7 0 Y E A R88 CANADIAN GEOTECHNICAL JOURNAL. VOL. 8, 1971 113 I " ' I ' I
1
rn
'"'t
_ _
., . _. . , . 0 .,-
D , - = - . - * . " . . . * . * . . * - - . - - - . . . - -.. - - - - 1 8 .st ,, > , , 1 1 1 I , ,FIG. 12. Observed settlement related to logarithm of time.
during the early stages of construction. It also allows an estimate to be made of the time- settlement curve at point "C" for the period before measurements were begun in 19 12. This shows point "C" to have settled about 1.8 ft (55 cm) before 1912 and about 0.8 ft (24 cm) since 1912. The curve can be extrapolated back for an estimation of total compression in the clay subsoil using the reported settlement of 3.5 in. ( 9 cm) from March to July 1905. The estimated total is seen to be almost 43 ft
(137 cm).
Foundations for the south wing were con- structed in 1905 but the structure was not begun until October 191 1. These foundations probably began to settle as soon as they were built due to the surcharge of fill but no doubt they were levelled up in 191 1, and the belt course at point "J" would have been built to the same elevation as at point "H," then at about elevation 109.6. The construction of the south wing would have increased the rate of settlement at point "H" and this would account for the initial slope being greater than that for point "C" in Fig. 11. Point "J" settled at a greater rate since 1912 than either points "H" or "C" because the structural load was applied 6 years later.
A complete log time-settlement plot for point "C" based on Figs. 9 and 11 is shown in Fig. 12. A graphical interpretation suggests that primary consolidation was completed at the end of 1914 just 11 years after loading began. The early part of the curve will be distorted due to the 3-year loading period but it is probably a reasonable interpretation.
0 1 0 0
- ,
S c a l e - F e e l
FIG. 13. Areas excavated in 1914.
Settlement Reduction Program
It is interesting to note that the consultants, Westinghouse, Church, Kerr and Co., appre- ciated the deep-seated nature of the settlement and the importance of reducing the weight of soil surrounding the building. After extensive study it was decided in 1914 to remove 43 ft (1.4 m ) of soil from under the south end of the building and to excavate 123 to 20 ft
(3.8 to 6.1 m) of soil just outside the building as shown in Fig. 13. A reinforced concrete deck was placed over the exterior excavation. The net reduction of load achieved was in excess of 11 000 tons and the scheme had a noticeable effect on the rate of settlements.
In Fig. 11 a striking reduction in settlement rate of point "D" is seen after the soil was removed in 1914. The reduction in stresses in this area due to the removal of 20 ft (6.1 m) of soil is shown by the broken load curve at the top of the figure. A much smaller load reduction was achieved under the building, but it did have some effect on the rate of settlement at point "C." Similarly, points " H and "J" were affected by the unloading.
Consolidation Properties
Consolidation tests were carried out on samples from borings located near the south- east corner of the building where the thickness of compressible soil is greatest (Fig. 4 ) . Al- though some of these samples may have been affected by building loads, the estimated pre- consolidation pressures, recorded in Table 1 and plotted on Fig. 5, are generally less than
CRAWFORD AND SUTHERLAND: THE EMPRESS HOTEL 89
FIG. 14. Typical pressure-void ratio curves. the vertical effective stresses under the present overburden.
The best series of tests was obtained on samples from boring 69-1 at about elevation 153 ft (4.7 m ) , in the soft clay layer below the pile tips. Four tests were made on specimens with an average initial void ratio of 1.10 giving a preconsolidation pressure (p,') range from 1.72 to 2.50 kg/cm2 and a compression index C, from 0.75 to 0.81. Tests were carried out in a floating ring oedometer on specimens 20 cm2 in area and 1 or 2 cm high. A loading ratio of 3 was used for incremental loads, and pore pressures were measured on some of the specimens. The highest value of p,', 2.50 kg/cm2, was obtained on specimen 3A by load- ing at a constant rate of 1.2 kg/cm2/day giving an average testing rate equivalent to the incre- mental loading tests. Typical log pressure - void ratio curves are shown in Fig. 14 and compression - log time curves for a specimen 1 cm high, are shown in Fig. 15.
Where measured values of preconsolidation pressure are lower than existing vertical effec- tive stresses this is attributed to sample dis- turbance. Disturbance is thought to have less effect on the Compression Index and on the secondary compression rate than on the pre- consolidation pressure estimate. For compu- tations, the "soft blue clay" below elevation 50 ft (15 m ) was assumed to be normally consolidated when the dredged fill was applied in 1904.
FIG. 15. Laboratory timeecompression curves for sample 166-19-3B.
Settlement Computations
There is some uncertainty concerning the length of piles used in the foundation. As noted earlier the contract called for 50-ft ( 15-m) -long piles, but drawings prepared in 1914 by Westinghouse, Church, Kerr and Co. from original plans by F. M. Rattenbury, show 40-ft (12-m) piles ending at elevation 38 ft (12 m)
.
It is noted on the drawing that the "approximate penetration of piling corre- sponds to average penetration of test piles;" this is the only reference to test piles found in the records. Another drawing dated 1932, however, shows 50-ft ( 15-m) piling ending at elevation 27 ft (8 m ) . It is not possible to be certain which of these drawings is correct but on Fig. 4, 50-ft (15-m) piling is shown.According to Terzaghi and Peck (1967) friction piles transfer most of their load from the lower third of their length while Rutledge (1964) notes that pile groups transfer their loads to "a level close to or somewhat above the pile tips." At the south end of the building the piles extend either
+
or almost 3 their length into the soft clay depending on their actual length. It is thought, however, that due to the overall loading of the foundation area by earth fill there would be a tendency for the entire soft blue clay layer to compress, and this has, therefore, been assumed for settle- ment computations. If in reality the clay within the pile groups is not compressed significantly, the computed settlements will be too large.Although the soil samples were obtained near the southeast corner of the building the computations have been made for the south-
90 CANADIAN GEOTECHNIC :AL JOURNAL. VOL. 8, 1971
west corner (point "C") where the loading history is much simpler.
(a) Primary Consolidation
At point "C" the compressible clay is about 50 ft (15 m ) thick, from elevation 50 to elevation 0. At the middle of this layer (eleva- tion 25) the original vertical effective stress according to Fig. 5 was approximately 1.2 TSF (kg/cm". The application of dredged fill in 1904 increased the stress by 0.6 TSF (kg/cm2) to 1.8 TSF (kg/cm3) for 8 months as shown in Fig. 11. During this period an unknown amount of compression occurred in the fill itself, in the upper organic silty clay and in the soft blue clay.
During construction the area around the building was graded to its final surface eleva- tion. Consequently, the additional stresses applied to the compressible layer are fairly uniform and are, therefore, assumed to be equal to those applied at the surface as shown on Fig. 11. The final effective stresses at the middle of the layer (elevation 25 ft (7.6 m) ) are approximately 3.1 TSF (kg/cm" under the building and 2.7 TSF (kg/cm2) under the fill on the south side and at the front.
Assuming that the compressible clay layer was normally consolidated, the one-dimensional primary consolidation settlement can be ap- proximated by the following equation (Terzaghi and Peck 1967) :
AH = --- HCc log p f / p ; 1
+
e,where
H is the thickness of the layer in ft C, is the vertical compression index e, is the initial void ratio
p', is the initial vertical effective stress, and p' is the final vertical effective stress.
From Table 1 an average C, of 0.58 for the soft clay layer is assumed to apply throughout the loading history. The average e, is 1.23 at present. Assuming 10 % compression of the layer since 1904, an initial value of 1.45 is obtained for e,. Substituting in the equation gives :
( 1 ) Total settlement under the building 50 x 0.58 3.1
AH = log - = 4.9 ft 1
+
1.45 1.2TABLE 1. Consolidation properties of s o f t blue clay*
wn ,
Sample Elevation (ft) % p,' e, C,
*Average W,, % 45.8, e. 1.23, C, 0.58.
( 2 ) Settlement under the original fill at 86.5 ft 50 x 0.58 1.8
AH = log - = 2.1 ft
1 + 1 . 4 5 1.2
Assuming that the primary settlement under the original fill had been completed before construction began, the difference between 4.9 ft and 2.1 ft (1.5 m and 0.6 m ) , that is, 2.8 ft (0.9 m ) , would represent the total ver- tical compression of the soil under point "C" after the foundations were built. Part of this compression would occur before the construc- tion of the belt course had been achieved. According to Fig. 12 the actual primary con- solidation settlement is estimated to be about 4.0 ft (1.2 m ) , 0.9 ft (0.3 m) less than the computed value. The actual primary consolida- tion after construction of the belt course (be- ginning at point "P" in Fig. 12) is estimated to be about 2.2 ft (0.8 m ) .
( 6 ) Secondary (long-term) Consolidation
Following primary consolidation of a com- pressible clay, a linear relationship between settlement and the logarithm of time has been noted in many laboratory and field cases. This form of time-settlement relationship is apparent in Figs. 12 and 15. The coefficient of secondary consolidation, C,, is defined as the amount of compression in percent per log cycle of time. There is considerable disagreement on the factors which influence the rate of secondary consolidation but it is generally thought to vary with soil type, stress level, rate of loading, and temperature. From laboratory tests on Leda clay, Walker and Raymond (1968) concluded that the laboratory value of C, increases lin-
CRAWFORD AND SUTHERLAND: THE EMPRESS HOTEL
FIG. 16. C, VS. consolidation ratio p'/p,'.
1 0 8 . 0 6. 0 4 . 0 2. 0 1 . 0 " . 8 2 0 . 6 0 0 0 . 4 2 w w a s . 2
u
0 10, 0 8 0 6 0 4 . 0 2early with the Compression Index, C,, and that the field value may be higher due to greater shearing strains. Walker ( 1969) reviewed four case records and found a consistent relation- ship between C, and the ratio of the actual vertical effective stress to the preconsolidation pressure, pf/p,'.
Laboratory values of C, for the compressible clay beneath the Empress Hotel are plotted to a logarithmic scale against this consolidation ratio in Fig. 16. The values of C, were ob- tained from the straight portions of compres- sion vs. log time curves such as those presented in Fig. 15. It is considered that an envelope
enclosing the upper limits of the data in Fig. 16 is more representative of the in situ relation than the mean value. I t is noted that the lower values of C, were obtained from tests on samples from the 72-ft (22-m) depth (eleva- tion 22 ft ( 7 m ) ) . These samples also gave preconsolidation stresses less than the in situ
vertical stress and are, therefore, considered to be disturbed.
Values of C, for each field observation point may be obtained from the settlement observa- tions shown in Fig. 12 by dividing the mea- sured settlement per log cycle of time (using the latter straight line portion of each curve) C O N S O L I D A T I O N R A T I O p ' / p c
-
- - - - - - L e g e n d - - - o O e d o m e t e r T e s t s D e p t h 6 2 ' - O e d o m e t e r T e s t s D e p t h 7 2 ' - A O e d o m e t e r T e s t s D e p t h 7 8 ' - - A T r i a x i a l T e s t s D e p t h 6 2 ' & 7 8 ' - - - - - - - - -fi4A\A
\ A O A - - - A --/;:,
- - * : ; - - , % - - A.
0 d. - - - - A - - A A.I
- - - - - - - - - - --
--
- - . 5 1 . 0 1. 5 2 . 0 2. 5 3 . 0 3 . 592 CANADIAN GEOTECHNICAL JOURNAL. VOL. 8, 1971
TABLE 2. Secondary consolidation rates for various settlement points
Predicted settlement
Observed settlement rate rate
Settlement Thickness Average Estimated Average
Settlement ft per log of clay Ca average Ca
point Location cycle (ft) %/log cycle P'/P,' %/log cycle
South end of 1.04 60 1.7 1.37 1.1
:
}
south wing 0.90 60 1.5 1.25 1.3 South end of 0.50 50 1 .O 1.42 1 .Of
)
main building 0.63 45 1.4 1.28 1.2 North end of 0.25 25 1 .O 1.90 0.7}
main building 0.15 20 0.8 1.95 0.7 - - Average 1.2 1 .Oby the estimated thickness of the compressible clay beneath the observation point.
If it is assumed that primary consolidation due to the fill at elevation 86.5 ft (26.4 m ) was complete before the building loads were im- posed, the variation of p,' with depth would be given by the effective vertical stresses due to this fill as shown in Fig. 5. The final vertical effective stress may be estimated beneath various points around the building by con- sidering the subsequent loads due to building, additional filling, and excavation. From the estimated values of pl/p,' an average value of
C , may be predicted from Fig. 16. Observed
and predicted average values of C , are tabu- lated for various settlement points in Table 2. Although there is fair agreement between the observed and predicted values of C , listed in Table 2, the form of the relationship plotted in Fig. 16 is not necessarily validated because of the small point-to-point variation in the consolidation ratio. Nevertheless it is significant that the average laboratory values of C , ob- tained from recent samples correlate with the observed field secondary settlements which have been continuing for the past 5 0 years.
The long-term observations on several build- ings on the MIT campus (Horn and Lambe 1964) and on four earth fills (Keene 1965) also show reasonable agreement between lab- oratory and field rates of secondary consolida- tion. Keene suggested that the secondary com- pression might be considered to be a percent- age of the primary consolidation. On the average he estimated that for the earth fills the amount of secondary settlement per cycle of time was approximately equal to 8 % of the
primary consolidation that had already oc- curred and for the MIT buildings it averaged about 30 %. Under point "C" at the Empress the secondary settlement per cycle is about 12 % of the primary value. The long-term settlement observations on the Monadnock Block and the Auditorium in Chicago, both founded on normally consolidated clay more than 5 0 ft (15 m ) deep, yield C , values of about 0.6 and secondary settlements per cycle of 15 to 20 % of the primary settlement
(Skempton et al. 1955). Conclusions
This paper describes one of the longest and most complete records of building settlements known to exist. Fortunately the completeness of the records and the nature of the settlements permit reliable extrapolation back to the original elevations at the time of construction and even, with apparent reliability, to the period of site preparation.
The analysis is confined largely to the south end of the building where the estimated total primary consolidation is approximately 4 f t
(122 cm) in 10 years. This is followed by
4
ft (15 cm) of secondary consolidation which has continued at a constant logarithmic rate during the past 55 years.These large vertical movements are attributed to the compression of a 50-ft (15-m) layer of clay in which the average vertical stress was raised from 1.2 to 3.1 TSF (kg/cm" by the construction project. The building was con- structed more than 60 years ago, before the concept of consolidation was understood, but it is interesting to note that the engineers who be-
CRAWFORD AND SUTHERLAND: THE EMPRESS HOTEL 93 gan to investigate the settlement of the building
in 1912 did appreciate the deep seated nature of the movements and were able to reduce them by removing a large quantity of fill from under and around the structure.
In this case history a good correlation was obtained between the observed movements and those computed on the basis of laboratory tests. This is probably due to the relatively simple but substantial loading that was applied to a normally consolidated clay layer at depth, a situation that should be well approximated by one-dimensional consolidation theory. The agreement is good only for the magnitude of total settlement and for the rate of secondary consolidation. Computed rates of primary con- solidation were too far from reality to be usefully considered.
Acknowledgments
The writers are grateful to the Canadian Pacific Railway Company for making available the historical records for analysis and especially to the Chief Engineer, Mr. C. A. Colpitts, for his encouragement and cooperation. The Man- ager of the hotel at the time of the investiga- tion, Mr. L. C. Parkinson, the Assistant Man- ager, Mr. D. Wakelyn, and the Resident Engineer for "Operation Teacup," Mr. E . M. Foo, rendered invaluable advice and assistance. Thurber Consultants Ltd. kindly contributed to the supervision of the soil sampling and to
the geological interpretation of the region. Col- leagues in the Division of Building Research were especially helpful; Mr. W. H. Ball in assisting with the field work and load estimates, Mr. J. B. Bordeleau with soil testing and Dr. R. J. Mitchell in checking the manuscript and aiding in the settlement computations.
This paper is a contribution of the Division of Building Research, National Research Coun- cil of Canada, and is published with the ap- proval of the Director of the Division.
HOLLOWAY, G. 1968. The Empress of Victoria. Pacifica Productions Ltd., Victoria, British Co- lumbia.
HORN, M. and LAMBE, T . W. 1964. Settlements of buildings o n the M I T campus. Proc. Amer. Soc. Civil Eng. 90, S M 5, pp. 181-195.
KEENE, P. 1965. Discussion of Horn and Lambe, Settlements of buildings on the M I T Campus. Proc. Amer. Soc. Civil Eng. 90, SM 5, pp. 181- 195. 91, S M 5, pp. 95-107.
RUTLEDGE, P. C. 1964. Summary of Closing Address. Proc. Design Found. Contr. Settlements, Evans- ton, Illinois. Amer. Soc. Civil Eng. pp. 579-587. SKEMPTON, A. W., PECK, R. B., and MACDONALD,
D. H . 1955. Settlement analyses of six structures in Chicago and London. Proc. Inst. of Civil En- gineers, Part 1, 4, pp. 525-544.
TERZACHI, K. and PECK, R. B. 1967. Soil mechanics in engineering practice. John Wiley and Sons, Inc. New York. 729 pp.
WALKER, L. K. and RAYMOND, G. P. 1968. T h e prediction of consolidation rates in a cemented clay. Can. Geotech. J. V, pp. 192-216.
WALKER, L. K. 1969. Secondary settlements in sensi- tive clays. Can. Geotech. J. VI, pp. 219-222.