A compact structured light based otoscope for three
dimensional imaging of the tympanic membrane
The MIT Faculty has made this article openly available. Please share
how this access benefits you. Your story matters.
Citation Das, Anshuman J.; Estrada, Julio C.; Ge, Zhifei et al. “A Compact
Structured Light Based Otoscope for Three Dimensional Imaging of the Tympanic Membrane.” Edited by Bernard Choi, Nikiforos Kollias, Haishan Zeng, Hyun Wook Kang, Brian J. F. Wong, Justus F. Ilgner, Alfred Nuttal, et al. Photonic Therapeutics and Diagnostics XI, 93031F (February 2015): 1-16 © 2015 Society of Photo-Optical Instrumentation Engineers (SPIE)
As Published http://dx.doi.org/10.1117/12.2079761
Publisher SPIE
Version Final published version
Citable link http://hdl.handle.net/1721.1/110687
Terms of Use Article is made available in accordance with the publisher's
policy and may be subject to US copyright law. Please refer to the publisher's site for terms of use.
A compact structured light based otoscope for three dimensional
imaging of the tympanic membrane
Anshuman J. Das*,+, Julio C. Estrada+, Zhifei Ge, Sara Dolcetti, Deborah Chen and Ramesh Raskar,
MIT Media Lab, Massachusetts Institute of Technology, 75 Amherst St. Cambridge, MA 02139, USA
Abstract. Three dimensional (3D) imaging of the tympanic membrane (TM) has been carried out using a traditional
otoscope equipped with a high-definition webcam, a portable projector and a telecentric optical system. The device allows us to project fringe patterns on the TM and the magnified image is processed using phase shifting algorithms to arrive at a 3D description of the TM. Obtaining a 3D image of the TM can aid in the diagnosis of ear infections such as otitis media with effusion, which is essentially fluid build-up in the middle ear. The high resolution of this device makes it possible examine a computer generated 3D profile for abnormalities in the shape of the eardrum. This adds an additional dimension to the image that can be obtained from a traditional otoscope by allowing visualization of the TM from different perspectives. In this paper, we present the design and construction of this device and details of the imaging processing for recovering the 3D profile of the subject under test. The design of the otoscope is similar to that of the traditional device making it ergonomically compatible and easy to adopt in clinical practice.
Keywords: optics, 3D imaging, tympanic membrane, structured light, otoscope.
+
Equal Contribution
*Address all correspondence to: Anshuman J. Das, MIT, Camera Culture, MIT Media Lab, 75 Amherst St.,
Cambridge, USA, 02139; E-mail: ajdas@mit.edu
1 Introduction
Ear infection or otitis media (OM) is common in children and if untreated can lead to hearing loss, perforation of the tympanic membrane, developmental delays and even meningitis (1). A common consequence of OM is otitis media with effusion (OME) which is essentially fluid build-up in the middle ear. A negative pressure may occur under other conditions like Eustachian tube dysfunction leading to a retracted TM with fluid (2). This retraction is often not accurately detected by visual examination and leads to incorrect diagnosis. Current diagnosis is carried out by a preliminary visual inspection using an otoscope, which is essentially a
magnifying glass with a speculum. In the likelihood of an infection, a tympanometry exam is carried out that measures the stiffness of the TM. There are a few existing ear imaging tools that claim to detect the presence of fluid but none are in clinical practice due to their inaccurate diagnoses. There are no compact, hand held devices that can be utilized at a primary care setting to ascertain the presence of infection or fluid.
In this regard, topographical imaging of the TM appears to be a promising approach to ascertain the presence of fluid. A bulge or retraction of the TM can be imaged with 3D reconstruction techniques. There have been earlier reports of 3D imaging of the TM using digital holographic methods which studied the mechanical properties of the TM (3-7). However, holographic imaging is extremely sensitive to environment vibrations and is impractical in a clinical setting. There has been a recent report of a light field otoscope that demonstrated 3D imaging on TM phantoms (8). Moiré interferometric measurements have also been used to determine the shape and derive geometrical parameters of the human TM (9-11). Optical coherence tomography (OCT) is another technique which can provide microscopic level features of the TM (12-14). Recent reports have shown that OCT based methods can detect the formation of bio-films (15). However, OCT requires a sophisticated optical setup and may not be feasible for a portable, cost-effective solution. Additionally, most of the above mentioned approaches have been attempted only on animal test subjects or post-mortem specimens.
We present for the first time, to our knowledge, 3D topographical images of a human TM using a hand held device. We have designed and developed an otoscope that is capable of carrying out visual examination and can simultaneously image the curvature of the tympanic membrane. This device uses structured light illumination with phase shifting algorithms to detect the curvature of the tympanic membrane. Depth features in the order of 25 µm can be resolved with our device. Hence, small changes in the curvature of the TM can be detected providing clinicians with an additional visualization tool to support their diagnosis. The form factor of the device is similar to that of a conventional otoscope making it compact and portable as compared to holographic or optical coherence tomography techniques (16). The operation of the device does not require any additional training for interpretation and hence can be seamlessly adopted by clinical
2 Methods
The TM has adequate reflection characteristics in the visible spectrum to make optical imaging effective. Optically, the TM is a translucent diffuser but reflects a small amount of light. There have been reports on the diffuse optical reflectance properties of the TM which concluded that indeed the reflectance is higher in the 400-600 nm wavelength range of the visible spectrum (17, 18). Therefore, if we project white light pattern on the TM, diffuse reflections can be captured by a camera. This makes possible to apply structured light techniques to recover its 3D shape. 2.1 Optical design
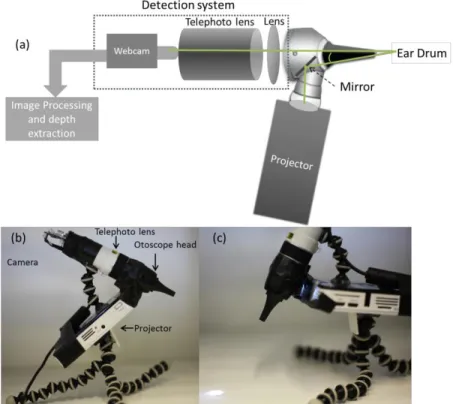
A portable LED projector was utilized for projecting structured light on the TM and the light was channeled into the ear canal using a mirror within the otoscope head as shown in Fig. 1(a). A sequence of optimized fringe patterns were projected on the TM and the reflected light from the TM was collected in the 8x telephoto lens arrangement whose output was coupled to a 1080p HD webcam with a resolution of 1920x1080 pixels as shown in Fig. 1(a-c). Due to a short focal length lens in combination with the telephoto lens, the focal plane of the optical system was approximately 1 cm from the tip of the speculum. This arrangement was ideal to capture the entire TM and magnify it to full sensor coverage. Fringe projection methods generally rely on a triangulation scheme for maximal effectiveness in determination of depth. In our setup, triangulation was carried out by intentionally misaligning the optical axis of the webcam and the projection system as shown in Fig. 1(a). This allowed the fringe projection method to work efficiently in determining the depth. Given all the parameters of the system, depth variations in the range of 20 µm can be ranged by our device.
Fig. 1 (a) Schematic of a fringe projection otoscope for 3D imaging of the TM. Triangulation is achieved by tuning the angle of the mirror with respect to the optical axis of the imaging system. (b) Photograph of the prototype with labeled components. (c) Close up view of the prototype with projected light.
2.2 Ear Phantom
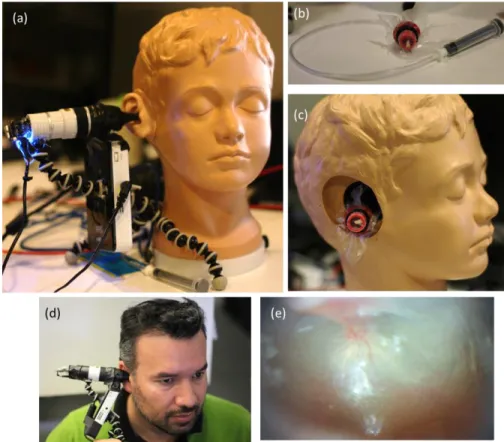
An Enasco Life/form® diagnostic and procedural ear trainer was used as an ear phantom. This trainer is anatomically accurate and the pressure in the middle ear can be varied using a tube attached to a syringe as shown in Fig. 2(a-c). The ear drum cartridge can be detached and filled either with air, water or water with a thickening agent to mimic different fluids in the middle ear.
Fig. 2 (a) The prototype being tested on the ear phantom arrangement. (b) A syringe attached to the ear drum cartridge that was used to vary pressure. (c) The TM phantom placed in the ear cavity. (d) Photograph of the prototype being tested on a volunteer. (e) A typical picture of the TM captured by the device under regular illumination.
2.3 Fringe projection and phase shifting
To obtain the 3D shape of the TM, we projected five phase-shifted fringe patterns using the modified otoscope shown in Fig. 1 and captured the reflected images. The intensity of these images was modeled in the following way:
( , ) ( , ) ( , ) x n 2 cos ( , ) n x y I x y a x y b x y x y y (1)
for n1, 2,3, 4,5; where a x y( , ) is the background illumination, b x y( , ) the contrast, ( , )x y the modulated range of the TM (in radians) and ( x, y) the fringe pattern frequency or carrier (19).
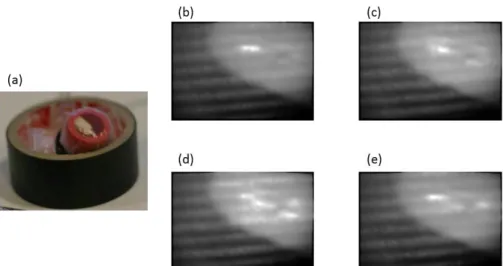
Note that the phase-shifting introduced is of / 2 radians. Figure 3(a) shows the phantom object we used for testing and Fig. 3 (b-e) shows the images of the projected fringe patterns captured by the camera attached to the otoscope. To mask the region where the fringes are visible in these
images, we applied an automatic segmentation that uses the response of the phase-shifting algorithm utilized to recover the fringe’s phase. For these purposes we combined the five images of Eq. (1) to obtain the analytic response in the following way:
1 5 2 4
3 [ ]
( , ) 2 I
f x y I I i I I , (2)
where, i 1. Equation (2) is the complex output of a 5-step quadrature filter tuned at
2
radians (19). In this equation, the dependence ( , )x y of the intensities is not explicitly shown for simplicity. Having this complex field f x y( , ), we used it to find the region of the visible fringes to mask the TM. To do this, the magnitude of Eq. (2) was taken as,
( , ) ( , )
p x y f x y . (3)
This magnitude is the response of the combination used in Eq. (2) and indicates which pixels of the image are well correlated according to Eq. (1). To segment the pixels with good response, a threshold of this magnitude was taken. This threshold is automatically adjusted by using the method presented in (20), which chooses the threshold that minimizes the interclass variance of the black and white pixels. This method works for the cases where we have a good visibility of the fringes. But for scenarios where the fringe visibility is poor, this method can leave holes in the region of interest. To remove these holes, we applied erode and dilate operators with a mask of 3 3 pixels (21). This procedure can be given as follows:
1.m x y( , )threshold[ ( , )]p x y
2. For n1 until 5:
a.m x y( , )dilate m x y[ ( , )]
3.For n1 until 5:
a.m x y( , )erode m x y[ ( , )]
For the images that were captured by the device, 5 iterations were enough to obtain the segmentation as expected. The number of iterations depends on the visibility of the fringes. We expect the same visibility when we look into the ear canal since there are no light sources other than the fringe projector. However, if the optical system or the illumination source changes, the number of iterations required for segmentation will need to be adjusted. An example of the output of this process is shown in Fig. 4(a-b).
Given the binary maskm x y( , ) from the previous procedure, we segmented the region of interest and estimated the local frequencies ( x, y) on that region. For this, the phase of the 5-step
quadrature filter given in (2) was taken as,
( , )x y f x y( , )
(4)
Then, the frequency along x was estimated in the following way:
1 1 ( , ) ˆx x( , ) ( , )x y m x y m x y
, (5)being 1 the L norm, that is, the absolute sum of its elements. In a similar manner, the 1
frequency along y was estimated as follows,
Fig. 3 Phantom object and fringe pattern projections. (a) Photograph of a phantom with positive curvature that was used for testing the algorithm. (b-f) Images obtained from phase-shifted projected fringe patterns. Typically, a set of five patterns are projected. The first and fifth have the same phase, hence only four unique patterns are shown.
Fig. 4 Response of the quadrature filter as given in Eq. (3) and (b) segmentation obtained using the procedure as shown in the text.
1 1 ( , ) ˆy y( , ) ( , )x y m x y m x y
(6) where, , ] [ { { [ x y x },y }] (7) x and x are the first order difference operator along x and y modulo 2, respectively. It is necessary to take the phase differences modulo 2 since the phase recovered by (4) is wrapped. Once the spatial frequencies ( x, y) were estimated, the range of the object under test was
obtained as,
( , ) (ˆ ˆ y)
ˆ( , ) xy i xx y x y e e . (8)As this operation gets the phase wrapped, to obtain the range correctly we applied a phase unwrapping algorithm that was demonstrated by Estrada et al. (22).
3 Results
Results obtained on phantom test samples that mimic a bulged and retracted TM are shown in Fig. 5. We projected the five fringe patterns with a speed of 3 frames per second and applied phase-shifting algorithm to reconstruct the 3D shape of the TM. A curvature that is consistent with the pressure applied to the ear drum cartridge is obtained as shown in Fig. 5.
550
(a)
/ 100
i
5o
f
20 / Spatial coordinate (arb. units)(f)
0 0 (c) 50 Spaas Co0,ona9c 92 50 900 SpaOS C00,0np,e ,50 (e) 0.8, Á0.6, t0.4,. 0.2, 0. 90 08 0, ki 06 05 80 70 60 50 Spatial Coordinate (arb. unes) 40
30 20 10 20 06 R06 04 S 02 90 Sp2ns co0,Wnxe 92 00 50 gro Spans cow..
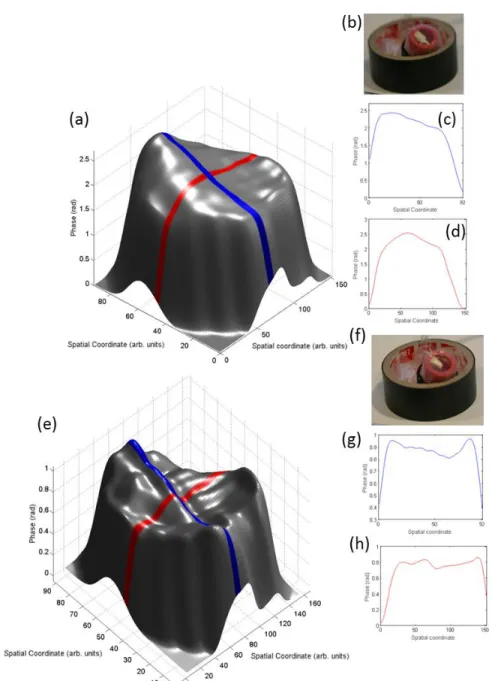
Fig. 5 3D imaging of the TM phantom. (a) Reconstruction of the phantom when a positive pressure was applied leading to a bulged surface. (b) Photograph of a bulged phantom. (c-d) Height profiles of the surface shown in (a). (e) Reconstruction of the phantom when a negative pressure was applied leading to a retracted surface. (b) Photograph of a retracted phantom. (g-h) Height profiles of the surface shown in (e). The colors of the plots in (c-d) and (g-h) correspond to the color stripes on the 3D plot in (a) and (e), respectively. Lighting variations in the 3D plots are due to rendering and do not correspond to phase variation.
Height profiles in Fig. 5(c-d) indicate a bulge in the surface of the cartridge due to positive pressure asserted by the syringe. Similarly, Fig. 5(g-h) shows a retraction due to negative pressure created by the syringe. Our prototype does not obtain the range in length units (microns) since the parameters of the projection system vary from test to test. A further discussion of this subject is presented in the next section.
Once the performance of the device was tested on TM phantoms, tests were carried out on a volunteer test subject as shown in Fig. 2(d). The device was inserted into the ear canal and positioned such that the TM was in focus (Fig. 2(e)). A sequence of fringes was projected on the TM and the reflected images were acquired after adjusting the exposure of the camera. Samples that were collected using the device on a healthy test subject show an expected 3D morphology of the TM as shown in Fig. 6(a-g).
The obtained 3D shape of the TM is similar to a conical cup which lies tilted with respect to the long axis of the ear canal as shown in Fig. 6(a-b). Cross-sectional profiles of the TM viewed from different perspectives are shown in Fig. 6(d-e) for a comprehensive description of the curvature of the TM. This is in agreement with earlier reports of 3D imaging of the TM which were carried out by several methods (23, 24). Holographic measurements on post-mortem human or cat samples show that the TM has a cup like shape with the maximum depth of about 2-3 mm.
18 s13 g 912 á 10 (d) 8 50 8 8 50 Pixels
Fig. 6 (a) A schematic showing the cross-section of the ear and the position of the TM. (b) 3D reconstructed human TM. c) Top view of the TM shown in (b) along with cross-sectional profiles shown in (d) and (e). (f) Side view of the TM and (g) as if viewed from inside the middle ear. The colors of the profile plots in (d-e) correspond to the colored stripes on the 3D plots. Intensity variations in the 3D plots are due rendering and do not correspond to phase variation.
4 Discussion
Diagnosis of ear infections is subjective due to the lack of imaging tools that are easily accessible. The device presented here can be used as a tool that adds an additional dimension to the otoscope used by physicians to aid in their inspection and diagnosis. In the past, there have been no imaging modalities that can image the TM and provide additional parameters to analyze in-vivo. 3D imaging provides a comprehensive view of the TM and can detect the presence of fluid or retraction in a quantitative manner after calibration. For a more realistic application scenario there are a few design parameters that need to be considered. Since a phase-shifting approach is being employed to recover the 3D shape, speed of acquisition is crucial as data needs
to be captured with motion in a realistic scenario. However, in our case it is almost impossible to take the five phase-shifted fringe patterns without any displacement, therefore, when recovering the phase we have detuning distortions (25). To minimize these sorts of distortions, we try to reduce the data acquisition time. Data acquisition in our case takes about 1.5s (to take all 5 images). Once the data is acquired, the processing time is negligible. To enhance the visibility of the fringes, exposure time of the captured was adjusted so that the images had a good contrast and at the same time the acquisition, synchronized with the fringe projector, is fast enough. In future, image stabilization will be necessary to minimize noise.
Currently the device can provide a quantitative description of the TM in phase units. Even though there is a direct correlation of phase with depth, a consistent conversion is difficult to arrive at. The problem with the calibration of this projection system is that its triangulation parameters (projection angle and camera-projector baseline) are not constant. As is known, fringe projection systems use the triangulation parameters to translate from radians to length-units. In this portable projection system, the position angle to project the fringes depends on the particular conditions of each individual’s ear canal. This makes almost impossible to maintain the same projection angle on each test and obtain a consistent radians to length-units translation. However, an attempt has been made to determine the sensitivity of our projection system with the help of known depths and analysis of obtained phases. Supplementary Figure S1 suggests that it may be possible to provide an active calibration based on imaging known depths (Please see Supplementary Information). There is a proportional relationship between phase and height as can be seen in the 3D reconstructions of several spacers with a height difference of 25 µm. Height differences in the range of 25 µm can be easily distinguished with our device. This will enable the device to resolve small changes in the curvature of the TM as result of a fluid build-up in the middle ear.
Conclusion
We demonstrated a fringe projection otoscope to image 3D morphology of the TM. A device is capable of providing a high resolution depth map of the TM which may be beneficial in
clinical practice. Furthermore, we envision that the device can be used in settings that do not require a skilled operator.
Acknowledgements
AJD acknowledges funding from the MIT Tata Center for Technology and Design. AJD and JCE thank Dr. Ellen Weinberg and Dr. Ayesha Khalid for feedback on the device and fruitful discussions.
References
1. D. W. Teele, J. O. Klein, and B. A. Rosner, "Otitis media with effusion during the first three years of life and development of speech and language," Pediatrics 74(2), 282-287 (1984).
2. B. Magnuson, "On the origin of the high negative pressure in the middle ear space," American journal of otolaryngology 2(1), 1-12 (1981).
3. A. A. Aarnisalo et al., "Motion of the tympanic membrane after cartilage tympanoplasty determined by stroboscopic holography," Hearing Res 263(1-2), 78-84 (2010).
4. J. Aernouts et al., "Dynamic Motion of Human Tympanic Membrane: Stroboscopic Holography Measurement and Finite Element Analysis," Optical Measurement Techniques for Structures & Systems2 (Optimess2012) 1-12 (2013).
5. E. W. Chang et al., "Simultaneous 3D imaging of sound-induced motions of the tympanic membrane and middle ear ossicles," Hearing Res 304(49-56 (2013).
6. J. T. Cheng et al., "Motion of the surface of the human tympanic membrane measured with stroboscopic holography," Hearing Res 263(1-2), 66-77 (2010).
7. J. T. Cheng et al., "Wave motion on the surface of the human tympanic membrane: Holographic measurement and modeling analysis," J Acoust Soc Am 133(2), 918-937 (2013).
8. N. Bedard et al., "Light Field Otoscope," in OSA Technical Digest (online), Imaging and Applied Optics 2014 IM3C.6 (2014).
9. W. F. Decraemer, J. J. J. Dirckx, and W. R. J. Funnell, "Shape and Derived Geometrical Parameters of the Adult, Human Tympanic Membrane Measured with a Phase-Shift Moire Interferometer," Hearing Res 51(1), 107-122 (1991).
10. J. J. J. Dirckx et al., "Volume displacement of the gerbil eardrum pars flaccida as a function of middle ear pressure," Hearing Res 118(1-2), 35-46 (1998).
11. J. J. Dirckx, and W. F. Decraemer, "Optoelectronic moire projector for real-time shape and deformation studies of the tympanic membrane," J Biomed Opt 2(2), 176-185 (1997). 12. A. Burkhardt et al., "Endoscopic optical coherence tomography for imaging the tympanic
membrane," Proc Spie 8091((2011).
13. N. H. Cho et al., "Development of SD-OCT for Imaging the in vivo Human Tympanic Membrane," J Opt Soc Korea 15(1), 74-77 (2011).
14. S. Van der Jeught et al., "Full-Field Thickness Distribution of Human Tympanic Membrane Obtained with Optical Coherence Tomography," Jaro-J Assoc Res Oto 14(4), 483-494 (2013).
15. C. T. Nguyen et al., "Noninvasive in vivo optical detection of biofilm in the human middle ear," Proceedings of the National Academy of Sciences 109(24), 9529-9534 (2012).
16. C. T. Nguyen et al., "Noninvasive in vivo optical detection of biofilm in the human middle ear," P Natl Acad Sci USA 109(24), 9529-9534 (2012).
17. M. Sundberg et al., "Diffuse reflectance spectroscopy of the human tympanic membrane in otitis media," Physiol Meas 25(6), 1473-1483 (2004).
18. Z. Schmilovitch et al., "Spectrophotometric otoscope: A new tool in the diagnosis of otitis media," J near Infrared Spec 15(4), 209-215 (2007).
19. M. Servin, J. C. Estrada, and J. A. Quiroga, "The general theory of phase shifting algorithms," Opt Express 17(24), 21867-21881 (2009).
20. N. Otsu, "Threshold Selection Method from Gray-Level Histograms," Ieee T Syst Man Cyb 9(1), 62-66 (1979).
21. "Morphology," in Digital Image Processing, pp. 501-514, Springer Berlin Heidelberg (2005).
22. J. C. Estrada, M. Servin, and J. A. Quiroga, "Noise robust linear dynamic system for phase unwrapping and smoothing," Opt Express 19(6), 5126-5133 (2011).
24. N. Yamamoto, T. Ishii, and T. Machida, "Measurement of the Mechanical-Properties of the Tympanic Membrane with a Microtension Tester," Acta Oto-Laryngol 110(1-2), 85-91 (1990).
25. J. F. Mosino et al., "Phasorial analysis of detuning error in temporal phase shifting algorithms," Opt Express 17(7), 5618-5623 (2009).
7 6 .. ... ' 584.migon.spacer...I... 559inicron spacer 533 micron spacer
,
4-v w 3 a 2--1 ...:... ... . . . : .: .f . ...;:...F... .. . 160 140 120 100 80 60 40 20Spatial Coordinate (arb. units)
100 50
Spatial Coordinate (arb. units)
Supplementary Information
Fig.S1: 3D reconstruction of a set of test spacers of several heights stacked next to each other.
The differences in the height for the spacers were 25 µm which is easily distinguished in the Fig. S1.