HAL Id: hal-02966011
https://hal.archives-ouvertes.fr/hal-02966011v2
Preprint submitted on 20 May 2020
HAL is a multi-disciplinary open access archive for the deposit and dissemination of sci-entific research documents, whether they are pub-lished or not. The documents may come from teaching and research institutions in France or abroad, or from public or private research centers.
L’archive ouverte pluridisciplinaire HAL, est destinée au dépôt et à la diffusion de documents scientifiques de niveau recherche, publiés ou non, émanant des établissements d’enseignement et de recherche français ou étrangers, des laboratoires publics ou privés.
The Employment and Job Quality Effects of Innovation
in France, Germany and Spain: Evidence from
Firm-Level Data
Richard Duhautois, Christine Erhel, Mathilde Guergoat-Larivière, Malo
Mofakhami, Monika Obersneider, Dominik Postels, José Ignacio Anton,
Rafael Muñoz De Bustillo, Fernando Pinto
To cite this version:
Richard Duhautois, Christine Erhel, Mathilde Guergoat-Larivière, Malo Mofakhami, Monika Ober-sneider, et al.. The Employment and Job Quality Effects of Innovation in France, Germany and Spain: Evidence from Firm-Level Data. 2018. �hal-02966011v2�
1
The employment and job quality effects of
innovation in France, Germany and Spain:
evidence from firm-level data
QuInn
E Working Paper No. 7
WP5 – 3 – 2018
Richard Duhautois (CNAM, LIRSA, CEET), Christine Erhel (CNAM, LIRSA, CEET), Mathilde Guergoat-Larivière (CNAM, LIRSA, CEET), Malo Mofakhami (U. Paris 1, CES) Monika Obersneider (IAQ U. Duisburg-Essen), Dominik Postels (IAQ U. Duisburg-Essen) José Ignacio Anton (Universidad de Salamanca), Rafael Muñoz de Bustillo (Universidad de Salamanca), Fernando Pinto (Universidad de Salamanca)
2 Abstract: Empirical studies focusing on the impact of innovation on employment and job quality are scarce and limited, especially at the firm level. Innovation is a complex phenomenon that is often cited as a solution to create jobs and improve their quality as well as a source of unemployment (especially for low qualified workers) and job quality deterioration. Based on a comparative study of France, Germany and Spain, this paper evaluates the impact of innovation on employment and job quality at the firm level. Its contribution is twofold: first, it uses databases including a rich set of innovation variables (CIS for France, IAB panel for Germany and ESEE for Spain) , which allows distinguishing between different kinds of innovation in a comparative perspective (product, process, organizational, following the definitions of the Oslo manual ); second, it analyzes the effect of innovation on a variety of employment variables including job quality variables (employment variation, types of contracts, wages, etc.). Using a difference-in-differences method, we find a general positive impact of innovation variables on employment, which is more pronounced for product innovation. Our results also support the presence of a skilled-biased effect of product innovation on employment and wages (especially for France) at the firm level.
3 Executive summary
Europe 2020 strategy puts the emphasis on five main targets among which rising employment, boosting innovation through R&D as well as fighting against poverty and social exclusion. These goals are presented as interrelated and mutually reinforcing. In the framework of the
Quinne project (Quality of jobs and Innovation generated Employment outcomes), this working
paper brings empirical evidence on the links between innovation, employment and job quality outcomes as well as on the potential differentiated effects of innovation on different social groups. Innovation is a complex phenomenon that is often cited as a solution to create jobs and improve their quality but can also be a source of unemployment (especially for low qualified workers) and job quality deterioration. Empirical studies focusing on the impact of innovation on employment and job quality are scarce and limited, especially at the firm level.
Based on a comparative study of France, Germany and Spain, three European countries with different innovation and employment profiles (Erhel and Guergoat-Larivière, 2016), this paper evaluates the impact of innovation on employment and job quality at the firm level. It uses an innovative difference-in-differences methodology that deals with selection bias and unobserved heterogeneity. It is based on European and national databases including a rich set of innovation variables, in order to distinguish between different types of innovation in a comparative perspective (product innovation, product innovation new to the market, process innovation and organizational innovation, in accordance to the Oslo manual typology). Contrary to most studies on the impact of innovation at the firm level, it analyzes not only the effect of innovation on total employment but also on a variety of employment variables including job quality variables (types of contracts, wages, working hours etc.) and explores the possible differentiated effects of innovation on employment and job quality for different social groups (low/high educated workers, women/men…).
Our results show that technological innovation (i.e. product and/or process innovation) has a clear positive impact on employment at the firm level in the three countries. This positive effect holds true in the case of product innovation in all three countries but also in the case of process innovation (France, Spain) and organizational innovation (France, Germany) which is less expected from a theoretical point of view that usually considers these two last types of innovation as “labor saving”.
In terms of job quality (in France and Germany), it seems that product innovation generates higher wages and employment stability (open-ended contacts in France), suggesting that firms would therefore share the benefits of product innovation with their employees. However, results are more mixed for process and organizational innovation. In France, process innovation impacts negatively the synthetic index of job quality and organizational innovation has a negative impact on wages. In Germany, process and organizational innovations increase part-time employment, which can be associated with a “labor saving” process encouraged through the use of short-time working during the crisis. Organizational innovation also seems to increase the number of low-paid workers.
Another important contribution of this working paper is to show the impact of innovation on the structure of the workforce at firm level. Our results support the hypothesis of skilled-biased effects of innovation: technological and organizational innovation seems to be more favorable to high-skilled workers while it has no significant and sometimes negative impact on
low-4 skilled workers. However, some specific effects appear across countries for some types of innovation (product, process, new to the market product innovation). Results on technological innovation are in line with the literature on learning economy and ICT use, which claims that new technology adoption, coming from product innovation, requires higher skills.
From a policy perspective, our results generally support the idea of a virtuous circle between innovation and employment but also underline the mixed effects of certain types of innovation on job quality and on employment distribution across occupations. For instance, organizational innovation (and to a lesser extent process innovation) can be related to different goals, such as upgrading quality or reducing labor cost, that do not lead to the same outcomes in terms of employment and job quality.
This study also points out that these effects are not identical in all countries: for instance, while organizational innovation has rather no effect on employment in Spain, it increases the number of jobs in the company in both France and Germany, but has different effects on wages in the two countries. Such differences may be related to national or lower-level (branch, industry, sector) institutional settings and their interactions with firms’ decisions.
5 Introduction
Since the launch of the Lisbon Strategy and through the most recent Europe 2020 Strategy, the EU has put forward the hypothesis of a positive relationship between innovation and job quality: according to this view, a growth strategy based on innovation would be a driver of better jobs in Europe (which in return could favour the development of new innovations at the workplace). However, the academic literature linking innovation and job quality remains scarce, especially at the micro level. The QuInnE project (Quality of jobs and Innovation generated Employment outcomes), which started in 2015 in the framework of Horizon 2020, addresses this gap by bringing together quantitative and case study analyses for the EU and more specifically for seven countries (France, Germany, Hungary, the Netherlands, Spain, Sweden, the UK).
This working paper belongs to QuInnE empirical analyses and focuses on the impact technological and organizational innovation may have on employment and job quality. Different hypotheses can be made in that respect. The first one is related to the leading role played by technological change in the determination of productivity, which is in turn one of the key determinants of job quality. The second mechanism is associated to the impact that technological change has on the structure of production and employment, and the implications of such changes on job quality. The third mechanism refers to the direct effect that the adoption of different technologies or new work organization may have on the working environment and the conditions of work, and the subsequent implications for job quality.
Aiming to take advantage of the availability of more detailed databases on a national basis, this study tries to identify not only correlations but also causal relationships. The objective is to analyse the behaviour of innovating (versus non-innovating) firms in terms of job creation and job quality, trying to control for selection bias (innovation is not random) using applied micro-econometric techniques (a difference-in-differences approach). It is based on several databases: IAB panel for Germany, Survey on Business Strategy (Encuesta de Estrategias Empresariales, ESEE) for Spain, and for France a matched dataset constructed using the French part of the Community Innovation Survey (CIS) and administrative data on employment (Déclaration
Annuelle des Données Sociales - DADS).
Innovation is defined in accordance to the Oslo manual (OECD, 2005; see box below), on which innovation surveys are based. The Oslo manual distinguishes four types of innovation: product, process, organizational and marketing. Product and process innovations belong to the broader category of technological innovation, whereas marketing and organizational innovations are included in the non-technological category. Marketing innovations are not considered in this working paper as their potential impact on employment and job quality is more limited. As innovation novelty also matters for employment effects, we also consider a subcategory of product innovation, which consists of innovations that are not only new to the firm, but also new to the market on which the firm and its competitors are operating. As far as employment is concerned, the working paper considers both the total number of jobs in the firm and some job quality outcomes (employment by type of contract, by occupations or qualifications, wage levels, number of hours worked). In comparison to QuInnE general job quality framework,
6 which includes six dimensions, job quality is more narrowly defined (working conditions and participation/collective presentation are absent) as a consequence of important constraints of data availability. Some indicators of wage inequalities (by gender, by occupations) are also introduced when available.
In addition to testing the general relationship between innovation and employment levels as well as job quality, the working paper develops some comparative results about the relationship between innovation and job quality in different national contexts. Indeed, the three countries analysed in this paper belong to different regimes of innovation and job quality (Erhel and Guergoat-Larivière 2016): Germany belongs to European innovation leaders with a rather good job quality on average, Spain is characterised by lower job quality and low innovation, and France stands in an intermediary position (rather high innovation but lower job quality than Germany, see quinne.eu).
The first section of the paper recalls the expected relationships between innovation on the one hand and employment and job quality on the other. The second section presents the databases used at the firm-level for France, Germany and Spain as well as definitions of the different types of innovation and discusses the comparability of data. The third section shows descriptive statistics (structural characteristics, employment and job quality outcomes) for innovating and non-innovating firms in the three countries. The fourth section presents the methodology that combines propensity score matching and a difference-in-difference approach in order to correct for selection bias and unobserved heterogeneity. The last section displays the results of this method for the three countries and shows how different types of innovation may impact employment and job quality outcomes in French, German and Spanish firms.
7 Box 1- Types of innovation according to the Oslo manual
The Oslo Manual distinguishes four types of innovation within two categories of technological and non-technological innovations.
- Within the category of technological innovation:
-A product innovation is the introduction of a good or service that is new or significantly improved with respect to its characteristics or intended uses. This includes significant improvements in technical specifications, components and materials, incorporated software, user friendliness or other functional characteristics.
-A process innovation is the implementation of a new or significantly improved production or delivery method. This includes significant changes in techniques, equipment and/or software.
- Within the category of non-technological innovation:
-A marketing innovation is the implementation of a new marketing method involving significant changes in product design or packaging, product placement, product promotion or pricing.
-An organizational innovation is the implementation of a new organizational method in the firm’s business practices, workplace organization or external relations.
- The Oslo manual also allows defining a degree of novelty for innovations.
The minimum entry level for an innovation is that it must be new to the firm. Innovations are said “new to the market” when the firm is the first to introduce the innovation on its market. The market is simply defined as the firm and its competitors and it can include a geographic region or product line. The geographical scope of new to the market is thus subject to the firm’s own view of its operating market and thus may include both domestic and international firms. In this paper, innovations that are new to the market will sometimes be named as ‘radical’. Source: OECD (2005) Oslo Manual Guidelines for collecting and interpreting data on innovation
8 1-The employment impact of innovation at the firm level: existing evidence and further questions
The economic literature has extensively investigated the links between innovation and employment, both at the macroeconomic and sector or firm level. In this working paper, we focus on firm level evidence, addressing two main issues: the impact of innovation on employment and job quality, and the effect of innovation on employment by skill. Our literature review includes international literature with a specific focus on the three countries on which our empirical analyses have been conducted.
-Innovation and employment
According to standard economic theory, technological innovation is likely to have ambiguous effects on total employment at the firm level (Van Reenen, 1997; Van Roy et al, 2015). Two types of innovation are generally considered: product innovation (inducing a change in the production technology but also in the demand function) and process innovation (i.e. changes in the production function). Process innovation may decrease the level of employment through a direct labour saving effect: i.e. the required level of employment for a given output decreases when an innovation is implemented. However compensation mechanisms might mitigate or even overcome that negative impact: i.e. such process innovations also reduce the effective cost of labour and may lead firms to increase output and thereby leading to employment growth. The size of these compensation effects depends on the institutional and economic context (degree of competition on the goods market, demand elasticities, wage adjustments mechanisms, etc.). Product innovation leads to the opening of new markets or to an increase in the range or quality of products, which should have a job creation effect. However, even in that case, some contradictory mechanisms can be at play. Indeed, some old products might be displaced by the new ones, reducing the positive effect on employment. In the end, economic theory suggests ambiguous effects of innovation at the firm level, although they are more likely to be positive in the case of product innovation.
Empirical analysis at the micro level of the links between innovation and employment has been developing since the 1990s (for a detailed review, see Van Roy et al, 2015, Vivarelli, 2014). Following several studies based on cross-section data (and therefore unable to control for firms’ unobserved heterogeneity), most recent papers use panel data to deal with unobserved heterogeneity and endogeneity issues. Van Reenen (1997) uses a British panel of 589 firms in the manufacturing sector over the period 1945-1983, and finds a positive effect of technological innovation (defined quite narrowly using an experts’ database) on employment at the firm level. That effect is persistent over several years, and is larger for product innovation. Greenan and Guellec (2000) also find a positive impact of both types of technological innovation on employment changes at the firm level using a sample of 15 186 French manufacturing firms from 1986 to 1990. However, at the sectoral level, the effect of process innovation becomes negative, which might be explained by the existence of substitution or effects where innovating firms gain market share at the expense of non-innovators. On the basis of a panel of 575 Italian manufacturing firms, Piva and Vivarelli (2005) also find a positive effect of technological
9 innovation on employment –even when they control for a potential business stealing effect by introducing a sales variable. For German manufacturing firms observed over the period 1982-2002, Lachenmaier and Rottman (2011) confirm a positive effect, which appears even higher for process than for product innovation. Furthermore, their results show a time-lag between an innovation and its effect on employment, which stresses the need to use panel data when investigating innovation related outcomes. In an earlier study, Peters (2004) also obtained a positive impact of product innovation on employment using CIS 2001 data, and more heterogeneous effects for process innovation (negative in the manufacturing sector but not in the service sector). For Spain Alonso-Borrego and Collado (2002) as well as Llorca and Gil (2002) and more recently Heijs et al. (2015) using longitudinal data of Spanish manufacturing firms from the Survey on Business Strategies, conclude that technologically innovative firms tend to create more – and to destroy less – employment than non-innovative firms. This effect is stronger in firms with process innovations.
In the three countries we are focusing on, the only study that goes beyond global employment effect and considers some dimension of job quality (in the present case the type of employment contract) is based on Spanish firm data (from CIS). Giuliodori and Stucchi (2012) analyze the relationship between innovation and temporary and permanent jobs before and after a change in the employment protection legislation (EPL) in Spain that took place in 1997 (a reduction in unfair dismissal compensation). The authors find that: (a) product and process innovation create jobs, (b) before the change in the EPL innovations had no effect on the number of permanent workers and all the increase in employment was explained by the increase in the number of temporary workers, (c) after the change in the EPL, innovations increased the number of both temporary and permanent employees.
On the whole, such national studies support the hypothesis of a positive employment effect of innovation at the firm level, and highlight some differences when disentangling between product and process innovation. However, these differences are not clear cut, and empirical results do not clearly validate the idea that process innovation would be less favorable on employment.
A few studies are also available on European databases, using different sources and definitions of innovation (based on patents in Van Roy et al, 2015; on R&D expenditures in Piva and Vivarelli, 2017; on sales growth declared by firms in the Community Innovation Survey in Harrison et al, 2014 –with a focus on Spain, France, Germany and the UK). They generally take a broader perspective than the previously mentioned national studies and include services as well as manufacturing firms. The results confirm a positive effect of innovation on employment, as well as some differences between process and product innovation when the distinction is available (Harrison et al, 2014). Indeed, the former type of innovation (process only) is found to have a negative impact on employment in the manufacturing sector. Differences by sectors are also found in these studies and show the importance of studying services and manufacturing together and separately. As far as cross-country heterogeneity is concerned, Harrison et al (2014) find very similar results for the four countries they analyze.
10 In the present working paper, we build on these results and disaggregate our analyses by types of innovation –following the Oslo manual typology- as well as by sectors when the information is available (manufacturing, retail and services). We also consider three countries that belong to different clusters of innovation according to comparative studies, even if existing micro studies obtain similar results across countries. Besides we will adopt a job quality perspective as much as possible given data constraints, and go beyond employment effects by considering also the types of labour contracts (permanent vs temporary), wages and working time.
-Innovation and employment by skills
Another important issue raised by the economic literature on the impact of innovation concerns the diversity of employment effects by skills. Indeed, the hypothesis of skill biased technological change assumes that innovation would be favorable to higher-skilled employment and destroy low-skilled jobs. Many empirical studies have provided support for such a hypothesis on national sector and firm level data. For the US, Autor et al (1998) related the employment shift in favour of skilled labour to firms’ investments in computers and R&D in both manufacturing and non-manufacturing sectors. As far as European countries are concerned, Machin (1996) also found a positive relationship between the use of computers and skilled labour on firm data for the UK. For France Mairesse et al (2001) confirm that positive relationship exists between the use of Information and Communication Technology (ICT) and skilled labour in cross section, even if only the negative relationship between ICT and low qualified workers is robust in a time series perspective (from 1986 to 1994). For Germany, Falk and Seim (1999) show that firms devoting more resources to ICT employed more educated workers, even if the magnitude of the relationship was small. Machin and Van Reenen (1998) take a cross-national perspective based on a panel at the manufacturing sector level for seven countries (including France and Germany) and show that the relative demand for skilled workers is positively linked to R&D expenditures. Although it focuses on a restrictive definition of innovation (R&D, and more specifically computers, ICT), that literature shows the importance of decomposing the global impact of innovation on employment by skills.
In that perspective, our analysis will also take into account a more recent literature on jobs polarization, although the relationship with innovation at the firm level is less direct. The jobs’ polarization hypothesis has recently been put forward in the economic literature and in the political debate, following several empirical studies (Autor, 2015; Goos et al, 2014; Eurofound, 2015). Jobs’ polarization describes the process by which low qualified and highly qualified jobs are simultaneously created in most economies, while middle occupation jobs are disappearing. However, the level of analysis when considering polarization differs from previous studies mentioned above: analyses of job polarization are generally conducted on the basis of aggregate employment data (decomposed by occupations or wage levels)1. Besides, the
links between polarization and technological change or innovation rely on the hypothesis of routine task replacement under technological change (Autor, 2010) that would affect more particularly job opportunities in middle-skilled clerical, administrative, production, and
1 Although one recent paper confirms the existence of polarization in France on the basis of firm data (Harrigan et
11 operative occupations. Such a hypothesis is more specific than the general concept of innovation and it is not the exclusive factor to explain polarization: some labour supply or labour market regulation changes are also considered in that literature (Autor, 2010).
-Our research questions
The present paper will contribute to the literature by answering the following questions: -what are the employment and job quality effects of innovation? Do they differ by category of innovation (product, process, organizational)?
-what are the effects of innovation on employment and wages by occupations? Do we observe a skill biased technological change as in most firm level empirical studies (i.e. job creation at the upper skill levels and some negative impact for low skilled jobs), or some polarization trend (i.e. job creation at the lower and upper skill levels and destruction in the middle)?
-do these impacts vary across countries which are characterized by different innovation and labour market regimes?
We will do so by taking a difference in difference approach that enables correcting for problems of endogeneity and unobserved heterogeneity (and therefore identifies causal effects), and will be applied to three national datasets.
2-Data bases
As mentioned before, different types of innovation can be identified. Databases used in this comparative analysis of French, German and Spanish cases all distinguish between technological and non-technological innovations. Technological innovations can be either product innovations or process innovations while non-technological innovations considered here are organizational innovations. Among product innovations, we can distinguish innovations that are “new to the market” namely new or significantly improved products firms introduced onto their market before their competitors (this information is not available for Spain). This subcategory can be seen as a proxy for more radical product innovations.
France
We use three different databases at the firm level: the Community Innovation Survey (CIS 2012), Déclarations Annuelles de Données Sociales (DADS) and fiscal data (FARE-FICUS). The Community Innovation Survey has been designed at the European level to collect data on activities in enterprises following the Oslo manual and its typology of innovation (see box 2). It is conducted every two years in every EU member state: the last available surveys are 2012 and 2014, and the first edition dates back to 1993. In France the sample includes about 23 000 enterprises in the private sector. DADS are administrative data on employment, collected every year on the basis of firms’ compulsory declarations. They include information collected at the establishment level in the private sector about employment, by occupation and gender, as well
12 as about working hours and the types of contracts (fixed-term or permanent) and their duration. FARE-FICUS include standard accounting data used by the administration to collect taxes on benefits etc. These three data bases can be merged at the enterprise level. Table A1.1 in appendix presents the variables used in our analyses.
The general framework for analysis is the following. To analyze the impact of innovation, we consider firms that are in CIS 2012 (= we know if they are innovating or not between 2010 and 2012), for which we have information about employment, job quality and different controls (rate of return, productivity, etc.) in 2009 and 2013. That is how we can analyze the impact of innovation on employment and job quality.
Matching CIS (17851 firms) with DADS and FARE, we finally get a sample of 14204 firms. Box 2: definition of innovation according to CIS 2012 (source: CIS questionnaire)
“This survey collects information on your enterprise’s innovations and innovation activities during the three years 2010 to 2012 inclusive.
An innovation is the introduction of a new or significantly improved product, process, organizational method, or marketing method by your enterprise.
An innovation must have characteristics or intended uses that are new or which provide a significant improvement over what was previously used or sold by your enterprise. However, an innovation can fail or take time to prove itself.
An innovation need only be new or significantly improved for your enterprise. It could have been originally developed or used by other enterprises.”
Germany
The following firm-level analyses focusing on Germany are based on the data from the Institute for Employment Research (IAB) Establishment Panel which is a representative employer survey on occupational measures and employment. Annually, approximately 16.000 establishments from all industries and all establishment sizes are surveyed nationwide. The IAB Establishment Panel was first conducted in 1993 in Western-Germany and 1996 in East Germany. The study is carried out annually ever since, offering extensive and unique longitudinal data at the firm-level in Germany. The sampling is based on the data from the Federal Employment Agency (Bundesamt für Arbeit) which contains roughly two million employers, whereas the population of the IAB Establishment Panel consists of all establishments with at least one employee who are subject to mandatory social insurance contributions. The sample is drawn disproportionately and is stratified according to establishment size, industry and federal state. The survey is carried out through computer assisted personal interviews with representatives of the establishments (for more information see Fischer et al., 2008).
13 Box 3: Definition of innovation according to IAB (source IAB 2013 questionnaire)
- In the last business year of 2012, did your establishment improve or further develop a product or service which had already been part of your portfolio?
- In the last business year of 2012, did your establishment start to offer a product/service that had been available on the market before?
- Have you started to offer a completely now product or service in the last business year of 2012 for which a new market had to be created?
- Did you develop or implement procedures in the last business year of 2012 which have noticeably improved production processes or services?
The general framework for the statistical analysis follows the overall comparative structure of this paper. For a better temporal comparability with French data, the IAB panel is delimited to the years 2009 to 2013, whereas innovation is captured in the years 2010, 2011 and 2012. This means that only firms for which we have balanced data over 5 years can be analyzed in the following. Through panel attrition and item or unit non-response the overall sample size consists of 9.416 firms.
Spain
The database used for the Spanish case is the Survey on Business Strategy (Encuesta de
Estrategias Empresariales, ESEE). The ESEE is an annual survey run by the public Sociedad Estatal de Participaciones Industriales Foundation, which is part of the Spanish Ministry of
Industry and represents the umbrella entity for all the State’s participations in industrial firms. The survey was developed to study the strategic behavior of Spanish manufacturing firms and annual and running continuously since 1990. Our analysis focuses on the period 2002-2010, which is the period when the database has the highest-quality information (with no discontinuities and comprising all our variables of interest).
The ESEE consists of a panel of manufacturing firms, with a sample averaging 1857 firms and with an average response rate of 91%. The universe of the survey is manufacturing firms -Divisions 10 to 32 of NACE-2009 excluding 19 (Manufacture of coke and refined petroleum products) - with 10 or more employees. All firms over 200 employees are included in the sample, while smaller firms are selected by stratified sampling. Attrition is minimized by maintaining close contact with firms, and compensated, when it happens, by adding new firms meeting the criteria used in the first round of the survey: all new firms with more than 200 employees and 5% of new firms from 10-200 employees.
Apart from information on relevant markets, accounting and foreign trade, the survey has extensive and detailed information on the firms and their innovation activities and more basic information regarding employment. Some of the relevant variables (such as the number of high- and medium-educated workers) are only available every 4 years. Our analysis uses two intervals of time, 2002-2006 and 2006-2010, which include 1,603 firms and 2,298 firm-year and 4,596 firm-year observations, respectively. It contains information on product, process and
14 organizational innovation (in the latter case, only for the interval 2006-2010, see Box 4 for further details). The variables related to employment and job quality available in this database are total employment, permanent and temporary employment, number of workers by educational attainment (allowing distinguishing between engineers and workers with a long university degree -which we label as high-educated workers-, technical engineers, workers with a short university degree and assistants with a relevant degree -medium-educated workers- and the rest of the firm workforce), expenditure per worker on external training and hourly labour costs.
Box 4: Definition of innovation according to ESEE (2010 questionnaire)
- State if, in 2010, the firm obtained any product innovations (new products or modification of existing products that are so important that are different from those produced earlier).
- State if, in 2010, the firm introduced any relevant change in the process of production or distribution (process innovation) referring to new machines and equipment, new techniques or methods or new software linked to production processes.
- State if, in 2010, the firm introduced new organization methods related to new economic practices of organizing work (either in the routines or in the distribution of responsibilities) or new methods of managing external relations with other firms or public institutions (providers, customers, etc.).
The databases used in the three countries enable us to have a good comparability of innovation definitions and concepts, as they all use the typology of the Oslo manual and distinguish between product, process and organizational innovation. For the French and German cases we have additional information about the novelty of product innovation (“new to the market” or only to the firm). As far as employment is concerned, despite some country specificities, we have the same basic information about employment levels in the firm and some decomposition by gender, occupations or skill levels, the type of contract and wages or hourly labour costs. The nature of the surveys is different, as Spanish and German analysis rely on a panel whereas for France CIS is a cross section survey. But it provides information on a period of three years and using our administrative data we can compare firms at two points in time. The periods finally covered in France and Germany are therefore the same. In the case of Spain it remains different to get better quality of data, and the scope of the survey is also different since only manufacturing sector is included.
15 3- Descriptive statistics
3.1 France
-Types of innovation and characteristics of innovating firms in France
In the French sample, based on CIS data matched with administrative data, we only consider firms where innovation activities were not abandoned over the 2010-2012 period. Considering only firms where innovation activities were successful, about 40% of firms have developed a
technological innovation between 2010 and 2012. About 30% have introduced a significantly
improved product and about the same proportion (29%) has introduced a significantly improved
process. These figures show that a significant proportion of firms that introduced a
technological innovation between 2010 and 2012 innovated both in terms of product and process. Among product innovations, about two thirds are “new to the market” which corresponds to about 21% of all firms in our sample.
Moving to non-technological innovation, we can observe that 37% of firms have introduced an organizational innovation.
Table 1. Share of innovating firms by type of innovation (between 2010 and 2012) Type of innovation
Share of innovating firms
Product or process innovation (technological innovation) 40,8%
Product innovation 30,5%
Product innovation new to the market 21,4%
Process innovation 29%
Organizational innovation 37,1%
16 Table 2: Characteristics of innovating and non-innovating firms with the regards to the type of innovation (technological, product, process, new to the market, organizational) - France Total Technological innovation Product innovation Process innovation New to the market product innovation Organizational innovation
YES NO YES NO YES NO YES NO YES NO
Industry Manufacturing 57,5% 62,9% 53,8% 62,8% 55,2% 63,8% 54,9% 62,9% 56,0% 56,6% 58,0% Retail 14,5% 9,7% 17,8% 8,3% 17,2% 9,7% 16,4% 8,0% 16,3% 13,6% 15,0% Other services 28,0% 27,4% 28,5% 29,0% 27,6% 26,5% 28,6% 29,1% 27,7% 29,7% 27,0% Size (nb of employees) < 20 37,1% 27,4% 43,9% 24,7% 42,6% 27,6% 41,0% 23,5% 40,9% 29,4% 41,7% 20 to 49 31,1% 27,4% 33,6% 26,7% 33,0% 26,6% 32,9% 26,0% 32,4% 29,7% 31,8% 50 to 499 26,1% 34,8% 20,0% 36,7% 21,4% 34,6% 22,6% 36,8% 23,2% 31,6% 22,8% 500 to 999 3,4% 5,9% 1,6% 6,5% 2,0% 6,1% 2,2% 7,4% 2,3% 5,1% 2,3% > 1000 2,4% 4,5% 0,9% 5,4% 1,1% 5,1% 1,3% 6,4% 1,3% 4,2% 1,3% Part of a group In a group 46,0% 56,2% 39,1% 58,8% 40,4% 56,6% 41,7% 61,3% 41,9% 53,9% 41,4% Not in a group 54,0% 43,8% 60,9% 41,2% 59,6% 43,4% 58,3% 38,7% 58,1% 46,1% 58,6% Age (mean) 27,9 28,64 27,39 28,62 27,58 29,02 27,44 28,47 17,74 28,19 27,73
Rate of return (mean) -0,199 0,412 -0,62 0,575 -0,539 0,530 -0,497 0,784 -0,467 0,215 -0,46
Productivity (mean) 66,35 72,76 61,93 75,84 62,19 70,39 64,70 78,93 62,93 69,80 64,32
Nb. Obs. 14204 5792 8412 4327 9877 4118 10086 3039 11165 5265 8939 Source: CIS 2012-FARE 2009 2013-DADS 2009 2013, matched data, authors’ calculations
Focusing on technological innovation, we observe that innovating firms have specific characteristics: 63% of the firms are in the manufacturing sector while only 10% are in the retail sector. Among non-innovating firms, only 54% of the firms are in the manufacturing and 18% in the retail sector. The proportion of firms in the service sector is similar among innovating and non-innovating firms. Technological innovations thus seem to be more concentrated in the manufacturing sector while it is limited in the retail sector. This holds true when we look at subcategories of technological innovation (product, process or new to the market product innovations). Conversely, we can observe that the distribution across sectors of firms which have implemented an organizational innovation is very similar to the overall distribution in the sample (about 57% in manufacturing, 14% in retail and 29% in other services).
The effect of firm’s size also appears clearly. Innovating firms are much more likely to be large firms (from 50 to 499, from 500 to 999 or above 1000 employees) and much less likely to be small firms (<20 or from 20 to 49 employees). For instance, among technological innovating firms, 4,5% have more than 1000 employees while this proportion is reduced to 0,9% for non-innovating firms. This size effect is reinforced for new to the market product innovations: 6,4% of these firms have more 1000 employees. Among firms implementing organizational
17 innovations, we can also notice an overrepresentation of big firms, in the same proportion as for technological innovating firms (4,2% of them have more than 1000 employees).
Innovating firms are also more frequently part of a group. While about 46% of firms in our sample are part of a group, this is the case for 56% of technological innovating firms and only for 39% of non-innovating firms. This effect is less marked for firms that implement organizational innovations (54% among innovating ones and 41% among non-innovating ones) while it is stronger for firms which have introduced a product innovation new to the market (61% of these firms are in a group).
Innovating firms are slightly older on average than non-innovating ones. The difference is more marked for firms that have introduced an innovation of product that is new to the market. On average, rate of return and productivity seem to be higher in innovating than in non-innovating firms, especially in the case of product innovation and even more if the product is new to the market.
-Employment and job quality in innovating firms (compared to non-innovating firms) in France
On the basis of our matched sample of firms we can compare innovating and non-innovating firms according to a number of indicators of employment and job quality. These indicators are summarized in Tables 3 and 4 for 2009. While the econometric part (section 5.1) will use
differences in the number of employees, descriptive statistics rather show shares of different
types of workers in innovating and non-innovating firms in order to reduce the strong ‘size effect’ noticed in the previous section.
Tables 3 and 4 show that innovating firms have higher total workforce than non-innovating ones (whatever the type of innovation: product, product new to the market, process or organizational innovation). Shares of open-ended and temporary contracts are similar in the total sample and in subsamples of innovating and non-innovating firms, for all kinds of innovation. The average number of hours worked per employee is also very similar in all subsamples though slightly higher in firms that developed a product innovation new to the market. In terms of wages, some differences are noticeable: average hourly gross wage and average gross wage are higher in innovating firms and this is particularly true for firms innovating in products and even more when products are new to the market. Innovating firms also seem to have a different structure of their workforce in terms of skills2: they display lower shares of manual workers whereas they have higher shares of managers and professionals as well as technicians and associate professionals. They also have higher share of women workers.
2 PCS in French data are not always easily comparable to European or other countries’ classifications. In this paper,
we will use the following terms:‘managers and professionals‘ for French cadres which corresponds to ISCO 1-2, ‚Technicians and associate professionals‘ for French professions intermediaires which corresponds to ISCO 3-4 and ‚Manual workers‘ for French ouvriers and employés which corresponds to ISCO 4-9.
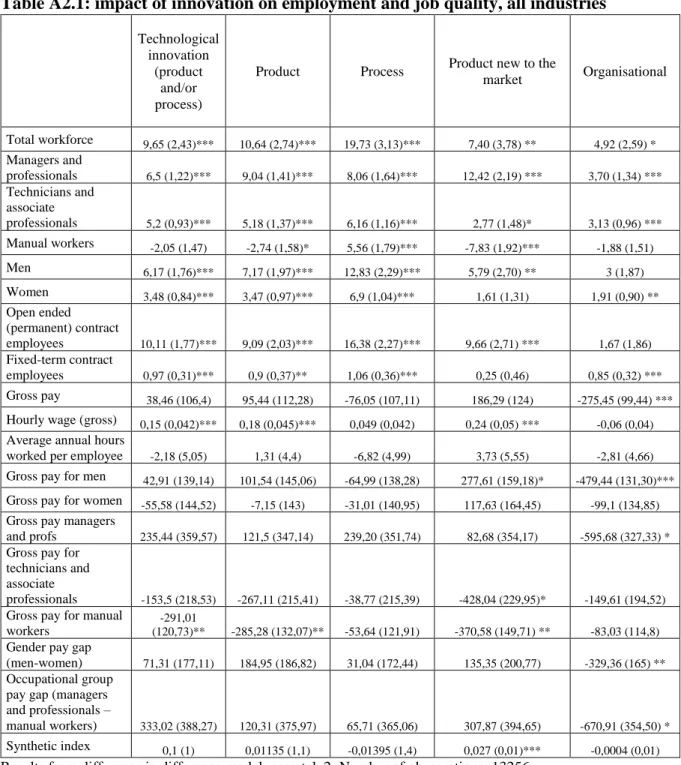
18 Table 3: Job quality and employment according to firms’ innovation status (technological, product and process innovations)
Total Technological innovation Product innovation Process innovation
YES NO YES NO YES NO
Total workforce 176,36 285,59 101,15 327,15 110,30 308,02 122,60
Share of open-ended contracts 95% 95% 95% 95% 95% 95% 95%
Share of temporary contracts 5% 5% 5% 5% 5% 5% 5%
Share of technicians and associate professionals 19% 21% 17% 22% 17% 21% 18%
Share of manual workers 63% 56% 68% 52% 68% 58% 65%
Share of managers and professionals 17% 22% 14% 25% 14% 20% 16%
Share of women 29% 30% 28% 31% 28% 30% 28%
Number of hours (annual)
1587,1 4 1587,6 8 1586,7 6 1591,7 5 1585,1 2 1586,3 7 1587,4 5 Synthetic index of JQ 0,02 0,04 0,00 0,06 0,00 0,03 0,01
Hourly gross wage in euros 18,60 19,77 17,79 20,43 17,80 19,41 18,27
Gross wage 29649 31541 28347 32682 28320 30935 29124
Gross wage for men 31937 34144 30412 35510 30368 33374 31348 Gross wage for women 26012 27183 25184 27849 25186 26817 25676 Gross wage for manual workers 22956 23356 22681 23686 22638 23287 22820 Gross wage for managers and professionals 51488 51545 51442 51801 51322 51432 51514 Gross wage for technicians and associate professionals 31706 31658 31744 31607 31756 31706 31706
Gender wage ratio (W/M) 0,86 0,83 0,87 0,81 0,87 0,83 0,86
Source: CIS-FARE-DADS matched data, authors’ calculations. For number of hours, synthetic index, wages and gender wage ratios average values are displayed. Gross wages are annual.
Most of the differences observable in the structure of skills are reinforced for firms that innovate through a product innovation new to the market: these firms display even lower (resp. higher) shares of manual workers (resp. managers and professionals).
Decomposing gross wages by profession, we can observe that gross wages are generally higher in innovating firms for managers and professionals (except for organizational and process innovation) as well as for manual workers for all types of innovation. On the contrary, gross wages are slightly lower for technicians and associate professionals (except for product innovation new to the market).
Gender wage inequalities seem higher in innovating firms than in non-innovating ones: the ratio of women’s gross wage on men’s gross wage is indeed lower in innovating firms (e.g. 0,83 in technologically innovating firms and 0,84 in organizational innovating firms against 0,87 in non-innovating ones). The difference is even more marked in firms developing product innovations (0,81).
A synthetic index of job quality that includes some information about open-ended contracts, hours of work, hourly wages and gender wage gap is also calculated and seems to be higher in innovating firms than in non-innovating ones whatever the type of innovation considered (product, process, new to the market or organizational innovation).
19 Table 4: Job quality and employment according to firms’ innovation status (new to the market product innovations and organizational innovations)
New to the market product
innovation Organizational innovation
YES NO YES NO
Total workforce 364,49 125,15 266,57 123,22
Share of open-ended contracts 95% 95% 95% 95%
Share of temporary contracts 5% 5% 5% 5%
Share of technicians and associate professionals 23% 18% 21% 18%
Share of manual workers 49% 67% 57% 66%
Share of managers and professionals 27% 14% 21% 15%
Share of women 31% 28% 30% 28%
Number of hours 1599,05 1583,89 1586,16 1587,72
Synthetic index of JQ 0,08 0,00 0,04 0,01
Hourly gross wage 21,03 17,94 19,48 18,08
Gross wage 33814 28515 31000 28853
Gross wage for men 36793 30612 33461 31037
Gross wage for women 28558 25303 26913 25472
Gross wage for manual workers 24094 22649 23438 22673
Gross wage for managers and professionals 52165 51265 51141 51719 Gross wage for technicians and associate professionals 31787 31682 31671 31729
Gender wage ratio (W/M) 0,81 0,87 0,84 0,87
Source: CIS-FARE-DADS matched data, authors’ calculations. For number of hours, synthetic index, wages and gender wage ratios average values are displayed.
20 3.2 Germany
-Types of innovation and characteristics of innovating firms
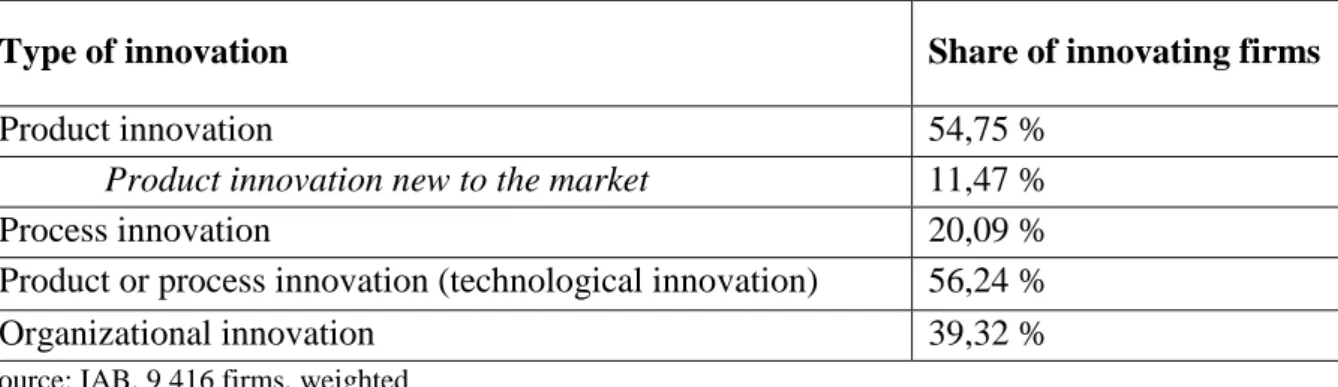
Based on the IAB survey it is possible to distinguish five types of innovations relevant for this study. First, product innovation is conducted through three items in the questionnaire representing the improvement or further development of products or services, development of a new product or service which is new to the firm, but has been available on the market before and/or developing a new product which is new to the market. If one of the items is applicable for a firm in the years 2010 to 2012, it will be defined as a firm with a product innovation. This holds true for nearly 55% of the firms. Second, the most severe product innovation – new to the
market innovation with approx. 12% of the firms - will also be analyzed separately in the
following. Third, process innovations which have noticeably improved production processes or services in those three years will be analyzed. Fourth, technological innovation is conducted using the above described innovation of product or process innovation forms. There exists a high correlation between firms, which implement a product innovation and firms which carry out a process innovation, as seen inter alia in the overlapping shares of firms with both process and product innovation. Fifth, organizational innovation capturing changes in responsibility and decision-making structures, quality management, introducing team work, etc. is considered separately. This innovation type can be found in ca. 40% of the companies.
Table 5. Share of innovating firms by type of innovation (between 2010 and 2012) - Germany
Type of innovation Share of innovating firms
Product innovation 54,75 %
Product innovation new to the market 11,47 %
Process innovation 20,09 %
Product or process innovation (technological innovation) 56,24 %
Organizational innovation 39,32 %
Source: IAB, 9 416 firms, weighted
Table 6 shows the relationship between firm size and innovation. Technological innovation can be detected in nearly 80% of large companies, whereas approx. 54% of the companies with less than 20 employees have conducted a technological innovation during the analyzed years. New to the market innovation is in the line with this finding – in comparison with ca. 10% of innovation is small companies, nearly 30% of large firms have brought out an innovation which is new to the market. The increase in the share of firms having implemented an organizational innovation is also in line with the higher number of employees in companies.
21 Table 6. Firm size of innovating and non-innovating firms with regards to the type of innovation (technological, new to the market, organizational) - Germany
Number of employees Technological innovation (product and process) New to the market product innovation Organizational innovation < 20 employees 53,89 10,28 34,75 20 to 49 employees 65,36 15,18 57,29 50 to 249 employees 71,13 19,85 68,24 > 250 79,60 29,46 80,43 Chi2 (Pr) 420,8 (0.000) 304,6 (0.000) 1200 (0.000) Source: IAB, 9 416 firms, weighted
The following table illustrates the share of innovating establishments according to their belonging to a group of firms. It can be stated, that technological, radical as well as organizational innovation are more frequent in firms with a group allocation.
Table 7. Group allocation of innovating and non-innovating firms with regards to the type of innovation (technological, new to the market, organizational) - Germany
Source: IAB, 9 416 firms, weighted
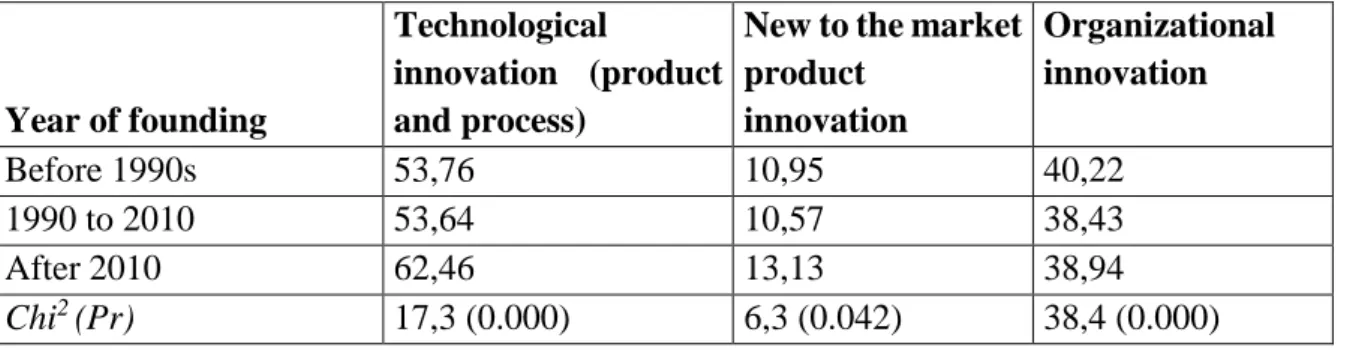
Taking the founding year of the firms into account (Table 8), it can be said that the share of innovating firms by age is significantly connected with innovation – younger firms are in mean more prone to innovate than older establishments. Only organizational innovation is conducted more frequently in older firms founded before 1990s.
Group allocation Technological innovation (product and process) New to the market product innovation Organizational innovation Firm in a group 65,97 15,19 50,49
Firm not in a group 54,01 10,62 36,76
22 Table 8. Year of founding of innovating and non-innovating firms with regards to the type of innovation (technological, new to the market, organizational) - Germany
Source: IAB, 9 416 firms, weighted
Table 9 shows the connection between industry sector and innovations. Technological innovation can be found predominantly in the firms from the manufacturing sector and services sector, whereas new to the market innovation is besides in the manufacturing sector more frequent in the retail sector. Regarding organizational innovation, it can also be said that the highest share of firms innovating by sector are those in manufacturing.
Table 9. Industry sector of innovating and non-innovating firms with regards to the type of innovation (technological, new to the market, organizational) - Germany
Industry sector
Technological
innovation (product and process)
New to the market product innovation Organizational innovation Manufacturing 58,05 12,72 45,07 Construction 45,36 8,22 38,20 Retail 56,85 12,64 38,18 Other services 58,70 10,64 38,89 Chi2 (Pr) 237,1 (0.000) 182,2 (0.000) 223,5 (0.000) Source: IAB, 9 416 firms, weighted
The following table is a cross-tabulation of firm’s turnover in quartiles and share of innovating establishments. The highest shares of companies having innovated in the considered three years can be detected in firms belonging to the last quartile of turnover i.e. economic power is significantly related with innovation. This holds true for all innovation forms.
Year of founding
Technological
innovation (product and process)
New to the market product innovation Organizational innovation Before 1990s 53,76 10,95 40,22 1990 to 2010 53,64 10,57 38,43 After 2010 62,46 13,13 38,94 Chi2 (Pr) 17,3 (0.000) 6,3 (0.042) 38,4 (0.000)
23 Table 10. Turnover of innovating and non-innovating firms with regards to the type of innovation (technological, new to the market, organizational) - Germany
Turnover
Technological
innovation (product and process)
New to the market product innovation Organizational innovation 1st quartile 48,19 8,62 27,56 2nd quartile 57,77 12,98 45,92 3rd quartile 62,30 14,53 53,84 4th quartile 77,62 22,31 69,99 Chi2 (Pr) 516,19 (0.000) 251,6 (0.000) 967,7 (0.000)
Source: IAB, 9 416 firms, weighted
-Employment and job quality in innovating firms
The next table (Table 11) gives an overview of the variables that are used from the German IAB data to capture job quality and employment.
24 Table 11. Job quality and employment according to firms’ innovation status (new to the market product innovations and organizational innovations) - Germany
Total
Technological innovation (product
and process) Innovation new to the market Organizational innovation
YES NO YES NO YES NO
Hours of work (week) 39,3 39,1 39,5 39,1 39,4 39,2 39,5
Gross wage (month) 458.678 637.366 117.208 1.143.667 339.826 762.443 132.637
Share of women in the workforce 0,435 0,435 0,435 0,414 0,439 0,420 0,450
Share of unskilled workers 0,149 0,147 0,154 0,149 0,150 0,154 0,142
Share of workers in skilled jobs 0,676 0,706 0,628 0,735 0,666 0,726 0,623
Share of part-time workers 0,258 0,247 0,274 0,215 0,265 0,236 0,281
Share of part-time female workers 0,765 0,77 0,760 0,776 0,763 0,765 0,765
Share of temporary contracts 0,053 0,057 0,047 0,067 0,051 0,063 0,043
Share of open-ended (permanent) contracts 0,947 0,943 0,953 0,933 0,949 0,937 0,957
Negative labour turnover (6 months) 5,488 6,805 3,304 11,155 4,474 8,204 2,593
Positive labour turnover (6 months) 5,784 7,238 3,444 12,366 4,642 8,546 2,879
Vacant positions 1,537 1,972 0,835 3,173 1,252 2,221 0,788
One-euro job holders 0,850 0,708 1,08 0,883 0,844 0,855 0,864
Number of workers with salary between 450
and 850 euro 1,837 2,126 1,371 2,560 1,707 2,468 1,167
25 The weekly working hours amount to approximately 39 hours for all establishments, although they are slightly lower in innovating firms. Gross monthly wages are significantly higher in firms with innovation compared to non-innovating firms. There are no statistically significant bivariate differences in the share of women in the workforce and in the share of unskilled workers between firms according to their innovation status. On the other hand, the descriptive results show that the share of workforce in skilled jobs is indeed higher in innovating firms. The share of time workers is slightly lower in innovating firms, whereas the share of part-time workers differentiated by sex shows no significant differences in comparison.
Surprisingly, the share of temporary workers seems to be slightly higher in innovating firms through all innovation forms. This descriptive finding needs verification through the following multivariate analysis. In terms of the negative and positive labour turnover, innovative firms have significantly higher quantities in both variables. Furthermore, innovative firms have on average more vacant positions available than non-innovative firms. There are no statistical differences between the innovation in firms and the number of the so-called “one-euro jobbers”, i.e. unemployed persons receiving one-euro remuneration per hour worked in addition to the state benefits, used as an instrument to fight long-term unemployment. The number of workers with lower wages is significantly higher in firms with technological innovation and organizational innovation. Yet, these findings should be treated with cautiousness as the absolute numbers are correlated with firm size and can be compared more straightforwardly in the following analysis.
3.3 Spain
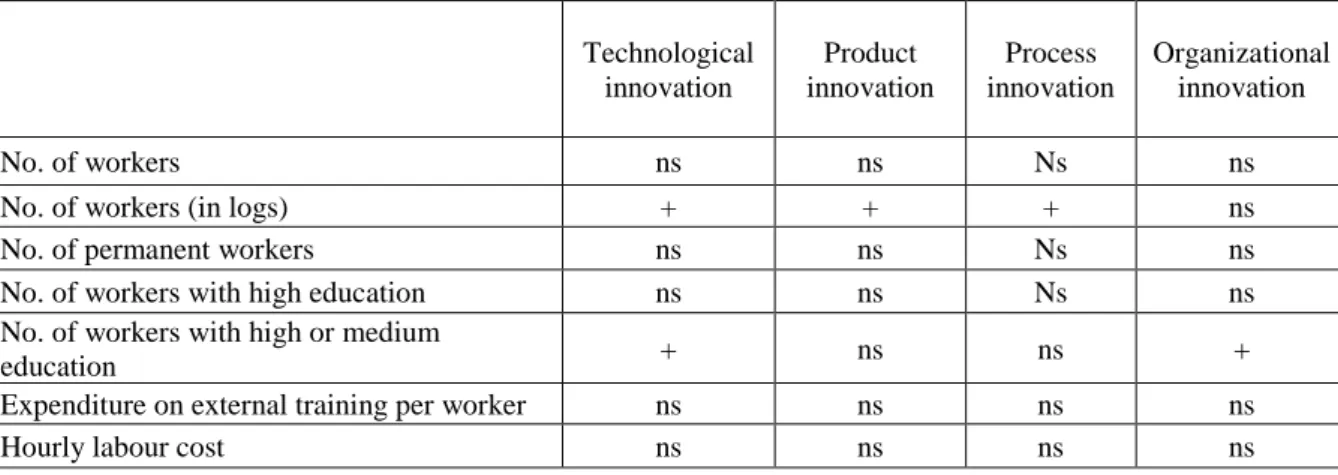
Tables 12 and 13 show the main descriptive statistics of the Spanish sample. It appears that process and organisational innovation are more frequent than product innovation. Besides, descriptive statistics indicate that the firms that introduce innovation, before doing so, are older, larger (a higher number of workers), have a higher productivity, exhibit higher profit margins, a higher proportion of high-educated workers, spend more on external training and present higher labour costs per worker. The proportion of temporary workers tends to be larger in the case of firms introducing product innovation than in the non-innovative firms and slightly lower in the case firms introducing either process or organizational innovations with respect to their counterparts not doing so. In any case, the existence and magnitude of these differences must be examined through the lens of the multivariate analysis.
26 Table 12. Share of innovating firms by type of innovation (between 2003 and 2005 and 2007 and 2009)
Type of innovation Share of innovating firms
Technological innovation (product or process) 53,40%
Product innovation 29,80%
Process innovation 46%
Organizational innovation 35,10%
Source: ESEE
Table 13. Characteristics of innovating and non-innovating firms in 2006 (innovation observed in 2007, 2008 and 2009) Technological innovation Product innovation Process innovation Organizational innovation Yes No Yes No Yes No Yes No
Firm's age 29,345 25,157 31,168 26,066 29,359 25,692 28,790 26,973 Hourly productivity (Euros at 2010
prices) 34,188 28,207 33,943 30,743 34,752 28,373 35,833 29,480 Margin rate (over price) 0,099 0,086 0,094 0,094 0,101 0,086 0,101 0,090 No. of working hours per year 554 647 225 397 780 817 260 829 588 982 230 970 623 452 307 276 No. of workers 331,261 131,602 468,953 152,853 352,226 134,824 366,318 184,864 Proportion of permanent workers 0,834 0,846 0,837 0,840 0,832 0,848 0,835 0,842 Proportion of temporary workers 0,166 0,154 0,163 0,160 0,168 0,152 0,165 0,158 Proportion of high-educated workers 0,064 0,044 0,075 0,047 0,065 0,045 0,072 0,047 Proportion of medium-educated workers 0,083 0,052 0,093 0,060 0,084 0,055 0,086 0,061 Proportion of low-educated workers 0,853 0,903 0,831 0,893 0,851 0,899 0,842 0,891 Expenditure on external training per
worker 117,485 62,169 155,888 67,946 126,371 59,682 148,464 65,409 Hourly labour costs (Euros at 2010
prices) 19,969 16,675 20,994 17,567 20,028 17,042 20,262 17,708 No. of firms 739 522 382 879 660 601 443 818
Source: ESEE
3.4. Descriptive statistics: comparative results
In the three countries, there is a positive correlation between firm’s size and the probability of innovation. The relationship with age is less clear cut: in the descriptive statistics, innovating firms are older in France and Spain but younger in Germany. Belonging to a group is positively correlated with innovation and so are the variables measuring firms’ performance (turnover, margin, productivity). In all countries, firms from the manufacturing sector are more likely to innovate. In France, firms from retail industry are less likely to innovate while in Germany they are relatively more likely to develop radical product innovation.
27 Looking at outcomes in terms of employment and job quality, we can observe in Germany and France that wages are higher in innovating firms while the number of hours worked is similar in both types of firms (data on wages are not available for Spain). The share of low skilled workers is smaller in innovating firms in France and Spain while it is similar in German innovating or non-innovating firms. Conversely, the share of high skilled is higher in innovating firms in Spain and France. In Germany, the share of workers in skilled jobs is higher in innovating firms. Finally, the share of employees on temporary contracts is similar in France in innovating and non-innovating firms while it is higher in innovating firms in Germany as well as in firms developing product innovation in Spain (the reverse is true in Spain for firms developing process or organizational innovation). In Germany, the share of part-time workers seems to correlate negatively with innovation.
4-Empirical strategy: a Difference in Difference approach to correct selection bias
Because firms that innovate do not have similar characteristics to other firms, we use an empirical methodology that allows us to take these differences into account. We use a propensity score matching model that was initially developed by Rosenbaum & Rubin (1983) to assess the effects of medical treatments. This method consists of considering innovation (I) as a treatment and constructing, for each firm that innovated between 2010 and 2012, an identical counterfactual that did not innovate. The effect of innovation on our different indicators of job quality is measured through the outcome variable (in our case we use different measures of employment and job quality). Thus, each firm is characterized by two potential results: y if I=0 and 0 y if I=1. 1
However, the effect of innovation on job quality is individual. Consequently, its distribution is not identifiable because y and 0 y are never observed simultaneously; only the achieved result can 1
be observed.
Let Yi be the vector of result variables. For each firm, only the couple (Y, I) is observed.
Nevertheless, if the latent outcome variables are independent of assignation to the treatment (