HAL Id: halshs-00586247
https://halshs.archives-ouvertes.fr/halshs-00586247
Preprint submitted on 15 Apr 2011
HAL is a multi-disciplinary open access archive for the deposit and dissemination of sci-entific research documents, whether they are pub-lished or not. The documents may come from teaching and research institutions in France or
L’archive ouverte pluridisciplinaire HAL, est destinée au dépôt et à la diffusion de documents scientifiques de niveau recherche, publiés ou non, émanant des établissements d’enseignement et de recherche français ou étrangers, des laboratoires
Optimal tax policy and expected longevity: A mean and
variance utility approach
Marie-Louise Leroux, Grégory Ponthière
To cite this version:
Marie-Louise Leroux, Grégory Ponthière. Optimal tax policy and expected longevity: A mean and variance utility approach. 2008. �halshs-00586247�
WORKING PAPER N° 2008 - 46
Optimal tax policy and expected longevity:
A mean and variance utility approach
Marie-Louise Leroux
Grégory Ponthière
JEL Codes: D81, H21, I12, I18, J18
Keywords: longevity, risk, lotteries of life, non-expected
utility theory, moments of utility theory, health spending
P
ARIS-
JOURDANS
CIENCESE
CONOMIQUESL
ABORATOIRE D’E
CONOMIEA
PPLIQUÉE-
INRA48,BD JOURDAN –E.N.S.–75014PARIS TÉL. :33(0)143136300 – FAX :33(0)143136310
www.pse.ens.fr
CENTRE NATIONAL DE LA RECHERCHE SCIENTIFIQUE –ÉCOLE DES HAUTES ÉTUDES EN SCIENCES SOCIALES
Optimal Tax Policy and Expected Longevity:
A Mean and Variance Utility Approach
1Marie-Louise Leroux2 and Gregory Ponthiere3
September 30, 2008
1This paper was presented at the VIIth Louis-André Gérard Varet Conference on Public
Economics in Marseille, at the Public Economic Theory Conference 2008 in Seoul, and at the 64th Congress of the International Institute for Public Finance in Maastricht. The authors are most gratefull to Hyppolite d’Albis, Jacques Drèze, Sergio Perelman, Paola Profeta and Bruno Ventelou for their helpfull comments and suggestions on this paper. The authors are grateful to the Belgian Fonds de la Recherche Scienti…que for its …nancial support.
2CORE, Université Catholique de Louvain [corresponding author]. E-mail:
[email protected]. Address: CORE, Voie du Roman Pays, 34, B-1348 Louvain-la-Neuve, Belgium.
Abstract
This paper studies the normative problem of redistribution between agents who can in‡uence their survival probability through private health spending, but who di¤er in their attitude towards the risks involved in the lotteries of life to be chosen. For that purpose, a two-period model is developed, where agents’preferences on lotteries of life can be represented by a mean and variance utility function allowing, unlike the expected utility form, some sensitivity to what Allais (1953) calls the ‘dispersion of psychological values’. It is shown that if agents ignore the impact of their health spending on the return of their savings, the decentralization of the …rst-best utilitarian optimum requires intergroup lump-sum transfers and group-speci…c taxes on health spending. Under asym-metric information, we …nd that subsidizing health expenditures may be optimal as a way to solve the incentive problem.
Keywords: longevity, risk, lotteries of life, non-expected utility theory, moments of utility theory, health spending.
1
Introduction
Whereas human longevity depends on factors of various natures - genetic, environmental or sociocultural -, a large demographic literature also emphasizes the crucial in‡uence of the individuals’lifestyles on their longevity.1 Clearly, how long one lives is not inde-pendent from how one lives. Individual longevity depends on the extent to which one is willing to ‘make an e¤ort’to improve or preserve his health, and di¤erences in the amount of e¤orts carried out by individuals tend to be re‡ected by longevity di¤erentials.2
What should a utilitarian government do in front of such a heterogeneity of lifestyles and longevities? The answer clearly depends on the source of the heterogeneity and on whether longevity is exogenous or not. However, it also depends crucially on the form of the individual’s preferences. For instance, Bommier et al. (2007 a,b) show that if longevity depends on exogenous health endowments, it is optimal to redistribute from short-lived toward long-lived individuals only when individuals have additively separable preferences, while relaxing this latter assumption, agents should be compensated for their poor longevity. As they explain in their work, assuming additively separable preferences leads to an implicit assumption of net risk neutrality toward the length of life which leads to strong (and disputable) conclusions in terms of redistribution.3
Starting from the works of Bommier et al. (2007 a,b), we might, on the opposite, examine the redistributive consequences of another potential source of heterogeneity in preferences: the attitude of agents towards risk and, more precisely, towards risk on longevity. This source of heterogeneity is generally ignored since most economic models assume both expected utility and additive lifetime welfare which, as we already mentioned, presupposes that all agents exhibit risk-neutrality with respect to the length of life.4 But it is not di¢ cult to see that the attitude towards risk plays a crucial role here, so that assuming a generalized net risk-neutrality with respect to longevity is a
1
See Vallin et al (2002).
2Health-improving e¤orts can take various forms: the e¤ort can be either temporal (e.g. physical
activity, see Surault 1996 and Kaplan et al. 1987), physical (e.g. abstinence of food, see Solomon and Manson, 1997), or monetary (e.g. health services, see Poikolainen and Eskola, 1986).
3
See Bommier (2005) on the notion of risk neutrality toward the length of life.
quite strong postulate.
Clearly, when an individual chooses how much to invest in his health, he does not choose a certain length of life, but, rather, expresses a preference for a particular lottery of life, whose di¤erent scenarii involve di¤erent lengths of life.5 The chosen level of health-improving e¤ort will not be a guarantee of a longer life, but only of a longer expected length of life with also some possible consequences on the variance of the length of life.6 Thus, in the context of risk about the length of life, individual choices of health-improving e¤orts may re‡ect their attitudes towards risk about the length of life, so that the making of a uniform assumption on the attitude towards risk may oversimplify the problem of the optimal public intervention.
Let us illustrate this with the following example (see Figure 1). A person of age 50, who has a disease, can choose between two possible lotteries of life: either lottery A, ‘no medical treatment’, or lottery B, ‘medical treatment’(assumed to be costless).7 Under no medical treatment, the patient is certain to live the next 10 years for sure, but not longer. On the contrary, under the medical treatment, the patient can die during the intervention with a probability 1/2, but can, if the intervention is a success, live until the age of 70 years with a probability 1/2. What will the patient choose?
It is not straightforward to see what the patient will decide. Actually, each lottery exhibits the same expected length of life, equal to 60 years, but di¤erent degrees of risk about the length of life: whereas lottery A is risk-free, lottery B is risky regarding the length of life.8
5
Strictly speaking, we should talk of a lottery on the length of life rather than of a lottery of life.
6To be precise, the chosen level of health-improving e¤ort is likely to in‡uence the dispersion of the
ages at death.
7Consumptions per life-period are assumed to be the same under the two lotteries. 8
Note that, in general, the choice of an e¤ort level in‡uences not only the expected length of life and the variance of the age at death but also per period utility.
A dilemma faced by a patient of age 50.
Lottery A: no health treatment Lottery B: health treatment
Probability = 1 Probability = 1/2 Probability = 1/2
Death at age 60 Death at age 50 Death at age 70 (= immediate death)
Choice between two lotteries of life
Under net risk-neutrality with respect to the length of life, a patient would be to-tally indi¤erent between lotteries A and B, and would toss a coin to decide whether he will undergo the medical treatment or not. However, such an indi¤erence is highly un-likely, because the degree of risk about the length of life is a non-neutral information for decision-makers. Thus, it is likely that individuals di¤er largely regarding their attitude towards risk, and do not all exhibit risk-neutrality with respect to the length of life. Ob-viously, some patients, who are risk-averse with respect to the length of life, will choose no medical treatment (lottery A), while some others, who are risk-lover, will choose the medical treatment (lottery B).9 As this example illustrates, the observed inequality in health-in‡uencing e¤orts is likely to re‡ect the heterogeneity of preferences, and, in particular, the heterogeneity of individual attitudes towards risk. But this raises the di¢ cult question of the optimal public policy in that context: what should a utilitarian government do in front of such a heterogeneity in the attitude towards risk?
The goal of this paper is to examine the optimal public policy in an economy where agents can in‡uence their survival by exerting some monetary e¤ort, but di¤er in their attitude towards risk with respect to the length of life. For simplicity, we assume that individuals live for a maximum of two periods, the …rst one being certain while the second one is conditional on survival. Naturally, by choosing their health expenditures, agents choose a speci…c lottery of life, which re‡ects their attitude toward risk.
9
Alternatively, if the treatment had the virtue not to raise, but to reduce the variance of the age at death, risk-averse agents would ceteris paribus opt for the treatment.
So as to account for individuals’ attitude toward risk on longevity, we model in-dividual preferences using a ‘mean and variance’ utility function, and we assume that individuals have di¤erent sensitivities to the variance of lifetime welfare.10 As this is well-known since Bommier’s (2005) work, there exist two broad ways to depart from net risk-neutrality with respect to the length of life. One way is to relax additive life-time welfare, as in Bommier’s (2005) works; the alternative solution is to relax the expected utility hypothesis. The former approach has the advantage to keep on relying on the - convenient - expected utility theory, but su¤ers from a lack of intuition behind non-additive lifetime welfare. This is why, in this paper, we prefer to keep additive lifetime welfare but to relax the expected utility hypothesis. Thus, lifetime welfare is still assumed to be additive in temporal welfare (without pure time preferences), but the expected utility hypothesis is here replaced by a less restrictive postulate.
More precisely, it is assumed that agents’s preferences on lotteries of life can be represented by a ‘mean and variance’ utility function of the kind defended by Allais (1953) in his seminal paper. Actually, Allais emphasized that, given that the dispersion of psychological values is ‘the speci…c element of the psychology of risk’ (Allais, 1953, p. 512), it follows that ‘[...] even in a …rst approximation, one should take into account the second order moment of the distribution of psychological values’ (1953, p. 513).11 Moreover, it was also quite clear in Allais’s mind that ‘[...] one cannot regard as irrational a psychological attitude in front of risk that takes the dispersion of psychological values into account.’(see Allais, 1953, p. 520).12 We shall thus postulate a mean and variance utility function, which is a simple generalization of the EU form accounting for Allais’s intuition. Naturally, other forms could be chosen instead (see Stigum and Wenstop, 1983; Schmidt, 2004), but the mean and variance utility function has the advantage of
1 0Actually, the ‘mean and variance’ utility form is a special case of what Machina (2007) calls the
‘Moments of Utility’approach in non-EU theory, followed by Hagen (1979) and Munera and de Neufville (1983).
1 1
Original version: ‘[...] même dans une première approximation, on doit tenir compte du moment d’ordre deux de la distribution des valeurs psychologiques’.
1 2Original version: ‘[...] on ne saurait considérer comme irrationnelle une attitude psychologique
simplicity.13
The rest of the paper is organized as follows. Section 2 presents the model and derives the laissez-faire equilibrium. Section 3 studies the …rst-best social optimum and its decentralisation. The second-best problem is considered in Section 4. A numerical illustration is developed in Section 5. Conclusions are drawn in Section 6.
2
The model
2.1 Environment
Let us consider a population of individuals who live a …rst period of life (whose length is normalized to one) with certainty, but survive to the second period only with a prob-ability . This probability depends positively on some monetary investment m:
= (m)
equivalently, m can be regarded as a private health expenditure made by the agent in the …rst period of his life, so as to increase his survival probability. We assume here that agents have the same survival function (:) with 0(:) 0 and 00(:) 0. Note that life expectancy equals 1 + (m).
However, agents are assumed to di¤er in their preferences. In order to introduce these di¤erences in preferences, we assume that individual preferences can be represented by a function having the ‘mean and variance’utility form (see Allais, 1953), and that agents exhibit di¤erent degrees of sensitivity to the volatility of welfare:14
Ui = ui ivar(ui)
where ui is the expected lifetime welfare of an agent with type i, while var(ui) is the variance of his lifetime welfare.15 The parameter i re‡ects the sensitivity to the variance
1 3
Moreover, that functional form shall, unlike the expected utility function, allow some risk-aversion with respect to the length of life, even under additive lifetime welfare.
1 4
Note that this function, although more general than the usual expected utility function, could still be generalized by taking into account higher moments of the distribution of lifetime welfare across scenarios of lotteries of life. For more general functions, see Hagen (1979) and Machina (1983).
1 5Note that preferences represented by a function of that form do not necessarily satisfy the
indepen-dence axiom, as the initial ordering between two lotteries may be inverted by a convex combination of those lotteries.
of lifetime welfare exhibited by a lottery of life. Under complete insensitivity, i equals 0 and we are back to standard expected utility (EU) theory. On the contrary, if i is positive, the agent prefers, ceteris paribus, lotteries with a lower variance of lifetime welfare across scenarios, while a negative ire‡ects the tastes of ‘variance-lover’agents.16 For simplicity, we shall, in the rest of this paper, concentrate on two types of agents, who di¤er only in their degree of sensitivity to the variance of lifetime welfare:
Agents of type 1, with 1> 0;
Agents of type 2, with 2 0 and 2 < 1.
In other words, we shall focus here on two types of agents whose preferences on lotteries of life cannot be represented by a standard expected utility function, i.e. on two types of quasi expected utility maximizers. However, the extent to which those agents depart from EU theory varies across the types: type-1 agents depart more from EU theory than type-2 agents.
Under a zero utility from death and additive lifetime welfare (with no pure time preferences), the expected lifetime welfare ui is, for i 2 f1; 2g:
ui = (mi) [u(ci) + u(di)] + (1 (mi)) [u(ci)] = u(ci) + (mi)u(di)
where ci and di denote, respectively, …rst and second period consumptions of an indi-vidual with type i. The function u is increasing and strictly concave.
In this two-scenarios world, the variance of lifetime welfare takes a simple form:
var(ui) = (mi) [(u(ci) + u(di)) (u(ci) + (mi)u(di))]2 + [1 (mi)] [u(ci) (u(ci) + (mi)u(di))]2
= [u(di)]2[(1 (mi)) (mi)] (1)
1 6
By abus de langage, it could also be said that agents with a higher i are more ‘risk-averse’ than
The variance of lifetime welfare depends on second-period consumption and on the vari-ance of lifetime, equal to (1 (mi)) (mi).17 Hence, we shall, for ease of notation, use the notation var(ui) var (di; mi) in the rest of this paper.
It should be stressed that second-period consumption tends, ceteris paribus, to in-crease the variance of lifetime welfare: the higher second-period consumption is, the higher the welfare gain of survival is, and the higher the welfare loss from death is too. Second-period consumption is thus a major source of welfare volatility.
However, the probability of survival (mi) has a non-monotonic relationship with the variance of lifetime welfare. Actually,
@var (di; mi) @ (mi) = [u(di)]2[1 2 (mi)] > = < 0 () (mi) < = > 1 2
Hence, a higher survival probability raises the variance of lifetime welfare if (mi) is smaller than 1/2, whereas it tends to lower it if (mi) is larger than 1/2. Moreover, given that @var(di;mi)
@mi =
@var(di;mi)
@ (mi)
0(mi), it follows that a higher health e¤ort tends to raise the variance of lifetime welfare if (mi) is smaller than 1/2, whereas it lowers it if
(mi) is higher than 1/2.
Given that, in industrialized economies, the life expectancy is high and the variance of lifetime is low (as the survival curve is close to the rectangular), we shall, in the rest of this paper, concentrate on values of larger than 1/2 for any level of health e¤orts. A natural corollary of this postulate is that, when an individual spends more on his health, he does not only increase his life expectancy, but reduces also the variance of his lifetime.18
1 7
Note that the variance of lifetime has a minimum at = 0and = 1, and reaches its maximum at = 1=2:
1 8
Note also that our focus on > 1=2 has another intuitive justi…cation. Actually, when > 1=2, individual welfare is increasing in life expectancy for any level of i, as one expects. To see this, note that imposing @Ui @ 0amounts to assume: @Ui @ = u(di) i[u(d )] 2 [1 2 (mi)] 0
2.2 The laissez-faire
Agents of type i 2 f1; 2g choose …rst period and second period consumptions, as well as health expenditure so as to maximize their objective function subject to their budget constraint: max ci;di;mi Ui(ci; di; mi) s.to ci= w si mi di = Risi where lifetime utility takes the following form
Ui(ci; di; mi) = u(ci) + (mi)u(di) ivar (di; mi) (2)
and var (di; mi) is equal to (1). We assume that savings are entirely invested in private annuities and that Ri is the return of an annuity. The wealth endowment w is exogenous and identical for all agents. Note also that there is no pure time preference, and that the interest rate is zero.
Assuming actuarially fair prices (i.e. Ri = 1= (mi)), the laissez-faire allocation for an agent of type i 2 f1; 2g satis…es the following conditions:
u0(ci) = u0(di) ivard(di; mi) = (mi) (3) u0(ci) = 0(mi)u(di) ivarm(di; mi) (4)
where varx(x; y) and vary(x; y) are partial derivatives of the variance of lifetime welfare with respect to x and y. Condition (3) characterizes the optimal saving decision. In the absence of any sensitivity to the variance of lifetime welfare ( i = 0 8i 2 f1; 2g), each agent would choose to smooth consumption over time (i.e. ci = di 8i 2 f1; 2g), because of the conjunction of no pure time preference, an actuarially fair annuity price and a zero interest rate. However, under a positive i, ci > di 8i, since vard(di; mi) is always positive; thus the sensitivity of agents to the variance of lifetime welfare makes them consume more in the …rst period. Actually, consuming more during the …rst period is a simple way to insure oneself against undergoing a big loss of welfare if one dies at
the end of the …rst period. Thus, concentrating consumption in the …rst period is a straightforward way to protect oneself against a too large variation of lifetime welfare across scenarios of the lottery of life. Note also that the higher i is, the steeper the intertemporal consumption pro…le will be ceteris paribus, because the more variance-sensitive the agent is, the more he will use that trick to avoid big welfare losses. This result is presented in the proposition below:
Proposition 1 If the market of annuities is actuarially fair, ci > di for any individual with type i > 0.
Condition (4) characterizes the level of health expenditure chosen by the individual in the equilibrium. Under traditional expected utility theory, this condition would collapse to u0(ci) = 0(mi)u(di), stating that the optimal health expenditure is such that the marginal welfare gain due to health expenditure (in terms of the second period of life) should equalize the marginal welfare cost of such an e¤ort. However, under a positive i, the marginal lifetime utility from health expenditure depends also on its impact on the variance of lifetime welfare, which is always positive since we assume that (mi) is higher than 1/2. Thus, under positive sensitivity to the variance in welfare, the level of health investment is always greater than under expected utility theory. Note also that in the laissez-faire, the individual does not take into account the impact of health expenditures on the return of his savings, Ri = 1= (mi) so that the individual chooses a level of health expenditures which is too high compared to its optimal level.19
We can now study the equilibrium levels of consumptions and of health expenditure of individuals with di¤erent sensitivities to the variance in welfare. Our results are summarized in the following proposition:
Proposition 2 Provided the market for annuities is actuarially fair, the laissez-faire allocation is such that
(i) if c1= c2, then d1 < d2 and m1 m2 [or d1 d2 and m1 > m2],
1 9This result is highlighted in Becker and Philipson (1998). Actually, each agent tends to consider
that his own health e¤ort will not a¤ect the return of the annuity whereas at the aggregate level it does. This is also emphasized in Sheshinski (2007, chapter 7).
(ii) if d1 = d2, then c1 > c2 and m1 m2 [or c1 c2 and m1 < m2].
Note …rst that, given the postulated general functional forms for u(c) and (m), it is not possible, in the present model, to fully describe the optimal levels of consump-tions and health expenditures for the two types of agents. Depending on the particular functional forms chosen for u(c) and (m), agents’s consumptions and e¤orts (ci; di; mi) may a priori vary in di¤erent ways. We will come back on the importance of functional forms in Section 5, where we present some numerical examples. This is why we shall here equalize …rst or second period consumptions between individuals so as to determine how the chosen variables (ci; di; mi) di¤er across agents.
If …rst-period consumption is equal for the two types of agents, then it is necessarily the case that an agent who has a larger sensitivity to the dispersion of psychological values chooses a lower second-period consumption and more health spending than an agent with a lower i. The intuition behind that result is the following. For a more sensitive agent, having a lower second-period consumption and spending more on health is a rational way to reduce the variance of lifetime welfare since the potential loss (i.e. second-period utility) would be smaller and this would happen with a lower probability. Agents with a lower i do not have the same concerns, and thus choose, for an equal …rst period consumption, a higher second-period consumption and a lower health e¤ort. If, alternatively, it is second-period consumption that is equal for both types of agents, then, without surprise, agents who are more sensitive to the variance will consume more in the …rst period in comparison to less-variance-sensitive agents, so that, given the budget constraint faced, they will also invest less in health in comparison with agents with a lower i. That result is not surprising, as consuming more in the …rst period is a standard way to insure oneself against a too large volatility of lifetime welfare.
Thus, one cannot say, under general functional forms, whether agents with a higher i will spend more or fewer resources in health. A higher sensitivity to the dispersion of psychological value may imply that an agent spends more on health (at the cost of second-period consumption) or on the contrary, spends less on health (to favour …rst-period consumption). That indeterminacy can be explained as follows. The two ways
to protect oneself against a high volatility of lifetime welfare are either to spend a lot on health or to spend a lot in …rst-period consumption. Which solution dominates depends on the curvatures of u(ci) and (mi). If 0(mi) is large and u0(ci) is low, then agents of type 1 will opt for the …rst way to avoid lifetime welfare variance; on the contrary, if 0(mi) is low and u0(ci) is large, agents of type 1 will opt for the second as a more e¢ cient way to avoid lifetime welfare volatility.
3
The …rst-best problem
3.1 The social optimum
In this section, we assume that the social planner is utilitarian and that he perfectly observes individuals’ types.20 The social planner can lend or borrow at a zero interest rate in order to balance the budget at any given period. The resource constraint of the economy is thus:
X
i=1;2
ni(ci+ (mi) di+ mi) w (5)
where ni denotes the number of agents of type i 2 f1; 2g in the population. Thus, the social planner chooses consumption paths as well as health investments levels for each type of individuals in order to maximize
X
i=1;2
ni(u(ci) + (mi)u(di) ivar (di; mi))
subject to (5).
The …rst order conditions yield:
u0(ci) = (6) u0(di) i vard(di; mi) (mi) = (7) 0(m i)u(di) ivarm(di; mi) = 1 + 0(mi) di (8)
Combining (6) and (7), we obtain the optimal trade-o¤ between present and future consumptions; this is identical to our laissez-faire condition (3) when the price of the
2 0Note that the standard Benthamite utilitarian criterion exhibits various limitations in general, and
in the particular context of endogenous longevity (see Broome, 2004). Thus, it is used here on the mere grounds of analytical conveniency.
annuity is actuarially fair. Thus, …rst-period consumption is still preferred to future consumption in the …rst-best. On the contrary, (8) together with (6) di¤ers from (4) by a term 0(mi) di. In the …rst-best, the social planner realizes that the level of health expenditure also modi…es the budget set. Indeed, a higher level of e¤ort mi not only increases direct utility through higher survival but also decreases consumption possibilities as (mi) increases in (5). Thus, in the …rst-best optimum, the social planner induces the individual to exert lower e¤ort so as to limit the negative impact of mi over the individual’s budget set; this was not the case in the laissez-faire as the individual was taking the annuity return, Ri as given. These …rst results are summarized in the following proposition:
Proposition 3 The …rst-best allocation is such that, for agents of type i 2 f1; 2g: (i) mF Bi < mLFi ,
(ii) ci> di.
where mF Bi and mLFi are the level of health expenditures in the …rst-best and laissez-faire respectively. We now turn to the allocation of consumptions and of health expen-diture according to individuals types. Obviously, …rst-period consumption is equalized across individuals. However, considering (7) and (8), there is no reason for second-period consumptions and health expenditure to be identical across individuals (since i enters into those equations). A priori, it is impossible to rank health expenditures and consumptions depending on individuals’types, unless some additional assumptions are made. Therefore, we assume two individuals with types 1 and 2 such that one is sensitive to the variance in lifetime welfare and the other is not and obtain the following results:21
Proposition 4 Consider two types of individuals with sensitivity to the variance in welfare such that 1 > 0 and 2 = 0. The …rst-best yields:
(i) c1= c2= c, (ii) d1 < d2,
2 1
(iii) m1 ? m2.
In the …rst-best, …rst period consumption is equalized across individuals while second period consumption and health expenditures are di¤erentiated between individuals.
The individual with a zero sensitivity to the variance obtains a higher level of second-period consumption than a variance-sensitive agent. This result is not surprising, as second-period consumption tends necessarily to raise lifetime welfare variance.22 Given that lifetime welfare variance enters type 1’s utility negatively, it does not come as a surprise that the social optimum implies d1 < d2.
However, it is not clear whether health expenditures should be higher or lower for agents with higher sensitivity to the variance. This indeterminacy can be explained as follows. On the one hand, higher health investment reduces the lifetime welfare variance of variance-sensitive agents, which matters for those agents (unlike for agents of type 2), and, as such, is justi…ed on the grounds of social welfare maximization. On the other hand, dedicating more resources to the health of variance-sensitive agents has, given d1 < d2, a smaller impact on the expected lifetime welfare of agents of type 1 than on the expected lifetime welfare of agents of type 2. Hence, whether m1 exceeds m2 or not depends on which e¤ect dominates, and, thus, on the level of and on the shapes of the utility function and the survival function.23 As shown in the Appendix B, if 1 is extremely large, one necessarily has m1 > m2, because the social welfare gain from dedicating more resources to the health of agents of type 1 is here large (given the extreme sensitivity of those agents to the variance of lifetime welfare) and thus largely compensates the social welfare loss due to the lower second-period utility exhibited by the life of agents of type 1. But, as we shall show in the numerical section, the condition
1 large is only su¢ cient (but not necessary) to have m1 > m2.
2 2Clearly, in the extreme case where second-period consumption equals 0, and u(0) = 0, there is a
zero lifetime welfare variance despite the risk about the length of life.
2 3
For instance, if the utility function is strongly concave in consumption, we have, at the …rst-best, u(d1) u(d2), so that the second e¤ect is minor and dominated by the …rst one, leading to m1> m2 at
the social optimum. Similar examples can be used to show the sensitivity of the social optimum to the shape of the survival function (mi).
3.2 Decentralisation
We now study how to decentralise the above optimum through a tax-and-transfer scheme. In the following, we assume that instruments available for the social planner are a tax on savings, a tax on health expenditures and lump sum transfers. We still assume that the annuity market is actuarially fair so that Ri = 1= (mi) at equilibrium. The individual’s problem is then to maximize:
u (w si(1 + ti) mi(1 + i) + Ti) + (mi) u (Rsi) ivar (Rsi; mi)
where ti is the tax on savings, i the tax on health expenditures and Ti is a monetary transfer for any individual with sensitivity i. Deriving …rst order conditions with respect to si and mi and rearranging them, we obtain
(mi) u0(di) ivard(di; mi)
u0(ci) = (mi) (1 + ti) (9)
0(mi)u(di)
ivarm(di; mi)
u0(ci) = (1 + i) (10)
Comparing these conditions with both (6), (7) and (8), we …nd that the optimal tax on savings is always zero for any type of individual, e.g. ti = 0 but the optimal level of the tax on health expenditures i should be equal to 0(mi) di > 0. This can be related to Becker and Philipson (1998); by implementing a positive tax on health expenditures, one limits health expenditures and make it tend toward its …rst-best level. Note that this tax on health spending is type-speci…c, that is, it depends on the degree of variance-sensitivity i.
To explore how the optimal tax on health spending i varies with i, let us turn back to the special case of Proposition 4, where 1 > 0 and 2 = 0. In that speci…c case, we have, under a large 1, 1 = 0(m1) d1 < 2 = 0(m2) d2, so that m1 > m2.
Otherwise, we have 1 7 2 if m1 < m2. We also …nd that if m1 < m2, the level of expected consumption, de…ned by
c + (mi)di+ mi
is always larger for type-2 agents than for type-1 agents. In this case, the …rst-best optimum transfers resources from the individual with higher sensitivity to the variance
to the individual with the lowest one and T1 < T2. On the opposite, if m1 ? m2, the direction of transfers is ambiguous and T1 ? T2.
4
The second-best problem
Whereas the above optimal policy discussion assumed a perfect observability of agents’ preferences on lotteries of life, such a perfect observability is hardly plausible. Actually, while a government would like agents to reveal their preferences (i.e. their i), these may be tempted to lie on their type to bene…t from an allocation that better coincides with their preferences. Hence, we need to relax the assumption of perfect observability of types, and turn to the analysis of the second-best.
In order to simplify the analysis, we shall concentrate, in the rest of the paper, on the two types of agents of Proposition 4: variance-sensitive agents ( 1 > 0 ) and expected utility maximisers ( 2 = 0). A priori, the …rst-best may redistribute from agents of type 2 to agents of type 1, or, the contrary, from agents of type 1 to agents of type 2, depending on the functional form of the survival probability and the utility function. For instance, refering to Proposition 4, it is possible that m1 < m2 at the social optimum, so that it is likely that agents of type 1 will be tempted to pretend to be of type 2 (as c1 = c2 and d1 < d2).24 However, if 1 is su¢ ciently large, implying m1 > m2 at the social optimum, it may be the case that variance-insensitive agents mimic variance-sensitive agents. Therefore, we need to consider here the two possible cases.
The problem faced by the social planner takes the following general form: X i=1;2 niUi(ci; di; mi) s:to 8 < : P i=1;2ni(ci+ (mi) di) w U2(c2; d2; m2)> U2(c1; d1; m1) or U1(c1; d1; m1)> U1(c2; d2; m2)
In the case where type-1 agents are tempted to copy type-2 agents, the …rst incentive compatibility constraint is binding, and the second one is not (see Subsection 4.1). On
2 4
But the mimicking behavior of type-2 agents is not certain, as a large second-period consumption raises also the variance of lifetime welfare.
the contrary, in the case where type-2 agents are tempted to mimic type-1 agents, the second incentive compatibility constraint is binding, and the other is not (see Subsection 4.2).25
4.1 Case 1: type 1 mimicking type 2
The Lagrangian of the problem has the following expression
$ = n1[u(c1) + (m1)u(d1) 1var (d1; m1)] + n2[u(c2) + (m2)u(d2)]
+ 2 4w X i=1;2 ni(ci+ mi+ (mi) di) 3 5
+ u(c1) + (m1)u(d1) 1var (d1; m1) u(c2) (m2)u(d2) + 1var (d2; m2)
where and are the Lagrange multipliers associated to, respectively, the resource constraint and the incentive compatibility constraint. Solving the Lagrangian and re-arranging FOCs, we …nd, for the mimicker (type-1 individual), the usual result of no distortion at the top:
u0(d1) 1 vard1(d1;m1) (m1) u0(c1) = 1 0(m 1)u(d1) 1varm1(d1; m1) u0(c1) = 1 + 0(m 1) d1
so that, comparing these equations with (9) and (10), second-best optimal taxes level are
t1 = 0
1 = 0(m1) d1
As in the …rst-best, savings are not taxed, while health spending are taxed in such a way as to correct for the Becker-Philipson e¤ect. We also …nd that the following trade-o¤s
2 5Note that one cannot exclude double copying. For simplicity, we concentrate on one directional
for type-2 agents u0(d2) u0(c2) = 1 n2 1vard(d2; m2) (m2) 0(m 2)u(d2) u0(c2) = 1 + 0(m2) d2 n2 1varm(d2; m2) and taxes have now the following forms:
t2 = n2 1vard(d2; m2) (m2) < 0 2 = 0(m2) d2 n2 1 varm(d2; m2) > 0
Thus, in the second-best, it is optimal to subsidize savings and to tax health expenditures for the type-2 agent. The rational behind t2 < 0 is that in a second-best, it is optimal to encourage second-period consumption for the type-2 agent as a way to discourage a type-1 individual from mimicking a type-2 (by doing so, he would obtain too high a level of second period consumption). Regarding the tax on health spending, the incentive compatibility constraint tends to reinforce the internalisation of the Becker-Philipson e¤ect. This additional constraint prevents the individual 1 from mimicking individual 2 as individual 1 would not invest enough in health if he was pretending to be of type 2.
Our …ndings are summarized in the proposition below:
Proposition 5 Consider two types of individuals with sensitivity to the variance in welfare such that 1 > 0 and 2 = 0. Under asymmetric information,
The “no distortion at the top” result holds.
A subsidy on savings is optimal for type-2 individuals and is equal to 1vard(d2; m2) = n2 (m2).
A tax on health expenditures for type-2 individuals is optimal and equal to 0(m2) d2 1varm(d2; m2) = n2.
4.2 Case 2: type 2 mimicking type 1
We now study the case where type-2 agents mimic type-1 agents. The Lagrangian of this problem has the following expression
$ = n1[u(c1) + (m1)u(d1) 1var (d1; m1)] + n2[u(c2) + (m2)u(d2)]
+ 2 4w X i=1;2 ni(ci+ mi+ (mi) di) 3 5
+ [u(c2) + (m2)u(d2) u(c1) (m1)u(d1)]
Note that the incentive compatibility constraint has here a simple expected utility form, as 2 = 0.
Proceeding as before, we …nd the trade-o¤s between two period consumptions and between consumption and health spending for the mimicker (here individual 2):
u0(c2) u0(d2) = 1 0(m2)u(d2) u0(c2) = 1 + 0(m 2) d2
The usual result of no distortion at the bottom holds; for the individual with 2 = 0, the trade-o¤s between two-period consumption and between consumption and health expenditures are equivalent to the …rst-best ones. Thus, the tax on savings is zero in this case (t2 = 0) and health expenditures are taxed in the same way as in the …rst-best, i.e. 2 = 0(m2) d2.
Rearranging …rst order conditions, individual-1 trade-o¤s are now distorted: u0(d1) 1vard1(d1; m1) = (m1) u0(c1) = 1 + n1 1 vard(d1; m1) (m1) 0(m 1)u(d1) 1varm1(d1; m1) u0(c1) = 1 + 0(m1) d1 + n1 1varm(d1; m1) Comparing them with (9) and (10) of the decentralized problem, we …nd that the second-best optimum could be decentralized by implementing taxes on savings and on health expenditures equal to t1 = n1 1 vard(d1; m1) (m1) > 0 1 = 0(m1) d1+ n1 1 varm(d1; m1)? 0
Let now study the level of these taxes. We …nd that type-1 agents should face a tax on savings. The intuition behind this result is related to the incentive constraint: since agents of type-2 always prefer higher levels of second-period consumption, it is optimal to tax savings of the type-1 agents in order to prevent the former from pretending to be the latter.
However, the sign of 1 is uncertain and might be positive or negative depending on the size of two countervailing e¤ects. On the one hand, 0(m1) d1 > 0 corresponds to the Becker-Philipson e¤ect; as we already mentioned in the …rst-best, imposing a tax on health expenditures is a way to limit individuals’ investment in health and thus its negative impact on their budget set. On the other hand, 1varm(d1; m1) = n1 < 0 and is related to the incentive e¤ect; in order to prevent mimicking behavior of type 2, the social planner would like to subsidize health expenditures of type 1. indeed, a type-2 agent mimicking a type-1 agent would obtain a too high level of health spending. Note also that if individuals could perfectly see the impact of their health investment on their budget set, the Becker-Philipson e¤ect would be absent and in the second-best, subsidization of health expenditures would be optimal. Thus, the overall e¤ect on the sign of 1 is ambiguous and depends on the magnitude of both the Becker-Philipson and the incentive e¤ects.
Our …ndings are summarized in the proposition below:
Proposition 6 Consider two types of individuals with sensitivity to the variance in welfare such that 1 > 0 and 2 = 0. Under asymmetric information,
The “no distortion at the bottom” result holds.
A tax on savings is optimal for type-1 individuals and is equal to 1vard(d1; m1) = n1 (m1).
A positive or negative tax on health expenditures for type-1 individuals is optimal and equal to 0(m1) d1+ 1varm(d1; m1) = n1.
5
A numerical illustration
Let us now illustrate our results by some numerical simulations. For that purpose, we shall, for simplicity, remain in the case where 1> 0 and 2 = 0.
Throughout this section, it is assumed that the temporal utility function u(c) takes a simple constant-elasticity form:
u(c) = c 1
1 +
where and are preference parameters.26 As this is well-known, the intercept pa-rameter captures the relative importance, in welfare terms, of the mere survival in comparison with utility from material consumption.27
The survival function (m) takes the following simple form:
(m) = 1=2 + m 1 + m
where > 0. Note that this functional form satis…es the assumptions made in the model: 0(m) > 0; 00(m) < 0 and (m) 1=2 8m:
We shall use those following benchmark values for key parameters.28
parameters w
values 10 0.83 1 10
Table 1: Parameter values
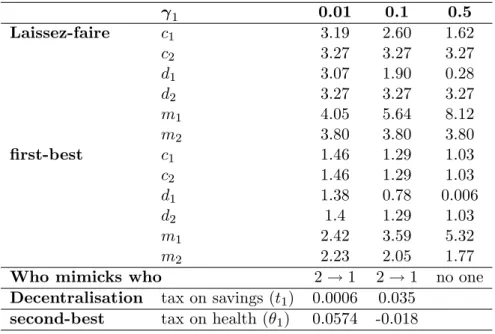
In order to illustrate the sensitivity of our theoretical results to the heterogeneity of agents’s attitudes towards risk, Table 2 presents the laissez-faire, the …rst-best and second-best allocations under various levels of preference parameter 1, while 2= 0.
Regarding the laissez-faire, let us …rst note that, as 1 rises, …rst and second-period consumptions for type-1 agents fall, and health spending m1 grow. This is in conformity
2 6
That functional form is also used by Becker et al (2005). Note that can no longer be interpreted here as the coe¢ cient of relative risk aversion with respect to c, because individual utility function takes a non-expected utility form under 6= 0.
2 7The parameter can be estimated, together with other preference parameters and
i, from
empirical estimates of the ‘neutral’ consumption ‡ow (making a person indi¤erent between a period of life with that consumption and death).
2 8
Note that the preference parameter is …xed to a strictly positive level to guarantee the non-negativity of health expenditures.
with the scenario (i) of Proposition 2 above: as the degree of variance-sensitivity grows, agents reduce their second-period consumption and raise their health e¤ort. Note also that, as expected, we have d1 < d2. In this example, variance-sensitive agents consume less in the …rst period, and spend more on health in comparison with EU maximizers.
At the …rst-best, …rst-period consumptions are equalized across all agents. Note that, as 1 rises, it is socially optimal to raise m1 and to decrease m2. This result was not guaranteed at the general level: as this was discussed in Section 3, two e¤ects are here at work: as 1 grows, the reduction of the variance of lifetime welfare of type-1 agents becomes more important for the social planner, but, given a decreasing d1, the direct utility gain from investing in the survival of type-1 agents is lower. In the present case, the high intercept (…xed to 10) makes the …rst e¤ect dominate the second one, so that a rise in the degree of variance sensitivity of type-1 agents leads to a larger health spending for those agents.
1 0.01 0.1 0.5 Laissez-faire c1 3.19 2.60 1.62 c2 3.27 3.27 3.27 d1 3.07 1.90 0.28 d2 3.27 3.27 3.27 m1 4.05 5.64 8.12 m2 3.80 3.80 3.80 …rst-best c1 1.46 1.29 1.03 c2 1.46 1.29 1.03 d1 1.38 0.78 0.006 d2 1.4 1.29 1.03 m1 2.42 3.59 5.32 m2 2.23 2.05 1.77
Who mimicks who 2 ! 1 2 ! 1 no one
Decentralisation tax on savings (t1) 0.0006 0.035 second-best tax on health ( 1) 0.0574 -0.018
Table 2: Sensitivity to gamma 1
Whereas there can be, in theory, a mimicking behavior from type-1 to type-2 agents or from type-2 to type-1 agents, the numerical simulations carried out tend all to point to a copying behavior from the variance-insensitive agents to the variance-sensitive agents,
so as to bene…t from higher health expenditures. Here again, that result is driven by the assumption of a high intercept of the temporal utility function (i.e. = 10). That high intercept means that it is survival that matters above all, so that type-2 agents tend to copy type-1 agents in order to bene…t from higher health spending at the social optimum.29 Hence, in order to prevent EU maximizers from pretending to be variance-sensitive, the second-best policy involves a tax on savings of type-1 agents. Note, however, that the sign of the optimal second-best tax on health spending varies with 1: for 1 = 0:01, type-1 agents health spending should be taxed, whereas these should be subsidized under 1 = 0:1. That sign inversion is in line with our theoretical discussions in Section 4: under a low 1, the Becker-Philipson e¤ect still dominates the incentive compatibility component within the optimal 1 formula, while the opposite holds for a larger 1.
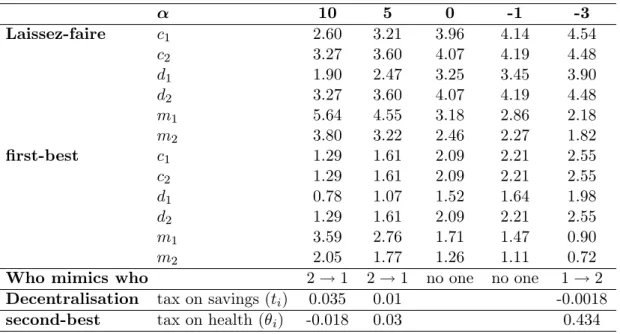
Given the importance of the preference parameter for the issue at stake, it makes sense to explore the sensitivity of our conclusions to its level. That sensitivity analysis is carried out in Table 3, which shows the laissez-faire, the …rst-best and second-best under varying between 10 and -3.30 Not surprisingly, the laissez-faire level of health expenditures tends to fall monotonically as falls: when survival per se becomes less important, agents tend to invest less in their health.
In terms of public policy, we can notice that, as falls, there is a fall in optimal health spending, and a rise in …rst-period and second-period consumptions for all agents. As far as the …rst-best is concerned, it should be stressed that, as falls, the gap between m1 and m2 falls, as, for a given 1, the gain, in welfare terms, from spending more in the survival of type-1 agents relative to type-2 agents decreases.31 Regarding the second-best, it is crucial to notice that, whereas there is a tendency of EU maximizers to copy type-1 agents when is large, the opposite holds when becomes strongly
2 9
However, for 1 = 0:5, type-2 agents do no longer want to copy type-1 agents, as second-period
consumption for type-1 agents is far too low for type-2 agents.
3 0
1 is here …xed to 0.1.
3 1Intuition: the …rst e¤ect (reducing welfare variance of type-1 agents) tends, as falls, to become less
and less sizeable than the second e¤ect (related to the higher direct utility from the survival of type-2 agents), explaining that trend.
negative. The intuition for this is merely that, under a low , survival does no longer matter per se, so that 2 agents do no longer want the high health spending of type-1 agents. On the contrary, type-type-1 agents are tempted to copy type-2 agents to bene…t from their larger second-period consumption, explaining the inverse copying behavior. As a consequence, while the second-best policy involves the taxation of type-1 agents’ savings and the subsidization of type-1’s health spending when is large, we observe the opposite for low.
10 5 0 -1 -3 Laissez-faire c1 2.60 3.21 3.96 4.14 4.54 c2 3.27 3.60 4.07 4.19 4.48 d1 1.90 2.47 3.25 3.45 3.90 d2 3.27 3.60 4.07 4.19 4.48 m1 5.64 4.55 3.18 2.86 2.18 m2 3.80 3.22 2.46 2.27 1.82 …rst-best c1 1.29 1.61 2.09 2.21 2.55 c2 1.29 1.61 2.09 2.21 2.55 d1 0.78 1.07 1.52 1.64 1.98 d2 1.29 1.61 2.09 2.21 2.55 m1 3.59 2.76 1.71 1.47 0.90 m2 2.05 1.77 1.26 1.11 0.72
Who mimics who 2 ! 1 2 ! 1 no one no one 1 ! 2
Decentralisation tax on savings (ti) 0.035 0.01 -0.0018
second-best tax on health ( i) -0.018 0.03 0.434
Table 3: Sensitivity to the intercept value
For completeness of analysis, Table 4 shows also the laissez-faire, the …rst-best and second-best optima for di¤erent values of the preference parameter .32 Here again, it appears that the most plausible case is the one where variance-insensitive agents are tempted to copy variance-sensitive agents in order to bene…t from higher health spending.33 Hence, it does not come as a surprise that the optimal second-best policy involves the taxation of type-1 agents’savings and a subsidy on type-1 health spending, which turns into a tax as falls.34
3 2
1 is here …xed to 0.1 and equals 10. 3 3
The reason for this is the high intercept = 10.
3 4
0.83 0.75 0.6 0.5 0.3 Laissez-faire c1 2.60 2.95 3.47 3.84 4.93 c2 3.27 3.48 3.75 3.91 3.91 d1 1.90 2.11 2.27 2.28 1.91 d2 3.27 3.48 3.75 3.91 3.91 m1 5.64 5.11 4.46 4.11 3.38 m2 3.80 3.44 2.97 2.71 2.71 …rst-best c1 1.29 1.43 1.61 1.72 1.98 c2 1.29 1.43 1.61 1.72 1.98 d1 0.78 0.85 0.85 0.81 0.55 d2 1.29 1.43, 1.61 1.72 1.98 m1 3.59 3.26 2.92 2.74 2.41 m2 2.05 1.95 1.80 1.72 1.56
Who mimics who 2 ! 1 2 ! 1 2 ! 1 no one no one
Decentralisation tax on savings (t1) 0.035 0.018 0.003 second-best tax on health ( 1) -0.018 0.003 0.024
Table 4: Sensitivity to sigma
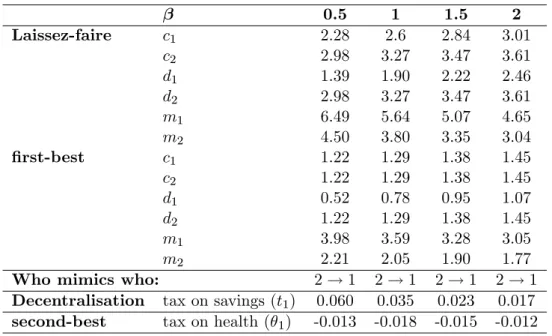
Finally, Table 5 explores the sensitivity of our conclusions to the shape of the survival function (m). For that purpose, we make the parameter vary between 0.5 and 2. As grows, the productivity of health spending grows, implying here a fall of health spending under the laissez-faire for all agents (but the fall is stronger for variance-sensitive agents), as well as a rise in …rst- and second-period consumptions. In the …rst-best, the rise in implies also a rise in …rst- and second-period consumptions, as well as a fall of health spending. For each of the values of under study, EU-maximizers are here tempted to copy type-1 agents, because of the importance of survival per se. Hence, the second-best policy involves a tax on type-1 agents’savings, as well as a subsidy on their health spending (the Becker-Philipson component being here dominated by the incentive compatibility component of the optimal tax on health).
incentive compatibility constraint. As falls, the degree of concavity of temporal welfare in consumption also falls, which reinforces the strength of the Becker-Philipson e¤ect.
0.5 1 1.5 2 Laissez-faire c1 2.28 2.6 2.84 3.01 c2 2.98 3.27 3.47 3.61 d1 1.39 1.90 2.22 2.46 d2 2.98 3.27 3.47 3.61 m1 6.49 5.64 5.07 4.65 m2 4.50 3.80 3.35 3.04 …rst-best c1 1.22 1.29 1.38 1.45 c2 1.22 1.29 1.38 1.45 d1 0.52 0.78 0.95 1.07 d2 1.22 1.29 1.38 1.45 m1 3.98 3.59 3.28 3.05 m2 2.21 2.05 1.90 1.77
Who mimics who: 2 ! 1 2 ! 1 2 ! 1 2 ! 1
Decentralisation tax on savings (t1) 0.060 0.035 0.023 0.017 second-best tax on health ( 1) -0.013 -0.018 -0.015 -0.012
Table 5: Sensitivity to form of the survival
In sum, this numerical application con…rms the …ndings of previous sections: the form of the optimal tax and transfer policy depends on the degree of variance-sensitivity of agents, and on the shapes of utility and survival functions. Whereas the case where EU maximizers are tempted to copy variance-sensitive agents to bene…t from higher health spending seems more plausible, whether health expenditures of the mimickee should be taxed or subsidized depends on the precise parametrization of the model.
6
Conclusions
This paper aims at studying the optimal taxation policy in an economy where agents can in‡uence their longevity through health e¤orts but who di¤er in their attitude towards lotteries of life. For that purpose, we set up a two-period model in which the agents in‡uence their survival probability by means of …rst-period health spending. Moreover, the heterogeneity of agents is captured by assuming that preferences on lotteries of life can be represented by various sensitivities to the variance of lifetime utilities.
It is shown that, in the laissez-faire, a higher sensitivity to the dispersion of psycho-logical value implies that an agent spends more on health (at the cost of second-period
consumption), or, on the contrary, spend less on health (to favour …rst-period consump-tion). The choice between those two ways to protect oneself against a high volatility of lifetime welfare depends on the speci…c functional forms for u(c ) and (m ).
At the social optimum, …rst-period consumptions are equalized across agents, whereas agents with a higher sensitivity to the variance should have a lower second-period con-sumption. It is not obvious to see whether more variance-sensitive agents should bene…t from higher or lower health expenditures, as, from a social point of view, the welfare gain from reducing the variance of their lifetime welfare is to be compared with the lower expected welfare associated with the survival of those agents (given their lower second-period consumption). The social optimum can be decentralized by means of group-speci…c taxes on health spending (to internalize the Becker-Philipson e¤ect) and by adequate lump sum transfers.
Under asymmetric information, it is not obvious to see which form the second-best policy should take, as the mimicking may occur from agents with a low-variance-sensitivity to agents with a high-variance-low-variance-sensitivity or the opposite. In the former case, the second-best policy requires a tax on the mimickees’savings and a tax or a subsidy on their health expenditures, as subsidizing health expenditures is a way to guarantee incentive-compatibility in that case. In the opposite case, the second-best policy requires a subsidy on the mimickees’ savings, and a tax on their health spending. Whether it is the former or the latter case that prevails depends on the intercept of the temporal utility function. Numerical simulations emphasized also some other determinants of the second-best policy, including parameters of the survival functions.
To conclude, it should be stressed that the present study, by focusing exclusively on one source of heterogeneity across agents (their sensitivity to variance of utilities) only covers one aspect of the design of the optimal taxation policy under endogenous (di¤erentiated) longevity. Undoubtedly, other sources of heterogeneity exist, regarding, for instance, the genetic background, the degree of rationality/myopia, the impatience or the disutility of e¤orts. Hence, one could hardly hope to provide a complete answer to that problem without considering what the optimal policy becomes when those various
sources of heterogeneity coexist. To answer that question, a crucial point will concern how those di¤erent characteristics are correlated across individuals types. Thus, in the light of the di¢ culties faced in the present study where agents di¤ered in only one aspect, one could hardly overestimate the problems raised by a more complete study of optimal taxation in an economy where agents di¤er in several characteristics in‡uencing longevity.
References
[1] Allais, M., 1953. ‘Le comportement de l’homme rationnel devant le risque: critique des postulats et axiomes de l’Ecole Americaine’, Econometrica, 21(4), pp. 503-546.
[2] Atkinson, A., Stiglitz, J., 1980. Lectures on Public Economics. McGraw Hill, New York.
[3] Becker, G., Philipson, T. 1998. ‘Old-age longevity and mortality contingent claims’, The Journal of Political Economy, 106(3), pp. 551-573.
[4] Becker, G., T. Philipson and Soares R., 2005. ‘The quantity and the quality of life and the evolution of world inequality’, The American Economic Review, 95(1), pp. 277-291.
[5] Bommier, A., 2005. ‘Uncertain lifetime and intertemporal choice: risk aversion as a rationale for time discounting’, International Economic Review, 47(4), pp. 1223-1246.
[6] Bommier, A., M-L. Leroux and J-M. Lozachmeur, 2007a. ‘Social Security and dif-ferential mortality’. Working Paper.
[7] Bommier, A., M-L. Leroux and J-M. Lozachmeur, 2007b. ‘Uncertain Lifetime, Re-distribution and Nonlinear Pricing of Annuities’. Working Paper.
[8] Broome, J., 2004. Weighing Lives. Oxford University Press, New-York.
[9] Diamond, P.A., 1998. ‘Optimal income taxation: an example with a U-shaped pattern of optimal marginal tax rates’, The American Economic Review, 88(1), pp. 83-95.
[10] Hagen, O., 1979. ‘Towards a Positive Theory of Preferences under Risk’, in M. Allais and O. Hagen (eds.): Expected Utility Hypotheses and the Allais Paradox, D. Reidel Publishing Co., Dordrecht.
[11] Kaplan, G.A, T.E. Seeman, R.D. Cohen, L.P. Knudsen and J. Guralnik, 1987. ‘Mor-tality among the elderly in the Alameda county study: behavioral and demographic risk factors’. American Journal of Public Health, 77(3), 307-312.
[12] Leroux, M.L., 2008. ‘Endogenous di¤erential mortality, non monitored e¤ort and optimal non linear taxation’, CORE DP, 29.
[13] Machina, M., 1983. ‘Generalized Expected Utility Analysis and the Nature of Ob-served Violations of the Independence Axiom’, in B. Stigum and F. Wenstøp (eds.): Foundations of Utility and Risk Theory with Applications, Reidel, Dordrecht.
[14] Machina, M., 2007. ‘Non-expected utility theory’, in S. Durlauf and L. Blume (eds.): The New Palgrave Dictionary of Economics, 2nd edition, Macmillan, New-York.
[15] Múnera, H. and R. de Neufville. 1983. ‘A Decision Analysis Model When the Sub-stitution Principle is Not Acceptable’, in Stigum, B.P. & F. Wenstop (eds.), 1983. Foundations of Utility and Risk Theory with Applications, Reidel, Dordrecht.
[16] OECD (2007): Eco-Santé OCDE 2007, available online at
http://www.oecd.org/dataoecd/45/20/38980771.pdf
[17] Okamoto, K., 2006. Life expectancy at the age of 65 years and environmental factors: an ecological study in Japan. Archives of Gerontology and Geriatrics 43, 85-91.
[18] Poikolainen, K., & Escola, J. 1986. ‘The e¤ect of health services on mortality decline in death rates from amenable to non-amenable causes in Finland, 1969-1981’, The Lancet, 1 (8474), p. 199-202.
[19] Schmidt, U., 2004. ‘Alternatives to Expected Utility: Some Formal Theories’, in: S. Barbera, P.J. Hammond, and C. Seidl (eds.), Handbook of Utility Theory, Vol. II, Kluwer, Boston, chapter 15.
[21] Solomon, C., & Manson, J.E., 1997. ‘Obesity and mortality: a review of the epi-demiological data, American Journal of Clinical Nutrition, 66(4), pp. 1044-1050.
[22] Stigum, B.P. & F. Wenstop (eds.), 1983. Foundations of Utility and Risk Theory with Applications, Reidel, Dordrecht.
[23] Surault, P., 1996. ‘Activités physiques et sportives, santé, bien-être et e¢ cacité économique’, Revue juridique et économique du sport, 40, pp. 113-118.
[24] Vallin, J., Caselli, G., & Surault, P., 2002. ‘Comportements, styles de vie et fac-teurs socioculturels de la mortalité’, in G. Casselli, J. Vallin & G. Wunsch (eds.): Démographie : analyse et synthèse, volume 3 : Les déterminants de la mortalité, INED, Paris.
Appendix
A
laissez-faire: proof of Proposition 2
Replacing for the expressions of vard(di; mi) and varm(di; mi), expressions (3) and (4) become, for an individual of type i 2 f1; 2g:
u0(ci) = u0(di) (mi) [1 2 iu(di) (mi)(1 (mi))] u0(ci) = 0(mi)u(di) [1 iu(di) (1 2 (mi))]
Suppose now that 1 > 2. If c1 = c2 = c, we have:
u0(c) = u0(di) (mi) [1 2 iu(di) (mi)(1 (mi))] u0(c) = 0(mi)u(di) [1 + iu(di) (2 (mi) 1)]
The …rst condition excludes the cases where (1) c1 = c2, m1 < m2 and d1 > d2, (2) c1 = c2, m1 m2 and d1 > d2, (3) c1 = c2, m1 < m2 and d1 d2. Moreover, the budget constraint excludes the cases where (1) c1 = c2, m1 m2 and d1 > d2 and (2) c1 = c2, m1 > m2 and d1 d2. Hence, it must be the case that m1 m2 and d1 < d2 or m1 > m2 and d1 d2 .
The part (ii) can be proven by similar reasoning.
B
…rst-best
We rewrite (6) and (7) for each type under the assumption that 1> 0 and 2= 0:
u0(d1) [1 2 1u(d1) (1 (m1))] = u0(d2) = 0(m 1)u(d1) 1 1u(d1) (1 2 (m1)) d1 u (d1) = 0(m 2)u(d2) 1 d2 u (d2) =
Combining …rst two equations, one …nds that d1 < d2. Using two last equations we …nd that m17 m2. In the speci…c case where 1 is very high, such that
1 1u(d1) (1 2 (m1))
d1 u (d1)
> 1 d2 u (d2) for any level of di, one has that m1 > m2.