HAL Id: hal-02878778
https://hal.sorbonne-universite.fr/hal-02878778
Submitted on 23 Jun 2020
HAL is a multi-disciplinary open access archive for the deposit and dissemination of sci-entific research documents, whether they are pub-lished or not. The documents may come from teaching and research institutions in France or
L’archive ouverte pluridisciplinaire HAL, est destinée au dépôt et à la diffusion de documents scientifiques de niveau recherche, publiés ou non, émanant des établissements d’enseignement et de recherche français ou étrangers, des laboratoires
Improving structural features of nanoporous alumina
using deuterated electrolytes
Anastasia Christoulaki, Chiara Moretti, Alexis Chennevière, Emmanuelle
Dubois, Nicolas Jouault
To cite this version:
Anastasia Christoulaki, Chiara Moretti, Alexis Chennevière, Emmanuelle Dubois, Nicolas Jouault. Improving structural features of nanoporous alumina using deuterated electrolytes. Microporous and Mesoporous Materials, Elsevier, 2020, 303, �10.1016/j.micromeso.2020.110201�. �hal-02878778�
Graphical Abstract
Improving structural features of nanoporous alumina using deuter-ated electrolytes
Anastasia Christoulaki, Chiara Moretti, Alexis Chennevière, Emmanuelle Dubois, Nicolas Jouault
Electrolyte
DC
H
2O
D
2O
✔ Be(er pore ordering
✔ Smaller pore diameter
✔ Improved growth rate
Nanoporous alumina synthesis
Highlights
Improving structural features of nanoporous alumina using deuter-ated electrolytes
Anastasia Christoulaki, Chiara Moretti, Alexis Chennevière, Emmanuelle Dubois, Nicolas Jouault
• Nanoporous alumina have been synthesized using deuterated electrolytes. • The pore diameter reached with deuterated electrolytes is as small as
the smallest pore size obtained so far in the literature.
• A better hexagonal pore ordering is observed and correlated to an in-crease in anion incorporation.
• The pore growth rate is improved and related to a decrease in the activation energy of the alumina formation.
• Thanks to the sensitivity of Small-Angle Neutron Scattering to deuter-ation, the use of deuterated electrolytes allows discussing the presence or not of OH groups within the material.
Improving structural features of nanoporous alumina
using deuterated electrolytes
Anastasia Christoulakia, Chiara Morettia, Alexis Chennevièreb, Emmanuelle Duboisa, Nicolas Jouaulta,∗
aSorbonne Université, CNRS, Laboratoire Physicochimie des Electrolytes et des Nanosystèmes Interfaciaux, PHENIX, F-75005 Paris, France.
bLaboratoire Léon Brillouin, Université Paris-Saclay, CEA-CNRS, Saclay, 91191 Gif-sur-Yvette CEDEX, France.
Abstract
Nanoporous anodic aluminum oxides (AAOs) are well-known nanoporous materials with multiple applications. In the last years new experimental strategies have been developed to produce AAOs in order to tune the pore morphology or ordering and discuss the AAOs growth mechanism. Here we describe an original approach to synthesize AAOs using deuterated elec-trolytes (i.e. sulfuric or oxalic acids in deuterated water D2O) leading to a
pore diameter reduction of around 20 % and an increase in the pore ordering and pore growth. Better pore ordering in D2O is correlated to an increase in
anion incorporation during the synthesis and the growth rate improvement is related to a decrease in the activation energy of the alumina formation. Moreover, the use of deuterated species allows to discuss the incorporation of hydroxyl groups during the AAO synthesis or the hydration after immer-sion in H2O or D2O by Small-Angle Neutron Scattering (SANS), a technique
∗Corresponding author
sensitive to deuteration. SANS reveals no changes between AAOs synthe-sized in H2O or D2O due to OH incorporation but shows differences after a
long immersion time in water (H2O or D2O), indicating that the hydration
is a slow process. This work shows that the use of deuterium is an interest-ing alternative for the synthesis of AAOs with well-controlled and specific morphologies and, from a fundamental point of view, can bring new general understanding about AAOs formation.
Keywords: Nanoporous alumina, Synthesis, Deuterated electrolytes, Pore ordering, Small-Angle Neutron Scattering
1. Introduction
Nanoporous anodic alumina oxides (AAOs) consist of parallel nanochan-nels with pore diameter (Dp), interpore distance (Dint), length (L) and
poros-ity (P) perfectly tunable through the synthesis conditions. Thanks to the ver-satility of the obtained morphology, AAOs became very popular nanomateri-als and are currently used in many applications such as confining medium[1], sensors[2] or templates[3]. AAOs are synthesized by the anodization of pure aluminum in acidic electrolytes under potentiostatic (constant voltage) or galvanostatic (constant current) conditions. In 1995, Masuda and Fukuda proposed an experimental approach to obtain well-ordered nanopores or-ganization thanks to a two-step anodizations synthesis under conventional conditions called "mild anodization" (named MA, corresponding to the use of a moderate temperature and moderate voltage giving a typical growth rate (GR) below 10 µm/h)[4]. Later, hard anodization (HA) was proposed to increase the GR (around 50 µm/h) by making the synthesis with higher
voltage (above the voltage breakdown) by working at low temperature (be-low 0oC)[5]. In such conditions, HA usually leads to the formation of larger pores (> 100 nm) and higher interpore distance (from 200 to 500 nm) with, compared to MA, different linear evolution with the voltage[6]. For both MA and HA the classical electrolytes used are sulfuric, oxalic or phosphoric acids but various other dicarboxylic acid electrolytes have been also used such as malonic, tartronic, maleic, tartaric, or citric acids[7].
In the last years, a particular attention has been drawn on the optimiza-tion of AAOs synthesis in order to tune the pore morphology, pore ordering and GR. New experimental protocols involving new electrolytes or new an-odization conditions have been explored. For example, the smallest pore diameter has been reached by using selenic acid (around 10 nm with low pore density and aspect ratio after 1h anodization)[8] or concentrated sul-furic acid (around 15 nm for higher pore density and a total thickness of 50 µm)[9]. Increasing the electrolyte concentration also leads to an increase of pore self-ordering, as observed for AAOs synthesized with concentrated oxalic acid[10]. Besides, a smaller Dp, accompanied with a lower GR, is
ob-served when adding a certain amount of polyethylene glycol to phosphoric acid. This additive increases the viscosity and decreases the acidity of the electrolyte mixtures, reducing Dp from 200 nm to 100 nm[11]. Other authors
showed that, in glycerol solution of oxalic acid, the AAOs thicknesses are lin-early dependent on the inverse of electrolyte viscosity[12], confirming the GR decrease when using more viscous electrolyte. On the contrary, ethanol and ionic liquids have been used to increase the GR. Qin et al. found that 10 % of ethanol can increase the GR by a factor of 5 with a Dp of 15 nm while
keep-ing the voltage low (25 V)[13]. However, the addition of more ethanol has the reverse effect, i.e. decrease the GR. Similarly Salerno et al. showed that the use of ionic liquids (from 0.01 to 1%v/v of 1-Butyl-3-methylimidazolium 2-(2-methoxyethoxy) ethyl sulfate and 1-Butyl-3-methylimidazolium tetraflu-oborate) in 0.03 M oxalic acid under galvanostatic conditions also increases the GR by a factor of 3.5[14].
In this context, we propose an original approach for the AAO synthesis using deuterated solvent (heavy water, D2O) and/or deuterated acids (such
as deuterated sulfuric acid, D2SO4). The use of deuterated species has not
been fully exploited, while it can provide valuable information, in particu-lar on the structural AAO features. So far, few works involved deuterated species for AAOs synthesis[15, 16] and none investigated the morphologies of AAOs prepared with deuterated electrolytes but focused on the possible AAO hydration during the synthesis. Indeed, under the high electric field generated during the anodization, water dissociates in O2− and/or OH−
mi-grating inside the oxide and forming with Al3+alumina (Al2O3) or aluminum
hydroxydes such as AlOOH (boehmite) or Al(OH)3 (bayerite) depending on
the OH− quantity[17, 18]. By using deuterated species, one substitutes D for H and can probe the presence (or not) of D within the structure. Dorsey used deuterated electrolytes to elucidate the hydration of the anodic films by in-frared absorption spectroscopy[15] probing shifts in bands to lower wavenum-bers in AAOs synthesized in deuterated sulfuric acids. Lu and coworkers[16] studied the diffusion of H/D through the barrier layer in thin films synthe-sized on Si wafers by Secondary Ion Mass Spectroscopy and observed the deuterium incorporation into AAO and at the Si/AAO interface. In this
pa-per, we investigate the influence of deuterium (D) i) on the structural pore organization, morphology and GR and ii) gain understanding on the chem-ical composition (anion incorporation and possible hydration) of AAOs by coupling Energy Dispersive Spectroscopy (EDS) and Small Angle Neutron Scattering (SANS), the latter being very sensitive to deuteration substitu-tion.
2. Experimental methods 2.1. AAOs preparation
Herein, AAOs are prepared using the classical two-step anodizations using different sulfuric or oxalic based electrolytes at a fixed concentration of 0.3 M: deuterated sulfuric acid in D2O (named D2SO4/D2O), hydrogenated sulfuric
acid in D2O (H2SO4/D2O), hydrogenated sulfuric acid in H2O (H2SO4/H2O)
and oxalic acid (OA, H2C2O4) in H2O or D2O. Table S1 summarizes the
different physical and chemical parameters of the different electrolytes used in this work. One can notice a pH increase and a conductivity decrease in D2O, in good agreement with the weaker acid dissociation already observed
in the literature. A first anodization is carried out during 2 hours (h) at a constant temperature (from 4oC to 20oC for sulfuric and 18oC for oxalic electrolytes) and constant applied voltage (20 V and 40 V for sulfuric and oxalic acid, respectively). Note that the breakdown voltage was found to be 21 V in sulfuric/D2O electrolyte while it is 27 V in sulfuric/H2O. The formed
oxide is then chemically dissolved in phosphochromic acid solution (6 wt% H3PO4 and 1.8 wt% CrO3) during 2 h at 60oC. Finally, a second anodization
(typically from 1 h to 8 h).
2.2. Scanning Electron Microscopy (SEM) and Energy Dispersive spectroscopy (EDS)
The AAOs were characterized by Scanning Electron Microscopy (SEM) to access the pore morphology and ordering. SEM imaging were performed on a field emission gun scanning electron microscope (FEGSEM, SU-70 Hitachi) at an accelerating voltage of 3 kV and images with different magnifications (x10000, x20000, x50000 and x100000) have been recorded. Energy Disper-sive spectroscopy (EDS) has been performed with an OXFORD X-Max SDD for elemental analysis (Al, O, C and S elements) at 5 kV on different areas of uncoated samples after calibration with a silicon standard.
2.3. Small-Angle Neutron Scattering (SANS)
Small-Angle Neutron Scattering (SANS) experiments have been performed on PAXY spectrometer (Laboratoire Léon Brillouin, LLB CEA Saclay) and D11 spectrometer (Institut Laue Langevin, ILL). On PAXY, four configu-rations were used: 6.7m/15Å, 5m/8.5Å, 3m/5Å, 1m/5Å covering a q range from 2.10−3 Å−1 to 0.5 Å−1 and data reduction was performed with home-made PASINET software. On D11, four configurations were used: 39m/6Å, 16m/6Å, 8m/6Å, 1.4m/6Å covering a q range from 2.10−3 Å−1 to 0.4 Å−1 (data available in ref[19]) and data reduction was performed with ILL GRASP software[20]. The AAOs are aligned along the neutron beam and immersed into H2O/D2O mixtures (73.2 % or 75.5 % D2O) to avoid multiple scattering
effects. We recently described a detailed methodology to measure AAOs by SANS[21] and here we will only provide the necessary information for the
basic understanding of the data interpretation. From SANS, we measure the scattering intensity I(q) from which information about the structure and chemical composition can be extracted through the complete fitting of the experimental data. The intensity depends on the averaged scattering am-plitude of the object form <F(q)> and the structure factor S(q). For the latter, a hard sphere (HS) or hexagonal (HEX) model[22, 21] have been used depending on the degree of ordering. Then, the F(q) can be reproduced by a core/shell model, the core being the pore filled with the solvent and the shell being the contaminated layer (see below). The composition is accessed by the scattering length density (SLD, noted ρ in the model) that depends on the chemical formula and the density of the materials. In our recent work, we also pointed out the importance of the length implemented in the fitting model corresponding to the longitudinal correlation length Lz (which is not
equivalent to the real AAO length). Lz is determined by measuring the
scat-tering intensity variation at the Q10 peak position as a function of the tilting
angle along the pore axis. By doing so we obtained a rocking curve from which Lz is calculated (see as an example in Figure S1 the rocking curve
of AAO synthesized in OA/H2O). In the following the SANS data will be
presented with the best fits given by the model and the fitting parameters will be listed in a table.
3. Results and Discussion
3.1. Influence of deuterated electrolytes on structural organization and growth rate
3.1.1. Pore diameter and ordering
Fig.1a shows SEM images of AAOs top surface synthesized in D2SO4/D2O,
H2SO4/D2O and H2SO4/H2O at T=10oC under 20 V during 8 h. Image
anal-ysis give similar pore densities but different mean Dp of 20 +/- 3 nm, 16 +/- 3
nm and 16 +/- 3 nm for H2SO4/H2O, H2SO4/D2O and D2SO4/D2O,
respec-tively, corresponding to a Dp decrease of around 20 % when using deuterated
water with no significant changes in the pore diameter dispersity (see Table 1). The use of H2SO4 or D2SO4 with D2O doesn’t modify the Dp, indicating
that even a small H content within the electrolyte doesn’t influence the pore morphology. When anodizing during a shorter time (2 h) the Dps are smaller
(around 12.5 nm, see Fig. 1b) and remain similar whatever the electrolyte used, indicating that the pore dissolution is time and electrolyte dependent. The dissolution rate is enhanced in hydrogenated electrolyte after a long time (1.1 nm/h and 0.6 nm/h for H2SO4/H2O and D2SO4/D2O, respectively) and
this effect is attributed to a stronger acidity of the hydrogenated electrolyte (i.e. having more H+, see pH and conductivity values in Table S1).
Moreover, if we focus on D2SO4/D2O electrolytes, the SEM images
anal-ysis showed a slight increase of pore diameter up to 15oC and a more pro-nounced increase at 20oC (Fig. 1c, blue squares). More interestingly one can
reach a Dp of 11 +/- 3 nm for 1 h anodization, reaching a pore size similar
to the smallest ones obtained up to now by using selenic acid[8] but with a higher aspect ratio and pore density, structural features very interesting for
a b 0 5 10 15 20 25 2 8 T = 10 °C H2SO4/H2O H2SO4/D2O D2SO4/D2O P ore di am et er D p (nm ) t ano (h) c D2SO4/D2O H2SO4/D2O H2SO4/H2O 1 µm 1 µm 1 µm 5 10 15 20 25 0 5 10 15 20 25 P ore di am et er D p (nm ) Temperature (°C) 1h 2h 6h 8h
Figure 1: SEM images of AAO top surface prepared with D2SO4/D2O (red), H2SO4/D2O (green) and H2SO4/H2O (blue). Scale bar: 1 µm. (b) Pore diameter Dp for the three systems after 2 h and 8 h anodization. (c) Dp evolution with temperature at a given anodization time (6 h, blue squares) and with time at a given temperature (10 oC, red circles) for AAOs synthesized in D2SO4/D2O.
Table 1: Structural parameters obtained from SEM analysis (pore size distribution and S(q)) of the AAOs synthesized in sulfuric electrolytes during 8 h and oxalic electrolytes during 11h30: pore diameter Dp, length L (one side), pore density n, porosity, interpore distance Dint, Dint standard deviation σint, grain size D. * For H2SO4/H2O the S(q) is fitted with a hard sphere model giving an ordering parameter η. Also the grain size cannot be determined with this model (NA = Non Available).
Electrolytes H2SO4/H2O H2SO4/D2O D2SO4/D2O OA/H2O OA/D2O
j (mA.cm−2) 1.7 2.6 2.9 4.0 3.2 Dp (nm) 20 +/- 3 16 +/- 3 16 +/- 3 55 +/- 3 44 +/- 3 L (µm) 23 27 36 84 60 GR (µm/h) 2.9 3.4 4.5 7.3 5.2 n (1010 cm−2) 4.4 4.5 4.2 1.1 1.1 Porosity (%) 16 12 9 26 16 Dint(nm) 52.6 52.8 52.7 100 103 η* / σint 0.49 / - - / 0.098 - / 0.084 - / 0.06 - / 0.06 Grain size (nm) NA 314 370 714 997
applications such as molecular filtration or the preparation of nanostructures by templating approach[23].
Then, the pore ordering is quantified by performing the 2D Fast Fourrier Transform (FFT) of the pore centers in order to compute the structure factor S(q) as shown in Fig.2a for H2SO4/H2O (blue), H2SO4/D2O (green) and
D2SO4/D2O (red). The S(q) gives information about the pore ordering and
can be reproduced by different models depending on the ordering degree (see reference [21] for complete mathematical expressions). The S(q) of AAOs synthesized in D2O show clear peaks at intermediate q (q11 and q20) coming
On the contrary the S(q) of AAOs synthesized in H2O cannot be reproduced
by the same model and is fitted with a hard sphere model indicating that the pores adopt a more disordered organization (the fitting parameters are also listed in Table 1). A hexagonal grain size cannot be extracted in H2O while
a transverse hexagonal domain size of 370 nm is obtained in D2O. Focusing
only on the D2SO4/D2O AAOs synthesized at different temperatures, the
S(q) analysis in Fig.2b shows quite similar ordering between 4 oC and 15 oC and a slightly better ordering at 20 oC (smaller σ
int and a larger grain
size, see Table S2). We can also notice that the anodization time (up to 8 h) doesn’t modify the ordering as observed recently for AAOs prepared with oxalic acid[21].
Similar analyses have been performed for AAOs synthesized in 0.3 M OA. Fig.3a and 3b show the SEM images of AAOs prepared in H2O and
D2O, respectively, and Fig.3c shows the corresponding S(q) derived from the
images analysis and both fitted with an hexagonal model. Similar trends are observed in oxalic electrolyte: Dp decreases by around 20 % in D2O (from
55 nm in H2O to 44 nm in D2O) and the grain size increases from 714 nm in
H2O to 997 nm in D2O (around 40 % increase, see Table 1).
First, it has been observed that the best self-ordered pore structure is obtained for anodization performed just below the breakdown potential UB,
corresponding to the voltage at which burning phenomena occur[24]. UB
depends on the anodized metal (here Al), current density, electrolyte resis-tivity and composition of the oxide[6]. For H2SO4/H2O, UB = 27 V and,
in this work, we experimentally found that in D2O UB = 21 V, close to our
0 1 2 3 4 5 6 7 0,01 0,1 t ano = 6 h 20°C Fit HEX 15°C Fit HEX 10°C Fit HEX 7°C Fit HEX 4°C Fit HEX
S
(q)
q (Å
-1)
b a 0 1 2 3 4 5 6 0,01 0,1 T = 10 °C t ano = 8 h H2SO4/H2O Fit HS H2SO4/D2O Fit HEX D2SO4/D2O Fit HEXS
(q)
q (Å
-1)
Figure 2: (a) Structure factor S(q) derived from the SEM images analysis fitted with hard sphere model in H2SO4/H2O and a hexagonal model for H2SO4/D2O and D2SO4/D2O (AAOs are synthesized during 8 h at 10 oC). The curves have been shifted vertically for clarity. (b) Structure factor S(q) derived from the SEM images analysis of AAOs prepared in D2SO4/D2O at different temperatures with the corresponding hexagonal fits (anodization time of 6 h). The SEM images are shown in Figure S2.
0 1 2 3 4 5 6 7 0,006 0,008 0,01 0,03 Oxalic/H2O Fit HEX Oxalic/D2O Fit HEX S(q ) q (Å-1) a b c
Figure 3: SEM images of AAOs synthesized with OA in (a) H2O and (b) D2O. (c) S(q) derived from SEM analysis. The black lines correspond to the best hexagonal fits. The S(q) in D O has been shifted for clarity.
Table 2: Anion incorporation determined by EDS measurements.
Electrolytes H2SO4/H2O H2SO4/D2O D2SO4/D2O OA/H2O OA/D2O
S/Al 0.071+/-0.004 0.091+/-0.005 0.105+/-0.004 ≈ 0 ≈ 0
C/Al 0.037+/-0.006 0.036+/-0.005 0.0245+/-0.0004 0.100+/-0.008 0.14+/-0.01
Grain size (nm) NA 314 370 714 997
the convergence of UB to our working voltage.
Second, the increase in ordering can also be correlated to the incorpora-tion of anions coming from the electrolyte during the anodizaincorpora-tion (sulfates or oxalates for sulfuric or oxalic acid respectively)[25]. Indeed, during the AAO growth, compressive stress arises at the oxide/electrolyte interface due to the incorporation of anions, which in turn produces tensile stress at the oxide/metal interface, causing the oxide plastic flow from the pore bottom to the pore surface[26] and finally influencing the pore self-ordering. Thus anion incorporation plays an important role: self-ordering increases when incorpo-ration increases. In this context, we used Energy Dispersive Spectroscopy (EDS) to determine the incorporation level in AAOs, i.e. the S/Al and C/Al ratios for sulfuric and oxalic AAOs, respectively. To quantify the amount of S or C coming from external contamination (i.e. not from incorporation during the synthesis) we measure the S content of oxalic samples (where normally there is no S) and the C content of sulfuric samples (where normally there is no C). Table 2 shows the results. First, there is no S external contamination since none is measured in oxalic samples. However there is a C external con-tamination estimated around a C/Al of 0.033. Then a clear increase of S/Al or C/Al is observed when D2O is used as a solvent, indicating an increase of
3.1.2. Influence on the growth rate (GR)
Now we will study the effect of D2O on the pore growth rate (GR,
cal-culated from the AAO thickness obtained by cross section SEM images). In particular the GR can be explored through the current density j, modified here by changing the temperature or the voltage. Fig.4 shows the GR evo-lution with j for sulfuric (Fig. 4a) and OA (Fig. 4b) electrolytes prepared in H2O and D2O. For all electrolytes, the GR is linear with j but different
values of the slopes (given in Fig. 4a and 4b) are obtained depending on the solvent (H2O or D2O) or the nature of the electrolyte (sulfuric or OA). For
sulfuric acid, the GR is larger in deuterated electrolytes (around 25 % higher for D2SO4/D2O), while there is no clear deuterated effect for oxalic
elec-trolytes. To gain more understanding, the GR evolution can be discussed in relation with the activation energy Ea of the reaction process, i.e. aluminum
oxidation during the first anodization. The Ea is obtained by fitting the j
versus 1/T plot (see Figure S3, the voltage is fixed to 20 V for sulfuric and 40 V for OA) with the following Arrhenius equation:
j = j0.exp(−
Ea
RT) (1)
For sulfuric electrolytes, one finds an Ea of 52 +/- 3, 47+/- 5 and 41
+/- 3 kJ.mol−1 for H2SO4/H2O, H2SO4/D2O and D2SO4/D2O, respectively.
Thus an increase in GR can be correlated with a decrease in Ea when using
D2O as a solvent. For OA, the Ea remains quite similar between H2O and
a
b
0 1 2 3 4 5 6 7 8 0 1 2 3 4 5 6 7 H2SO4/H2O H2SO4/D2O D2SO4/D2OG
row
th ra
te
G
R (
µ
m
/h)
Current density j (mA.cm
-2)
2 4 6 8 10 12 14 1 2 3 4 5 6 7 8 Oxalic/H2O Oxalic/D2O
G
row
th ra
te
G
R (
µ
m
/h)
Current density j (mA.cm
-2)
Slope (µm.h-1.mA-1.cm2) 1.22 +/- 0.04 1.23 +/- 0.06 1.51 +/- 0.03 Slope (µm.h-1.mA-1.cm2) 1.60 +/- 0.07 1.61 +/- 0.05
Figure 4: Growth rate (GR) as a function of the average current density j for (a) AAOs synthesized in H2SO4/H2O (blue squares), H2SO4/D2O (green circles) and D2SO4/D2O (red triangles) and (b) for AAOs synthesized in OA/H2O (orange circles) and OA/D2O (purple squares).
OA/D2O, respectively, which is coherent with the similar GR values. It has
to be noticed that for both electrolytes, the conductivity decreases in D2O
(see Table S1), suggesting that the growth of AAOs in deuterated electrolyte is always more efficient.
From all the different structural aspects we presented, it is clear that deuterated electrolytes modify some important AAO structural features and can be thus an interesting alternative for the synthesis of AAOs with specific morphologies. It is known that the dissociation constants of acids are modi-fied in D2O (because D2O has different physical properties such as a higher
viscosity)[27]. Such differences have effects on the pore structure: for exam-ple, a lower acidity in D2O leads to smaller pore diameters (as low as the
smallest values observed in the literature so far). However, other observations made in D2O cannot be fully understood: the increase of anion incorporation
and the increase in GR for sulfuric suppose that D2O has a complex influence
on the growth mechanism which is electrolyte dependent (here sulfuric and OA don’t show the same effect on the GR). Alumina is obtained by the reac-tion of aluminium ions Al3+ coming from the Al oxidation with oxygen ions
coming from water dissociation. The water dissociation rate under electric field, i.e. the rate for providing O2− or OH− to form alumina, is a
determin-ing parameter that controls several processes in the AAO formation[28] such as the migration of anionic species within the material and a modification of such water dissociation in D2O might explain our results[29]. So far, no
studies investigated such influence on AAOs but recent work reported clear electrochemical effects of isotopic substitution[30].
3.2. Investigation of OH incorporation and AAO aging by SANS 3.2.1. OH incorporation in AAO
The synthesis in deuterated electrolytes also allows to elucidate the pres-ence of H within the AAOs due to the incorporation of OH− during the synthesis. The OH quantity can be determined by thermogravimetric mea-surements (TGA). Mata-Zamora et al.[31] investigated by TGA AAOs pre-pared in aqueous electrolytes of sulfuric, oxalic or phosphoric acid and pro-posed empirical chemical formulas having the following general expression: (Al2O3−x)(anion)a(OH)b (anions being sulfates, oxalates or phosphates
de-pending on the electrolyte nature). They found that AAOs prepared in sulfuric acid contained more OH and anions relative to the ones prepared in phosphoric or oxalic acid. However the total OH amount remains low (b= 0.08, 0.04 and 0.001 for sulfuric, oxalic and phosphoric, respectively) indi-cating a weak OH incorporation. Then TGA cannot discriminate between surface OH and trapped OH inside the AAO. To solve this issue, O’Sullivan conducted FTIR measurements under D2O atmosphere and quantified the
H/D exchange. They observed that all OH groups are available for H/D exchange suggesting that hydroxyl groups are located at the surface and not trapped inside the materials[32].
Here, the synthesis in D2O can provide further information about the
OH incorporation. Indeed, such presence in the structure can be revealed by substituting D for H during the synthesis by the use of D2O and then
performing Small-Angle Neutron Scattering (SANS). SANS is a technique very sensitive to deuteration since atoms H and D have very different neutron scattering length b (bH = -0.374x10⁻¹² cm and bD = 0.667x10⁻¹² cm). As
mentioned in the experimental section, the chemical composition is given in SANS by the scattering length density (SLD, noted ρ) values, which are obtained by the fitting of the SANS data[21] and depend on the chemical formula and the density of the material as follows:
ρ = dNa M
X
i
bi (2)
With d the density, Na the Avogadro number, M the molecular weight
and bi the scattering length of atom i. Thus, a difference in SLD can be
explained by a difference in composition or by a difference in the density of the materials. As a consequence, the comparison of the SLD values of hydro-genated and deuterated AAOs will reveal the OH incorporation of alumina: if AAO contains OH groups then the differences between AAOs synthesized in H2O or D2O will be observed. On the contrary, if there is no H (or if the
H quantity is too low to be detected) then the SLDs will be similar. The sensitivity can be evaluated by estimating the expected SLD values. With the empirical formulas proposed by Mata-Zamora[31] one can calculate the AAO SLD and, by substituting D for H and assuming a similar density (3 g.cm−3), the expected SLD for AAO synthesized in deuterated electrolytes. One finds 4.24x10⁻⁶ Å−2 and 4.36x10⁻⁶ Å−2 for AAOs synthesized in H2O
and D2O, respectively. The difference (around 3 %) is detectable by SANS
due to the high AAO scattering, the error bars of the SLD values extracted from the data fitting lie on the second digits[21] .
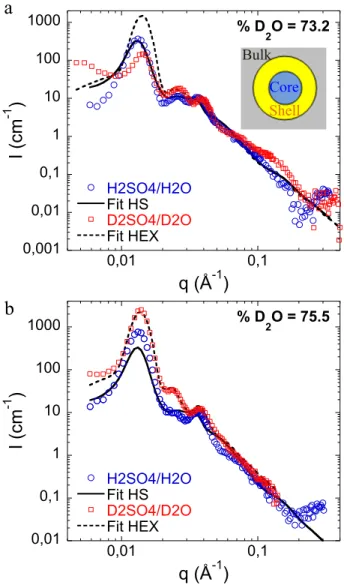
Figure 5a and 5b shows the scattering intensities of AAOs synthesized in H2SO4/H2O (blue circles) and D2SO4/D2O (red squares) measured in 73.2
sec-0,01 0,1 1 10 100 1000 0,01 0,1 % D 2O = 75.5 H2SO4/H2O Fit HS D2SO4/D2O Fit HEX I (cm -1 ) q (Å-1) 0,001 0,01 0,1 1 10 100 1000 0,01 0,1 % D 2O = 73.2 H2SO4/H2O Fit HS D2SO4/D2O Fit HEX I (cm -1 ) q (Å-1)
a
b
Bulk Shell CoreFigure 5: (a) SANS scattering intensities of AAOs synthesized in H2SO4/H2O (blue circles) and D2SO4/D2O (red squares) measured in (a) 73.2 % and (b) 75.5 % D2O. The continuous and dashed lines correspond to the best fit. The scheme inserted in (a) represents the core/shell model used to fit the data.
tion, the data have been fitted with a model combining an aligned core/shell cylinder form factor (depicted in insert of Fig. 5a) and a hard sphere or hexagonal structure factor. All the details of this model are fully described in our previous work[21] and Table 3 lists all the fitting parameters. This model nicely reproduced the experimental data (except for the first peak of the D2SO4/D2O AAOs in 73.2 % D2O, this discrepancy being attributed
to possible micro cracks adding a Porod contribution at low q and different information can be extracted:
i) SANS measurements confirms the better ordering of the D2SO4/D2O
AAOs: the longitudinal correlation length Lz, corresponding to an ordering
length in the longitudinal direction, is larger for D2SO4/D2O (4.43 µm) than
the H2SO4/H2O (1.74 µm).
ii) as for AAOs prepared in OA[21], the AAOs made in sulfuric acid are not homogenous in composition, the SANS cannot be fitted without a contaminated shell of 5.2 nm and 6.3 nm for H2SO4/H2O and D2SO4/D2O,
respectively. The composition of the shell will be discussed with the SLD below.
iii) since the same structural parameters have been used for the fitting of the 73.2 % and 75.5 % D2O, more reliable SLD values are obtained by
averaging the shell and bulk SLD determined for both contrasts. The SLDs gives information about the AAOs chemical composition and its possible hydration. One obtains ρshell = (4.61 +/- 0.09)x10−6 Å−2 and ρbulk = (4.49
+/- 0.09)x10−6 Å−2 for H2SO4/H2O and ρshell = (4.59 +/- 0.08)x10−6 Å−2
and ρbulk = (4.50 +/- 0.07)x10−6 Å−2 for D2SO4/D2O. The ρshell is higher
0,01 0,1 1 10 100 1000 0,01 0,1 Oxalic/H2O Fit Oxalic/D2O Fit
I (c
m
-1)
q (Å
-1)
Figure 6: SANS scattering intensities of AAOs synthesized in OA/H2O (orange circles) and OA/D2O (purple squares). The continuous and dashed lines correspond to the best fit.
SLD (such as S), in good agreement with the previous EDS characterization. However, no differences in SLD are observed when comparing deuterated and hydrogenated electrolytes. As mentioned previously, the SLDs depend on a combined effect of density and chemical composition. In D2O, an increase in
anion incorporation (increasing the SLD) is accompanied with a decrease in density (decreasing the SLD), leading to comparable SLD values as in H2O.
In addition, our results suggest that the OH or OD incorporation during the synthesis is very weak and not detected by SANS.
Similarly, SANS of AAOs synthesized in OA doesn’t show drastic dif-ferences between H2O and D2O as seen in Figure 6 where the SANS data
superimpose; the small differences are due to the better ordering in D2O
Table 3: Parameters obtained by the fitting of SANS data in Figure 4. See reference[21] for full details. The * refers to fixed parameters during the SANS fitting. a For H
2SO4/H2O, a HS model has been used for the S(q).
Name H2SO4/H2Oa H2SO4/H2Oa D2SO4/D2O D2SO4/D2O OA/H2O OA/D2O F(q) or S(q)
% D2O 75.5 73.2 75.5 73.2 73.2 73.2 -Dint(nm) 52.6 52.6 51.5 50 97.5 102 S(q) σa - - 0.084 0.084 0.061 0.058 S(q) δ (x 10−4Å−1) 0.49 0.49 17 17 8.8 6 S(q) cL - - 24.2 30 12 13 S(q) *φs 0.35 0.35 0.27 0.27 0.62 0.58 F(q) *ρsolv(10−6Å−2) 4.65 4.52 4.65 4.52 4.52 4.52 F(q) ρshell(10−6Å−2) 4.68 4.55 4.65 4.54 4.54 4.53 F(q) ρbulk(10−6Å−2) 4.55 4.42 4.55 4.45 4.43 4.45 F(q) *Rp(nm) 10 10 8 8 27.5 23.5 F(q) σp 0.2 0.2 0.19 0.19 0.06 0.07 F(q) t (nm) 5.8 5.7 6.3 6.3 15 17.5 F(q) *σt 0.1 0.1 0.1 0.1 0.2 0.1 F(q) *Lz(µm) 1.74 1.74 4.43 4.43 2.28 3.62 F(q)
similar for H2O and D2O suggesting again an absence or a weak OH or OD
incorporation, also confirmed by similar FTIR measurements (see Figure S4). Our results are consistent with the observations of O’Sullivan et al.[32] who concluded that no OH are trapped in the materials but are at the surface. One can imagine that surface OD groups are present after the synthesis in deuterated electrolytes and that further H/D exchange occurs with the H2O
molecules of the solvent mixture used for SANS measurements. 3.2.2. AAO aging in H2O and D2O
Finally, we propose to follow the AAO aging after a long immersion in H2O or D2O at room temperature. It has been observed that, in water,
alumina transforms into aluminum hydroxydes boehmite (AlOOH) or more probably bayerite (Al(OH)3), such transformation being thermodynamically
favored but kinetically slow[33]. Such process induces at the AAO surface a pore sealing, an interesting property for applications involving corrosion resistance. Here, we aim in particular at studying the effect of D2O on this
sealing process.
Pieces of AAO synthesized in OA/H2O are immersed in H2O or D2O
during 30 days at room temperature. These samples are then measured by SANS in 73.2 % D2O mixture. Figure 7a shows the SANS spectra after
im-mersing the AAO 30 days in H2O (green squares) or D2O (red circles). For
comparison we also plotted the SANS signal of the "as prepared" sample, i.e. AAO that has not been immersed[21]. First, compared to the as prepared AAO, the whole scattering intensities of "immersed" AAOs are shifted ver-tically after the immersion both in H2O or D2O. Second, the amplitudes of
the different peaks at low q are also modified with an increase of the first peak more pronounced after immersion in H2O than in D2O and high
in-coherent plateaus are clearly visible at high q with similar levels for AAOs immersed in H2O and D2O. All these modifications in the SANS curves
in-dicates changes in the AAO composition. Further data fitting also shown in Figure 7a provides the results presented in Table 4. One can notice that the pore hexagonal organization and radius are barely affected by the aging but the shell and bulk SLD values decrease in both cases, this decrease being more pronounced after immersion in H2O. In the case of AAO immersed in
H2O, such SLD decrease is consistent with the alumina transformation into
0,001 0,01 0,1 1 10 100 1000 104 105 0,01 0,1 OA (as prepared) 1 month in H2O
Fit (1 month H2O)
1 month in D2O
Fit (1 month D2O)
I (cm -1 ) q (Å-1) a b c d e
Figure 7: (a) SANS scattering intensities of AAOs synthesized in OA/H2O measured in 73.2 D2O as prepared (blue crosses), after immersion in H2O (green squares) and D2O (red circles). The continuous and dashed lines correspond to the best fit. The as prepared AAO has already been fitted in our previous work[21].(b, c, d, e) Top and section SEM images of AAO synthesized in OA/H2O after 30 days immersion in H2O (b, c) or D2O (d, e).
Table 4: Parameters obtained by the fitting of SANS data in Figure 7. See reference[21] for full details. The * refers to fixed parameters during the SANS fitting. These samples were measured in 73.2 % D2O mixture. The as prepared AAO has already been fitted in our previous work.[21].
Name As prepared 1 month in H2O 1 month in D2O
Dint (nm) 100 103 101 σa 0.06 0.06 0.06 δ (x 10−4 Å−1) 9.5 7 7 cL 10 10 10 *φs 0.56 0.67 0.79 *ρsolv (10−6 Å−2) 4.52 4.52 4.52 ρshell (10−6 Å−2) 4.58 4.40 4.48 ρbulk (10−6 Å−2) 4.50 4.12 4.28 *Rp (nm) 26.7 26.7 26.7 σp 0.14 0.25 0.25 t (nm) 15 19 23 σt 0.1 0.2 0.1 *Lz (µm) 1.33 1.33 1.33
In the case AAO immersed in D2O, one can propose the same
transforma-tion with the presence of D in the AAO. However, deuterium should increase the SLD values while a SLD decrease is measured, suggesting H/D exchange during the SANS measurement.
To go further we performed SEM to confirm the SANS analysis. Figures 7b, c, d, e show top and section view of AAO immersed in H2O (b, c)
visible on the top surface (Fig. 7b), confirming the alumina transformation and pore sealing. However this sealing only affects the top surface, as seen on the SEM section view (Fig. 7c) where nanochannels are still present below a non-porous layer. On the contrary, for AAO immersed in D2O,
there is no non-porous layer on the top surface (Fig. 7d, e), the pores are still visible. O’Sullivan et al. speculated that hydrothermal AAO treatment doesn’t modify the AAO bulk composition but induces a pore sealing[32]. Here, we show by combining SANS and SEM that aging in water affects the AAO composition, even before the pore sealing (see aging in D2O where
no sealing is observed but SLDs values changed). Additionally, our results clearly evidence a much slower kinetic of alumina transformation in D2O.
4. Conclusion
In this paper we proposed an experimental alternative to synthesize AAOs with interesting structural features by using deuterated electrolytes. The use of D2O leads to the formation of smaller pores with an improved hexagonal
ordering. The pore diameter reached with deuterated electrolytes is as small as the smallest pore size obtained so far in the literature. Moreover, for sul-furic electrolytes, an increase in GR is observed and related to a decrease of the activation energy of aluminum oxidation. Additionally, deuterated electrolytes allow to quantify the possible OH incorporation in AAOs during the synthesis by the use of SANS. SANS measurements don’t show drastic changes between hydrogenated and deuterated AAOs suggesting a weak OH incorporation. Finally, the AAO aging in H2O or D2O has also been
slower in D2O. This work provides an efficient opportunities to synthesize
AAOs with specific morphologies and brings new fundamental insight into the effect of deuterated species in the synthesis and properties of nanoporous materials.
5. Acknowledgements
The authors thank the Institut des Matériaux de Paris Centre (IMPC FR2482) for servicing FEGSEM and EDX instrumentation and Sorbonne Université, CNRS and C’Nano projects of the Région Ile-de-France for his funding and we thank David Montero for his help during the SEM char-acterization. We also thank Lionel Porcar for his help during the SANS experiments on D11 at ILL. Laboratoire Léon Brillouin (LLB) and Institut Laue Langevin (ILL) are acknowledged for beamtime allocation.
References
[1] P. Huber, Soft matter in hard confinement: phase transition thermo-dynamics, structure, texture, diffusion and flow in nanoporous media, Journal of Physics-Condensed Matter 27 (10) (2015) 103102.
[2] F. Tian, J. Lyu, J. Shi, F. Tan, M. Yang, A polymeric microfluidic device integrated with nanoporous alumina membranes for simultaneous detection of multiple foodborne pathogens, Sensors and Actuators B: Chemical 225 (2016) 312–318.
[3] C. T. Sousa, D. C. Leitao, M. P. Proenca, J. Ventura, A. M. Pereira, J. P. Araujo, Nanoporous alumina as templates for multifunctional ap-plications, Applied Physics Reviews 1 (3) (2014) 031102.
[4] H. Masuda, K. Fukuda, Ordered metal nanohole arrays made by a two-step replication of honeycomb structures of anodic alumina, Science 268 (1995) 1466–1468.
[5] W. Lee, R. Ji, U. Gosele, K. Nielsch, Fast fabrication of long-range ordered porous alumina membranes by hard anodization, Nat Mater 5 (9) (2006) 741–747, 10.1038/nmat1717.
[6] W. Lee, S. J. Park, Porous anodic aluminum oxide: Anodization and templated synthesis of functional nanostructures, Chemical Reviews 114 (15) (2014) 7487–7556.
[7] S. Ono, M. Saito, H. Asoh, Self-ordering of anodic porous alumina formed in organic acid electrolytes, Electrochimica Acta 51 (5) (2005) 827–833.
[8] O. Nishinaga, T. Kikuchi, S. Natsui, R. O. Suzuki, Rapid fabrication of self-ordered porous alumina with 10-/sub-10-nm-scale nanostructures by selenic acid anodizing, Scientific Reports 3 (2013) 2748.
[9] J. Martin, C. V. Manzano, O. Caballero-Calero, M. Martin-Gonzalez, High-aspect-ratio and highly ordered 15-nm porous alumina templates, Acs Applied Materials and Interfaces 5 (1) (2013) 72–79.
[10] C. Cheng, K. Ng, A. Ngan, Quantitative characterization of acid con-centration and temperature dependent self-ordering conditions of anodic porous alumina, AIP Advances 1 (4) (2011) 042113.
[12] W. J. Stepniowski, D. Forbot, M. Norek, M. Michalska-Domanska, A. Król, The impact of viscosity of the electrolyte on the formation of nanoporous anodic aluminum oxide, Electrochimica Acta 133 (2014) 57–64.
[13] X. Qin, J. Zhang, X. Meng, L. Wang, C. Deng, G. Ding, H. Zeng, X. Xu, Effect of ethanol on the fabrication of porous anodic alumina in sulfuric acid, Surface and Coatings Technology 254 (2014) 398–401.
[14] M. Salerno, N. Patra, R. Losso, R. Cingolani, Increased growth rate of anodic porous alumina by use of ionic liquid as electrolyte additive, Materials Letters 63 (21) (2009) 1826–1829.
[15] G. Dorsey, The characterization of anodic aluminas iii. barrier layer com-position and structure, Journal of The Electrochemical Society 113 (3) (1966) 284–286.
[16] P. H. D. Lu, H. Strutzberg, S. Wenham, A. Lennon, Hydrogen incor-poration during aluminium anodisation on silicon wafer surfaces, Elec-trochimica Acta 133 (2014) 153–160.
[17] T. P. Hoar, N. F. Mott, A mechanism for the formation of porous anodic oxide films on aluminium, Journal of Physics and Chemistry of Solids 9 (2) (1959) 97–99.
[18] I. Farnan, R. Dupree, A. J. Forty, Y. S. Jeong, G. E. Thompson, G. C. Wood, Structural information about amorphous anodic alumina from 27al mas nmr, Philosophical Magazine Letters 59 (4) (1989) 189–195.
[19] N. Jouault, A. Chennevière, A. Christoulaki, E. Dubois, L. Porcar, Poly-electrolytes chain conformation under confinement: electrostatic effects studied by zero average contrast method. institut laue-langevin (ill), https://doi.org/10.5291/ill-data.9-11-1764 (2016).
[20] C. D. Dewhurst, Graphical reduction
and analysis sans program for matlabtm,
https://www.ill.eu/users/scientific-groups/large-scale-structures/grasp/. [21] A. Christoulaki, A. Chenneviere, I. Grillo, L. Porcar, E. Dubois,
N. Jouault, A novel methodology to study nanoporous alumina by small-angle neutron scattering, Journal of Applied Crystallography 52 (4) (2019) 745–754.
[22] S. Förster, A. Timmann, M. Konrad, C. Schellbach, A. Meyer, S. S. Funari, P. Mulvaney, R. Knott, Scattering curves of ordered mesoscopic materials, The Journal of Physical Chemistry B 109 (4) (2005) 1347– 1360.
[23] S. J. Hurst, E. K. Payne, L. Qin, C. A. Mirkin, Multisegmented one-dimensional nanorods prepared by hard-template synthetic methods, Angewandte Chemie International Edition 45 (17) (2006) 2672–2692. [24] S. Chu, K. Wada, S. Inoue, M. Isogai, A. Yasumori, Fabrication of ideally
ordered nanoporous alumina films and integrated alumina nanotubule arrays by high?field anodization, Advanced Materials 17 (17) (2005) 2115–2119.
[25] I. Mínguez-Bacho, S. Rodríguez-López, A. Climent, D. Fichou, M. Vázquez, M. Hernández-Vélez, Influence of sulfur incorporation into nanoporous anodic alumina on the volume expansion and self-ordering degree, The Journal of Physical Chemistry C 119 (49) (2015) 27392– 27400.
[26] J. E. Houser, K. R. Hebert, The role of viscous flow of oxide in the growth of self-ordered porous anodic alumina films, Nat Mater 8 (5) (2009) 415–420, 10.1038/nmat2423.
[27] W. P. Jencks, K. Salvesen, Equilibrium deuterium isotope effects on the ionization of thiol acids, Journal of the American Chemical Society 93 (18) (1971) 4433–4436.
[28] Z. Su, M. Bühl, W. Zhou, Dissociation of water during formation of an-odic aluminum oxide, Journal of the American Chemical Society 131 (24) (2009) 8697–8702.
[29] J. J. Katz, Chemical and biological studies with deuterium, American Scientist 48 (4) (1960) 544–580.
[30] S. Cai, T. Bai, H. Chen, W. Fang, Z. Xu, H. Lai, T. Huang, H. Xu, X. Chu, J. Ling, C. Gao, Heavy water enables high-voltage aqueous electrochemistry via the deuterium isotope effect, The Journal of Phys-ical Chemistry Letters 11 (1) (2020) 303–310.
[31] M. Mata-Zamora, J. Saniger, Thermal evolution of porous anodic alu-minas: a comparative study, Revista mexicana de física 51 (5) (2005) 502–509.
[32] J. O’sullivan, J. Hockey, G. Wood, Infra-red spectroscopic study of an-odic alumina films, Transactions of the Faraday Society 65 (1969) 535– 541.
[33] X. Carrier, E. Marceau, J.-F. Lambert, M. Che, Transformations of γ-alumina in aqueous suspensions: 1. γ-alumina chemical weathering studied as a function of ph, Journal of Colloid and Interface Science 308 (2) (2007) 429–437.


![Table 3: Parameters obtained by the fitting of SANS data in Figure 4. See reference[21] for full details](https://thumb-eu.123doks.com/thumbv2/123doknet/13146273.388971/26.918.166.798.291.619/table-parameters-obtained-fitting-sans-figure-reference-details.webp)
![Table 4: Parameters obtained by the fitting of SANS data in Figure 7. See reference[21]](https://thumb-eu.123doks.com/thumbv2/123doknet/13146273.388971/29.918.166.684.318.737/table-parameters-obtained-fitting-sans-data-figure-reference.webp)
