HAL Id: hal-03002403
https://hal.archives-ouvertes.fr/hal-03002403
Submitted on 3 Feb 2021
HAL is a multi-disciplinary open access
archive for the deposit and dissemination of
sci-entific research documents, whether they are
pub-lished or not. The documents may come from
teaching and research institutions in France or
abroad, or from public or private research centers.
L’archive ouverte pluridisciplinaire HAL, est
destinée au dépôt et à la diffusion de documents
scientifiques de niveau recherche, publiés ou non,
émanant des établissements d’enseignement et de
recherche français ou étrangers, des laboratoires
publics ou privés.
Patterns of Ice-Rafted Detritus in the Glacial North
Atlantic (40-55°N)
F. Grousset, L. Labeyrie, J. Sinko, M. Cremer, G. Bond, J. Duprat, E.
Cortijo, S. Huon
To cite this version:
F. Grousset, L. Labeyrie, J. Sinko, M. Cremer, G. Bond, et al.. Patterns of Ice-Rafted Detritus in
the Glacial North Atlantic (40-55°N). Paleoceanography, American Geophysical Union, 1993, 8 (2),
pp.175-192. �10.1029/92PA02923�. �hal-03002403�
PALEOCEANOGRAPHY, VOL. 8, NO. 2, PAGES 175-192, APRIL 1993
PATTERNS OF ICE-RAFTED DETRITUS IN THE
GLACIAL NORTH ATLANTIC (40-55øN)
F. E. Grousset, 1, 2 L. Labeyrie, 3 J. A. Sinko, 1 M. Cremer, • G. Bond, 2 J. Duprat, • E. Cortijo, 3 S.
Huon 4
Abstract. The observation by Heinrich (1988) that, during the last glacial period, much of the input of ice-rafted detritus to the North Atlantic sediments may have occurred as a succession of catastrophic events, rekindled interest on the history of the northern ice sheets over the last glacial period. In this paper, we present a rapid method to study the distribution of these events (both in space and time) using whole core low-field magnetic susceptibility. We report on approximately 20 cores coveting the last 150 to 250 kyr. Well-defined patterns of ice- rafted detritus appear during periods of large conti- nental ice-sheet extent, although these are not always associated within their maxima. Most of the events may be traced across the North Atlantic Ocean. For the six most recent Heinrich layers (HL), two distinct patterns exist: HL1, HL2, HL4, HL5 are distributed along the northern boundary of the Glacial Polar
1D6partement
de G6ologie
et Oc6anographie,
Uni-
versit6 Bordeaux I, Talence, France.
2Lamont-Doherty
Earth
Observatory,
Columbia
University, Palisades.
3Centre des Faibles Radioactivit6s,
Gif-sur-
Yvette, France.4D6partement
de Min6ralogie,
Gen•ve,
Switzer-
land.Copyright 1993
by the American Geophysical Union. Paper number 92PA02923.
0883-8305/93/92PA-02923510.00
Front, over most of the North Atlantic between --40 ø and 50øN; HL3 is more restricted to the central and
eastern part of the northern Atlantic. The Nd-Sr isotopic composition of the material constituting different Heinrich events indicates the different provenance of the two patterns: HL3 has a typical Scandinavia-Arctic-Icelandic "young crust" signa- ture, and the others have a large component of northern Quebec and northern West Greenland "old crust" material. These isotopic results, obtained on
core SU-9008 from the North American basin, are in
agreement with the study by Jantschik and Huon (1992), who used K-Ar dating of silt- and clay-size
fractions of an eastern basin core (ME-68-89). These
data confirm the large spatial scale of these events, and the enormous amount of ice-rafted detritus they
represent.
INTRODUCTION
Ruddiman [ 1977] demonstrated that the last glacial period was characterized by a large increase in the input of ice-rafted detritus to the North Atlantic Ocean, with a preferential accumulation north of the location of the glacial polar front (40ø-55øN). His work indicated a first-order dependence of the ice- rafted detritus fluxes in the North Atlantic on the volume of the continental ice sheets.
By studying cores from the Northeast Atlantic Basin (=47øN-20øW) at high resolution (one sample
each -- 3 cm), Heinrich [ 1988] has demonstrated that
a series of six sharp events of ice-rafted detritus occurred roughly every -•11 kyr, during the last glacial period. Broecker et al. [ 1992] reported similar results in the uppermost meters of Ocean Drilling Program (ODP) site 609 (50øN, 24øW). Thus the
176
"Heinrich layers" (HL) are not a local feature and occur throughout the northern North Atlantic Ocean.
Broecker et al. [1992] and Bond et al. [ 1992] have
demonstrated that these events are associated with a
drastic reduction in the flux of foraminifera shells,
and a shift toward monospecific N. pachyderma (si- nistral) populations and deposition of sediment rich in detrital carbonate, probably derived from eastern Canada. The input of ice-rafted detritus is associated with major cooling of the northern North Atlantic Ocean [Bond et al., 1992]. These results raise ques- tions on the stability of glacial ice sheets. Heinrich [ 1988] raised the possibility of preferential transport of ice rafted detritus to the south, at periods of maxi-
mum extent of the ice sheet. Broecker et al. [1992]
and Bond et al. [1992] also hypothesized that the northern ice sheets could be affected by large pseudoperiodic surges. Further understanding of the nature of these events, their spatial and temporal distributions, and their origin(s), is necessary. We present here a set of observations relevant to this question, mainly based on records of the low-field
Grousset et al.: Heinrich Event patterns in North Atlantic
magnetic susceptibility made in 18 cores distributed over the northern North Atlantic.
DISTRIBUTION OF THE "HEINRICH LAYERS" The discovery of the so-called "Heinrich layers" is
attributable to the increased resolution of downcore
sediment studies: their thickness is commonly less than 10 cm, and they typically occur several tens of centimeters apart. High-resolution results were attai- ned by Bond et al. [1991, 1992] using a fast digital scanning of the grey reflectance along the core.
Heinrich events, in ODP 609 and other cores studied
in the same area, correspond to a shift from hemi- pelagic foraminiferal ooze (with high light reflec- tance) to layers rich in dark minerals and poor in biogenic carbonate. However, the light reflectance signature is not always simple because detrital carbonate (light) may be abundant within some events [Bond et al., 1992]. The method needs a high quality photograph picture (with regular illumination of the core) or direct scanning of freshly collected
sediment.
i 4o
M •x •
13ø
20w
55N I .... • ... t•
I
,
•1
KS7901
ß
SU,•038
n V27-20
I K 70 8- 7n
.•" '/] -•
"•"""-'"-'• 3r• "••' .... •'•"'""'../::-'"""-'"
...
,,
v
•
;:'i?•:ii?•ii?;:.'E.(
i:½-"-J•....•?•[
'-"•'"'"'•'•'.
...
:•••;•g:'-".:-'•...'•.:;•':i•:•-Oli:'K•
"-'"•'""
•,
...
'"•*:::i'l', ß
.... r •o. ,r •o. ,r ,r • .
40% ..
•
.
, ½/
/I
,,,' ,,',,
,
Fig. 1. Location of the cores. Symbols: french cores (solid circles); other cores: (solid squares) Heinrich [1988] and Jantschik and Huon [ 1992], (crossed squares) Broecker et al. [1992], (open squares) Ruddiman [ 1977]. Two west-east heavy dashed lines bordering the stippled envelope, define the location of the ice-rafted detritus belt during isotope stage 2 [after Ruddiman, 1977]. Within this belt, the rate of deposition of ice-rafted sand is greater than 300 mg cm -2 kyr -1. The =N-S solid line defines the axis of the Mid-Atlantic Ridge (MAR).
Grousset et al.- Heinrich Event patterns in North Ariantic 177
Magnetic susceptibility has been proposed as a fast and convenient way to record varying inputs of material derived from continental crust within a biogenic sediment matrix [Poutiers, 1975; Poutiers and Gonthier, 1978]. Whole-core low-field magnetic susceptibility (thereafter called magnetic susceptibi- lity) was measured aboard ship during two cruises in the North Atlantic Ocean immediately after coting (Figure 1). All the cores within the latitudinal belt of ice-rafted detritus (IRD belt) identified by Ruddiman
[1977] between --45 ø and --55øN, define a succession
of well-marked peaks in magnetic susceptibility (some examples are plotted on the Figure 2); on the other hand, we do not observe magnetic susceptibi- lity peaks in cores outside the IRD belt (Figure 2). The similarity of susceptibility peaks to most of the peaks in lithic detritus observed by Heinrich [ 1988] is striking. In this paper, we present evidence that these magnetic susceptibility changes do, in fact, record Heinrich layers.
The integrated magnetic susceptibility depends on the susceptibility and relative volume of each type of
INSIDE THE IRD BELT:
50 lOO 15o 200 250 300 ½rn 0
SU-g044 SU-gO08 SU-gOO9 SU-g043 50ø06N 43ø30N 43ø49N 50 • 18N 17ø56W 30ø24W 31 ø45W 19 ø 18W i i i i i i I i i , , i ,, i
'
ß i
.50
100 0
50
o50
0
50
1C;O
lO -• e.m.u.OUTSIDE THE IRD BELT-
o 50 100 SU-9004 150 200 250 300
cm 0
5'0
41ø08N 32ø04W i SU-9006 SU-9038 41ø02N 54ø06N 32ø43W 21 ø06W II I II I I II I II0
50
0
50
1•0
10 -• e.m.u.Fig. 2. Examples of low-field magnetic susceptibility profiles on uppermost 3 m in cores located inside and outside the ice-rafted detritus belt first recognized by Ruddiman [ 1977] (see location on Figure 1). Correspondences between peaks can be proposed on the basis of biostratigraphic argu-
178 Grousset et al.: Heinrich Event patterns in North Ariantic
sedimentary particle and on the porosity of the sediment. Biogenic skeletons, quartz or calcite have a
very low (or negative)
magnetic
susceptibility.
In
contrast, ferromagnetic and paramagnetic minerals have a high magnetic susceptibility. Possible sources of a high signal include: (1) iron- or titanium-rich magnetite [Poutiers and Gonthier, 1981], (2) goethi- te [Robinson, 1986], (3) iron sulfides (diagenetic minerals in organic-rich deposits) such as pyrrhotine or greigite [Poutiers, 1975]; and (4) iron-rich clay minerals [Poutiers, 1975]. Thus deposits with a large amount of biogenic material have typically low or negative magnetic susceptibility. At the opposite end of the spectrum, deposits with a large amount of ice- rafted detritus, especially with significant volcanic (mantle-) derived components have high magnetic susceptibility. The latter is typically the case in the North Atlantic glacial sediments. However, a frac-tion of the ice-rafted detritus minerals is carbonate-
derived from continental deposits [Bond et al., 1992] and these sediments may not appear as magnetic susceptibility peaks within the Heinrich layers.
As a first step, we checked the relationship between the magnetic susceptibility peaks and the signature of the Heinrich events. That signature consists of an increase in the proportion of material
derived from the continental crust and of the lithic
grains in the large size fraction (> 180 gm in the work by Heinrich [1988]), the light/dark variations described by Bond et al. [1990, 1992], the changes in absolute abundance of foraminifera and proportion of N. pachyderma sin., and the presence of detrital
carbonate [Bond et al., 1992].
THE SU-9008 RECORDS: METHODS AND
RESULTS
Core SU-9008 was used for calibrating magnetic susceptibility to lithologic and foraminiferal varia-
tion. This 12-m core was raised from the western
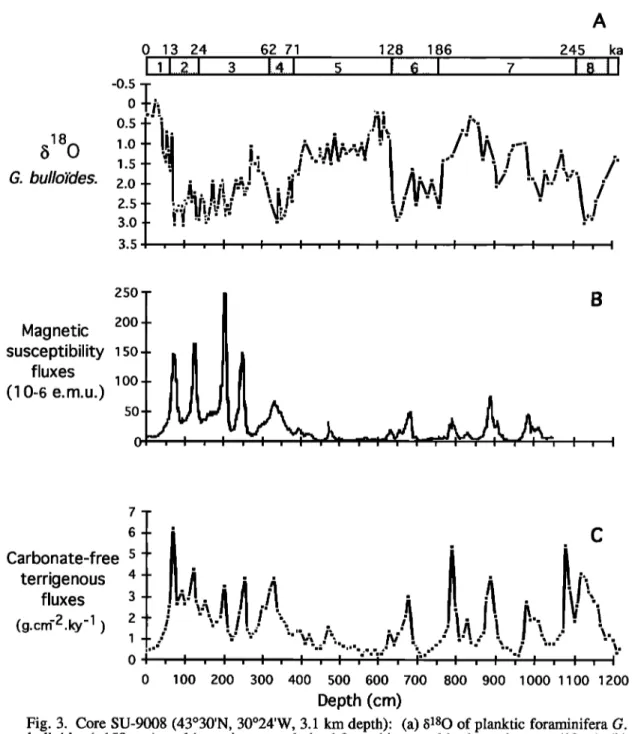
side of the Mid-Atlantic Ridge (MAR) (=43ø30'N and =30ø24'W, 3.1-km water depth). Stratigraphy was provided by •80 isotopic analysis performed at 5 cm intervals on the planktonic foraminifera Globigerina bulloides (Figure 3a, Table 1). The core top values are consistent with the expected present- day values for this species and location [Duplessy et al., 1991]. Reference ages were derived from the •80 record by detailed correlation of stages with the SPECMAP stacked 15•80 signal [Martinson et al., 1987]; intermediate ages are estimated by polynomial interpolations between SPECMAP ages of Martinson et al. [1987]. The 15•80 values are reported versus sediment depth (centimeters) and estimated age (kiloyears) in Table 2. We have identified ash-zone I (=10.5 kyr B.P.-50 cm) and II (=60 kyr B.P.-340 cm) [Ruddiman and Glover, 1972] which although barely visible at this southern latitude, provide additional age control. The core covers about 260 kyr, which corresponds to a mean accumulation rate
of =4.6 cm kyr -•. Our samples are thus spaced at about 1 kyr intervals.
Whole-core low-field magnetic susceptibility was measured aboard ship with a pass-through Barring- ton magnetometer. This instrument integrates the
sediment section within the coil (12.5 cm diameter
for SU-9008). Without deconvolution, the resolution of the signal is only about 5-10 cm. In addition, the
same instrument was used with a smaller coil (4 cm
diameter), to record the changes in magnetic suscep- tibility along a continuous subsampling of core SU- 9008. The sampling was done using a transparent PVC U-shaped channel. Resolution after deconvo- lution of the signal is of the order of =2 cm (Figure 3b). Five well-defined peaks are recorded for the last glacial period (isotopic stages 4 to 2), and smaller peaks appear in the preceeding glacial sediment. Within the uppermost two peaks, we separated the magnetic particles with an electromagnet (Franz separator). When observed under scanning micros- cope with EDAX, these particles appear as small Fe- and Ti-magnetite grains, associated with crust- derived feldspars. Measurements of the magnetic susceptibility of these grains reveal that they bear more than 50% of the total susceptibility signal.
The input of material derived from the continent ("terrigenous") has been quantified as follows. Water content (percent) was measured on known volumes of freshly retrieved sediment, allowing calculation of the bulk dry density of each sample (g.cm-3). CaCO3 content (%) was obtained by the gasometric method. Using these data and accumulation rates (cm kyr -•) derived from the •80 stratigraphy, we calculated terrigenous (carbonate-free) fluxes (in g cm -2 kyr -•) (Figure 3c). We are fully aware of the inaccuracy of such a calculation; a better evaluation would require radiocarbon datings. However, considering these fluxes as a first order approach, increase in the terrigenous flux by a factor 2 or 3 occurs at the same depths as the magnetic susceptibility peaks. This procedure apparently is too coarse to identify the reduction in foraminifera fluxes within the uppermost three IRD peaks that was found by Bond et al.
[1992].
The grey level reflectance of core SU-9008 has been analyzed following Bond et al. [1992]. The relative scale varies from white (0) to black (256). The record is reported on Figure 4a for the upper- most 400 cm in relation to the magnetic susceptibility signal. A clear relationship exists between the grey scale and susceptibility, at least in the depth distri- bution of the peaks. The grey-scale structure of core SU-9008 is similar enough to the ODP 609 record of Bond et al. [1992] to infer the position of most of the Heinrich layers (HL1 to 6) in SU-9008, with only HL3 not well represented (Figure 5).
We counted lithic grains (as percent abundance over total number of lithics plus foraminifera shells) in the >150 gm fraction, down to 320 cm depth (Table 2). Well-defined IRD peaks (up to =75 to
Grousset et al.: Heinrich Event patterns in North Atlantic A
8180
G. bullo;des. 0 13 24 0 0.5 1.0 1.5 2,0 2.5 3.0 3.5 62 71 128 186 245 ka3
[!141
s
l i
!
?
!;iiiill
179Magnetic
susceptibility fluxes (1 0-6 e.m.u.) 200 150 100 50B
7 Carbonate-free sterrigenøus
fluxes4
3 ß .(g.
cnf2.ky-1
) 2
1
',•' %" '"'•_%
I I .I Illi•-
•.'
..
ol , • , • , • , • , • ,"i' , •-'", • , • ;' • , • , •
0 100 200 300 400 500 600 700 800 900 1000 1100 1200Depth (cm)
Fig. 3. Core SU-9008 (43ø30'N, 30ø24'W, 3.1 km depth): (a) b•80 of planktic foraminifera G. bulloides (>150 I. tm), and isotopic stages derived from this record in the entire core (12 m); (b)
low-field
magnetic
susceptibility
flux (in 10
-6 electromagnetic
units
cm
-2 kyr-•); (c) terrigenous
(carbonate-free fraction) flux (in g cm -2 kyr-Z).
95% lithic grains of this size fraction) are present within the same depth ranges as the grey scale reflectance and magnetic susceptibility peaks (Figure 4a). Microscopic observation and X ray diffraction of the lithic fraction corresponding to the peaks allowed us to identify quartz, micas and numerous crust-derived minerals among ubiquitous brown volcanic shards. The coarsest grains (millimeter-to-
centimeter) have various petrological compositions (sandstone, basalt, granite, gneiss...). The proportion of carbonate grains (including dolomite) was estimated using a polarizing microscope in the uppermost 220 cm of the core. A semi-quantitative measurement was obtained by observing 50 grains, through cross-nichols, and counting the number of carbonate grains therein (Figure 4d). The relative
1 $0 Grousset et al.: Heinrich Event patterns in North Atlantic
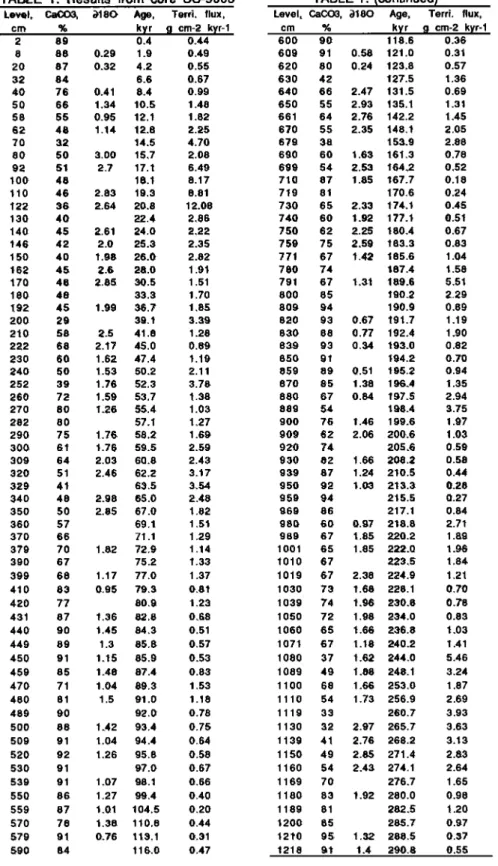
TABLE 1. Results from core SU-9008 Level, CaCO3, o•180 Age, Terri:. flux,
cm % kyr •I cm-2 kyr-1
2 89 0.4 0.44 8 88 0.29 1.9 0.49 20 87 0.32 4.2 0.55 32 84 6.6 0.67 40 76 0.41 8.4 0.99 50 66 1.34 10.5 1.48 58 55 0.95 12.1 1.82 62 48 1.t4 12.8 2.25 70 32 14.5 4.70 80 50 3.00 15.7 2.08 92 51 2.7 17.1 6.49 100 48 18.1 8.17 t10 46 2.83 19.3 8.81 122 36 2.64 20.8 12.08 130 40 22.4 2.86 140 45 2.61 24.0 2.22 146 42 2.0 25.3 2.35 150 40 1.98 26.0 2.82 162 45 2.6 28.0 1.9! 170 48 2.85 30.5 1.51 180 48 33.3 1.70 192 45 1.99 36.7 1.85 200 29 39.1 3.3.9 210 58 2.5 41.8 1.28 222 68 2.!7 45.0 0.89 230 60 1.62 47.4 1.19 240 50 1.53 50.2 2.11 252 39 1.76 52.3 3.78 260 72 1.59 53.7 1.38 270 80 1.26 55.4 1.03 282 80 57.1 1.27 290 75 1.76 58.2 1.69 300 61 1.76 59.5 2.59 309 64 2.03 60.8 2.43 320 51 2.46 62.2 3.17 329 41 63.5 3.54 340 48 2..98 65.0 2.48 350 50 2.85 67.0 1.82 360 57 69.1 1.51 370 66 71.1 1.29 379 70 1.82 72.9 1.14 390 67 75.2 1.33 399 68 1.17 77.0 1.37 410 83 0.95 7'9.3 0.81 420 77 80.9 1.23 431 87 1.36 82.8 0.68 440 90 1.45 84.3 0.51 449 89 1.3 85.8 0.57 450 91 1.15 85.9 0.53 459 85 1.48 87.4 0.83 470 71 1.04 89.3 1.53 480 81 1.5 91.0 1.18 489 90 92.0 0.78 500 88 t.42 93.4 0.75 509 91 1.04 94.4 0.64 520 92 !.26 95.8 0.58 530 91 97.0 0.67 539 91 1.07 98.1 0.66 550 86 1.27 99.4 0.40 559 87 1.01 104.5 0.20 5:70 78 1.38 110.8 0.44 579 91 0.76 113.1 0.31 590 84 116.0 0.47 TABLE 1. (continued)
Level, CaCO3, o•180 Age, cm % kyr 600 90 118.6 609 91 0.58 121.0 620 80 0.24 123.8 630 42 127.5 640 66 2.47 131.5 650 55 2.93 135.1 661 64 2.76 142.2 670 55 2.35 148.1 679 38 153.9 690 60 1.63 161.3 699 54 2.53 164.2 710 87 1.85 167.7 719 81 170.6 730 65 2.33 174.1 740 60 1.92 177.1 750 62 2.25 180.4 759 75 2.59 183.3 771 67 t.42 185.6 780 74 187.4 791 67 1.31 189.6 800 85 190.2 809 94 190.9 820 93 0.67 191.7 8 30 88 0.77 192.4 839 93 0.34 193.0 850 91 t94.2 859 89 0.51 195.2 870 85 1.38 196.4 880 67 0.84 197.5 889 54 198.4 900 76 1.46 199.6 909 62 2.06 20.0.6 920 74 205•6 930 82 1.66 208.2 939 87 1.24 210.5 950 92 1.03 213.3 959 94 215.5 969 86 217.1 980 60 0.97 218.8 989 67 1.85 220.2 1001 65 1.85 222.0 1010 67 223.5 1019 67 2.38 224.9 1030 73 1.68 228.1 1039 74 1.96 230.8 1050 72 1.98 234.0 1060 65 1.66 236.8 1071 67 1.18 240.2 1080 37 1.62 244.0 1089 49 1.88 248.1 1100 68 1.66 253.0 1110 54 1.73 256.9 1119 3 3 260.7 1130 32 2.97 265.7 1139 41 2.76 268.2 1150 49 2.85 271.4 1160 54 2.43 274.1 1169 70 276.7 1180 83 1.92 280.0 1189 81 282.5 1200 85 285.7 1270 95 1.32 288.5 1218 91 1.4 290.8 Terri. flux, • cm-2 kyr-1 0.36 0.31 0.57 1.36 0.69 1.31 1.45 2.05 2.88 0.78 0.52 0.18 0.24 0.45 0.51 0.67 0.83 1.04 1.58 5.51 2.29 0.89 1.19 1.90 0.82 0.70 0.94 1.35 2.94 3.75 1.97 1.03 0.59 0.58 0.44 0.28 0.27 0.84 2.71 1.89 1.96 1.84 1.21 0.70 0.78 0.83 1.03 1.41 5.46 3.24 1.87 2.69 3.93 3.63 3.13 2.83 2.64 1.65 0.98 1.20 0.97 0.37 0.55
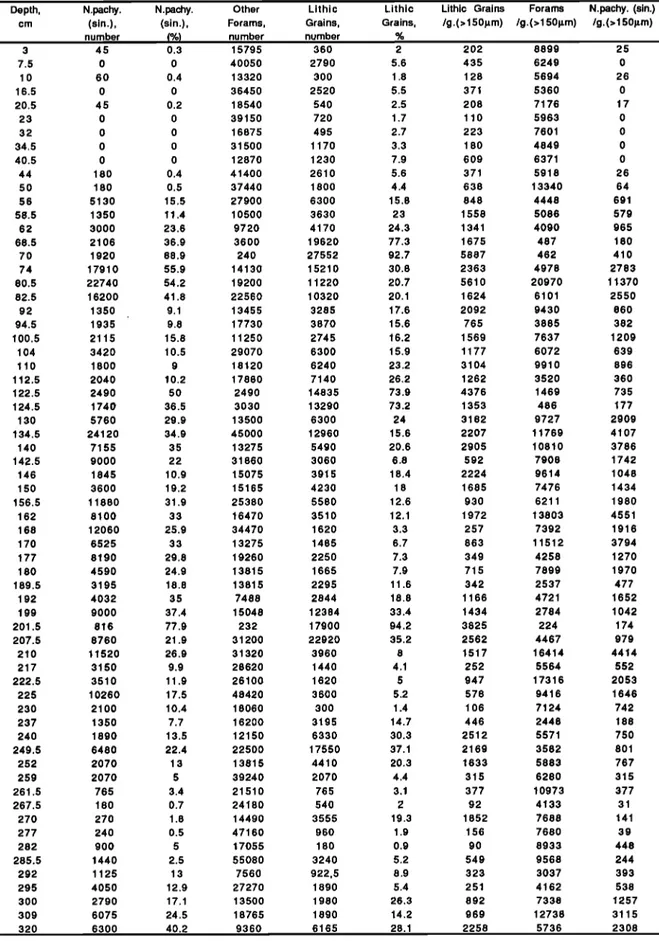
TABLE 2. Lithic Grain and Foraminifera Depth, cm 3 7.5 10 16.5 20.5 23 32 34.5 40.5 44 50 N.pachy. (sin.), number 45 0 60 0 45 0 0 0 0 180 180 5130 1350 3000 2106 1920 17910 22740 16200 1350 1935 2115 3420 1800 2040 2490 1740 5760 24120 7155 9000 1845 3600 11880 8100 12060 6525 8190 4590 3195 4032 9000 816 8760 11520 3150 3510 10260 2100 1350 1890 6480 2070 207O 765 180 270 240 900 1440 1125 4050 2790 6075 6300 56 58.5 62 68.5 7O 74 80.5 82.5 92 94.5 100.5 104 110 112.5 122.5 124.5 130 134.5 140 142.5 146 150 156.5 162 168 170 177 180 189.5 192 199 201.5 207.5 210 217 222.5 225 230 237 240 249.5 252 259 261.5 267.5 270 277 282 285.5 292 295 300 309 320 N.pachy. Other L i t h i c (sin.), Forams, Grains,
(%) number number 0.3 15795 360 0 4005O 2790 0.4 13320 300 0 36450 2520 0.2 18540 540 0 39150 720 0 16875 495 0 31500 1170 0 12870 1230 0.4 41400 2610 0.5 37440 1800 15.5 27900 6300 11.4 10500 3630 23.6 9720 4170 36.9 3600 19620 88.9 240 27552 55.9 14130 15210 54.2 19200 11220 41.8 22560 10320 9.1 13455 3285 9.8 17730 3870 15.8 11250 2745 10.5 29070 6300 9 18120 6240 10.2 17880 7140 50 2490 14835 36.5 3030 13290 29.9 13500 6300 34.9 45000 12960 35 13275 5490 22 31860 3060 10.9 15075 3915 19.2 15165 4230 31.9 25380 5580 33 16470 3510 25.9 34470 1620 33 13275 1485 29.8 19260 2250 24.9 13815 1665 18.8 13815 2295 35 7488 2844 37.4 15048 12384 77.9 232 17900 21.9 31200 22920 26.9 31320 3960 9.9 28620 1440 11.9 26100 1620 17.5 48420 3600 10.4 18060 300 7.7 16200 3195 13.5 12150 6330 22.4 22500 17550 13 13815 4410 5 39240 2070 3.4 21510 765 0.7 24180 540 1.8 14490 3555 0.5 47160 960 5 17055 180 2.5 55080 3240 13 7560 922,5 12.9 27270 1890 17.1 13500 1980 24.5 18765 1890 40.2 9360 6165
Shell Counts in Core SU-9008
Lithic Lithic Grains
Grains, /g.(>150gm) % 2 202 5.6 435 1.8 128 5.5 371 2.5 208 1.7 110 2.7 223 3.3 180 7.9 609 5.6 371 4.4 638 15.8 848 23 1558 24.3 1341 77.3 1675 92.7 5887 30.8 2363 20.7 5610 20.1 1624 17.6 2092 15.6 765 16.2 1569 15.9 1177 23.2 3104 26.2 1262 73.9 4376 73.2 1353 24 3182 15.6 2207 20.6 2905 6.8 592 18.4 2224 18 1685 12.6 930 12.1 1972 3.3 257 6.7 863 7.3 349 7.9 715 11.6 342 18.8 1166 33.4 1434 94.2 3825 35.2 2562 8 1517 4.1 252 5 947 5.2 578 1.4 106 14.7 446 30.3 2512 37.1 2169 20.3 1633 4.4 315 3.1 377 2 92 19.3 1852 1.9 156 0.9 90 5.2 549 8.9 323 5.4 251 26.3 892 14.2 969 28.1 2258 Forams /g.(>150gm) 8899 6249 5694 5360 7176 5963 7601 4849 6371 5918 13340 4448 5086 4090 487 462 4978 20970 6101 9430 3885 7637 6072 9910 3520 1469 486 9727 11769 10810 7908 9614 7476 6211 13803 7392 11512 4258 7899 2537 4721 2784 224 4467 16414 5564 17316 9416 7124 2448 5571 3582 5883 6280 10973 4133 7688 7680 8933 9568 30'37 4162 7338 12738 5736 N.pachy. (sin.) /g. (> 1501•m) 25 0 26 0 17 0 0 0 0 26 64 691 579 965 180 410 2783 11370 2550 860 382 1209 639 896 360 735 177 2909 4107 3786 1742 1048 1434 1980 4551 1916 3794 1270 1970 477 1652 1042 174 979 4414 552 2053 1646 742 188 750 801 767 315 377 31 141 39 448 244 393 538 1257 3115 2308
--Grey
level
--Magnetic
susceptibility
fluxes (lO-6 e.m.u.)
dark 2_60 HL1 :•HL2 HL3 HL4 HL5 300 240
220
250
200 200 A180
150
160
100
140120
50
light
100 ... 0 ...100 T
'•ii
i
i
?!iii
•
% lithic
grains
(>1 50pm)
.
,
i
Pachy.(sin)/g
6ooo-- :[]/•
• Pachy.
5000" •/•! •
[ • •
(sin)
--80
4000"
•
:
::•:
"60
3000
--
2000
--
c D• ...
I ....
I 0
0 50 iiiiiiiiiiiiiii 1 O0 i!ii!iiiiiiii 15011iiiiiiiiiiii:i 20•ii 2i5i0 300 350 400
% 20 ' 15 10 5 0 0 mmi:i:i: :::::::::::::::::::::::::: , , , , ,i.m..r•"•'•!mlmm.,,mmm.mmm,mM :':':':':':':"' m!,mmm!mm•,,ii•,mmm!mm,,.• *:':':'..'::_'. . 50 100 150 200 ß mm ::::m
ii
,% 'o
ß ß •• ! m ! m m ;'5O 3OO% Carbonate grains
(> 1 50pm)
• m m m m i 350 400Depth (cm)
Grousset et al.: Heinrich Event patterns in North Atlantic 183
proportions of detrital carbonate grains display peaks (up to 10-20 % of the lithic fraction), in phase with the proportion of lithics and the magnetic susceptibility peaks in HL1, HL2, HL4 and HL5. They are rare to absent between the peaks and in HL3. Similar results were reported by Bond et al.
[1992] in cores from the eastern North Atlantic. In cores from the western north Atlantic, however,
Bond et al. [1992] found layers rich in detrital carbonate in HL3.
We estimated the absolute amounts of the foraminiferal species: Neogloboquadrina pachyder- ma sin. This species dominates the foraminifera population in cold surface waters. Sharp increase in N. pachyderma sin. relative abundance (percent of
the foraminifera content) is associated with the lithic
and magnetic susceptibility peaks (Figure 4c), as expected for the classical description of Heinrich
events [Heinrich, 1988; Bond et al., 1992]. On the
other hand, sharp peaks in the absolute amount of N. pachyderma sin. (4000 to 11,000 shells/gram)
appear just below the lithic peaks (:10 cm below the peak maximum). All of the subevents observed within a Heinrich layer are bracketed in Figure 4 (N. pachyderma sin. relative abundance, N. pachyderma
sin. absolute abundance, magnetic susceptibility, lithic grain, carbonate grain and darker color peaks.
One more question must be answered before associating magnetic susceptibility peaks with Hein- rich's events: is the timing of the events the same in Northwest Atlantic core SU-9008 as in the northeast Atlantic records studied by Heinrich [1988] and
Bond et al. [ 1992]? Heinrich [1988] relied on a low-
resolution oxygen isotopic record. Bond et al. [ 1992] give detailed AMS radiocarbon dates for the first three events, and ages derived from changes in the reflectance curve -- interpreted as a proxy for sea- surface temperature -- lower in site 609 (Fig.5): (1) HL1 (the uppermost Heinrich layer) is located at the base of the 15180 transition IA, and AMS-14C dated
between .• 13.4 and .• 14.5 ka in site 609 (with a-0.4
kyr correction for the •4C apparent age of surface waters). This fits with the 15•80 interpolated age of the first event (: 15.4 kyr at 70 cm downcore) in SU- 9008 (Table 1). (2) HL2 is located in the middle of
isotopic
stage
2, and AMS-•4C dated
it at. :18.9-
21.4 ka in ODP 609. In core SU-9008, this second event is located at --120 cm and has a 15180interpolated age of --20 kyr. (3) HL3 is located at the transition between isotopic stages 2 and 3, and is
dated by AMS-•4C between =25.6 and 29.2 kyr B.P. in site 609. The magnetic susceptibility and lithic grain records do not show clearly defined peaks at that level, but the peak in N. pachyderma sin. abundance at --165 cm depth could be the cor- responding signature (15180 interpolated age of --27 kyr). Moreover, the magnetic susceptibility peak can be recognized in many other cores (for instance: SU- 9009 in Figure 2). (4) HL4 and HL5 are located within isotopic stage 3 at 15•80-extrapolated ages of
.•40 and
--50 ka in site 609, compared
with the 15180
-
estimated ages of --38 kyr (at 200 cm) and --52 kyr (at 250 cm) in core SU-9008. (5) HL6 covers
isotopic
stage
4 (with a peak
at 350 cm, and
an 15•80
-
extrapolated age of about 67 ka in core SU-9008) and generally displays a slight signal; it will consequently not be considered in this study.
In conclusion, the clear temporal correlation between the "classical" description of the Heinrich events and the magnetic susceptibility signature validates the use of the magnetic susceptibility records as a HL monitor.
SPATIAL DISTRIBUTION OF THE HEINRICH LAYERS
Methods
We may map the spatial distribution of the Heinrich layers during the last glacial period with the magnetic susceptibility records. Two different methods have been used for the reconstruction:
1. the first is based on the thickness of each event. To the 18 cores where the magnetic susceptibility peaks are sufficiently well-defined, we add 17 additional cores where the events have other typical signatures: lithic grain counts, quartz content, obtained from the literature (Figure 1 and Table 3). Whatever the parameter we consider (abundancy, intensity, or flux), thickness is measured in centi- meters, at midheight of peaks identified on these
different records. In some other cores, Ruddiman
[1977] observed such a negligible amount of IRD, that we consider them as HL-free cores.
2. the second is based on the distribution of the integrated magnetic susceptibility over each peak. This value is obtained by multiplying the maximum value of the magnetic susceptibility peak (10 -6 elec- tromagnetic units), by the thickness (centimeters) of
Fig. 4. Core SU-9008: focus on the uppermost 400 cm; (a) grey level pattern (relative scale from
white
(0) to black
(256)), along
with low-field
magnetic
susceptibility
flux (in 10
-6 electromagnetic
units cm -2 kyr-1). Dark bands highlight the Heinrich layers (HL); (b) proportion of lithic grains in the > 150 gm fraction. (c) number per gram (thin line) and percentage (thick line) of N. pachyderma (sinistral), in the >150 gm fraction. (d) proportion (percent) of detrital carbonate grains in the coarse lithic fraction (> 150 gm), counted only between 50 and 320 cm.
184 Grousset et al.: Heinrich Event patterns in North Atlantic
Age (ky) and isotopic stages
0 20 40 60 80 100 120 140
0 ß ß ß I • • • I I I I I I I I I I I ß I • • ß I ' i [ I ß
i 20 - DP 40 - level60-
i[
__
•lll :. light
lOO - lOO.,h i.d•
I
I
h
Grey
! !
•,/%•"•i!
i '•
15d
evel
,•L• %,V•:• • '•11"
• tsu-•oo•l • • / ... :: dark • 250•. •. Comp•on oE the •c• •c•]c mco•d• obtained on both com•
•008 (th•n ]•nc). A•c• •c dc•vcd from md•oc•bon •c• mc•umd •n corn OD• 60• •Bond ct •]., •2]. •hc •c-•c•]c proposed Eo• SU-•008 • con,trained b• th•
the peak measured at midheight. If we assume that,
for each Heinrich event, the duration was about the
same in each core, we may consider this integrated magnetic susceptibility value as a flux value. These measurements were available on 18 cores.
The first method is based on a much larger set of cores but is less rigorous, because we did not demonstrate that the different indicators (lithic grain counts, quartz content, etc.) have the same temporal distribution. The second method gives more quanti- tative and homogeneous data but only 18 cores are available. Geographical limits of the Heinrich layer zones are also constrained following the observa- tions of Ruddiman [1977], using cores with negli- gible amounts of ice-rafted detritus as external boundaries (Figure 1). Only the five most recent
events are considered for the reconstruction, because
many cores do not reach isotopic stage 4.
coincident with the Heinrich layers for the last glacial period. The patterns are mostly characterized by decreasing west-to-east gradients, elongated around the latitude =45øN, except for HL3 which is oriented slightly NW-SE. This slight shift of the HL3 pattern is a possible reason for which there is no HL3 event in core SU-9008, although the pattern of HL3 may be interpreted differently [see Bond et al., 1992]. All patterns appear to follow the southern limits of the polar waters defined by the high abundance (both % and flux) of N. pachyderma sin. Their axis shifts northward by --2 ø latitude, for example, from HL2 (=45øN), which is at the peak corresponding to the last glacial maximum, to HL5 (=47øN), which occur- red during interstadial stage 3 (Figures 6 and 7). POTENTIAL ORIGINS FOR THE HEINRICH LAYERS MATERIAL
Results
The short events of ice-rafted detritus accumula- tion identified by Heinrich [1988] in the northeast Atlantic during the last glacial period, and recently documented in a high-resolution study by Broecker et al. [ 1992], are not a local pattern but occur roughly
between 40øN and 55øN, across the entire North
Atlantic. The definition of the zone of high deposition of ice-rafted detritus by Ruddiman [ 1977] is coherent with the zone in which the peaks of magnetic susceptibility are well defined (Figures 1, 6
and 7). It can thus be assumed that this zone is
The observed flux gradients are consistent with input by icebergs transported and melted along the southern margin of a large cyclonic gyre coveting the northern Atlantic ocean during the glacial period.
However, more than one source of the IRD in these
layers is possible. A Canadian provenance is proba-
ble for HL1, HL2, HL4 and HL5, based on the
abundance and thickness variations of layers (see gradients on Figures 6 and 7 and in the work by Bond et al. [1992]). Owing to the low content of detrital carbonate in HL3, the IRD in this layer may have had a different source (Irminger Basin? Green- land Basin?), but we do not have enough cores to
Grousset et al.' Heinrich Event patterns in North Atlantic 185 Cores ME 69-17 ODP 609 KS 7901 KS 7914 KS 7915 KS 7917 KS 7918 KS 7924 KS 7925 KS 7928 KS 7929 SU-9004 SU-9008 SU-9011 SU-9012 SU-9013 SU-9039 SU-9040 SU-9043 SU-9044 CH 6909 V23-16
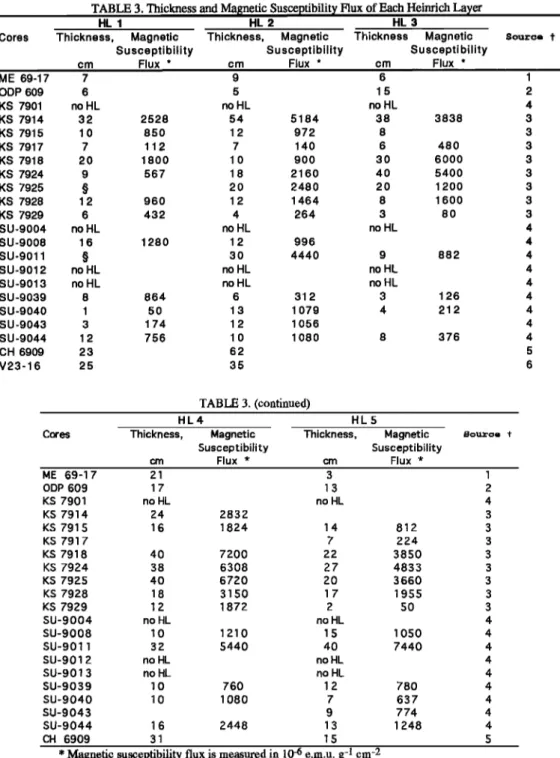
TABLE 3. Thickness and Magnetic Susceptibility Flux of Each Heinrich Layer
HL I HL 2 HL 3
Thickness, Magnetic Thickness, Magnetic Thickness Magnetic Su sce pti bi li ty Su sce pti bi lity Su scepti bi lity
cm Flux * cm Flux * cm Flux *
Sour=e t 7 9 6 6 5 15 no HL no HL no HL 32 2528 54 5184 38 3838 1 0 850 1 2 972 8 7 112 7 140 6 480 20 1800 10 900 30 6000 9 567 18 2160 40 5400 õ 20 2480 20 1200 12 960 12 1464 8 1600 6 432 4 264 3 80 no HL no HL no HL 16 1280 12 996 õ 30 4440 9 882 no HL no HL no HL no HL no HL no HL 8 864 6 312 3 126 1 50 13 1079 4 212 3 174 12 1056 12 756 10 1080 8 376 23 62 25 35 TABLE 3. (continued) Cores HL4 HL5
Thickness, Magnetic Thickness, Magnetic Susceptibility Susceptibility cm Flux * cm Flux * ME 69-1 7 21 3 ODP 609 1 7 1 3 KS 7901 no HL no HL KS 7914 24 2832 KS 7915 16 1824 14 812 KS 791 7 7 224 KS 7918 40 7200 22 3850 KS 7924 38 6308 27 4833 KS 7925 40 6720 20 3660 KS 7928 18 3150 1 7 1955 KS 7929 1 2 1872 2 50 SU-9004 no HL no HL SU-9008 1 0 1 210 1 5 1 050 SU-901 1 32 5440 40 7440 S U- 901 2 no HL no HL SU-901 3 no HL no HL SU-9039 1 0 760 1 2 780 SU-9040 10 1080 7 637 SU-9043 9 774 SU-9044 1 6 2448 1 3 1 248 CH 6909 31 1 5
* Magnetic susceptibility flux is measured in 10 -6 e.m.u. g-1 cm-2
+ Sources: 1, Heinrich [1988]; 2, Broecker et al. [1992]; 3, Grousset et al. [1981]; 4, this work; 5, Pastouret et al. [ 1975]; 6, Bond et al. [ 1992].
õ: HL1 not sampled (upper-core missing?).
Source
confirm this. We may get more information on origins by deciphering source fingerprints borne by IRD particles using their isotopic composition, as described below.
In order to identify better the origins of the ice rafted detritus, we have analyzed the Nd-Sr isotopic composition of the terrigenous fraction in three cores
(SU-9008, KS-7925, KS-7929). We present here results from only core SU-9008. On Figure 8, we have plotted Nd isotopic ratios (as ENd(O)) along with
87Sr/86Sr
ratios.
On this kind of plot, each
sample
is
generally located on mixing hyperbolae, linking two
end-members, or one end-member and a mixture of some others [Faure, 1986]. In our case, the first end-
186 Grousset et al.: Heinrich Event patterns in North Atlantic ! -45 ... b ... • ... •-- -•-• ... • ... i• i '• i. / • i / I• : , I I •
...
i ...
; ...
i ...
i ...
'::'4"""':
...
r3
•' '
-40
--•20:/••
•' I - -
!-,,---
...
....
...
I:
....
...
-}
/
•o ... , ... : ... •- ... i ... 1 ... • ...!
I
/ •o •o •o W , ? •
Fig. 6. Patterns of Heinrich layer thickness (in cm);
HL1 to HL5; ice-rafted detritus belt [after Ruddiman,
1977] is shown in dashed lines. Open symbols represent cores in which HL are not present.
member would be the mantle-derived provinces: Iceland and the eastern Greenland basaltic province (Figure 9). During the entire glacial period the cores have a contribution of small volcanogenic particles that may explain this contribution. However, their abundance is small compared to the large crust-
/ 'lO
i
'"'-- ...- •o
7 16•.• o
•o • 20
EL 4 ,•
•
¾
•
,.
derived input during the Heinrich layers. The second
end-member must be determined. Most of the HL
samples (except HL3) are located in the envelope (central, heavy stippled area) of mixing hyperbolae linking Iceland+northeast Greenland volcanic rock composition (plotted as G.V.R. on Figure 8) with the isotopic composition of the northern Labrador Basin region (Baffin Island rocks, Baffin Bay sediments, western Greenlandic rocks)(Figure 9). Clearly, the main source of the Heinrich layers is located in and around the northern part of the Labrador Basin. Rocks and sediments from south- eastern Greenland and the Canadian shield do not seem to be a main end-member (lower stippled envelope, Figure 8). Potential sources from the
northern (Fram Strait and Arctic Ocean) and/or northeastern side of the Atlantic Ocean (Fenno-
scandian, Barentz and Svalbard ice sheets) may also be discarded too (upper stippled envelope, Figure 8). From classical mixing equations, it is possible to evaluate the respective contributions from the two end-members. For example, HL1 is composed of =-70% "Baffin" particles (Baffin Bay sediments being used as an end-member) and only =30% volcanic (Icelandic) particles. There is an exception (HL3):
Grousset et al.: Heinrich Event pattems in North Atlantic 187
Fig. 7. Patterns of Heinrich layer: magnetic suscepti-
bility integrated
fluxes (expressed
in 10
-3 electro-
magnetic
units
cm
-2 kyr-1);
HL1 to HL5; ice-rafted
detritus belt [after Ruddiman, 1977] is shown inthis Heinrich layer has an isotopic composition very close to the values from the Fram Strait-Norwegian margin.
K-Ar and Rb-Sr isotopic compositions of the clay and silt fractions have been analyzed in core ME-68- 89 (same location as ME-69-17 in Figure 1)[Huon et
al., 1991; Huon and Jantschik, 1993]. These authors observed that the four more recent Heinrich layers are characterized by high 87Sr/86Sr ratios (as obser- ved in SU-9008) and higher K-Ar ages (--800-
1000Ma) than in the core sediment background (=370-500Ma). In the North Atlantic Ocean, such old deposits have only been observed in the Labrador Basin [Dasch, 1969; P.E. Biscaye et al., manuscript in preparation, 1993] where they were considered as
Canadian shield-derived materials. The situation is
different for HL3 (--27 kyr), for which Jantschik and Huon [1993] report a =400 m.y. K-Ar age, which is consistent with an Arctic (+Scandinavian?) origin.
Our observations confirm these results.
Mineralogical arguments are also consistent with this hypothesis. Bond et al. [1992] have observed that in all the HL from site 609, the mineralogy of the coarse ice-rafted grains was similar, with a strong component of detrital carbonate, except HL3. We
have observed the same enrichment in detrital
carbonate fragments for the uppermost Heinrich layers of cores SU-9008, SU-9011, and SU-9039 (Figure 1). Such layers rich in detrital carbonate also exist in core CH6909 [Pastouret et al., 1975] (Figure 1). The only englaciated regions in which large
188 Grousset et al.' Heinrich Event patterns in North Atlantic
Nd(o)
+10 ' Iceland -10 -2O -3O -4O Frami :.'?Strait
HL3
Saint Lawrence SPM,) .' Seuth-East.' ß ß '.. Europe. an ""' Nor•.atj-- margins gin.: i' .)).."].. :T. :--. ß -.' ' West Green]and 0,70 0,71 0 ,TZ 0,73 0,7•i 0,75 0,76 0,77 87Sr/86SrFig. 8.87Sr/86Sr
ratios
ploted
against
143Nd/144Nd
ratios.
The 143Nd/144Nd
ratios
are expressed
as • Nd(O)=(((143Nd/144Nd)meas./0.512636)-1)*
10,000.
Analytical
techniques
have
been
previous-
ly described [Grousset et al., 1988; Grousset and Biscaye, 1989]. Error bars are smaller than symbol size. Nd and Sr isotopic data of the potential sources are from the literature: P.E. Biscaye et al. (unpublished manuscript, 1993), Faure et al. [1963], Goldstein and Jacobsen [1988a, b], Grousset et al. [1988], McCulloch and Wasserburg [1978], O'Nions and Pankhurst [1973], Stordal and Wasserburg [1986], Taylor et al. [1983], and Zindler et al. [1982]. On such a diagram, mixing lines are hyperbolae. Heinrich layer compositions (black squares) can be interpreted as a mixture of a mantle-derived end-member (Iceland+Greenland Volcanic Rocks (G.V.R.)) and a crust-derived end-member (Baffin Island+West Greenland regions for most of the HL, and Arctic+Norway for HL3).
deposits of limestone and dolomite are observed, are in eastern and northeastern regions [Latouche and Parra, 1979], Baffin Bay [Aksu and Piper, 1987]
and Baffin Island [MacLean and Williams, 1983],
although some smaller deposits exist in northern Europe and north-eastern Greenland (Figure 9).
IMPLICATIONS FOR THE SURFACE CIRCU- LATION DURING THE LAST GLACIAL PERIOD
Two models of circulation have been proposed to explain the distribution of ice-rafted material in the North Atlantic [Smythe et al., 1985]:
1. The first, the "locus-of-melting" model, links
ice-rafted material accumulation to a stable southern
boundary of the polar waters, where maximum melting of icebergs was occurring;
2. The second, the "ice-flow trajectories" model, considers a more progressive melting of icebergs flowing out of the ice-shelves, with accumulation of ice-rafted detritus along their trajectories.
Ruddiman [1977] argued that the ice-rafted detritus depositional patterns of the last glacial period, were consistent with the "locus-of-melting" model. The second model better explains the volcanic ash depositional patterns, probably transported by
sea ice which melted faster [Ruddiman and Glover,
1975]. Each model appears to be relevant to different aspects of the Smythe et al. data [ 1985].
If we compare the maps of Figures 6 and 7, for
HL2 (which occured near the Last Glacial Maxi- mum) with the CLIMAP results [1976, 1981] and
take into account further discussion of the hydro- logical implications from Keefer et al. [1988], then the accumulation of ice-rafted detritus follows appro- ximately the northern limit of the zone of zero wind stress curl. This indicates a preferential accumulation and melting of the icebergs along the southern boundary of the polar waters. The western boundary of the high detrital fluxes zone would define the longitude of the injection from the north (the western limit of the associated cyclonic gyre). Most of the Heinrich layers have a Baffin Bay (and northwest
Grousset et al.' Heinrich Event patterns in North Atlantic
60"
50"
40"
Barfin Bay Fram Strait
I I Greenland •i I 60" • Azores 50" 40" 30" 20" 10 ø
Fig. 9. Two different trajectory models can De proposed to reconcile HL patterns (Figures 6 and 7) and IRD source regions (Figure 8): during Heinrich events 1,2,4, and 5, icebergs were coming from the Baffin Bay, drifting across the Labrador Basin; during event 3, they were coming from the "Arctic" region, drifting across the Irminger Basin. These patterns fit the two trajectory models previously proposed by Smythe et al. [ 1985].
189
Greenland)
origin (Figure 9). They do not have
apparent contribution of detritus from the East Greenland province, and even from Scandinavian and/or the Arctic regions (Figure 8). HL3 in that scheme has not been injected in this northern cyclonic gyre of the western boundary (Figure 9),
but more to the east (Arctic and/or Scandinavian
regions), as revealed by its pattern (Figure 7), and its isotopic composition (Figure 8). Ruddiman and Glover [1972] have hypothesized a large cyclonic gyre within the Irminger Basin to explain the distribution of the volcanic material from ash zone 1 (=10.5 kyr BP). The continuous "background" supply of volcanic materials (probably from the Icelandic area) throughout the last glacial period would support the permanence of such an "Irminger gyre," transporting sea-ice with local volcanic ashes. HL3 in such a case would represent an accidental injection of icebergs from the north and/or north east within this gyre. Cores located in the Irminger Basin might be studied to confirm this hypothesis.
However, another possibility can be discussed. The presence of detrital carbonate in HL3 in northern cores from the western North Atlantic is evidence that the pattern of circulation during HL3 in that region was about the same as during HL1, HL2,
HL4 and HL5 [see Bond et al., 1992]. In this view,
icebergs that were discharged from the Labrador Sea during formation of HL3 melted, owing to warmer sea surface temperatures, before they reached the central and eastern North Atlantic. The different composition of IRD in HL3 may simply reflect the fact that if the massive discharges of icebergs from the Labrador Sea melt before crossing the western North Atlantic, the "Irminger gyre" becomes the principal source of icebergs reaching the central and eastern North Ariantic.
The southern boundary of the zone of high detritus flux, which appears slightly different from event-to- event (within a few degrees of latitude) would follow the north/south shifts of the southern margin of the polar waters along the last glacial period. In a recent paper, Hebbeln and Wefer [1991] reported ice-rafted detritus flux records measured over a year with sediment traps moored in the Fram Strait region. They clearly demonstrated that the maximum ice- rafted detritus fluxes occur where icebergs are melting, underneath the isotherm =0øC, and that at the same time lithogenic fluxes are extremely low under the permanent sea ice and in the ice-free region. Although the time scales are different, such process could explain the HL distribution.
![Fig. 1. Location of the cores. Symbols: french cores (solid circles); other cores: (solid squares) Heinrich [1988] and Jantschik and Huon [ 1992], (crossed squares) Broecker et al](https://thumb-eu.123doks.com/thumbv2/123doknet/13036409.382157/3.901.144.769.501.944/location-symbols-circles-squares-heinrich-jantschik-crossed-broecker.webp)
![Fig. 2. Examples of low-field magnetic susceptibility profiles on uppermost 3 m in cores located inside and outside the ice-rafted detritus belt first recognized by Ruddiman [ 1977] (see location on Figure 1)](https://thumb-eu.123doks.com/thumbv2/123doknet/13036409.382157/4.876.169.713.321.987/examples-magnetic-susceptibility-profiles-uppermost-detritus-recognized-ruddiman.webp)