HAL Id: hal-03145651
https://hal.archives-ouvertes.fr/hal-03145651v2
Submitted on 5 Mar 2021
HAL is a multi-disciplinary open access
archive for the deposit and dissemination of sci-entific research documents, whether they are pub-lished or not. The documents may come from teaching and research institutions in France or abroad, or from public or private research centers.
L’archive ouverte pluridisciplinaire HAL, est destinée au dépôt et à la diffusion de documents scientifiques de niveau recherche, publiés ou non, émanant des établissements d’enseignement et de recherche français ou étrangers, des laboratoires publics ou privés.
Experimental study, first-principles calculation and
thermodynamic modelling of the Cr–Fe–Nb–Sn–Zr
quinary system for application as cladding materials in
nuclear reactors.
Paul Lafaye, Caroline Toffolon-Masclet, Jean-Claude Crivello, Jean-Marc
Joubert
To cite this version:
Paul Lafaye, Caroline Toffolon-Masclet, Jean-Claude Crivello, Jean-Marc Joubert. Experimental study, first-principles calculation and thermodynamic modelling of the Cr–Fe–Nb–Sn–Zr quinary sys-tem for application as cladding materials in nuclear reactors.. Journal of Nuclear Materials, Elsevier, 2021, 544, pp.152692. �10.1016/j.jnucmat.2020.152692�. �hal-03145651v2�
*Present affiliation : Centre de Recherche en Calcul Thermochimique (CRCT), Polytechnique Montréal, Montréal, Québec, H3C 3A7, Canada
Experimental study, first-principles calculations and thermodynamic modelling of the Cr–Fe– Nb–Sn–Zr quinary system for application as cladding materials in nuclear reactors.
Paul Lafayea,b,*, Caroline Toffolon-Mascleta, Jean-Claude Crivellob, Jean-Marc Joubertb*
a
DEN-Service de Recherches Métallurgiques Appliquées, CEA, Université Paris-Saclay, F-91191 Gif-sur-Yvette, France
b
Univ Paris Est Creteil, CNRS, ICMPE, UMR 7182, 2 rue Henri Dunant, 94320 Thiais, France* corresponding author
Tel.: +33 1 49 78 13 44; Fax: +33 1 49 78 12 03 E-mail address: joubert@icmpe.cnrs.fr
Abstract
This paper is dedicated to the Calphad modelling of the Cr–Fe–Nb–Sn–Zr quinary system. In previous papers, the thermodynamic modelling of the Cr–Nb–Sn–Zr quaternary system, the Fe–Sn–Zr and Fe–Nb–Zr ternary systems as well as the Fe–Nb binary system were carried out. Since no experimental data were available for the Cr–Fe–Sn and Fe–Nb–Sn ternary systems, new partial isothermal sections have been measured at 1073K and 973K, respectively. In addition to these experimental data, Density Functional Theory (DFT) calculations are performed in order to determine formation enthalpies of the stable and metastable ordered compounds. At last, the Special Quasirandom Structures (SQS) method is used together with DFT calculations in order to calculate the mixing enthalpy of the A2 (bcc) binary solid solution. Finally, these experimental and calculated data are jointly used with those from the literature as input data for the Calphad modelling of the Cr–Fe binary system as well as the Cr–Fe–Nb, Cr–Fe–Sn, Cr–Fe–Zr and Fe–Nb–Sn ternary systems. The ternary
2
systems are then combined into a quinary database for which application examples are provided.
Keywords: Cr–Fe–Nb–Sn–Zr; Calphad; DFT; SQS; thermodynamic databases; assessment; phase equilibrium
1. Introduction
The development of zirconium metallurgy is closely related to the nuclear industry. Indeed, zirconium is the key metal for fuel cladding materials and structural components in Pressurized Water Reactors (PWR) since it has a low thermal neutron absorption cross section. Zirconium also offers other assets such as a relatively high melting temperature (2127 K), good mechanical strength at temperatures close to in-service temperature of PWR and relative stability of its properties under irradiation [1,2]. At last, zirconium exhibits a good corrosion resistance at low vapor pressures (a few tens of millibar) [3]. For high vapor pressures (hundred bar) however, the corrosion resistance of pure zirconium is significantly reduced [4]. Thus, in order to fulfil the required properties for applications in PWRs, zirconium alloys, such as Zircaloy-4 and M5® alloys have been developed.
The alloying elements constituting Zircaloy-4 and M5® alloys, such as Fe, Nb and Cr induce the formation of Zr(Cr,Fe)2 Second Phase Precipitates (SPPs) for Zircaloy-4 alloy and β-Nb
as well as Zr(Fe,Nb,Cr)2 SPPs for the M5® alloy which guarantee a better corrosion
resistance [5]. Cladding and structural materials improvement behavior in PWRs is often driven by a better control of the microstructure of existing alloys or the development of new alloys [6]. For this purpose, a new thermodynamic database dedicated to Zirconium alloys is being developed using the Calphad approach, considering the five following elements Zr, Cr, Fe, Nb, Sn.
3
This paper presents the Calphad modelling of the Cr–Fe–Nb–Sn–Zr quinary system. In previous papers, we have already presented the thermodynamic modelling of the Cr–Nb–Sn ternary system [7], the Cr–Nb–Sn–Zr quaternary system reassessing all the binary and ternary subsystems [8], the Fe–Nb binary system and Fe-Nb–Zr ternary system [9] as well as the critical assessment of the Fe–Sn–Zr ternary system [10] based on new experimental and calculated data. Just note that a brief description of the Fe–Nb binary system and the Fe-Nb– Zr ternary system has been provided in our previous paper [9]. Thus, additional information concerning the selection of the literature data used for the thermodynamic modelling of these two systems is given in the Supplementary Materials.
In the present work, partial isothermal sections of Cr–Fe–Sn and Fe–Nb–Sn were determined at 1073K and 973K, respectively. One may note that, to our knowledge, no experimental data had been previously determined for the Fe–Nb–Sn ternary system before the present work. Moreover, we provide within this study, new DFT calculations of the formation enthalpies of all the quinary end-members of the C14, C15 and C36 phases and all the ternary end-members of the σ and μ phases in the Cr–Fe–Nb system. At last, DFT calculations on Special Quasirandom Structures (SQS) were performed to determine the mixing enthalpy of the A2 (bcc) binary solid solution.
As it will be discussed in Section 4, numerous studies are dedicated to the thermodynamic description of the Cr–Fe system. The most commonly accepted is the one of Andersson and Sundman [11] with the description of the liquid phase corrected by Lee et al. [12]. However, this modelling has been done without DFT calculations and the optimized ground-state of the system shows important disagreements with recent calculations available in the literature [13– 19] as well as with our own calculations. More recent modelling based on DFT calculations are available in the literature [18,20]. Nevertheless, the unary models used by Xiong et al. [20] as well as the sublattice model of the σ phase adopted by Jacob et al. [18] are
4
different from those we already used and are not compatible with our database. Moreover, Jacob et al. [18] pointed out that several issues occurred during the optimization procedure of σ phase leading to a difference of 8–10 kJ.mol-1
between calculated and optimized formation enthalpies of the different end-members of the σ phase. The same problem was encountered in the work of Xiong et al. [20]. Thus, the Cr–Fe binary system has been re-evaluated and the Cr–Fe–Nb, Cr–Fe–Sn, Cr–Fe–Zr and Fe–Nb–Sn ternary subsystems of the quinary system.
The next section of this paper is dedicated to the literature survey of the binary and ternary subsystems of the quinary system, the third part is dedicated to the methodology we used in this paper and the fourth part to the results and discussion relative to the Calphad modelling of the different sub-systems of the quinary system. The last section of our paper is dedicated to the potential applications of our thermodynamic database. Indeed, the Second Phase Precipitates (SPP) occurrence in two quinary industrial alloys calculated by our new thermodynamic database are compared with experimental data available in the literature as well as the predictions of the previously used zirconium database, the Zircobase [21].
2. Literature survey
2.1 The Cr–Fe binary system 2.1.1 Experimental data
This binary system exhibits a miscibility gap in the bcc phase as well as the σ phase, following the congruent reaction α (Cr, Fe) → σ at 793 K [22]. One may note the presence of the γ-Fe loop. The homogeneity range of the σ phase has been mainly studied by Cook et al. [23], Hertzman et al. [24] and Xiong et al. [20]. The liquid phase was mainly measured by Putman et al. [25] in the whole composition range, by Adcock et al. [26],
5
Müller et al. [27] and Hertzman et al. [24] on the rich Cr-rich side and by Kundrat et al. [28], Putman et al. [25], Hellawell et al. [29] and Schürmann et al. [30] on the Fe-rich side. The γ-Fe loop was firstly reported by Bain [31] and confirmed by Oberhoffer et al. [32] and Adcock et al. [26]. More recently, Nishizawa [33] performed new measurements of the γ-Fe loop, confirmed by Normanton et al. [34]. The σ phase was highlighted by Cook et al. [23]. Dubiel et al. [22] measured the temperature of the eutectoid reaction at 793 ± 5 K and 49 at.%. The decomposition temperature of the σ phase was determined by Novy et al. [35]. Below 793 K, the Cr–Fe system has been poorly studied. Indeed, the measurement of a phase diagram via equilibrated alloys is not straightforward at such low temperature even by using extremely long annealing time as reported by Dubiel and Inden [22]. In order to overcome this limitation, several studies have reported measurements performed on irradiated alloys in order to accelerate the atomic diffusion [36,37]. They have been able to determine the limits of the miscibility gap in the bcc phase assuming that Cr precipitation under irradiation is simply due to the accelerated diffusion and that the ordering process can only be enhanced by irradiation but not induced by it. However, these two assumptions are not totally accepted by the scientific community and have been criticized by Xiong et al. [38].
Magnetic transitions have been extensively studied in this system. Burke et al. [39,40] determined that the Cr–Fe alloys containing 0.8 to 0.9 at.% Cr are in a spin glass state below 30 K. They have also reported the Curie (ferromagnetic-paramagnetic transition) and Neel (antiferromagnetic-paramagnetic transition) temperatures. Equivalent measurements have been done by many other researchers such as Shull et al. [41], Ishikawa et al. [42,43] and Xiong et al. [20].
6
Heat capacities have been measured by Backhurst et al. [44], Normanton et al. [34] and Xiong et al. [20]. In addition, it should be noted that the mixing enthalpies of the bcc and liquid phase have been measured by several authors. The most recent are those of Batalin et al. [45], Iguchi et al. [46] and Thiedemann et al. [47]. Zaitsev et al. [48] have reported the measurements of activities at different temperatures. Finally, several researchers used DFT calculations in order to estimate the formation enthalpies of the end-members of the σ phase, such as Pavlu et al. [13], Sluiter [14], Kabliman et al. [16], Korzhavyi et al. [17] Jacob et al. [18] and Connetable et al. [19] as well as the mixing enthalpies of the A2 (bcc) solid solution such as Olsson et al. [49] and Levesque et al. [50].
2.1.3 Thermodynamic assessment
The thermodynamic modelling performed by Andersson and Sundman [11] with the description of the liquid phase corrected by Lee [12] is the most commonly accepted.
More recently, a detailed bibliographic review of the Cr–Fe system has been carried out by Xiong et al. [20]. They performed the modelling down to 0 K, including the description of all the magnetic states of the system. In addition, Xiong et al. [20] adopted the simplified model of the σ phase proposed by Joubert [51]. Nevertheless, this modelling relies on unary models described down to 0 K and therefore are not compatible with databases based on the SGTE unary models. At last, one may note that Jacob et al. [18] reassessed the system using unary models provided by SGTE and a three-sublattice model for the σ phase.
2.2 The Cr–Fe–Nb ternary system 2.2.1 Experimental data
Relatively few studies have been performed on this system. Kaloev et al. [52] experimentally determined the isothermal sections at 973 K and 1273 K. They have shown that the Cr–Fe–Nb
7
system present four intermetallic phases, the C14, C15, μ and the σ phase. Mansour et al. [53] also studied this system in the Fe-rich part by synthesizing four alloys. Nevertheless, their analysis show inconsistent results with each other as well as with the literature data. More recently, Jacob et al. [54] determined few phase equilibria of the isothermal section at 973 K, few invariant reactions of the liquidus projection [55] and studied extensively the isothermal section at 1323 K and 1623 K as well as the isopleth sections at 25 at.% and 40 at.% Cr. Note that Kaloev et al. [52] and Jacob et al. [54,55] have not reported any ternary compounds in this system.
2.2.2 Thermodynamic data and assessment
To our knowledge, no measurements of thermodynamic data are reported for this system. The only thermodynamic modelling of the Cr–Fe–Nb system available in the literature is the one of Jacob et al. [55]. These authors have considered the thermodynamic modelling of the Cr–Fe system performed by Andersson and Sundman [11] with the modified liquid phase [12], the modelling of Khvan et al. [56] for the Fe–Nb system and the one of Schmetterer et al. [57] for the Cr–Nb system.
2.3 The Cr–Fe–Sn ternary system 2.3.1 Experimental data
To our knowledge, no measurements of phase equilibria are reported for this system.
2.3.2 Thermodynamic data and assessment
To our knowledge, no measurements of thermodynamic data as well as thermodynamic assessments are reported for this system.
8 2.4 The Cr–Fe–Zr ternary system
2.4.1 Experimental data
This system was firstly studied by Svechnikov et al. [58], Kanematsu et al. [59] and Malakhova [60]. Svechnikov et al. [58] investigated this system in the Zr-poor part (up to 47% Zr) and reported an isopleth section at 33 at.% Zr between 1073 K and 2073 K as well as the existence of a monovariant line. Malakhova [60] determined the partial isothermal sections in the Zr-rich part (Zr–Fe2Zr–Cr2Zr) at 973 K, 1073 K, 1148 K and 1473 K.
Raghavan et al. [61] carried out a complete bibliographic review of this system and deduced an isothermal section at 973 K and the reaction scheme of this system. Thus, Raghavan et al. [61] deduced the existence of a monovariant line between the bcc solid solution and the Fe23Zr6 compound in the Fe-rich region. This disagrees with the study of
Stein et al. [62] who suggested that the Fe23Zr6 compound is not stable. More recently,
Yang et al. [63] studied the phase equilibria close to the vicinity of the eutectic valley of the bcc solid solution and (Fe,Cr)2Zr Laves phase in the Fe-rich region. It should be noted that no
ternary intermetallic phase was found in this system.
2.4.2 Thermodynamic data and assessment
To our knowledge, no measurements of thermodynamic data are reported for this system. The Cr–Fe–Zr system has been thermodynamically modelled by Yang et al. [63]. These authors considered their own measurements in addition to the studies of Svechnikov et al. [58] and Malakhova [60]. Yang et al. [63] have modelled this system based on the thermodynamic modelling of the Cr–Fe system performed by Andersson and Sundman [11] with the modification of the liquid phase [12], the description of Pavlu et al. [64] for the Cr–Zr system and their own description of the Fe–Zr system.
9 3. Methodology
3.1 Experimental details
The experimental procedure is identical to that already described in our previous work [8]. The samples were prepared from pure element pieces (Cr from Cerac (99.99%), Fe from Neyco (99.99%), Nb from Alfa Aesar (99.99%), Sn from Alfa Aesar (99.8%) and Zr "Van Arkel" (55 ppm oxygen) from LTMEX-CEA), have been pelletized and arc melted in an argon atmosphere. The alloys were melted five times and turned over between each melting to ensure homogeneity. Weight losses were less than 1 wt%.
The samples were argon-annealed in a tubular furnace after being wrapped in molybdenum foil and placed in an argon-sealed silica tube. Two different portions of the samples were characterized by X-ray powder diffraction (XRD) and Electron Microprobe Analysis (EPMA) at room temperature. The XRD characterization were carried out using a Bruker D8 diffractometer equipped with a graphite monochromator in the beam diffracted with Cu Kα radiation. The diffractograms were processed using Rietveld refinement. The EPMA analysis were performed with a Cameca SX100, using pure elements as standards.
3.2 DFT calculations
The calculation procedures were conducted the same way as before [8]. The DFT calculations were done using pseudopotential and projector augmented wave (PAW) methods as implemented in the VASP code [65,66], including pseudocore electrons for Nb. A plane wave basis set with a cutoff energy of 600 eV was used with a Perdew–Burke–Ernzerhof (PBE) exchange-correlation functional [67] under a dense grid of k-points in the Brillouin zone. The calculations are performed with spin polarization, in order to consider the magnetic state of Cr and Fe.
10
We have calculated the total energy of all the ordered compounds of studied phases distributing individual atoms on each non-equivalent site using the considered sublattice models: C14 (3SL), C15 (2SL), C36 (3SL), σ (2SL) and µ (4SL). C36, σ and µ phase models are simplified from the actual crystal structures [51,68,69]. All these calculations have been automatized in the ZenGen code [70].
The formation enthalpy is obtained by subtracting the calculated total energy to the molar fraction weighted sum of the energies of the pure elements in their Stable Element Reference (SER), eg Fe in ferromagnetic bcc.
The determination of the mixing enthalpy of the A2 (bcc) binary solid solution in the Cr-Fe system was performed using the SQS method [71], generating 16-atom supercells which mimic the correlation functions of a fully random structure. Generated structures have been taken from the literature [72,73].
3.3 Calphad methodology
For the description of the Calphad method, the interested reader is referred to our previous work [8]. Table 1 summarizes the different phases we considered and the chosen sublattice model according to their crystal structure.
4. Thermodynamic modelling 4.1 The Cr–Fe binary system 4.1.1 DFT results
The 0 K calculated formation enthalpies of the end-members of the σ phase as a function of the mole fraction of iron are reported in Fig. 1, including comparison with data from literature. The interested reader can find the formation enthalpies of the Laves phases in Table 2.
11
Fig. 2 shows the calculated mixing enthalpies of the A2 (bcc) solid solution with optimized values obtained in this work and from former assessments.
4.1.2 Selection of data
The bibliography has been reviewed by Xiong et al. [20] including a discussion concerning the reliability of the different measurements available in the literature. We considered the liquidus measurements performed by Adcock et al. [26] and Putman et al. [25] as well as the mixing enthalpy measurements reported by Batalin et al. [45], Iguchi et al. [46] and Thiedemann et al. [47]. The temperature and compositions of the eutectoid reaction are taken from Dubiel et al. [22]. The γ-Fe loop phase equilibria measurements of Nishizawa [33] and Normanton et al. [34] have been taken into account. The measurements of the homogeneity range of the σ phase reported by Hertzman et al. [24] were considered in this study. The magnetic interaction of the A2 (bcc) phase were taken from Andersson and Sundman [11]. At last, note that we have considered the calculations of the formation enthalpies performed by Sluiter [14], Korzhavyi et al. [17] and Kabliman et al. [16] as well as our own DFT calculations. Likewise, we have considered the calculations of the A2 (bcc) mixing enthalpies of Olsson et al. [49] and Levesque et al. [50] as well as our own calculations were considered.
4.1.3 Calphad assessment
The liquid phase is optimized considering the measurements of the liquidus and solidus temperatures [25,26] as well as the mixing enthalpy measurements [45–47]. A greater weight is attributed to the measurements reported by Thiedemann et al. [47] which are the most recent ones and considered as the most reliable ones. We optimized the A2 (bcc) solid solution considering the miscibility gap in the bcc structure as well as our own calculations of the mixing enthalpies using regular and sub-regular binary interaction parameters. Note that
12
our description does not reproduce the anomaly of the A2 (bcc) mixing enthalpy reported by Levesque et al. [50] at very low Cr contents. Regular and sub-regular binary interaction parameters were used to assess the mixing enthalpy of the A1 (fcc) solid solution regarding the measurements of the γ-Fe loop. We modelled the A3 (hcp) phase by giving similar value we optimized for the A1 (fcc) solid solution. A regular interaction parameter without temperature dependence was used to reproduce the homogeneity range of the σ phase on the Fe-rich side. Moreover, the formation enthalpies of the end-members of the σ phase were also optimized considering the DFT calculations available in the literature, the present DFT calculations as well as the homogeneity range of this phase.
The formation enthalpies of the C14, C15 and C36 end-members were kept fixed at the values computed by DFT (the compounds are not stable in this system). Just note that no formation entropic term was used for the metastable end-members of the Laves phases.
4.1.4 Discussion
Our thermodynamic description of the Cr–Fe system was performed using less parameters than in that of Xiong et al. [20]. Our optimized phase diagram presents a good agreement with the experimental data as shown in Fig. 3. Note also that the liquidus and solidus temperatures [25,26] as well as the mixing enthalpy of the liquid phase [45–47] are better described in our modelling than the one reported by Andersson and Sundman [11]. The ground-state we optimized is in good agreement with the DFT calculations reported Pavlu et al. [13], Sluiter [14], Kabliman et al. [16], Korzhavyi et al. [17] and Jacob et al. [18] as well as our own calculations, as reported in Figure 1. The DFT calculations of the σ phase reported at the composition 33.3 at.% Fe are quite scattered, extending over 5.5 kJ.mol-1. Thus, a greater weight was attributed to our calculations. For the three less stable end-members of the σ phase, the deviation between the optimized and the calculated formation
13
enthalpies is less than 0.5 kJ.mol-1 while for the most stable end-members of the σ phase ordered at stoichiometry 33 at.% Fe, the deviation is less than 0.7 kJ.mol-1. As mentioned in the introduction, Xiong et al. [20] and Jacob et al. [18] did not succeed to have a good description of the homogeneity range of the σ phase considering the DFT calculated
ground-state leading to deviation between the optimized and the calculated ground-ground-state of 8-10 kJ.mol-1 [18]. Jacob et al. [18] explained that it might be a limitation of the DFT
calculations to take into account magnetism or a limitation of the Compound Energy Formalism induced by the simplified three-sublattice model of the σ phase they adopted. Our results suggest that it is probably not a limitation of the DFT calculations since it is possible to have a good description of both the phase diagram and the calculated ground-state. Therefore, we think that a simpler two-sublattice model for the σ phase is more suitable for the thermodynamic modelling of this complex system, following the recommendation of Joubert [51].
Figure 2 shows that the optimized mixing enthalpies of the A2 (bcc) solid solution are in good agreement with our calculations and those of the literature. Finally, note that our description of the Cr–Fe system uses the elements as defined by the SGTE contrary to the description of Xiong et al. [20]. All the parameters we used and optimized for this binary system are summarized in Table 2.
4.2 The Cr–Fe–Nb ternary system 4.2.1 Calphad assessment
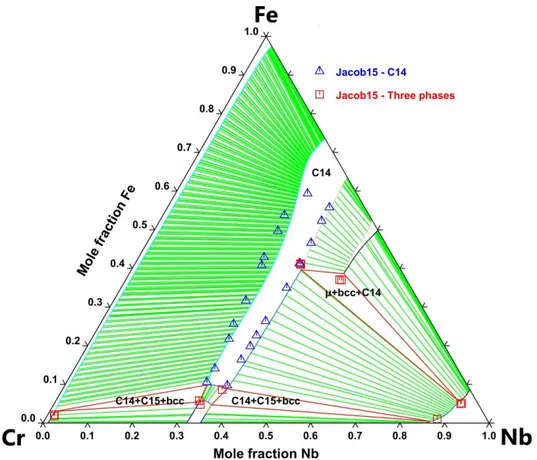
We have re-evaluated the Cr–Fe–Nb system considering the isothermal and isopleth sections reported by Jacob et al. [54] at 1323K and 1623K. We used one interaction parameter for the C15 and the μ phase and four interaction parameters for the C14 phase. The formation enthalpies of the ternary end-members of the C14 and C36 Laves phases were kept fixed to
14
the calculated values. Note that the description of the liquid phase was taken from Jacob et al. [55].
4.2.2 Results
The calculated isothermal sections at 1323K and 1623K as well as the isopleth sections at 25 at.% Nb and 40 at.% Nb are reported in Fig. 4 to 7. Fig. 8 shows the calculated liquidus projection of the Cr–Fe–Nb system compared to data available in the literature [55]. The calculated temperatures of the invariant reactions are compared to the values of Jacob et al. [55] and reported in Table 3.
4.2.3 Discussion
Our thermodynamic modelling was performed using more parameters than the one of
Jacob et al. [55]. Indeed, the three-sublattice model we use for the C14 phase versus the two-sublattice model chosen by Jacob et al. [55] leads to the use of additional parameters to model the homogeneity range of this phase. Note that the optimized isothermal sections exhibit good
agreement with the measurements of Jacob et al. [54], as shown in Figs. 4 and 5. Moreover, it should be noted that without using any ternary interaction parameters, our description of the σ
phase exhibits a negligible ternary homogeneity range, in good agreement with the measurements
of Jacob et al. [54], as opposed to what Kaloev et al. [52] reported. The calculated isopleth
sections are in a reasonable agreement with those measured by Jacob et al. [54]. The liquidus projection provided by our assessment is in good agreement with the two measurements reported
by Jacob et al. [55]. Finally, note that the calculated temperatures of the invariant reactions agree reasonably with the measurements of Jacob et al. [54] as reported in Table 3. Just note that these invariant reactions were not considered during the optimization of the ternary system and thus reflect the validity of our modelling.
15
All the parameters we used and optimized for ternary Cr–Fe–Nb system are summarized in Table 4.
4.3 The Cr–Fe–Sn ternary system 4.3.1 Experimental and DFT results
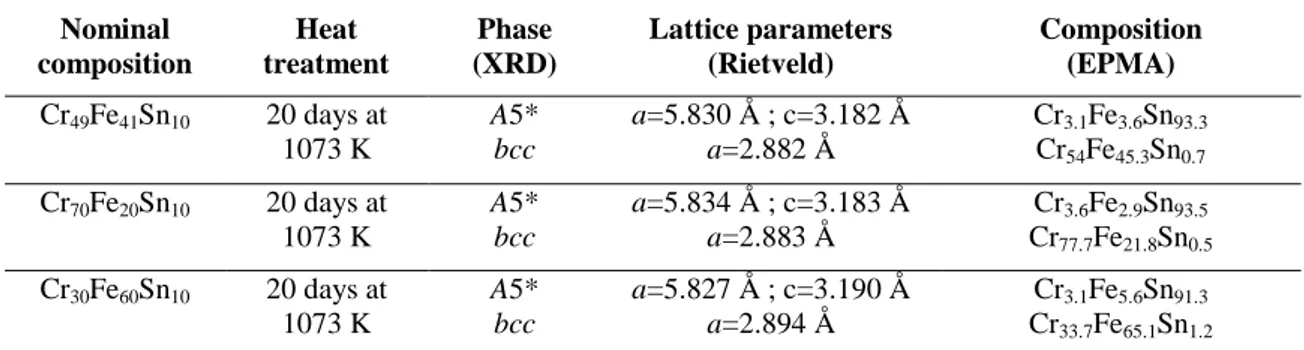
Table 5 summarizes the chemical composition, temperature and duration of the annealing treatment as well as the structure and composition of the different phases of the Cr–Fe–Sn samples synthesized in the present work. These alloy compositions were chosen to determine the extension of the σ phase in the ternary system. The calculated formation enthalpies of the ternary end-members of the C14 and C36 phases is reported in Table 6.
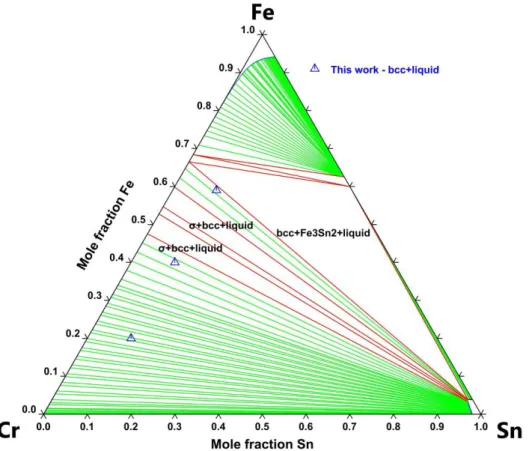
The calculated isothermal section at 1073 K compared to experimental data is presented in Fig. 9.
4.3.2 Discussion
For this system, it should be noted that a simple projection of the description of the three binary systems leads to a calculated isothermal section at 1073 K in good agreement with the experimental data measured in this work. Indeed, the nature of the equilibria is correctly predicted and the calculated compositions match the experimental ones to within ± 2 at.% which also validates the quality of our binary description.
4.4 The Cr–Fe–Zr ternary system 4.4.1 DFT results
We have reported in Fig. 10 the calculated formation enthalpies of the end-members of the C14 and C15 phases along the 33 at.% Zr isocomposition line (Cr2Zr–Fe2Zr) revealing that
16 4.4.2 Calphad assessment
All the phase equilibria determined by Malakhova [60] at 973 K, 1073 K and 1148 K as well as the monovariant line measured by Svechnikov et al. [58] were considered. However, we did not take into account the isopleth section at 33 at.% Zr measured by Svechnikov et al. [58]. Indeed, these authors did not report the compositions of the synthesized alloys, the raw data they used for drawing this isopleth section and the details of the characterizations techniques they used.
The homogeneity range of the Laves phases were optimized using two ternary interaction parameters for the C15 phase and three for the C14 phase. The result of our modelling is reported in Fig. 11 to 13
4.4.3 Discussion
Our thermodynamic modelling was carried out using one parameter more than Yang et al. [63] used. Our description exhibits general good agreements with the phase equilibrium measured by Malakhova [60] at 973 K, 1073 K and 1148 K as reported in Fig. 11 to 13. All the parameters we used and optimized for the ternary Cr–Fe–Zr system are summarized in Table 7.
4.5 The Fe–Nb–Sn ternary system 4.5.1 Experimental and DFT results
The chemical composition, temperature and duration of the annealing treatment as well as the structure and composition of the different phases we identified in the Fe–Nb–Sn samples are summarized in Table 8. It should be noted that alloys with a high Sn content could not be synthesized and were therefore not represented.
17
The calculated formation enthalpies of the ternary end-members of the C14 and C36 phases are reported in Table 9.
4.5.2 Calphad assessment and Discussion
The calculated isothermal section at 973 K compared to experimental data is presented Fig. 15. A simple projection of our descriptions of the Fe–Nb, Fe–Sn and Nb–Sn binary systems leads to a calculated isothermal section at 973 K in good agreement with the experimental data measured in this work.
4.6 Applications of the thermodynamic database
As mentioned in the introduction, the descriptions of the Cr–Nb–Sn, Cr–Nb–Zr, Cr–Sn–Zr, Fe–Nb–Zr, Fe–Sn–Zr and Nb–Sn–Zr systems are reported in our previous papers [7–10]. The quinary thermodynamic database is then obtained by combining all the descriptions of the ten ternary subsystems with respect to the quinary system Cr–Fe–Nb–Sn–Zr. Note that neither quaternary nor quinary additional interaction parameter is used. The complete database is given in Supplementary Materials.
In this section the reliability of the database is checked against two quinary industrial alloys. The first one exhibits a composition close to that of Zy-4 with 1 wt.% Sn, the second one has a composition closer to that of M5® with 1 wt.% Nb.
4.6.1 Second Phase Particules (SPP) in a Zr-1.0Sn-0.3Nb-0.3Fe-0.1Cr alloy
This quinary industrial alloy has been experimentally studied by Liu et al. [74] after annealing for two hours at 863 K and Jianlie et al. [75] after annealing for two hours at 1023 K then heating up to 1273 K. The authors determined the phase equilibria using XRD and TEM (Transmission Electron Microscopy). Jianlie et al. [75] also measured the decomposition
18
temperatures of the SPP between 1023 K and 1273 K by calorimetry. Just note that the chemical composition of the SPP was not reported. Liu et al. [74] reported the existence of the two SPP with hexagonal and cubic crystal structures. At higher temperature, the measurements of Jianlie et al. [75] show that three SPP are stable with C14, Ti2Ni and FeZr3
structures, respectively.
We have reported in Table 10 and 11 the SPP of this quinary alloy predicted by our new database compared to measurements of Jianlie et al. [75] and Liu et al. [74] as well as the predictions of the Zircobase [21]. We also reported in Table 11 the decomposition temperatures of the stable SPPs.
The phase equilibria calculated using our database and the Zircobase [21] agree well with the measurements of Liu et al. [74]. Moreover, our predictions of the SPP after annealing at 1023 K are in good agreement with the measurements of Jianlie et al. [75]. Nevertheless, a significant gap remains concerning the decomposition of Ti2Ni between the measured
temperature and the calculated one with our and Zircobase descriptions [21]. Finally, note that Jianlie et al. [75] reported the presence of small precipitates corresponding to E1a phase ordered at stoichiometry FeZr3. Its identification is only based on a very low-intensity signal
in XRD pattern mainly convoluted with that of the -Zr matrix. These precipitates which decompose at 1053 K were not predicted by our calculations even though, in this temperature range the E1a phase ordered at stoichiometry FeZr3 is the phase closest to stability according
to our database and contrary to Zircobase [3]. The presence of this phase can be related to the very slow diffusion rate of Nb in α-Zr. Indeed, the allotropic transformation from β-Zr to α-Zr is accompanied by a significant reduction in the solubility of Fe in the α-Zr matrix. Thus, since Nb is a slow-diffuser in Zr, the formation of Fe-Zr precipitates will be favoured compared to (Zr,Nb)2Fe precipitates.
19
4.6.2 Second Phase Particules (SPP) in Zr-0.7Nb-0.3Sn-0.35Fe-0.25Cr
This quinary industrial alloy was annealed for two hours at 948 K and has been experimentally studied by Barberis et al. [76] using EDS. Barberis et al. [76] reported the occurrence of two SPPs, a Nb-rich one and an Nb-poor one, with stoichiometry close to Zr(Nb,Fe,Cr)2 and Zr(Fe,Cr)2, respectively.
We have reported in Table 12 the SPP present in this quinary alloy calculated using our database compared to measurements of Barberis et al. [76] as well as the predictions of the Zircobase [21].
Our calculations also show two SPP which compositions agree with those measured. The C15 phase predicted by our database exhibit a composition close to that of the Zr(Fe,Cr)2 phase
identified by Barberis et al. [76] while the composition of the C14 phase differs from that of the Zr(Nb,Fe,Cr)2 phase only by a greater substitution of Cr by Fe. Finally, it should be noted
that Zircobase [21] predicts only one SPP which composition is relatively close to the Zr(Fe,Cr)2 phase measured by Barberis et al. [76].
In this section, it has been shown that the phase equilibria predictions performed using our new database are in general good agreement with the available experiments conducted on industrial alloys. In addition, for the second alloy which composition is close to that of M5®, note that our predictions exhibit better agreement with literature data than those obtained using the Zircobase [21].
5. Conclusion
The thermodynamic modelling of the Cr–Fe–Nb–Sn–Zr quinary system has been performed using the Calphad approach based on new experimental and calculated data. The critical
20
assessment of the Cr–Nb–Sn ternary system, the Cr–Nb–Sn–Zr quaternary system, the Fe– Sn–Zr ternary systems as well as the Fe–Nb–Zr was presented in previous papers [7–10]. We provide, within this study, few experiments allowing to define the most important equilibria in the Cr–Fe–Sn and Fe–Nb–Sn ternary systems at 973 K and 1073 K, systems for which no experimental data was available.
Moreover, the formation enthalpies of all the end-members of the C14 (3SL), C15 (2SL), C36 (3SL), σ (2SL) and μ (4SL) phases have been calculated using DFT. The mixing enthalpies of the A2 (bcc) binary solid solutions were determined using the SQS method. It allows to provide robust and consistent values in the complete composition range for each solid solution, outside their stability range.
At last, these experimental and calculated data were used together with the data available in the literature as input data for the Calphad modelling of the Cr–Fe and Fe–Nb binary systems. These systems have been reassessed in order to provide consistent description of the σ and the C14 phases.
Note that the Cr–Fe–Sn and Fe–Nb–Sn ternary systems were obtained by extrapolation of the binary sub-systems only, attesting the validity of our description of the five involved binary sub-systems. However, ternary interaction parameters were used to model the Cr–Fe–Nb, Cr– Fe–Zr and Fe–Nb–Zr ternary systems. No higher order interaction parameter was used to assess quaternary and quinary system. The quinary database was constructed by a combination of the systems we have presented.
At last, we have shown that our database is a powerful tool for the determination of phase equilibria and phase transformations for multi-constituent systems. The chosen application examples validate the descriptions of all the binary and ternary subsystems we have modelled.
21
The thermodynamic modelling presented in this paper was done before the paper of Zhou et al. [77] dedicated to the Cr–Fe–Sn ternary system was published. Even if the measurements of Zhou et al. [77] could not be considered in this work, the nature and composition of the phase equilibria they measured at 1123K are close to our measurements performed at 1073K and in good agreement with the predictions of our database.
Acknowledgements
Eric Bouaravong and Didier Hamon are acknowledged for the synthesis and EPMA measurements, respectively. SQS and DFT calculations were performed using HPC resources from GENCI–CINES (Grant A0080906175 and den0006). The authors wish to thank the GDR CNRS n°3584 TherMatHT for fruitful discussions and collaborative work on the present project. This work was conducted and funded within the framework of the French Tripartite Institute CEA/EDF/Framatome [Projet Gaine].
Figure caption:
Figure 1: Calculated formation enthalpies of the end-members of the σ phase in the Cr–Fe system compared to data of Jacob18 [18], Pavlu10 [13], Connetable11 [19], Sluiter06 [14], Korzhavyi09 [17] and Kabliman12 [16].
Figure 2: Calculated mixing enthalpies of the A2 (bcc) solid solution of the Cr–Fe system compared to data of Olsson03 [49] and Levesque13 [50].
Figure 3: Calculated Cr-Fe system compared to data of literature Adcock31 [26], Dubiel87 [22], Hertzman82 [24], Kundrat84 [28], Nishizawa66 [33], Normanton76 [34], Novy08 [35], Putman51 [25], Cook43 [23].
22
Figure 4: Calculated isothermal section at 1323 K of the Cr–Fe–Nb system compared to experimental data of Jacob et al. [54].
Figure 5: Calculated isothermal section at 1623 K of the Cr–Fe–Nb system compared to experimental data of Jacob et al. [54].
Figure 6: Isopleth section at 25 at.% Nb of the Cr–Fe–Nb system compared to experimental data of Jacob et al. [54] and thermodynamic modelling of Jacob et al. [55].
Figure 7: Isopleth section at 40 at.% Nb of the Cr–Fe–Nb system compared to experimental data of Jacob et al. [54] and thermodynamic modelling of Jacob et al. [55].
Figure 8: Liquidus projection of the Cr–Fe–Nb system (temperature in Kelvin) compared to experimental data of Jacob et al. [55].
Figure 9: Calculated isothermal section at 1073 K of the Cr–Fe–Sn system compared to experimental data obtained in this framework.
Figure 10: Calculated formation enthalpies of the C14 and C15 end-members along the 33 at.% Zr isocomposition line, from Cr2Zr (x = 0) to Fe2Zr (x = 1).
Figure 11: Calculated isothermal section at 973 K of the Cr–Fe–Zr system compared to experimental data of Malakhova79 [60].
Figure 12: Calculated isothermal section at 1073 K of the Cr–Fe–Zr system compared to experimental data of Malakhova79 [60].
Figure 13: Calculated isothermal section at 1148 K of the Cr–Fe–Zr system compared to experimental data of Malakhova79 [60].
Figure 14: Calculated isothermal section at 973 K of the Fe–Nb–Sn system compared to experimental data obtained in this framework.
23 References
[1] C. Lemaignan, A.T. Motta, Zirconium Alloys in Nuclear Applications, in: Mater. Sci. Technol., Wiley-VCH Verlag GmbH & Co. KGaA, 2006.
[2] J.-P. Mardon, Matériaux des tubes de gainage pour réacteurs à eau pressurisée, Techniques de l’ingénieur, bn3700, 2008.
[3] M. Tupin, Approfondissement des mécanismes d’oxydation de deux alliages de
zirconium: Zircaloy-4 et ZrNbO, sous oxygène et sous vapeur d’eau. Comparaison des régimes cinétiquement limitants, Thèse de Doctorat, École nationale supérieure des mines, 2002.
[4] P. Barberis, E. Ahlberg, N. Simic, D. Charquet, C. Lemaignan, G. Wikmark, M.
Dahlbäck, M. Limbäck, P. Tägtström, B. Lehtinen, Role of the second-phase particles in zirconium binary alloys, in: Zirconium in the Nuclear Industry: Thirteenth International Symposium, West Conshohocken, PA, 2002. https://doi.org/10.1520/STP11382S. [5] Y. Dali, Etude expérimentale de l’oxydation des alliages de zirconium à haute pression
de vapeur d’eau et modélisation des mécanismes, Thèse de Doctorat, Ecole Nationale Supérieure des Mines de Saint-Etienne, 2007.
[6] A.T. Motta, Waterside corrosion in zirconium alloys, J. Miner. Met. Mater. Soc. 63 (2011) 59. https://doi.org/10.1007/s11837-011-0140-0.
[7] P. Lafaye, C. Toffolon-Masclet, J.-C. Crivello, J.-M. Joubert, Thermodynamic modelling of the Cr-Nb-Sn system, Calphad. 57 (2017) 37–45.
https://doi.org/10.1016/j.calphad.2017.02.003.
[8] P. Lafaye, C. Toffolon-Masclet, J.-C. Crivello, J.-M. Joubert, Experimental
investigations and thermodynamic modelling of the Cr–Nb–Sn–Zr system, Calphad. 64 (2019) 43–54. https://doi.org/10.1016/j.calphad.2018.11.002.
[9] C. Toffolon-Masclet, L. Martinelli, C. Desgranges, P. Lafaye, J.C. Brachet, F. Legendre, J.-C. Crivello, J.-M. Joubert, D. Monceau, Development of thermokinetic tools for phase transformation studies of Zr alloys in service and LOCA conditions, in: Zirconium in the Nuclear Industry, ASTM International, Manchester, UK, May 2019 (to be published). [10] P. Lafaye, C. Toffolon-Masclet, J.-C. Crivello, J.-M. Joubert, Thermodynamic modelling
of the Fe–Sn–Zr system based on new experiments and first-principles calculations, J. Alloys Compd. 821 (2020) 153200. https://doi.org/10.1016/j.jallcom.2019.153200. [11] J.-O. Andersson, B. Sundman, Thermodynamic properties of the Cr-Fe system, Calphad.
11 (1987) 83–92. https://doi.org/10.1016/0364-5916(87)90021-6.
[12] L. Byeong-Joo, Revision of thermodynamic descriptions of the Fe-Cr & Fe-Ni liquid phases, Calphad. 17 (1993) 251–268. https://doi.org/10.1016/0364-5916(93)90004-U. [13] J. Pavlů, J. Vřešťál, M. Šob, Ab initio study of formation energy and magnetism of
sigma phase in Cr–Fe and Cr–Co systems, Intermetallics. 18 (2010) 212–220. https://doi.org/10.1016/j.intermet.2009.07.018.
[14] M.H.F. Sluiter, Ab initio lattice stabilities of some elemental complex structures, Calphad. 30 (2006) 357–366. https://doi.org/10.1016/j.calphad.2006.09.002. [15] E.A. Syutkin, A. Jacob, C. Schmetterer, A.V. Khvan, B. Hallstedt, A.T. Dinsdale,
Experimental determination of the thermodynamic properties of the Laves phases in the Cr–Fe–Nb system, Thermochim. Acta. 624 (2016) 47–54.
https://doi.org/10.1016/j.tca.2015.12.001.
[16] E. Kabliman, A.V. Ruban, P. Blaha, O. Peil, K. Schwarz, Ab Initio study of lattice site occupancies in binary sigma phases using a single-site mean field model, Appl. Sci.-Basel. 2 (2012) 654–668. https://doi.org/doi:10.3390/app2030654.
24
[17] P.A. Korzhavyi, A.V. Ruban, J. Odqvist, J.-O. Nilsson, B. Johansson, Electronic
structure and effective chemical and magnetic exchange interactions in bcc Fe-Cr alloys, Phys. Rev. B. 79 (2009) 054202. https://doi.org/10.1103/PhysRevB.79.054202.
[18] A. Jacob, E. Povoden-Karadeniz, E. Kozeschnik, Revised thermodynamic description of the Fe-Cr system based on an improved sublattice model of the σ phase, Calphad. 60 (2018) 16–28. https://doi.org/10.1016/j.calphad.2017.10.002.
[19] D. Connétable, M. Mathon, J. Lacaze, First principle energies of binary and ternary phases of the Fe–Nb–Ni–Cr system, Calphad. 35 (2011) 588–593.
https://doi.org/10.1016/j.calphad.2011.09.004.
[20] W. Xiong, P. Hedström, M. Selleby, J. Odqvist, M. Thuvander, Q. Chen, An improved thermodynamic modeling of the Fe–Cr system down to zero kelvin coupled with key experiments, Calphad. 35 (2011) 355–366.
https://doi.org/10.1016/j.calphad.2011.05.002.
[21] N. Dupin, I. Ansara, C. Servant, C. Toffolon, C. Lemaignan, J.C. Brachet, A
thermodynamic database for zirconium alloys, J. Nucl. Mater. 275 (1999) 287–295. https://doi.org/10.1016/S0022-3115(99)00125-7.
[22] S. Dubiel, G. Inden, On the miscibility gap in the Fe-Cr system - a Mossbauer study on long-term annealed alloys, Z. Met. 78 (1987) 544–549.
https://doi.org/10.1002/chin.198745022.
[23] A.J. Cook, F.W. Jones, The brittle constituent of iron chromium system (sigma phase), Iron Steel Inst. (1943) 217.
[24] S. Hertzman, B. Sundman, A thermodynamic analysis of the fe-cr system, Calphad. 6 (1982) 67–80. https://doi.org/10.1016/0364-5916(82)90018-9.
[25] J.W. Putman, R.D. Potter, M.J. Grant, The ternary system chromium–molybdenum–iron, Trans. Am. Soc. Met. 43 (1951) 824. https://doi.org/10.1520/stp46104s.
[26] F. Adcock, Alloys of iron research part X—the chromium–iron constitutional diagram, J. Iron Steel Inst. 124 (1931) 99–149.
[27] F. Müller, O. Kubaschewski, The thermodynamic properties and the equilibrium diagram of the system chromium-iron, High Temp. - High Press. 1 (1969) 543–551. [28] D.M. Kundrat, M. Chochol, J.F. Elliott, Phase relationships in the Fe-Cr-C system at
solidification temperatures, Metall. Trans. B. 15 (1984) 663–676. https://doi.org/10.1007/BF02657287.
[29] A. Hellawell, W. Hume-Rothery, The Constitution of Alloys of Iron and Manganese with Transition Elements of the First Long Period, Philos. Trans. R. Soc. Lond. Math. Phys. Eng. Sci. 249 (1957) 417–459. https://doi.org/10.1098/rsta.1957.0004.
[30] E. Schurmann, J. Brauckmann, Investigations of Melting Equilibria in Iron Corner of Ternary-System Iron-Chromium-Nickel, Arch. Eisenhuttenwesen. 48 (1977) 3–7. [31] E.C. Bain, The nature of the alloys of iron and chromium, Trans Am Soc Steel Treat. 9
(1926) 9.
[32] V.P. Oberhoffer, H. Esser, Zur Kenntnis des Zustandsdiagramms Eisen-Chrom., Stahl Eisen. 47 (1927) 2021–2035.
[33] T. Nishizawa, Thermodynamic study of Fe-C-Mn, Fe-C-Cr and Fe-C-Mo systems, Report to the Swedish Board for Technical Development, Stockholm (1966).
[34] A.S. Normanton, R.H. Moore, B.B. Argent, A calorimetric and mass-spectrometric study of solid iron-chromium alloys, Met Sci. 10 (1976) 207–213.
[35] S. Novy, P. Pareige, C. Pareige, Atomic scale analysis and phase separation
understanding in a thermally aged Fe–20 at.%Cr alloy, J. Nucl. Mater. 384 (2009) 96– 102. https://doi.org/10.1016/j.jnucmat.2008.10.008.
25
[36] H. Kuwano, Y. Hamaguchi, Mössbauer study of iron-chromium alloys irradiated by energetic protons, J. Nucl. Mater. 155–157 (1988) 1071–1074.
https://doi.org/10.1016/0022-3115(88)90469-2.
[37] N. Filippova, V. Shabashov, A. Nikolaev, Mossbauer study of irradiation-accelerated short-range ordering in binary Fe-Cr alloys, Phys. Met. Metallogr. C. 90 (2000) 145– 152.
[38] W. Xiong, M. Selleby, Q. Chen, J. Odqvist, Y. Du, Phase Equilibria and
Thermodynamic Properties in the Fe-Cr System, Crit. Rev. Solid State Mater. Sci. 35 (2010) 125–152. https://doi.org/doi.org/10.1080/10408431003788472.
[39] S. Burke, B. Rainford, The Evolution of Magnetic Order in Cr-Fe Alloys, J. Phys. F-Met. Phys. 13 (1983) 441–482. https://doi.org/10.1088/0305-4608/13/2/021.
[40] S. Burke, B. Rainford, Determination of Anti-Ferromagnetic Phase Boundary in Cr-Fe Alloys, J. Phys. F-Met. Phys. 8 (1978) 239–243.
https://doi.org/10.1088/0305-4608/8/10/007.
[41] C. Shull, M. Wilkinson, Neutron Diffraction Studies of the Magnetic Structure of Alloys of Transition Elements, Phys. Rev. 97 (1955) 304–310.
https://doi.org/10.1103/PhysRev.97.304.
[42] Y. Ishikawa, R. Tournier, J. Filippi, Magnetic properties of Cr rich Fe-Cr alloys at low temperatures, J. Phys. Chem. Solids. 26 (1965) 1727–1745.
https://doi.org/10.1016/0022-3697(65)90204-0.
[43] Y. Ishikawa, S. Hoshino, Y. Endoh, Antiferromagnetism in Dilute Iron Chromium Alloys, J. Phys. Soc. Jpn. 22 (1967) 1221–1232. https://doi.org/10.1143/JPSJ.22.1221. [44] I. Backhurst, The Adiabatic Vacuum Calorimeter from 600 to 1600 °C, J. Iron Steel Inst.
189 (1958) 124.
[45] G.I. Batalin, V.P. Kurach, V.S. Sudavtsova, Enthalpies of mixing of Fe-Cr and of Fe-Ti, Russ J Phys Chem. 58 (1984) 289–291.
[46] Y. Iguchi, S. Nobori, K. Saito, T. Fuwa, A Calorimetric Study of Heats of Mixing of Liquid Iron Alloys Fe- Cr, Fe-Mo, Fe-W, Fe-V, Fe-Nb, Fe-Ta, J Iron Steel Inst Jpn. 68 (1982) 633–640. https://doi.org/10.2355/tetsutohagane1955.68.6_633.
[47] U. Thiedemann, M. Rösner‐ Kuhn, D.M. Matson, G. Kuppermann, K. Drewes, M.C. Flemings, M.G. Frohberg, Mixing enthalpy measurements in the liquid ternary system iron-nickel-chromium and its binaries, Steel Res. 69 (1998) 3–7.
https://doi.org/10.1002/srin.199801599.
[48] A. Zaitsev, M. Zemchenko, B. Mogutnov, Thermodynamic Properties and Phase-Equilibria at High-Temperatures in Fe-Cr and Fe-Mn Systems, High Temp. Sci. 28 (1989) 313–330.
[49] P. Olsson, I.A. Abrikosov, L. Vitos, J. Wallenius, Ab initio formation energies of Fe-Cr alloys, J. Nucl. Mater. 321 (2003) 84–90. https://doi.org/10.1016/S0022-3115(03)00207-1.
[50] M. Levesque, Anomalous surface segregation profiles in ferritic Fe-Cr stainless steel, Phys. Rev. B. 87 (2013) 075409. https://doi.org/10.1103/PhysRevB.87.075409.
[51] J.-M. Joubert, Crystal chemistry and Calphad modeling of the σ phase, Prog. Mater. Sci. 53 (2008) 528–583. https://doi.org/10.1016/j.pmatsci.2007.04.001.
[52] N. Kaloev, E. Sokolovskaya, A. Abramyan, L. Kulova, F. Agaeva, Study of isothermal section at 1273 K in Fe-Cr-Nb system, Russ. Metall. (1987) 206–208.
[53] S. Mansour, N. Boutarek, H. Aid, S.E. Amara, Phase Equilibrium in the Fe-Cr-Nb Alloys, in: JEEP – Journ. D’Etude Equilibres Entre Phases, EDP Sciences, 2009: p. 00003. https://doi.org/10.1051/jeep/200900003.
26
[54] A. Jacob, C. Schmetterer, D. Gruener, E. Wessel, B. Hallstedt, L. Singheiser, The Cr-Fe-Nb ternary system: Experimental isothermal sections at 700 degrees C, 1050 degrees C and 1350 degrees C, J. Alloys Compd. 648 (2015) 168–177.
https://doi.org/10.1016/j.jallcom.2015.06.137.
[55] A. Jacob, C. Schmetterer, A. Khvan, A. Kondratiev, D. Ivanov, B. Hallstedt, Liquidus projection and thermodynamic modeling of the Cr-Fe-Nb ternary system, Calphad. 54 (2016) 1–15. https://doi.org/10.1016/j.calphad.2016.04.013.
[56] A.V. Khvan, K. Chang, B. Hallstedt, Thermodynamic assessment of the Fe–Nb–V system, Calphad. 43 (2013) 143–148. https://doi.org/10.1016/j.calphad.2013.05.002. [57] C. Schmetterer, A. Khvan, A. Jacob, B. Hallstedt, T. Markus, A New Theoretical Study
of the Cr-Nb System, J. Phase Equilibria Diffus. 35 (2014) 434–444. https://doi.org/10.1007/s11669-014-0313-y.
[58] V.N. Svechnikov, G.F. Kobzenko, Dopov Akad Nauk Ukr RSR A. (1964) 492–498. [59] K. Kanematsu, Y. Fujita, Magnetic Moment in Laves Phase Compound. I. Zr(Fe1-xVx)2
and Zr(Fe1-xCrx)2, J. Phys. Soc. Jpn. 29 (1970) 864–868. https://doi.org/10.1143/JPSJ.29.864.
[60] T.O. Malakhova, The Cr-Fe-Zr phase diagram, in: Splavy At. Energy, O.S. Ivanov, Z.M. Alekseeva (Eds.), Moskow, 1979: pp. 123–160.
[61] V. Raghavan, G.V. Raynor, V.G. Rivlin, D. Indian Institute of Technology, I.I. of Metals, Phase diagrams of ternary iron alloys, Metals Park, Ohio : ASM International ; Delhi : Indian Institute of Technology, 1987.
[62] F. Stein, G. Sauthoff, M. Palm, Phases and phase equilibria in the Fe–Al–Zr system, Z. Für Met. 95 (2004) 469–485. https://doi.org/10.3139/146.017985.
[63] Y. Yang, L. Tan, H. Bei, J.T. Busby, Thermodynamic modeling and experimental study of the Fe–Cr–Zr system, J. Nucl. Mater. 441 (2013) 190–202.
https://doi.org/10.1016/j.jnucmat.2013.05.061.
[64] J. Pavlů, J. Vřešt’ál, M. Šob, Stability of Laves phases in the Cr–Zr system, Calphad. 33 (2009) 382–387. https://doi.org/10.1016/j.calphad.2008.11.003.
[65] G. Kresse, J. Furthmüller, Efficient iterative schemes for ab initio total-energy calculations using a plane-wave basis set, Phys. Rev. B. 54 (1996) 11169–11186. https://doi.org/10.1103/PhysRevB.54.11169.
[66] G. Kresse, D. Joubert, From ultrasoft pseudopotentials to the projector augmented-wave method, Phys. Rev. B. 59 (1999) 1758–1775.
https://doi.org/10.1103/PhysRevB.59.1758.
[67] J.P. Perdew, K. Burke, M. Ernzerhof, Generalized Gradient Approximation Made Simple, Phys. Rev. Lett. 77 (1996) 3865–3868.
https://doi.org/10.1103/PhysRevLett.77.3865.
[68] J.-M. Joubert, N. Dupin, Mixed site occupancies in the μ phase, Intermetallics. 12 (2004) 1373–1380. https://doi.org/10.1016/j.intermet.2004.04.036.
[69] J.-M. Joubert, J.-C. Crivello, Non-Stoichiometry and Calphad Modeling of Frank-Kasper Phases, Appl. Sci. 2 (2012) 669–681. https://doi.org/10.3390/app2030669.
[70] J.-C. Crivello, R. Souques, A. Breidi, N. Bourgeois, J.-M. Joubert, ZenGen, a tool to generate ordered configurations for systematic first-principles calculations: The Cr–Mo– Ni–Re system as a case study, Calphad. 51 (2015) 233–240.
https://doi.org/10.1016/j.calphad.2015.09.005.
[71] A. Zunger, S.-H. Wei, L.G. Ferreira, J.E. Bernard, Special quasirandom structures, Phys. Rev. Lett. 65 (1990) 353–356. https://doi.org/10.1103/PhysRevLett.65.353.
27
[72] C. Jiang, C. Wolverton, J. Sofo, L.-Q. Chen, Z.-K. Liu, First-principles study of binary bcc alloys using special quasirandom structures, Phys. Rev. B. 69 (2004) 214202. https://doi.org/10.1103/PhysRevB.69.214202.
[73] D. Shin, R. Arróyave, Z.-K. Liu, A. Van de Walle, Thermodynamic properties of binary hcp solution phases from special quasirandom structures, Phys. Rev. B. 74 (2006) 024204. https://doi.org/10.1103/PhysRevB.74.024204.
[74] Y.Z. Liu, W.J. Zhao, Q. Peng, H.M. Jiang, X.T. Zu, Study of microstructure of Zr-Sn-Nb-Fe-Cr alloy in the temperature range of 750-820 degrees C, Mater. Chem. Phys. 107 (2008) 534–540. https://doi.org/10.1016/j.matchemphys.2007.08.031.
[75] J. Liang, Y. Tang, L. Nong, J. Yan, Y. Zhuang, Intermetallics and phase transformations of the Zr-1.0Sn-0.3Nb-0.3Fe-0.1Cr alloy, Rare Met. 27 (2008) 468–472.
https://doi.org/10.1016/S1001-0521(08)60164-3.
[76] P. Barberis, C. Vauglin, P. Fremiot, and P. Guerin, "Thermodynamics of Zr Alloys: Application to Heterogeneous Materials," in Zirconium in the Nuclear Industry: 17th Volume, ed. B. Comstock and P. Barberis (West Conshohocken, PA: ASTM
International, 2015), 1-20. https://doi.org/10.1520/STP154320120208
[77] Z. Zhou, Y. Liu, C. Wu, H. Peng, J. Wang, X. Su, Experimental Investigation of the Phase Relationship of the Fe-Cr-Sn System, J. Phase Equilibria Diffus. (2020). https://doi.org/10.1007/s11669-020-00808-2.
28 Figure caption:
Figure 1: Calculated formation enthalpies of the end-members of the σ phase in the Cr–Fe system compared to data of Jacob18 [18], Pavlu10 [13], Connetable11 [19], Sluiter06 [14], Korzhavyi09 [17] and Kabliman12 [16].
Figure 2: Calculated mixing enthalpies of the A2 (bcc) solid solution of the Cr–Fe system compared to data of Olsson03 [49] and Levesque13 [50].
29
Figure 3: Calculated Cr-Fe system compared to data of literature Adcock31 [26], Dubiel87 [22], Hertzman82 [24], Kundrat84 [28], Nishizawa66 [33], Normanton76 [34], Novy08 [35], Putman51 [25], Cook43 [23].
Figure 4: Calculated isothermal section at 1323 K of the Cr–Fe–Nb system compared to experimental data of Jacob et al. [54].
30
Figure 5: Calculated isothermal section at 1623 K of the Cr–Fe–Nb system compared to experimental data of Jacob et al. [54].
Figure 6: Isopleth section at 25 at.% Nb of the Cr–Fe–Nb system compared to experimental data of Jacob et al. [54] and thermodynamic modelling of Jacob et al. [55].
31
Figure 7: Isopleth section at 40 at.% Nb of the Cr–Fe–Nb system compared to experimental data of Jacob et al. [54] and thermodynamic modelling of Jacob et al. [55].
Figure 8: Liquidus projection of the Cr–Fe–Nb system (temperature in Kelvin) compared to experimental data of Jacob et al. [55].
32
Figure 9: Calculated isothermal section at 1073 K of the Cr–Fe–Sn system compared to experimental data obtained in this framework.
Figure 10: Calculated formation enthalpies of the C14 and C15 end-members along the 33 at.% Zr isocomposition line, from Cr2Zr (x = 0) to Fe2Zr (x = 1).
33
Figure 11: Calculated isothermal section at 973 K of the Cr–Fe–Zr system compared to experimental data of Malakhova79 [60].
Figure 12: Calculated isothermal section at 1073 K of the Cr–Fe–Zr system compared to experimental data of Malakhova79 [60].
34
Figure 13: Calculated isothermal section at 1148 K of the Cr–Fe–Zr system compared to experimental data of Malakhova79 [60].
Figure 14: Calculated isothermal section at 973 K of the Fe–Nb–Sn system compared to experimental data obtained in this framework.
35 Table caption:
Table 1: Crystallographic description and sublattice model of the phases of the Cr–Fe–Nb– Sn–Zr system. Merged sites are indicated by square brackets.
Phase Space group Wyckoff position (coordination number)
Crystallographic site Sublattice modelling
C14 P63/mmc (194) 4f (16); 2a (12); 6h (12) 3 (Cr,Fe,Nb,Sn,Zr)4 (Cr,Fe,Nb,Sn,Zr)2
(Cr,Fe,Nb,Sn,Zr)6
C15 Fd-3m (227) 16d (12); 8a (16) 2 (Cr,Fe,Nb,Sn,Zr)2 (Cr,Fe,Nb,Sn,Zr)1
C36 P63/mmc (194) 4e; 4f; 4f; 8i; !8i 3 (Cr,Fe,Nb,Sn,Zr )4 (Cr,Fe,Nb,Sn,Zr)4
(Cr,Fe,Nb,Sn,Zr )16 σ P42/mnm (136) [2a (12); 8i (12)] [4f (15); 8i (14); 8j (14)] 5 (Cr,Fe,Nb)10 (Cr,Fe,Nb)20 μ R-3m (166) 3a (12); [6c (15); 6c (16)] 6c (14); 18h (12) 5 (Cr,Fe,Nb)1 (Nb)4 (Cr,Fe,Nb)2 (Cr,Fe,Nb)6
36
Table 2: Optimized thermodynamic parameters for the Cr–Fe system from the present work
Table 3: Invariant reactions of the Cr–Fe–Nb system
Phase Parameters (J/mol)
Liquid 0LCr,Fe = – 1350.21 – 6.495*T 1L Cr,Fe = – 4652.39 A1 0LCr,Fe = 20604.94 – 17.44*T 1 LCr,Fe = 735.53 A2 0LCr,Fe = 29140.47 – 19.27*T 1L Cr,Fe = – 1539.16 σ (Cr,Fe) 10 (Cr,Fe)20 G Cr:Cr = 394756 + 30*GHSERCR G Fe:Fe = 226062 + 30*GHSERFE
G Cr:Fe = 312649 + 10*GHSERCR + 20*GHSERFE
G Fe:Cr = 97004 – 123.25*T + 20*GHSERCR + 10*GHSERFE 0L Fe:Cr,Fe = 16397-270.9*T C14 (Cr,Fe) 4 (Cr,Fe)2(Cr,Fe)6 GCr:Cr:Cr= 342290.49+12*GHSERCR GFe:Cr:Cr= 347505.48 +8*GHSERCR+4*GHSERFE GCr:Fe:Cr = 257560.82+10*GHSERCR+2*GHSERFE GFe:Fe:Cr = 290386.48+6*GHSERCR+6*GHSERFE GCr:Cr:Fe = 172628.09+6*GHSERCR+6*GHSERFE GCr:Fe:Fe = 174132.04+4*GHSERCR+8*GHSERFE GFe:Cr:Fe = 149253.48+2*GHSERCR+10*GHSERFE GFe:Fe:Fe = 148839.37+12*GHSERFE C15 (Cr,Fe) 2(Cr,Fe)1 GCr:Cr= 81517.9+3*GHSERCR GCr:Fe= 77642.26+2*GHSERCR+1*GHSERFE GFe:Cr= 41423.51+1*GHSERCR+2*GHSERFE GFe:Fe= 35876.32+3*GHSERFE C36 (Cr,Fe) 4 (Cr,Fe)4(Cr,Fe)16 GCr:Cr:Cr= 621157+24*GHSERCR GFe:Cr:Cr= 591145.14+20*GHSERCR+4*GHSERFE GCr:Fe:Cr = 614866.36+20*GHSERCR+4*GHSERFE GFe:Fe:Cr = 662413.49+16*GHSERCR+8*GHSERFE GCr:Cr:Fe = 495524.95+8*GHSERCR+16*GHSERFE GCr:Fe:Fe = 267175.01+4*GHSERCR+20*GHSERFE GFe:Cr:Fe = 317201.51+4*GHSERCR+20*GHSERFE GFe:Fe:Fe = 290739.05+24*GHSERFE Invariant reactions [55] Measured temp. (K) [54] Calculated temp. (K) [55] Calculated temp. (K) [This work] Liq + C14 → C14 + Nb 1950 1890 1910 Liq + C15 → C14 + Cr 1862 1867 1901 Liq → C14 + μ + Nb 1770 1771 1771
37
Table 4: Optimized thermodynamic parameters for the Cr–Fe–Nb system from the present work
Table 5: Composition and annealing treatments of the Cr–Fe–Sn samples prepared in this work
*Sn liquid is transformed into A5 after cooling
Phase Parameters (J/mol)
Liquid 0LCr,Fe,Nb = +35000 1L Cr,Fe,Nb = +25000 2L Cr,Fe,Nb = -30000 C14 (Cr,Fe,Nb) 4 (Cr,Fe,Nb) 2(Cr,Fe,Nb)6 GCr:Fe:Nb= 593258+4*GHSERCR+2*GHSERFE+6*GHSERNB GNb:Fe:Cr = – 62796+6*GHSERCR+2*GHSERFE+4*GHSERNB GFe:Nb:Cr = 500131+6*GHSERCR+4*GHSERFE+2*GHSERNB GFe:Cr:Nb = 602468+2*GHSERCR+4*GHSERFE+6*GHSERNB GNb:Cr:Fe = – 146641+2*GHSERCR+6*GHSERFE+4*GHSERNB GCr:Nb:Fe = 334466+4*GHSERCR+6*GHSERFE+2*GHSERNB 0L Nb:Cr,Fe:Fe = – 167380+35*T 0L Nb:Cr,Fe:Cr = – 225675-70*T 0L Fe,Nb:Cr:Fe = – 280000 1 LCr,Nb:Fe:Cr = – 450000 C15 (Cr,Fe,Nb) 2(Cr,Fe,Nb)1 0L Cr,Fe:Nb = – 56158+20*T C36 (Cr,Fe,Nb) 4 (Cr,Fe,Nb) 4(Cr,Fe,Nb)16 GCr:Nb:Fe = 72590.45+4*GHSERCR+16*GHSERFE+4*GHSERNB GNb:Cr:Fe = 165198.78+4*GHSERCR+16*GHSERFE+4*GHSERNB GNb:Fe:Cr = 16398.36+16*GHSERCR+4*GHSERFE+4*GHSERNB GCr:Fe:Nb = 1834559.47+4*GHSERCR+4*GHSERFE+16*GHSERNB GFe:Nb:Cr = 304131.63+16*GHSERCR+4*GHSERFE+4*GHSERNB GFe:Cr:Nb = 1469312.89+4*GHSERCR+4*GHSERFE+16*GHSERNB µ (Cr,Fe,Nb) 1(Nb)4 (Cr,Fe,Nb) 2 (Cr,Fe,Nb)6 GCr:Nb:Nb:Fe = – 190602+GHSERCR+6*GHSERNB+6*GHSERFE GCr:Nb:Cr:Fe = – 49986+3*GHSERCR+6*GHSERFE+4*GHSERNB GFe:Nb:Cr:Fe = – 42763+7*GHSERFE+4*GHSERNB+2*GHSERCR GNb:Nb:Cr:Fe = +17354+5*GHSERNB+2*GHSERCR+6*GHSERFE GCr:Nb:Fe:Fe = +34655+GHSERCR+4*GHSERNB+8*GHSERFE GFe:Nb:Nb:Cr = – 10355+GHSERFE+6*GHSERNB+6*GHSERCR GCr:Nb:Fe:Cr = +88465+7*GHSERCR+4*GHSERNB+2*GHSERFE GFe:Nb:Fe:Cr = +97266+3*GHSERFE+4*GHSERNB+6*GHSERCR GNb:Nb:Fe:Cr = +191535+5*GHSERNB+2*GHSERFE+6*GHSERCR GFe:Nb:Cr:Cr = +37263+GHSERFE+4*GHSERNB+8*GHSERCR GCr:Nb:Fe:Nb = +442921+GHSERCR+10*GHSERNB+2*GHSERFE GFe:Nb:Cr:Nb = +347534+GHSERFE+10*GHSERNB+2*GHSERCR 0L Cr,Fe:Nb:Nb:Cr,Fe = – 180400-200*T Nominal composition Heat treatment Phase (XRD) Lattice parameters (Rietveld) Composition (EPMA) Cr49Fe41Sn10 20 days at 1073 K A5* bcc a=5.830 Å ; c=3.182 Å a=2.882 Å Cr3.1Fe3.6Sn93.3 Cr54Fe45.3Sn0.7 Cr70Fe20Sn10 20 days at 1073 K A5* bcc a=5.834 Å ; c=3.183 Å a=2.883 Å Cr3.6Fe2.9Sn93.5 Cr77.7Fe21.8Sn0.5 Cr30Fe60Sn10 20 days at 1073 K A5* bcc a=5.827 Å ; c=3.190 Å a=2.894 Å Cr3.1Fe5.6Sn91.3 Cr33.7Fe65.1Sn1.2
38
Table 6: Calculated thermodynamic parameters for the Cr–Fe–Sn system from the present work
Table 7: Optimized thermodynamic parameters for the Cr–Fe–Zr system from the present work
Phase Parameters (J/mol)
C14 (Cr,Fe,Sn) 4 (Cr,Fe,Sn) 2(Cr,Fe,Sn)6 GCr:Fe:Sn = 662283+4*GHSERCR+2*GHSERFE+6*GHSERSN GSn:Fe:Cr = 427370+6*GHSERCR+2*GHSERFE+4*GHSERSN GFe:Sn:Cr = 552233+6*GHSERCR+4*GHSERFE+2*GHSERSN GFe:Cr:Sn = 727354+2*GHSERCR+4*GHSERFE+6*GHSERSN GSn:Cr:Fe = 350184+2*GHSERCR+6*GHSERFE+4*GHSERSN GCr:Sn:Fe = 377903+4*GHSERCR+6*GHSERFE+2*GHSERSN C36 (Cr,Fe,Sn) 4 (Cr,Fe,Sn) 4(Cr,Fe,Sn)16 GCr:Sn:Fe = 403860+4*GHSERCR+16*GHSERFE+4*GHSERSN GSn:Cr:Fe = 387129+4*GHSERCR+16*GHSERFE+4*GHSERSN GSn:Fe:Cr = 698620+16*GHSERCR+4*GHSERFE+4*GHSERSN GCr:Fe:Sn = 1673960+4*GHSERCR+4*GHSERFE+16*GHSERSN GFe:Sn:Cr = 682137+16*GHSERCR+4*GHSERFE+4*GHSERSN GFe:Cr:Sn = 1671026+4*GHSERCR+4*GHSERFE+16*GHSERSN
Phase Paramètres (J/mol)
Liquid 0LCr,Fe,Zr = – 80000 C14 (Cr,Fe,Zr) 4 (Cr,Fe,Zr) 2(Cr,Fe,Zr)6 GCr:Fe:Zr= 350873+4*GHSERCR+2*GHSERFE+6*GHSERZR GZr:Fe:Cr = – 87248+6*GHSERCR+2*GHSERFE+4*GHSERZR GFe:Zr:Cr = 669721+6*GHSERCR+4*GHSERFE+2*GHSERZR GFe:Cr:Zr = 580965+2*GHSERCR+4*GHSERFE+6*GHSERZR GZr:Cr:Fe = – 227433+2*GHSERCR+6*GHSERFE+4*GHSERZR GCr:Zr:Fe = 419674+4*GHSERCR+6*GHSERFE+2*GHSERZR 0 LZr:Cr,Fe:Cr = – 250613 + 40.06*T 0L Zr:Cr,Fe:Fe = – 401478 0L Zr:Cr,Fe:Cr,Fe= – 391598 C15 (Cr,Fe,Nb) 2(Cr,Fe,Nb)1 0L Cr,Fe:Zr = – 89650+51.8*T 2L Cr,Fe:Zr = – 57542+10*T C36 (Cr,Fe,Zr) 4 (Cr,Fe,Zr) 4(Cr,Fe,Zr)16 GCr:Zr:Fe = – 42991+4*GHSERCR+16*GHSERFE+4*GHSERZR GZr:Cr:Fe = – 70419+4*GHSERCR+16*GHSERFE+4*GHSERZR GZr:Fe:Cr = 401816+16*GHSERCR+4*GHSERFE+4*GHSERZR GCr:Fe:Zr = 2040727+4*GHSERCR+4*GHSERFE+16*GHSERZR GFe:Zr:Cr = 364656+16*GHSERCR+4*GHSERFE+4*GHSERZR GFe:Cr:Zr = 1937196+4*GHSERCR+4*GHSERFE+16*GHSERZR
39
Table 8: Composition and annealing treatments of the Fe–Nb–Sn samples prepared in this work Nominal composition Heat treatment Phase (XRD) Lattice parameters (Rietveld) Composition (EPMA) Fe10Nb70Sn20 40 days at 973 K C14 A15 a=4.852 Å; c=7.904 Å a=5.279 Å Fe66.4Nb32.7Sn0.9 Fe0.7Nb76.4Sn22.9 Fe54Nb10Sn36 40 days at 973 K C14 A5* FeSn a=4.880 Å; c=7.940 Å a=5.835 Å; c=3.183 Å a=5.299 Å; c=4.448 Å Fe66.4Nb32.5Sn1.1 Fe0.3Nb0.2Sn99.5 Fe50.1Nb0.1Sn49.8 Fe45Nb10Sn45 40 days at 973 K C14 A5* FeSn a=4.868 Å; c=7.931 Å a=5.830 Å; c=3.181 Å a=5.296 Å; c=4.448 Å Fe67.4Nb31.5Sn1.1 Fe0.0Nb0.1Sn99.9 Fe50.4Nb0.1Sn49.5
*Sn liquid is transformed into A5 after cooling
Table 9: Calculated thermodynamic parameters for the Fe–Nb–Sn system from the present work
Phase Parameters (J/mol)
C14 (Fe,Nb,Sn) 4 (Fe,Nb,Sn) 2(Fe,Nb,Sn)6 GFe:Nb:Sn = 830268+4*GHSERFE+2*GHSERNB+6*GHSERSN GSn:Nb:Fe = 225731+6*GHSERFE+2*GHSERNB+4*GHSERSN GNb:Sn:Fe = – 58986+6*GHSERFE+4*GHSERNB+2*GHSERSN GNb:Fe:Sn = 283490+2*GHSERFE+4*GHSERNB+6*GHSERSN GSn:Fe:Nb = 263229+2*GHSERFE+6*GHSERNB+4*GHSERSN GFe:Sn:Nb = 696282+4*GHSERFE+6*GHSERNB+2*GHSERSN C36 (Fe,Nb,Sn) 4 (Fe,Nb,Sn) 4(Fe,Nb,Sn)16 GFe:Sn:Nb = 939520+4*GHSERFE+16*GHSERNB+4*GHSERSN GSn:Fe:Nb = 899991+4*GHSERFE+16*GHSERNB+4*GHSERSN GSn:Nb:Fe = – 204577+16*GHSERFE+4*GHSERNB+4*GHSERSN GFe:Nb:Sn = 1781043+4*GHSERFE+4*GHSERNB+16*GHSERSN GNb:Sn:Fe = – 191483+16*GHSERFE+4*GHSERNB+4*GHSERSN GNb:Fe:Sn = 1676345+4*GHSERFE+4*GHSERNB+16*GHSERSN
![Figure 1: Calculated formation enthalpies of the end-members of the σ phase in the Cr–Fe system compared to data of Jacob18 [18], Pavlu10 [13], Connetable11 [19], Sluiter06 [14], Korzhavyi09 [17] and Kabliman12 [16]](https://thumb-eu.123doks.com/thumbv2/123doknet/13299991.397735/29.892.239.632.157.456/calculated-formation-enthalpies-compared-connetable-sluiter-korzhavyi-kabliman.webp)
![Figure 3: Calculated Cr-Fe system compared to data of literature Adcock31 [26], Dubiel87 [22], Hertzman82 [24], Kundrat84 [28], Nishizawa66 [33], Normanton76 [34], Novy08 [35], Putman51 [25], Cook43 [23]](https://thumb-eu.123doks.com/thumbv2/123doknet/13299991.397735/30.892.207.678.74.419/figure-calculated-compared-literature-hertzman-kundrat-nishizawa-normanton.webp)

![Figure 11: Calculated isothermal section at 973 K of the Cr–Fe–Zr system compared to experimental data of Malakhova79 [60]](https://thumb-eu.123doks.com/thumbv2/123doknet/13299991.397735/34.892.196.686.76.502/figure-calculated-isothermal-section-compared-experimental-data-malakhova.webp)
![Figure 13: Calculated isothermal section at 1148 K of the Cr–Fe–Zr system compared to experimental data of Malakhova79 [60]](https://thumb-eu.123doks.com/thumbv2/123doknet/13299991.397735/35.892.192.700.58.483/figure-calculated-isothermal-section-compared-experimental-data-malakhova.webp)