HAL Id: hal-01848297
https://hal.archives-ouvertes.fr/hal-01848297
Submitted on 26 May 2020
HAL is a multi-disciplinary open access
archive for the deposit and dissemination of
sci-entific research documents, whether they are
pub-lished or not. The documents may come from
teaching and research institutions in France or
abroad, or from public or private research centers.
L’archive ouverte pluridisciplinaire HAL, est
destinée au dépôt et à la diffusion de documents
scientifiques de niveau recherche, publiés ou non,
émanant des établissements d’enseignement et de
recherche français ou étrangers, des laboratoires
publics ou privés.
Distributed under a Creative Commons Attribution| 4.0 International License
between the place of residence and the place of
work/study (an ACTI-Cites study)
Camille Perchoux, J. A. Nazare, T. Benmarhnia, P. Salze, Thierry Feuillet, S.
Hercberg, F. Hess, M. Menai, C. Weber, Hélène Charreire, et al.
To cite this version:
Camille Perchoux, J. A. Nazare, T. Benmarhnia, P. Salze, Thierry Feuillet, et al.. Neighborhood
educational disparities in active commuting among women: the effect of distance between the place of
residence and the place of work/study (an ACTI-Cites study). BMC Public Health, BioMed Central,
2017, 17, pp.12. �10.1186/s12889-017-4464-8�. �hal-01848297�
R E S E A R C H A R T I C L E
Open Access
Neighborhood educational disparities in
active commuting among women: the
effect of distance between the place of
residence and the place of work/study
(an ACTI-Cités study)
Camille Perchoux
1,2, Julie-Anne Nazare
1,2,3, Tarik Benmarhnia
4, Paul Salze
5, Thierry Feuillet
6,7, Serge Hercberg
7,
Franck Hess
8, Mehdi Menai
7, Christiane Weber
8, Hélène Charreire
7,9, Christophe Enaux
8, Jean-Michel Oppert
7,10and Chantal Simon
1,2,3,11*Abstract
Background: Active transportation has been associated with favorable health outcomes. Previous research highlighted the influence of neighborhood educational level on active transportation. However, little is known regarding the effect of commuting distance on social disparities in active commuting. In this regard, women have been poorly studied. The objective of this paper was to evaluate the relationship between neighborhood educational level and active commuting, and to assess whether the commuting distance modifies this relationship in adult women.
Methods: This cross-sectional study is based on a subsample of women from the Nutrinet-Santé web-cohort (N = 1169). Binomial, log-binomial and negative binomial regressions were used to assess the associations between neighborhood education level and (i) the likelihood of reporting any active commuting time, and (ii) the share of commuting time made by active transportation modes. Potential effect measure modification of distance to work on the previous associations was assessed both on the additive and the multiplicative scales. Results: Neighborhood education level was positively associated with the probability of reporting any active commuting time (relative risk = 1.774;p < 0.05) and the share of commuting time spent active (relative risk = 1.423; p < 0.05). The impact of neighborhood education was greater at long distances to work for both outcomes.
Conclusions: Our results suggest that neighborhood educational disparities in active commuting tend to increase with commuting distance among women. Further research is needed to provide geographically driven guidance for health promotion intervention aiming at reducing disparities in active transportation among socioeconomic groups.
Keywords: Active commuting, Neighborhood education, Distance to work, Effect measure modification, Social environment
* Correspondence:chantal.simon@univ-lyon1.fr
1CRNH Rhône-Alpes, Pierre Benite, France
2CARMEN INSERM U060/University of Lyon1/INRA U1235, Oullins, France
Full list of author information is available at the end of the article
© The Author(s). 2017 Open Access This article is distributed under the terms of the Creative Commons Attribution 4.0 International License (http://creativecommons.org/licenses/by/4.0/), which permits unrestricted use, distribution, and reproduction in any medium, provided you give appropriate credit to the original author(s) and the source, provide a link to the Creative Commons license, and indicate if changes were made. The Creative Commons Public Domain Dedication waiver (http://creativecommons.org/publicdomain/zero/1.0/) applies to the data made available in this article, unless otherwise stated.
Background
The benefits of walking and cycling for transportation on many health outcomes (i.e. cardiovascular diseases, colon cancer, mortality) are widely recognized [1–6] and the promotion of active commuting has been sug-gested as an effective way to increase levels of habitual physical activity [7, 8], especially among women [7]. Previous ecological studies highlighted the importance of social correlates and/or determinants of walking and cycling [9]. Indeed some studies have observed social disparities in physical activity either at the individual [10–14] or at the neighborhood level [11, 15–18]. Social neighborhood factors do matter for health, and among them a high-education neighborhood is one criteria of a “high-opportunity neighborhood” as defined by the Moving To Opportunity program [19]. More specific-ally, the mechanism through which neighborhood edu-cational level influences physical activity has been hypothesized to correspond to “a high average educa-tion in the neighborhood may stimulate values that are favorable to a healthy and physically active lifestyle” ([18], p. 5). As such, neighborhood-education inequality has been associated with smoking [20] and alcohol con-sumption [20, 21], while low-education neighborhood has been associated with weight-related outcomes [22–25]. Neighborhood educational disparities in non-motorized traffic trail [26, 27], overall walking [15], walking for trans-portation [17] and walking for recreation [16, 18] have been reported in adult populations. Therefore, disparities in neighborhood educational level might turn into neigh-borhood educational disparities in active commuting, supporting“low-active low-educated neighborhood” as pri-ority target for community-based interventions promoting physical activity [28]. However to our knowledge, except one study [17], no attention has been paid to the effect of neighborhood educational level on active transportation. It appears therefore relevant to clarify whether educational disparities in active commuting occur at the neighborhood level, independently of individual level of education. In this regard, as women have been shown to be more sensitive to the effect of the effect of socio-economic deprivation on physical activity than men [29], and poorly studied, this studies focused exclusively on women.
Distance between home and place of work/study has been consistently identified as a major determinant/ correlate of active commuting [30]. Although the World Health Organization considered that 5 km remains a feasible distance to engage in transportation physical ac-tivity among adults ([31] cited in [32]), commuting distance appears as a strong barrier to active commute (to/from place of work/study) [30, 32–38]. However, few authors suggested that commuting distance (i.e. distance to/from place of work/study) might modify the associ-ation between environmental exposure and active
commuting [39]. Since perceived and objective dis-tance are identified as a strong barrier to active com-muting and that walking or cycling a long way may tire individuals [40], the influence of a favorable edu-cational environment for active commuting might pro-vide a substantial support for the adoption or the maintenance of an active lifestyle. Alternatively, we hypothesized that individuals living in a less educated area far from their place of work/study might suffer from a double burden of distance and lack of support-ive values/context for actsupport-ive commuting. To our knowledge, few studies examined the potential effect measure modification of travel distance on the associ-ation between active commuting and environmental exposure among children only, and presented mixed results [41, 42].
In addition, active commuting has been systematically examined measuring as the time spent in active com-muting to evaluate whether specific populations meet the physical activity guidelines [43]. However, some authors argued in favor of a wider diversity of active commuting measurements to provide further guidance for sustainable urban planning and population health in-terventions [44, 45]; e.g. (changes in) commute mode share, number of commuting trips [44]. Since commut-ing to place of work/study might imply multimodal transportation modes (i.e. transit trip), including both active and sedentary travel modes [46], we advocate for a comprehensive measure of active commuting that considers the active commuting time in relation with the whole travel time and related transportations modes.
The first objective of this study was to assess specific-ally in women the association between neighborhood education level and both (i) the likelihood of reporting any active commuting time, and (ii) the share of total commuting time made by active transportation modes. The second objective was to evaluate whether distance to place of work/study modifies the relationship between neighborhood education and active commuting. We hypothesized that a positive association between neigh-borhood education and active commuting would be stronger with increasing distance to place of work/ study. In other words, among individuals living far from their place of work/study, we expected the neighbor-hood education level to be a stronger correlate of en-gaging in active commuting, compared to individuals living close to their place of work/study.
Methods
The nutrinet-santé study
The Nutrinet-Santé Study is a web-based prospective observational cohort established in France in May 2009 to investigate the relationships between nutrition and health. Volunteer participants from the general
population, aged 18 y or older, living in France and having access to the Internet fill in self-administered web-based questionnaires at baseline and then regu-larly during follow-up using a dedicated, secure web-site (for further details regarding the Nutrinet-Santé Study, see www.etude-nutrinet-sante.fr). The study was approved by the “Comité National Informatique et Liberté” (CNIL n°908,450, n° 909,216 and DR-2012-576) and the Institutional Review Board of the French Institute for Health and Medical Research (IRB Inserm n°0000388FWA00005831). Informed consent was obtained from all individual participants included in the study. A detailed description of the design of the Nutrinet-Santé Study is available elsewhere [47].
Study design and population of the ACTI-Cités study This cross-sectional study is based on a subsample of the Nutrinet-Santé study, including working or studying women only, who lived in the Bas-Rhin and Rhône départements - two comparable French départements -, and who completed the “Sedentary, Transportation and Activity Questionnaire” (STAQ) administered from Feb-ruary to August 2013 (completion rate was 48.5%). An automated e-mail informed participants of the necessity to complete their profiles by filling out this question-naire (which took less than 20 min on average) in their personal space on the website of the NutriNet-Santé cohort study. Participants had previously completed baseline questionnaires on health, lifestyle and socio-demographic factors at inclusion.
From the initial sample of 1973 women living in the Rhône and Bas-Rhin“départements” who completed the STAQ and declared no physical motor injuries [48], we excluded 627 participants who declared no employment or study activity, 92 participants who declared no com-muting time (i.e. working at home), 7 participants for missing socio-demographic data and 31 participants for missing place of work/study location. 47 participants were further excluded for declaring a place of work/ study more than 100 km distant from their home, since our study focus was on short to moderate commuting distance [49]. The final study sample included 1169 fe-male participants.
Measures Active commuting
The time of active commute was self-reported by partici-pants. Participants were asked to report the following in-formation: i) in the last 4 weeks, how many times a week did you travel from home to your main work? (Count the outward journeys only); ii) how many days per week, during the last 4 weeks, you have used each form of transport to go (and/or come back) from your work (i.e. car/motor vehicle, public transport, walk,
cycle, other active transport (skate, scooters, rollers…)); iii) the average length of time per day, during the last 4 weeks, you have spent using each form of transport to go (and/or come back) from your work. For each trans-portation mode, durations of commute (hrs/week) were computed. Active commuting duration was calculated by summing the time spent walking, cycling, and using other active transportation modes. As such, walking or cycling transit trips of short durations (i.e. walking or cycling to the station, or from the station to the place of work) were included in the active commuting duration. Total travel duration was calculated by summing all re-ported durations of commute. We then calculated the percentage of total active commuting time by dividing the active commuting duration by the total travel dur-ation. This variable was defined in the whole population (N = 1169). We then created a count variable among ac-tive commuters (N = 537) representing 10 categories in the percentage of active commuting (1 = [>0% - 10%]; 10 = [>90% - 100%]), reflecting the probability of increasing the share of active commuting by 10%. The distribution of this outcome variable is provided in Additional file 1.
Finally, two distinct dependent variables were con-sidered: (i) a binary variable indicating the reporting of any active commuting (N = 1169), and (ii) a count variable defined among active commuters (N = 537) indicating the share of total commuting time spent active.
Neighborhood education level
The neighborhood education level was defined as the proportion of residents with university education dip-loma as obtained from the 2010 population census at the French census block level (i.e. IRIS - a French acro-nym for “blocks for incorporating statistical informa-tion”) designed by the National Census Bureau Institut (INSEE– Institut national de la statistique et des études économiques). First, the neighborhood educational level data were disaggregated in a Geographic information system (GIS) grid units of 200 m × 200 m [50]. In a sec-ond step, values of neighborhood education levels at GIS grid level were computed within a 1 km circular buffer radius around each participant’s residence, and then di-vided into quartiles (quartiles’ threshold values: 25, 32, 42%) corresponding to high, middle-high, middle-low and low levels.
Assessment of residence and workplace or study location and commuting distance
Participants were asked to report the location of their place of residence, geolocated at the address, and the location of their place of work/study at the municipality or the “arrondissement” unit. The commuting distance
(distance to place of work/study) was then defined as the Euclidian distance between the place of residence and the centroïd of the municipality or“arrondissement” unit (city sub-unit) where participants indicated they were working/studying [51] (quartiles’ threshold values: 2.76 km, 5.97 km, 13.59 km), using ArcInfo 9.3 (ESRI Inc., Redlands, CA, USA).
Individual covariates
The following characteristics were considered for adjust-ment: age, individual education (4 categories: no educa-tion and primary educaeduca-tion, secondary educaeduca-tion, lower tertiary education, and upper tertiary education), having at least one child under the age of thirteen at home, and the“département” of residence (Bas-Rhin “département” and Rhône“département”).
Analyses
Variation and trends across neighborhood education categories and commuting distance in (i) the reporting of active commuting time or not and (ii) the share of total commuting time spent active were assessed using descriptive statistics and Jonckheeree-Terpstra (JT) test; p-values are reported.
The association between neighborhood education and active commuting was estimated using two separate re-gression models. The probability of reporting any active commuting was fitted using log-binomial regression models, with effect measures interpreted as relative risks (RR) and binomial regressions, with effect measures interpreted as risk differences (RD) [52]. As recom-mended elsewhere, when log-binomial and binomial re-gression models did not converge, we used Poisson regression with robust error variance with log and iden-tity links, respectively [53]. Due to the over-dispersion of the count variable (i.e. share of total commuting time spent active), negative binomial regressions were fitted to evaluate the share of total commuting time spent ac-tive among acac-tive commuters. This model represents the probability of increasing the share of total commuting time spent active by 10%. Additional analyses were computed by using the absolute time spent in active commuting as outcome, in order to evaluate whether neighborhood education level was consistently associ-ated with the share and the absolute time spent in active commuting.
Each covariate included in the model was tested first using bivariate analyses to evaluate potential con-founding [54], and all the tested covariates were significantly associated with active commuting and neighborhood education level and therefore considered as confounders. No confounding factors regarding the relationship between distance to work and active com-muting were considered since our main aim was to
evaluate whether the neighborhood education level as-sociation vary across distance strata, interpreted as measure modification [55].
Then, we estimated multiplicative interactions by including an interaction product term in both log-binomial, and negative binomial models respectively (Neighborhood education level x Distance) [56]. In order to assess the distance threshold at which the effect measure modification was stronger, we repeated the ana-lyses on the multiplicative scale using increasing distance threshold by 500 m from 1000 m to 6000 m. We then selected the distance at which the effect of the inter-action rate ratio (IRR) (which represents the exponential form of the interaction product term) was stronger to performed stratified analyses.
Finally, we evaluated the heterogeneity of the neigh-borhood education association across distance to work stratum by performing Cochran’s Q test [57], for both relative risks (RR) and absolute risks (RD). We deter-mined that a Cochran’s Q test with a p-value <0.10 indi-cates that the two differing stratum-specific estimates are derived from two distinct distributions, while the null hypothesis (p > 0.10) indicates that the two stratum estimates are part of the same distribution and differences in estimates are only due to‘sampling variability’ [57].
Sensitivity analysis assessed the impact of using an-other definition of commuting distance on the prob-ability of reporting any active commuting and the share of total commuting time spent active. Sensitivity ana-lysis assessed the impact of using another definition of commuting distance on the probability of reporting any active commuting and the share of total commuting time spent active. Distances were estimated using the types of transportation modes and the commuting dur-ation by transportdur-ation modes reported by the partici-pants. We applied the following travel speed for each transportation mode: 23 km/h for car, 12 km/h for pub-lic transport, 12 km/h for cycling, 4 km/h for walking, 10 km/h for other active travel modes of transportation [58]. By multiplying the travel speed by the commuting time, we were able to approximate a commuting dis-tance. All analyses were performed using SAS 9.3 (SAS Institute, Inc., Cary, North Carolina).
Results
Descriptive information of this final sample is provided in Table 1.
54.1% of the sample declared no active commuting time. Overall, the mean time spent commuting per week was 3.33 h (interquartile range: 3.42). The reporting of any active commuting time showed a positive trend (JT test, p-value <0.001) with neighborhood education level. As observed in Fig. 1, the reporting of any active com-muting time decreased with increasing comcom-muting
distance (JT test, p-value <0.001). Among active muters, the mean time per week spent in active com-muting was 1.67 h (interquartile range: 1.83). Descriptive analyses showed a negative trend (JT test, p-value <0.001) between the share of total commuting time spent active and the commuting distance (Fig. 2). The share of total commuting time spent active increased with neighbor-hood education level (JT test, p-value <0.001).
Associations between neighborhood education level and active commuting
The probabilities of reporting any active commuting time and the share of total commuting time spent active among active commuters according to neighborhood edu-cation level are presented in Tables 2 and 3 respectively, in terms of relative risks and risk differences.
Living in a highly educated neighborhood increased the risk of reporting any active commuting time by 77% on the relative scale (RR) compared to participants living in a low educated neighborhood. On the absolute risk difference scale, the RD for high educated neighborhood vs. low educated neighborhood was 0.29 (95% CI: 0.21, 0.37). Similarly, among active commuters, residing in a highly educated neighborhood was associated with a 42% increase in the share of total commuting time spent active on the relative scale. On the absolute risk difference scale, the RD for high educated neighborhood vs. low edu-cated neighborhood was 0.36 (95% CI: 0.21, 0.50).
Additional analyses showed a positive association between neighborhood education level and the abso-lute time spent active commuting both on the rela-tive risk scale and the absolute risk difference scale (Additional file 2).
Neighborhood education level, distance to work and likelihood of reporting any active commuting
After accounting for distances to work independent ef-fect, high neighborhood education level (vs. low) was still associated with the risk of reporting any active com-muting (Table 4, Model 1). The interaction model indi-cated a negative interaction between commuting distance (1 km increase) and neighborhood education in their Table 1 Descriptive information on the sample used in the
study,N = 1169
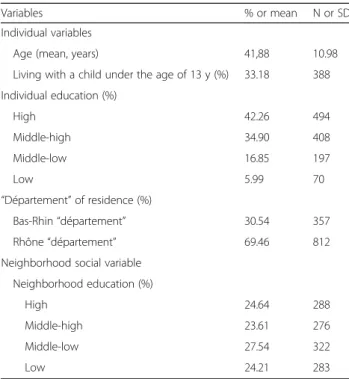
Variables % or mean N or SD Individual variables
Age (mean, years) 41,88 10.98 Living with a child under the age of 13 y (%) 33.18 388 Individual education (%) High 42.26 494 Middle-high 34.90 408 Middle-low 16.85 197 Low 5.99 70 “Département” of residence (%) Bas-Rhin“département” 30.54 357 Rhône“département” 69.46 812 Neighborhood social variable
Neighborhood education (%)
High 24.64 288
Middle-high 23.61 276 Middle-low 27.54 322
Low 24.21 283
association with the risk of reporting any active com-muting time (Table 4, Model 2). Sensitivity analyses using another definition of distance to work/study (i.e. based on travel speed) confirmed these results (Additional file 3). Repeated interaction analyses on the multiplicative scale with varying distance thresholds indicated that the modification effect (using IRRs) of distance to work on the relationship between neighborhood education and risk of reporting any active commuting was greater at 1500 m (Fig. 3).
Stratified analyses showed a stronger association between neighborhood education level and likelihood of reporting any active commuting at distance to work longer than 1500 m in comparison to distance to work shorter than 1500 m. For instance, the increased relative risk of high neighborhood education at long distance to work (>1500 m) was 77% (RR = 1.77; 95% CI: 1.44, 2.20), versus 6% (RR = 1.06; 95% CI: 0.87, 1.29) at short dis-tance to work (≤1500 m). Similarly, the absolute risk
of residing in a highly educated neighborhood (in comparison to low neighborhood education group) was greater at long distance (RD = 0.27; 95% CI: 0.18, 0.36) versus short distance to work (RD = 0.08; 95% CI: (−0.10, 0.26). Cochran’s Q tests were significant on both relative (p < 0.001) and absolute (p < 0.05) scales. Neighborhood education level, distance to work and share of total commuting time spent active among active commuters
As shown in Table 5 (Model 1), after accounting for dis-tances to work independent effect, neighborhood educa-tion levels were no more associated with the share of total commuting time spent active for all neighborhood education levels. Interaction analyses showed no signifi-cant modification effect of distance to work/study (1 km increase) on the relationship between neighbor-hood education level and share of total commuting time
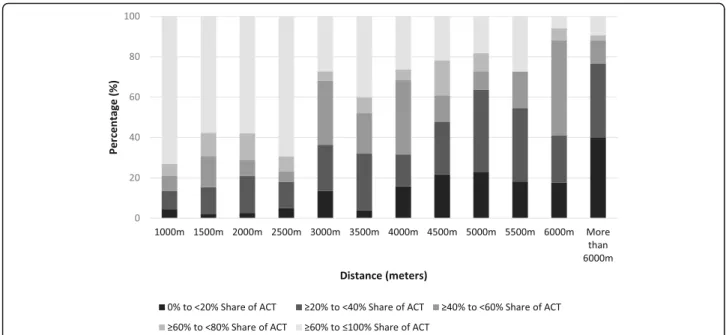
Fig. 2 Share of total commuting time spent active among active commuters by distance to place of work/study (N=537). ACT: Active commuting time
Table 2 Association between neighborhood education level and the probability of reporting any active commuting,N = 1169a
RR 95% CI RD 95% CI Neighborhood education (vs. low)
High 1.77 (1.48, 2.13) 0.29 (0.21, 0.37) Middle high 1.27 (1.04, 1.55) 0.09 (0.01, 0.18) Middle low 0.93 (0.75, 1.15) −0.02 (−0.10, 0.54)
RR relative risk, RD risk difference, CI confidence interval
a
Log-binomial and binomial regression models adjusted for age at the mean, low individual education, living with a child under the age of thirteen, and living in the Rhône“département”
Table 3 Association between neighborhood level education and the share of total commuting time spent active among active commuters,N = 537a
RR 95% CI RD 95% CI Neighborhood education (vs. low)
High 1.42 (1.24, 1.65) 0.36 (0.21, 0.50) Middle high 1.23 (1.05, 1.43) 0.20 (0.05, 0.36) Middle low 1.04 (0.89, 1.22) 0.04 (−0.12, 0.20)
RR relative risk, RD risk difference, CI confidence interval
a
Negative binomial regression models adjusted for age at the mean, low individual education, living with a child under the age of thirteen, and living in the Rhône“département”
spent active. Sensitivity analyses confirmed the absence of interaction with distance to place of work/study consid-ered as a continuous variable (Additional file 4). Yet re-peated analyses (using IRRs) indicated a greater modification effect at 2500 m (Fig. 4).
In stratified analyses, the association between neigh-borhood education level (high vs. low) and the share of
total commuting time spent active becomes significant at long distance to place of work/study on both the rela-tive and the absolute scales. More specifically, stratified analyses indicated a stronger association between high neighborhood education (vs. low) and share of total commuting time spent active at long distance (>2500 m) versus short distance to work (≤2500 m), on both the relative risk scale and the absolute risk scale (Table 5). Cochran’s Q tests were significant at α =0.1 on the rela-tive scale (p = 0.080) and on the absolute scale (p = 0.082), indicating a heterogeneous effect of neigh-borhood education on share of total commuting time spent active by distance to work strata.
Discussion
Principal findings
In this study, neighborhood education level was posi-tively associated with active commuting to place of work/study and distance commuted modified this asso-ciation with stronger neighborhood assoasso-ciation for dis-tance traveled up to 1500 or 2500 m.
Neighborhood educational disparities on active commuting
In this study, neighborhood education level was examined based on the hypothesis that it is a proxy for a safe and “trusting” environment and social norms favorable to physical activity, in line with previous research [11, 15–18]. Both the reporting of active commuting time and share of total commuting time spent active were associated with residence neighborhood educational level, independently of individual education. Similarly, a French cohort based in the Ile-de-France area reported a positive association between neighborhood educational level and both recre-ational physical activity [16, 18] and active transportation [17]. Also, Ross (2000) observed in Illinois in the US that individuals living in highly educated neighborhoods were more likely to walk than their counterparts living in less educated neighborhoods [15]. The authors suggested that since walking was a visible outdoor activity, it might en-courage mimetic behaviors and create a culture of walking within the neighborhood. The association between neigh-borhood education level and the absolute time of active commuting tend to confirm this hypothesis. However, ex-cept from a few studies [44, 46, 59, 60], multimodal transport behavior remains an under-explored area in place and health research. The ‘mechanisms of influence’ of neighborhood education on active commuting to work would need to be further investigated, considering the po-tential mediator effects of personal (socio-demographic characteristics, personal representation of transportation modes), interpersonal (e.g. social support) and environ-mental (e.g. residential density, traffic safety, neighborhood aesthetics, greenness, etc.) factors [11].
Table 4 Association between neighborhood education, distance to work and the probability of reporting any active commuting,N = 1169
Main models
Regression coefficients Models 1a Models 2b β 95% CI β 95% CI Neighborhood education
High 0.52 (0.34, 0.70) 0.73 (0.49, 0.98) Middle high 0.19 (−0.01, 0.39) 0.45 (0.18, 0.73) Middle low −0.09 (−0.30, 0.12) 0.22 (−0.07, 0.51) Low Ref. Ref.
Distance to work
1 km increase in distance −0.01 (−0.02, 0.00) 0.01 (0.006, 0.02) Neighborhood education and commuting distance
High x Distance - −0.03 (−0.05, −0.01) Middle high x Distance - −0.03 (−0.05, −0.01) Middle low x Distance - −0.02 (−0.04, 0.00) Low x Distance - Ref.
p-value for interaction < 0.001 Stratified analyses
Estimated effect measures RR 95% CI RD 95% CI Neighborhood education at short distance to place of work/study (< 1500 m),N = 146
High 1.06 (0.87, 1.29) 0.08 (−0.10, 0.26) Middle high 0.87 (0.69, 1.09) −0.10 (−0.31, 0.10) Middle low 0.71 (0.50, 1.02) −0.22 (−0.49, 0.04) Low Ref. Ref.
Neighborhood education at long distance to place of work/study (> 1500 m),N = 1023
High 1.77 (1.44, 2.20) 0.27 (0.18, 0.36) Middle high 1.24 (0.98, 1.56) 0.08 (−0.01, 0.17) Middle low 0.97 (0.77, 1.23) 0.00 (−0.08, 0.08) Low Ref. Ref.
p-value for Cochran’s Q test < 0.001 0.036
For stratified analyses, log-binomial regression model did not converge at the“short distances” level; we therefore performed Poisson regression models with robust error variance for both levels
RR relative risk, RD risk difference, CI confidence interval
aLog binomial regression model 1 included neighborhood education
levels, distance to work, and was adjusted for age at the mean, low individual education, living with a child under the age of thirteen, and living in the Rhône“département”
bLog binomial regression model 2 included neighborhood education
level, distance to work, the interaction term between neighborhood education levels and distance to work, and was adjusted for age at the mean, low individual education, living with a child under the age of thirteen, and living in the Rhône“département”
The modifying effect of distance to place of work/study A key finding of this study is the modifying effect of dis-tance traveled on the association between neighborhood education level and active commuting. The results sup-port our hypothesis that there would be a stronger neighborhood educational association for longer dis-tances on the reporting of active commuting. Evidence is less clear regarding the share of total commuting time spent active among active commuters since the inter-action was not significant with distance as a continuous variable (1 km increase). In the analyses, the homogen-eity tests were conducted using Type I error withα level set as 0.10. This methodological choice was made to in-crease the probability of detecting a modifying effect of distance on the relationship between neighborhood edu-cation and the share of total commuting time spent ac-tive among acac-tive commuters. Indeed, given the low statistical power of homogeneity tests and the small sample size involved for this outcome (N = 537), a more conservative choice of p-value for significance (α = 0.05) would have reduced the probability to detect “real” heterogeneity [57, 61, 62].
In the literature, there are few data on the analysis of modifying effect of distance on the relationship between neighborhood factors and active commuting, and results are mixed. In one study from Panter and colleagues among children in the county of Norfolk, the authors found no modifying effect of distance on the relationship between residential neighborhood socioeconomic deprivation and active commuting [41]. However, in another study [42], the same authors found a modifying effect of distance whereby parental attitudes towards their child were more influential on short distances (e.g. 0 to 1 km) while safety was stron-ger associated on long distances (e.g. more than 2 km). It should be noticed that the distance may not have the same
impact on active transportation among children and adults.
Another important result concerns the varying dis-tance threshold at which the effect measure modification was stronger, namely at 1500 m for the reporting of any active commuting and, at 2500 m for the share of total commuting time spent active. We hypothesized that the variation of distance threshold between the two out-comes might relate to a different degree between indi-viduals of perception of distance as a barrier to active commuting [63, 64]. Indeed, in the whole sample encompassing both active and passive commuters, dis-tance greater than 1500 m from home might not repre-sent a feasible distance by walk or cycle, while among participants already experiencing active commuting, the barrier effect of distance is weaker and appears on lon-ger distance to travel (i.e. 2500 m). This hypothesis that the barrier effect of distance depends on the level of in-dividuals’ physical activity is along the lines of a study from Wuerzer et al. [63] based on a younger age category, and indicating that “students who cycle for transportation are more likely to cycle regardless of distance” (p. 102).
Limitations and strengths
One key strength of this study relies on the use of spe-cific questions on transport behaviors, detailing the times spent on each active vs. non active transporta-tion modes per week. Moreover, this is one of the first study providing a deep investigation of the modifica-tion effect of distance to place of work/study - including distance thresholds - on the association between the neighborhood social environment and active commuting. Nevertheless, one major limitation of this study relies on its cross-sectional design that prevents to consider
residential self-selection [65], and to draw causal infer-ences regarding the effect of neighborhood education level on active commuting. The use of a unique neighborhood socio-economic indicator (neighborhood education level) prevent to generalize on our results to neighborhood so-cial disparities, espeso-cially since neighborhood income and neighborhood education might have opposite influence on physical activity outcomes [15, 66]. As such, Hankey et al. observed a positive association between neighborhood
education and both levels of pedestrian and bicycle traffic, but a negative association between neighborhood house-hold income and bicycle traffic [27]. Furthermore, the Nutrinet-Santé Cohort include proportionally more highly-educated highly individuals compared to the National Census data [67]. However, despite the high-education level of the participants, we observed neighbor-hood educational disparities in active commuting to work/study, suggesting that if it has a potential impact, it might have underestimated such disparities. Given the relatively small sample of participants involved in the evaluation of an effect heterogeneity of distance to work/ study on the share of total commuting time spent active (N = 537), replication studies on other populations and larger sample sizes are needed to assess the consistency of the results. Another source of uncertainty pertains to our definition of distance to place of work/study. The accuracy of the distance estimates is moderate as it does not ac-count for the street network (data not available), and the place of work/study was geolocated at the municipality or arrondissement level. However, using an Euclidian dis-tance compared to a street network disdis-tance might only have a low impact since a study based in the Bas-Rhin department evaluated the correlation between street-network distance and Euclidian distance and observed a very strong correlation (above 0.97) [68]. Measurement er-rors in the definition of the distance might have been in-troduced since the workplace was geocoded at the centroid of the municipality/arrondissement. We believe that this measurement error is not differential since it affects the whole sample, and the distance between the centroid of the municipality and the place of work is un-likely to be correlated with the education level of the neighborhood, or the active commuting behavior. Sensi-tivity analyses based on another definition of commuting distance provided similar results. Another limitation in-cludes the use of self-reported measures of commuting time which are frequently under/overestimated [69]. In addition, the assessment of neighborhood education level is home-centered, which might have introduced measure-ment errors in exposure definition as it does not account for the neighborhood education level at the workplace nor along the route between the two activity locations (i.e. home, place of work/study) [70]. Yet, a study in the Ile-de-France Region (France) found an association be-tween workplace neighborhood education and walking to work [17]. As this study focused exclusively on women, results cannot be generalized to men.
Implications for public health and opened questions This study highlights the complexity of the association between neighborhood educational level and active com-muting. More specifically, it suggests that the strength and the significance of the association between neighborhood Table 5 Association between neighborhood education,
distance to work and share of total commuting time spent active among active commuters,N = 537
Main models
Regression coefficients Model 1a Model 2b β 95% CI β 95% CI Neighborhood education
High 0.11 (−0.03, 0.25) 0.21 (0.04, 0.38) Middle high 0.00 (−0.14, 0.15) 0.10 (−0.08, 0.28) Middle low −0.11 (−0.25, 0.04) 0.05 (−0.15, 0.25) Low Ref. Ref.
Distance to work
1 km increase in distance −0.02 (−0.03, − 0.02) −0.02 (−0.02, −0.01) Neighborhood education and Distance to work
High x Distance - −0.01 (−0.03, 0.00) Middle high x Distance - −0.01 (−0.02, −0.01) Middle low x Distance - −0.02 (−0.03–0.00) Low x Distance - Ref.
p-value for interaction 0.20 Stratified analyses
Estimated effect measures RR 95% CI RD 95% CI Effect of neighborhood education at short distance to work (<2500 m), N = 196
High 1.04 (0.88, 1.22) 0.03 (−0.13, 0.20) Middle high 1.02 (0.85, 1.22) 0.02 (−0.16, 0.20) Middle low 1.04 (0.85, 1.27) 0.04 (−0.16, 0.24) Low Ref. Ref.
Neighborhood education at long distance from work (>2500 m),N = 341 High 1.29 (1.07, 1.56) 0.26 (0.07, 0.45) Middle high 1.17 (0.96, 1.41) 0.15 (−0.04, 0.34) Middle low 1.02 (0.85, 1.23) 0.02 (−0.17, 0.21) Low Ref. Ref.
p-value for Cochran’s Q test
0.080 0.082 RR relative risk, RD risk difference, CI confidence interval
a
Negative binomial regression model 1 included neighborhood education levels, distance to work, and was adjusted for age at the mean, low individual education, living with a child under the age of thirteen, and living in the Rhône“département”
bNegative binomial regression model 2 included neighborhood
education level, distance to work, the interaction term between neighborhood education levels and distance to work, and was adjusted for age at the mean, low individual education, living with a child under the age of thirteen, and living in the Rhône“département”
education level and active commuting would be distance-specific among women.
In terms of analysis strategy for studies examining en-vironmental influences on active commuting, further at-tention should be paid to the potential modifying effect of commuting distance on the influence of either social or physical environmental factors. Replication analyses are also needed to evaluate the share of total commuting time made by walking and cycling, separately. Indeed, the strength of the association between active commut-ing and distance to work may differ between walkcommut-ing and cycling [39], as some authors observed a stronger influence of distance on walking than cycling [71]. Such additional analyses would have been underpowered in our study, given the relatively small baseline sample size of active commuters, and the low statistical power of homogeneity tests [57].
In terms of population health interventions, our findings suggest that community-based interventions designed to promote active commuting among women living in edu-cationally disadvantaged neighborhoods [29] would be most important for individuals living far from their place of work. Subject to causal inference (not evaluated in this cross-sectional study), our results encourage interventions in low educated neighborhoods by targeting in priority residential areas located at more than 1500 m from poten-tial sources of employment, considering that distance to work is unlikely to be easily modified by intervention [33].
Conclusion
In summary, neighborhood education level is positively associated in working women with the probability of reporting any active commuting time and the share of commuting time spent active. Commuting distance to
place of work/study modifies the relationship between neighborhood education level and active commuting; more specifically the effect of neighborhood education is greater at long distance to work/study. While the results are robust, replication studies are required given the lack of evidence regarding distance as a modifier of social en-vironment effect on active transportation.
Additional files
Additional file 1: Distribution of the“share of total commuting time spent active” among active commuters, N = 537. (DOCX 13 kb) Additional file 2: Additional analysis: association between neighborhood education level and the absolute time of active commuting,N = 537a.
(DOCX 12 kb)
Additional file 3: Sensitivity analysis: association between neighborhood education, distance to work* and the probability of reporting any active commuting (N = 1169). (DOCX 14 kb)
Additional file 4: Sensitivity analysis: association between neighborhood education, distance to work* and share of total commuting time spent active among active commuters (N = 537). (DOCX 13 kb)
Acknowledgements
This work is part of the ACTI-Cités project (coordinator: JM Oppert) carried out with financial support from the French National Cancer Institute (Institut National du Cancer, INCa) through the Social sciences and humanities and public health programme (2011-1-PL-SHS-10).
The NutriNet-Santé cohort study is funded by the following public institu-tions: Ministère de la Santé, Institut de Veille Sanitaire (InVS), Institut National de la Prévention et de l’Education pour la Santé (INPES), Fondation pour la Recherche Médicale (FRM), Institut National de la Santé et de la Recherche Médicale (INSERM), Institut National de la Recherche Agronomique (INRA), Conservatoire National des Arts et Métiers (CNAM) and Paris 13 University. Menai Mehdi was funded by a grant from Fondation Le Roch - Les Mousquetaires. The funding sources played no role in the design and conduct of the study; the collection, management, analysis and interpretation of the data; or the preparation, review, and approval of the manuscript by coauthors. The authors thank Younes Esseddik, Paul Flanzy, Mohand Ait Oufella, Yasmina Chelghoum, and Than Duong Van (computer scientists), Florence Charpentier (dietitian), Elise Martin (communication assistant), Fig. 4 Analyses of distance threshold effect and neighborhood education level on the share of total commuting time spent active among active commuters (N=537)
Nathalie Arnault, Véronique Gourlet, Fabien Szabo, Laurent Bourhis, and Stephen Besseau (statisticians), and Rachida Mehroug (logistics assistant) for their technical contribution to the NutriNet-Santé study.
Study registration: The NutriNet-santé study was registered under the EudraCT number 2013-000929-31.
Authors’ contributions
Conceived and designed the experiments: JMO CS HC CW CE SH. Analyzed the data: CP TB JAN. Wrote the paper: CP. Involved in interpreting results and editing the manuscript: CP JAN TB PS TF SH FH MM CW HC CE JMO CS. All authors read and approved the final manuscript.
Competing interests
The authors declare that they have no competing interests.
Publisher’s Note
Springer Nature remains neutral with regard to jurisdictional claims in published maps and institutional affiliations.
Author details
1CRNH Rhône-Alpes, Pierre Benite, France.2CARMEN INSERM U060/University
of Lyon1/INRA U1235, Oullins, France.3CENS, Hospices Civils de Lyon, Pierre Benite, France.4Department of Family Medicine and Public Health & Scripps
Institution of Oceanography, University of California, 9500 Gilman Drive, San Diego La Jolla, 92093, CA, USA.5Paris-Est University, Labex Futurs Urbains,
Marne-la-Vallée, France.6Department of Geography, LADYSS, Paris 8 University, Paris, France.7Université Paris 13, Sorbonne Paris Cité - EREN
(Equipe de Recherche en Epidémiologie Nutritionnelle), U1153 Inserm, Inra, Cnam, Centre de Recherche en Epidémiologie et Biostatistiques; CRNH IdF, Bobigny, France.8Laboratoire Image, Ville et Environnement, Université de Strasbourg, Strasbourg, France.9Paris-Est University, Department of
Geography, Lab-Urba, Créteil, France.10Université Pierre et Marie Curie-Paris 6, Dept of Nutrition Pitié-Salpêtrière Hospital (AP-HP), Institute of Cardiometabolism and Nutrition (ICAN), Paris, France.11Service d’Endocrinologie, Diabète, Nutrition Centre Hospitalier Lyon Sud, 165 Chemin du Grand Revoyet, F69310 Pierre-Bénite, France.
Received: 26 August 2016 Accepted: 24 May 2017 References
1. Sugiyama T, Ding D, Owen N. Commuting by car: weight gain among physically active adults. Am J Prev Med. 2013;44(2):169–73.
2. Pucher J, et al. Walking and cycling to health: a comparative analysis of city, state, and international data. Am J Public Health. 2010;100(10):1986. 3. Laverty AA, et al. Active travel to work and cardiovascular risk factors in the
United Kingdom. Am J Prev Med. 2013;45(3):282–8.
4. Hamer M, Chida Y. Active commuting and cardiovascular risk: a meta-analytic review. Prev Med. 2008;46(1):9–13.
5. Oja P, Vuori I, Paronen O. Daily walking and cycling to work: their utility as health-enhancing physical activity. Patient Educ Couns. 1998;33(Supplement 1(0)):S87–94.
6. Wanner M, et al. Active transport, physical activity, and body weight in adults: a systematic review. Am J Prev Med. 2012;42(5):493–502. 7. Yang L, et al. Associations between active commuting and physical activity
in working adults: cross-sectional results from the commuting and health in Cambridge study. Prev Med. 2012;55(5):453–7.
8. Cooper AR, et al. Commuting to school: are children who walk more physically active? Am J Prev Med. 2003;25(4):273–6.
9. Bauman AE, et al. Correlates of physical activity: why are some people physically active and others not? Lancet. 2012;380(9838):258–71.
10. Ball K, et al. Personal, social and environmental determinants of educational inequalities in walking: a multilevel study. J Epidemiol Community Health. 2007;61(2):108–14.
11. Cerin E, Leslie E, Owen N. Explaining socio-economic status differences in walking for transport: an ecological analysis of individual, social and environmental factors. Soc Sci Med. 2009;68(6):1013–20.
12. Rind E, et al. Are income-related differences in active travel associated with physical environmental characteristics? A multi-level ecological approach. Int J Behav Nutr Phys Act. 2015;12(1):73.
13. Winters M, et al. Older adults’ outdoor walking and the built environment: does income matter? BMC Public Health. 2015;15(1):876.
14. Juneau C, et al. Socioeconomic position during childhood and physical activity during adulthood: a systematic review. Int J Public Health. 2015:60(7):799-813. 15. Ross CE. Walking, exercising, and smoking: does neighborhood matter? Soc
Sci Med. 2000;51(2):265–74.
16. Perchoux, C., et al.. Accounting for the daily locations visited in the study of the built environment correlates of recreational walking (the RECORD Cohort Study). Prev Med. 2015;81:142-9
17. Karusisi N, et al. Environmental conditions around itineraries to destinations as correlates of walking for transportation among adults: the RECORD cohort study. PLoS One. 2014;9(5):e88929.
18. Chaix B, et al. The environmental correlates of overall and neighborhood based recreational walking (a cross-sectional analysis of the RECORD study). Int J Behav Nutr Phys Act. 2014;11(1):20.
19. Turner MA, et al. Helping poor families gain and sustain access to high-opportunity neighborhoods. Washington: The Urban Institute; 2011. 20. Galea S, et al. Education inequality and use of cigarettes, alcohol, and
marijuana. Drug Alcohol Depend. 2007;90:S4–S15.
21. Lê F, Ahern J, Galea S. Neighborhood education inequality and drinking behavior. Drug Alcohol Depend. 2010;112(1):18–26.
22. Mowafi M, et al. Are neighborhood education levels associated with BMI among adults in Cairo, Egypt? Soc Sci Med. 2011;72(8):1274–83. 23. Leal C, et al. Are associations between neighborhood socioeconomic
characteristics and body mass index or waist circumference based on model extrapolations? Epidemiology. 2011;22(5):694–703.
24. Chaix B, et al. Associations of supermarket characteristics with weight status and body fat: a multilevel analysis of individuals within supermarkets (RECORD study). PLoS One. 2012;7(4):e32908.
25. Lewin A, et al. Residential neighborhood, geographic work environment, and work economic sector: associations with body fat measured by bioelectrical impedance in the RECORD Study. Ann Epidemiol. 2014;24(3):180–6.
26. Wang X, et al. Estimating mixed-mode urban trail traffic using negative binomial regression models. J Urban Plann Dev. 2013;140(1):04013006. 27. Hankey S, et al. Estimating use of non-motorized infrastructure: Models of
bicycle and pedestrian traffic in Minneapolis,MN. Landsc Urban Plan. 2012;107(3):307–16.
28. Brand T, et al. What works in community-based interventions promoting physical activity and healthy eating? A review of reviews. Int J Environ Res Public Health. 2014;11(6):5866–88.
29. Cleland V, et al. Effectiveness of interventions to promote physical activity among socioeconomically disadvantaged women: a systematic review and meta-analysis. Obes Rev. 2013;14(3):197–212.
30. Badland HM, Schofield GM, Schluter PJ. Objectively measured commute distance: associations with actual travel modes and perceptions to place of work or study in Auckland, New Zealand. J Phys Act Health. 2007;4(1):80–6. 31. World Health Organization Transport, Environment and Health. Vol. 89.
Austria: Regional Office for Europe of the World Health Organization: 2004. 32. Badland HM, Schofield GM, Garrett N. Travel behavior and objectively
measured urban design variables: associations for adults traveling to work. Health & Place. 2008;14(1):85–95.
33. Dalton AM, et al. Neighbourhood, route and workplace-related environmental characteristics predict adults’ mode of travel to work. PLoS One. 2013;8(6):e67575.
34. Hoehner, C.M., et al., Understanding the independent and joint associations of the home and workplace built environments on cardiorespiratory fitness and body mass index. Am J Epidemiol. 2013.
35. Saelens BE, Handy SL. Built environment correlates of walking: a review. Med Sci Sports Exerc. 2008;40(7 Suppl):S550.
36. Panter JR, Jones A. Attitudes and the environment as determinants of active travel in adults: what do and don’t we know. J Phys Act Health.
2010;7(4):551–61.
37. Yeung J, Wearing S, Hills AP. Child transport practices and perceived barriers in active commuting to school. Transp Res A Policy Pract. 2008;42(6):895–900. 38. Larsen K, et al. The influence of the physical environment and
sociodemographic characteristics on children's mode of travel to and from school. Am J Public Health. 2009;99(3):520.
39. Panter JR, Jones AP, van Sluijs EM. Environmental determinants of active travel in youth: A review and framework for future research. Int J Behav Nutr Phys Act. 2008;5(1):34.
40. Panter J, et al. The influence of distance to school on the associations between active commuting and physical activity. Pediatr Exerc Sci. 2011;23(1):72.
41. Panter JR, et al. Neighborhood, route, and school environments and children's active commuting. Am J Prev Med. 2010;38(3):268–78. 42. Panter JR, et al. Attitudes, social support and environmental perceptions as
predictors of active commuting behaviour in school children. J Epidemiol Community Health. 2010;64(01):41–8.
43. Shephard RJ. Is active commuting the answer to population health? Sports Med. 2008;38(9):751–8.
44. Heinen E, et al. Changes in mode of travel to work: a natural experimental study of new transport infrastructure. Int J Behav Nutr Phys Act. 2015;12(1):81. 45. Smith RD, Petticrew M. Public health evaluation in the twenty-first century: time to see the wood as well as the trees. J Public Health. 2010;32(1):2–7. 46. Panter J, Desousa C, Ogilvie D. Incorporating walking or cycling into car
journeys to and from work: the role of individual, workplace and environmental characteristics. Prev Med. 2013;56(3):211–7.
47. Hercberg S, et al. The Nutrinet-Santé Study: a web-based prospective study on the relationship between nutrition and health and determinants of dietary patterns and nutritional status. BMC Public Health. 2010;10(1):1. 48. Menai M, et al. Walking and cycling for commuting, leisure and errands:
relations with individual characteristics and leisure-time physical activity in a cross-sectional survey (the ACTI-Cités project). Int J Behav Nutr Phys Act. 2015;12(1):150.
49. Le Jeannic, T., La mobilité des Français, panorama issu de l’enquête nationale transports et déplacements 2008. Paris: ministère de l’Écologie, du Développement durable, des Transports et du Logement, 2010.
50. Feuillet T, et al. Spatial heterogeneity of the relationships between environmental characteristics and active commuting: towards a locally varying social ecological model. Int J Health Geogr. 2015;14(1):12. 51. Jones C, Ogilvie D. Motivations for active commuting: a qualitative
investigation of the period of home or work relocation. Int J Behav Nutr Phys Act. 2012;9(1):109.
52. Spiegelman D, Hertzmark E. Easy SAS calculations for risk or prevalence ratios and differences. Am J Epidemiol. 2005;162(3):199–200.
53. Zou G. A modified poisson regression approach to prospective studies with binary data. Am J Epidemiol. 2004;159(7):702–6.
54. Greenland S, Pearce N. Statistical foundations for model-based adjustments. Annu Rev Public Health. 2015;36:89–108.
55. VanderWeele TJ, Knol MJ. A tutorial on interaction. Epidemiol Methods. 2014;3(1):33–72.
56. Richards JL, et al. Does neighborhood deprivation modify the effect of preterm birth on children's first grade academic performance? Soc Sci Med. 2015;132:122–31.
57. Kaufman JS, MacLehose RF. Which of these things is not like the others? Cancer. 2013;119(24):4216–22.
58. Gascon, M.-O., et al., Calcul a posteriori des distances dans les enquêtes ménages déplacements. 2009.
59. Lachapelle U, et al. Commuting by public transit and physical activity: where you live, where you work, and how you get thete. J Phys Act Health. 2011;8(1):S72.
60. Chaix B, et al. Active transportation and public transportation use to achieve physical activity recommendations? A combined GPS, accelerometer, and mobility survey study. Int J Behav Nutr Phys Act. 2014;11(1):1.
61. Higgins JP, et al. Measuring inconsistency in meta-analyses. BMJ Br Med J. 2003;327(7414):557.
62. Dickersin K, Berlin JA. Meta-analysis: state-of-the-science. Epidemiol Rev. 1992;14(1):154–76.
63. Wuerzer T, Mason SG. Cycling willingness: investigating distance as a dependent variable in cycling behavior among college students. Appl Geogr. 2015;60:95–106.
64. Mullan E. Swapping the lycra for the suit: Determinants of cycling for transport among leisure cyclists in Ireland. Int J Health Promot Educ. 2012;50(5):229–37.
65. McCormack GR, Shiell A. In search of causality: a systematic review of the relationship between the built environment and physical activity among adults. Int J Behav Nutr Phys Act. 2011;8(125):10.1186.
66. Geyer S, et al. Education, income, and occupational class cannot be used interchangeably in social epidemiology. Empirical evidence against a common practice. J Epidemiol Community Health. 2006;60(9):804–10.
67. Andreeva, VA, et al. Comparison of the sociodemographic characteristics of the large NutriNet-Santé e-cohort with French Census data: the issue of volunteer bias revisited. J Epidemiol Community Health. 2015: p. 10. 1136/jech-2014-205263.
68. Salze P, et al. Estimating spatial accessibility to facilities on the regional scale: an extended commuting-based interaction potential model. Int J Health Geogr. 2011;10(1):1.
69. McCormack, GR, et al. Objective versus perceived walking distances to destinations: correspondence and predictive validity. Environ Behav. 2007. 70. Perchoux C, et al. Conceptualization and measurement of environmental
exposure in epidemiology: accounting for activity space related to daily mobility. Health Place, 2013. 21(0): p. 86-93.
71. Schlossberg M, et al. School trips: effects of urban form and distance on travel mode. J Am Plan Assoc. 2006;72(3):337–46.
• We accept pre-submission inquiries
• Our selector tool helps you to find the most relevant journal • We provide round the clock customer support
• Convenient online submission • Thorough peer review
• Inclusion in PubMed and all major indexing services • Maximum visibility for your research
Submit your manuscript at www.biomedcentral.com/submit