HAL Id: halshs-00880933
https://halshs.archives-ouvertes.fr/halshs-00880933
Submitted on 7 Nov 2013
HAL is a multi-disciplinary open access
archive for the deposit and dissemination of sci-entific research documents, whether they are pub-lished or not. The documents may come from teaching and research institutions in France or abroad, or from public or private research centers.
L’archive ouverte pluridisciplinaire HAL, est destinée au dépôt et à la diffusion de documents scientifiques de niveau recherche, publiés ou non, émanant des établissements d’enseignement et de recherche français ou étrangers, des laboratoires publics ou privés.
Labour Market Policies in Times of Crisis: A
Comparison of the 1992-1993 and 2008-2010 Recessions
Christine Erhel, Charlotte Levionnois
To cite this version:
Christine Erhel, Charlotte Levionnois. Labour Market Policies in Times of Crisis: A Comparison of the 1992-1993 and 2008-2010 Recessions. 2013. �halshs-00880933�
Documents de Travail du
Centre d’Economie de la Sorbonne
Labour Market Policies in Times of Crisis: A Comparison of
the 1992-1993 and 2008-2010 Recessions
Christine E
RHEL,Charlotte L
EVIONNOISLabour Market Policies in Times of Crisis: A Comparison of the 1992-1993
and 2008-2010 Recessions
Authors: Christine Erhel1 (CEE, CES, Université Paris 1) and Charlotte Levionnois2 (CES, Université Paris 1, CEE)
Abstract. This article examines the reaction function of labour market expenditure to the economic
cycle and especially to the labour market situation in 24 OECD countries, over the period 1985 to 2010. The level of public debt is also introduced as a potential determinant of labour market policy expenditures. Using a fixed effect model with interacting terms, it focuses on two periods of crisis (1992-1993 and 2007-2009). The results indicate that the level of reactivity of labour market expenditure did in general decrease between the early 1990s and the 2008 downturn. This could result from important reforms in this field, over the last 20 years.
Keywords: Labour market policies, international comparisons, crisis
Politiques de l’emploi par temps de crise : comparaison des récessions de 1992-1993 et
2008-2010
Résumé. Cet article s’intéresse à la fonction de réaction des dépenses pour l’emploi par rapport aux
variations économiques, et plus précisément au taux de chômage, dans 24 pays de l’OCDE sur la période 1985 à 2010. Nous introduisons également le niveau de dette publique en tant que potentiel déterminant des dépenses du marché du travail. Nos résultats indiquent que le niveau de réactivité des dépenses pour l’emploi à la situation économique s’est affaibli entre le début des années 1990 et 2008. Cette réduction de la fonction contra-cyclique laisse présager un impact notable des réformes du marché du travail des vingt dernières années, avec toutefois une forte hétérogénéité entre pays. Notre comparaison entre la crise du début des années 1990 et la crise de 2008 met en évidence des traits distinctifs entre les deux crises. D’une part la politique pour l’emploi est moins expansionniste pendant la crise récente et d’autre part, la contrainte budgétaire sur cette même période semble avoir été de pair avec un changement dans le policy mix.
Mots-clés : politique de l’emploi, comparaison internationale, crise, dépenses pour l’emploi
JEL Classification: C33, J08, J38 1 Courriel : christine.erhel@univ-paris1.fr 2 Courriel : charlotte.levionnois@malix.univ-paris1.fr
Introduction
Labour market policies may exert counter-cyclical effects through different types of programmes and mechanisms. Unemployment benefits and some active schemes provide income maintenance effects, whereas other programmes help sustain employment levels (direct job creation measures or job subsidies) or avoid layoffs (employment maintenance programmes, such as short-time work). In a medium or long-run perspective, training schemes might also contribute to workers’ employability and to firms’ productivity and competitiveness.
Such a counter-cyclical function used to be part of the traditional Swedish model, as designed in the 1960s by G. Rehn and R. Meidner, and which emphasized the complementarities between macroeconomic policy, a solidaristic wage policy, and labour market policies. Labour market policies should support the adaptation of the workforce to industrial restructuring and sustain employment and workers’ income, in the case of increasing unemployment. Temporary public sector jobs were considered as important tools to achieve this counter-cyclical role, using an active measure and to avoid unemployment as much as possible. Even if this focus on active programmes appears to be quite specific to the so-called “Swedish model” (Anxo, Niklasson, 2006), the counter-cyclical function of labour market policies exists in almost all OECD countries. In low expenditure or “liberal” countries (like the US or the UK) it is mainly based on unemployment benefits (Howell, Azizoglu, 2011), whereas in continental Europe and Nordic countries some job maintenance or job creation programmes are also quite developed (Rinne, Zimmermann, 2013; Möller, 2010, Schmitt, 2011). During the 2008 Great Recession, labour market policies have reacted in OECD countries, either mechanically (through unemployment insurance expenditures for instance), or following voluntary policies (increases in benefits generosity, new active programmes, etc.). Nevertheless, the relative importance of these policy reactions, in comparison to previous recessions, merits examination. Indeed, labour market policies have been under reform for the last twenty years and exhibit trends towards “activation” (reinforcement of work incentives for unemployed or inactive persons, enrolment in training or work experience schemes after the longer duration of unemployment, institutional reforms, etc.), all within a general context of social spending retrenchment (Lehndorff, 2012). Besides, fiscal constraint has been particularly strong in the recent crisis, especially since 2010 and the “debt crisis” may have reduced the room for manoeuvre of labour market policy expenditures.
In this context, it is particularly interesting to analyze labour market policy expenditures in reaction to the crisis and to compare them with the last major recessions experienced by OECD countries (1993). Although quite a lot of recent papers have investigated the links between labour market adjustments and institutions (Cazes et al., 2009; Schmitt, 2011; Aiginger et al., 2011), very few focus specifically on labour market policy reactions, despite the importance of such policy tools in dealing with high unemployment levels (the OECD Employment Outlook reports constitute an exception, especially OECD, 2012).3 As far as these policies are concerned, a series of questions might be raised: is the degree of sensitivity of labour market policy expenditures to the economic cycle stable over time or did it fall in the recent recession? What are the components and leverages of labour market policy reactions? It may be supposed that following implementation, active programmes were more reactive than in the previous period. But is it really the case?
To deal with these issues, we use comparative data about labour market policy expenditures for 24 OECD countries, over the period 1985 to 2010. The empirical strategy is based on an adaptation of
3
Ohlsson’s analysis of the Swedish labour market policy reaction function, which was initially conducted for the 1980s (Ohlsson, 1992).
The paper is organized as follows. In Section 1 we present some descriptive statistics and qualitative facts about the reaction of labour market policies to recent economic downturns. In Section 2 we detail our analytical framework and describe our dataset and the empirical model. Section 3 provides the econometric results.
1. The reaction of labour market policies to recessions: a comparison of 2008-2010 with 1992-1993
1.1. The heterogeneity of labour market reactions to recessions
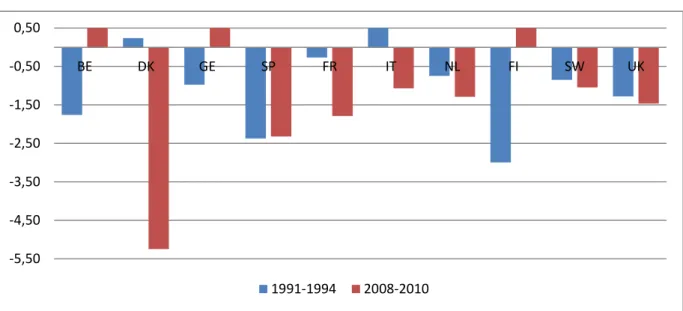
The depths of crises in terms of their impact on unemployment must be related to economic variations. Elasticity calculations show that unemployment reactions to economic variations were generally greater during the “Great Recession” of 2008-2010, than during the 1992-1993 crisis (Figure 1).4 As far as the majority of countries is concerned, elasticities were negative and greater than the unity. This means that unemployment adjustments were more than proportional to economic variations: this has been the case of unemployment “over-adjustment” (Cochard et al., 2010, COE, 2012). In France, a decrease of one percentage point of GDP in that period led to a rise of 1.79 percentage points of unemployment during the 2008-2009 recession. The same elasticity was -0.27 during the 1992-1993 crisis (i.e. a one percentage point decline of GDP during that period led to a rise of 0.27 percentage points in unemployment). Adjustments were in general more important during the 2008-2009 crisis (compared to the previous one) in countries like the Netherlands, Sweden or in the United Kingdom. Belgium, Italy and Denmark stand out because of their atypical situation in 1992-1993. At that time, Belgium and Germany did indeed react well to the crisis, as a GDP drop did not stop the trend in falling unemployment. Conversely for Italy and Denmark and more spectacularly for the latter, the situation appears to have been very different at the end of the 2000s. During the Great Recession, the first episode of recession was indeed characterized by an elasticity of -5.25 in Denmark (compared to +0.2 at the beginning of the 1990s). These elasticities confirm the hypothesis according to which labour market reactions have been much more heterogeneous during the recent crisis compared to past ones (Aiginger, Horvath, Mahringer (2012)). The well-known “Okun’s law” has been the object of several studies concerning its evolution during the Great Recession (Cazes, Verik, Heuer, 2009). The economic literature is interested in the reason why the labour market adjustments to the crisis have been different these last years and especially focuses on the role of the institutions (Cazes et al., 2009; Schmitt, 2011; Aiginger et al., 2011). However the role played by the labour market policy is rarely the key feature of interest (with the exception of OECD, 2012).
4
Elasticities are calculated from the quarter when GDP is at its peak to the quarter when it is at its trough. We choose to take the first peak from the first quarter in 1991 for the first crisis, and from the third quarter of 2007 for the second one. The 2008-2009 crisis led, for instance, in Sweden to the first downturn in the economic outlook during the second quarter of 2008 and the recovery came during the first quarter of 2009. We can thus calculate the elasticity on that period and each country will have different GDP variations. This methodology helps us to isolate the time effect and to consider countries’ characteristics. Because it is a short economic cycle and because countries were not impacted at the same time, this Figure allows us to focus on the depth of adjustments.
Figure 1: Elasticities of unemployment in relation to GDP variations. Comparison between the
1992-1993 and 2008-2009 crises
Source: OCDE, 2012, authors’ calculations.
1.2 Labour market policy trends: some quantitative facts
Labour market policies include a wide range of programmes, unemployment insurance and job search assistance, hiring subsidies and direct job creations in the public sector, training, etc.
In order to make international comparisons, we use the definition adopted by the OECD that relies on a classification of nine labour market policy categories. These expenditures are usually divided into two main types: i) active labour market expenditure which aims at increasing employment of labour market policy beneficiaries, increasing their level of training and qualification and improving the functioning of the labour market; and ii) passive labour market expenditure which seeks to maintain the revenue of the unemployed or non-active persons. In order to make comparisons on the levels of labour market expenditure, these data are expressed as a percentage of GDP. We focus on overall trends but also on specific changes in active labour market policies (the corresponding graphic Figures are give in appendix).
Figure 2 shows that labour market expenditure tended to decrease in the 2000s, before increasing again since the beginning of the Great Recession. Denmark is the country in which labour market expenditure has been the most important in the long run. Liberal countries such as the United States and the United Kingdom are at the bottom of the graph, as they spend the less for their labour market policies (less than 1% of GDP). Continental European countries form a second group that can be identified. In countries like France or Germany, labour market expenditure decreased during the decade to 2008, which was a turning point. These countries stand in an intermediate level of labour market expenditure, between the low levels of liberal countries and the high ones of Nordic countries (Sweden, Netherlands, or Denmark) (Esping-Andersen, 1990).
-5,50 -4,50 -3,50 -2,50 -1,50 -0,50 0,50 BE DK GE SP FR IT NL FI SW UK 1991-1994 2008-2010
Figure 2: Labour market expenditure between 2002 and 2010 (as a percentage of GDP).
Source: OECD, 2012, authors’ calculations.
The increase of labour market expenditure during the Great Recession has aimed at restraining labour market degradation, resulting from the worsening of economic conditions. Recovery plans were significant and both active and passive labour market expenditure increased during the first period of the crisis.
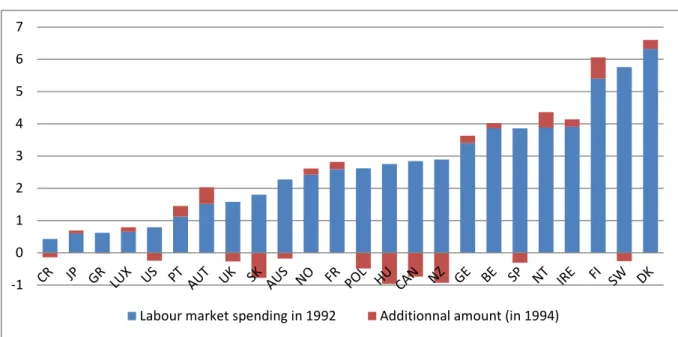
Nevertheless Figures 3 and 4 highlight a level of labour market expenditure lower than that of the 1990s, although the adjustment to the recent crisis episode appears quite important for total expenditures. But in the case of active labour market policies, both the levels and the variations were lower in 2008-2010 compared to 1992-1993, despite activation policies that were implemented during the 1990s and 2000s (Figures A1 and A2 in appendix). The case of Sweden is quite spectacular, with a strong reduction in the level of active expenditures between the two periods.
0 0,5 1 1,5 2 2,5 3 3,5 4 4,5 5 2002 2003 2004 2005 2006 2007 2008 2009 2010 DK FR GE IRE NT PT SP SW UK US
Figure 3a: Labour market expenditure between 1992 and 1994 (as a percentage of GDP)
Source: OECD, 2012, authors’ calculations.
Figure 3b: Labour market expenditure between 2008 and 2010 (as a percentage of GDP)
Source: OECD, 2012, authors’ calculations.
-1 0 1 2 3 4 5 6 7
Labour market spending in 1992 Additionnal amount (in 1994)
-1 0 1 2 3 4 5 6 7
CR SI JP HU SK AUS POL CAN LUX US IT SW PT AUT GE FR IRE FI NT DK SP BE
Figure 4a: Active labour market expenditure between 1991 and 1993 (as a percentage of GDP)
Source: OECD, 2012, authors’ calculations.
Figure 4b: Active labour market expenditure between 2007 and 2009 (as a percentage of GDP)
Source: OECD, 2012, authors’ calculations.
-0,5 0 0,5 1 1,5 2 2,5 3
Active labour market spending in 1991 Additionnal amount (in 1993)
-0,5 0 0,5 1 1,5 2 2,5 3
For cross-country and inter-temporal comparisons, labour market expenditure should be related to the number of unemployed. In Figure 5, we draw a comparison of labour market expenditure per person unemployed by country. It reveals great disparities between countries and especially in the long run. Since 2008, nearly all countries have faced a decline of their labour market expenditure per person unemployed (e.g. Denmark, Netherlands, Belgium, Ireland, United Kingdom etc.), while this was not the case during the 1992-1993 crisis. A slight increasing trend can be perceived between the two crises, but this occurs heterogeneously across countries.
Denmark lies at the top of the graph, exhibiting the highest spending for its unemployed in the long run. There was a large increase during the last two decades until 2008, followed by a big drop. Sweden represents a particular case in the 1990s, as a strong deterioration of the Swedish labour market occurred between 1990 and 1993. Consequently as the country did not have much room for manoeuvre (in terms of public finances), and expenditure per person unemployed fell dramatically. Since 1993, labour market expenditure per person unemployed has remained quite stable, with a decrease between 2007 and 2010. Liberal countries like the United States and the United Kingdom stand at the bottom, with very low levels of expenditure per person.
Figure 5: Ratio between labour market policies (in thousands of dollars) and the number of
unemployed.
Source: OCDE, 2012, authors’ calculations.
According to these indicators, both the overall effort devoted to labour market policies and their reactivity to economic crises seem to have decreased between the beginning of the 1990s and the Great Recession of 2008. This situation is even clearer for active expenditures: for instance, the decrease in expenditures for unemployed is higher for them than for overall expenditures (see Figure A1 in the appendix). This quite paradoxical result (after two decades of activation) has also been observed by the OECD (2012). Focusing on active expenditures, OECD analysis shows that active labour market policies’ reactivity to cyclical unemployment variations was low between 2007
0 10 20 30 40 50 60 70 80 90 DK FI FR GE IRE NT PT SW UK US
and 2010, although their sensitivity to structural unemployment was higher than in the past. The result of this limited reaction is the decrease in active expenditures per person unemployed, which might even have been accentuated by budgetary constraints after 2010.
1.3 A qualitative analysis
Labour market policies have undergone important reforms since the beginning of the 1990s (OECD, 2007; Bonoli, 2012; EEO, 2009), which may have changed their reactivity to the economic cycle. First, unemployment compensation has been reformed in many countries in order to increase incentives for the unemployed to take a job: the generosity and total duration of unemployment benefits have generally been decreasing (with some spectacular examples, like the Hartz reforms in Germany), and sanctions have been strengthened in many countries for unemployed persons whose job search is insufficient or who refuse an “acceptable job offer”. Compulsory participation in active labour market programmes after a given spell of unemployment has also been developed. At the same time, financial incentives to work (even at low wage levels) have been increased to “make work pay” through the creation of negative income taxes and through some social benefit reforms (limiting inactivity or unemployment traps). These trends towards increased (direct or indirect) pressure on unemployed are usually qualified as “activation”.
Second, institutional reforms have been implemented in many countries. They involve the privatization of some services for the unemployed (mainly job search, but also training), in order to improve the overall efficiency of the employment service. Privatized service providers have generally been put under the direct control of public employment services (through subcontracting procedures). Besides, in many countries, the creation of “one stop shops” for the unemployed by merging unemployment benefits management and job search assistance has been carried out in order to enhance public employment service productivity, and to increase the staff that might be devoted to job search assistance.
Third, the policy mix of labour market measures has generally evolved. Within passive expenditures, early retirement schemes have almost disappeared in most OECD countries (the main exception is Denmark). Among active expenditures, those devoted to targeted job subsidies and public sector job creation programmes have generally declined, following negative or sceptical evaluation results, whereas supply oriented measures (job search assistance, training) have been expanding, as have some general labour cost reduction programmes (like the French “exonérations de charges sur les bas
salaires”, i.e. reduced social insurance contributions for low-wage workers).
In general, most of these reforms are likely to have a restrictive impact on total labour market policy expenditure and reduce its overall sensitivity to the economic cycle. Indeed, in the traditional labour market policy model, this counter-cyclical function was mainly the result of unemployment insurance and targeted job creation programmes. Besides, following activation trends, the total share of active expenditures should be increased by these reforms.
It seems that the 2008 crisis did not change these priorities. In some countries, temporary increases in unemployment insurance or the generosity of short-time work schemes were decided for 2008-2010, but previous trends towards activation and institutional reforms have been maintained. Besides, the debt crisis from 2010 onwards has increased pressure on public finances and resulted in cuts in some labour market policy programmes (in Southern European countries, but also in Denmark and in the UK: Erhel, Levionnois, 2013, EEO, 2013).
We can derive three main hypotheses about labour market policy trends from these quantitative and qualitative observations:
- First, although labour market policies are linked to unemployment, the 2008 recession differs from the 1992-1993 one in terms of expenditure levels and reactivity to unemployment;
- Second, apart from unemployment, some other factors may play a role in explaining labour market policy trends across countries and over time: budget constraints clearly spring to mind;
- Third, within overall expenditures, the “policy mix” might have changed in favour of more active policies, following activation policies.
2. The framework of the empirical analysis: the labour market reaction function
2.1 Theoretical framework and related empirical literature: Ohlsson (1992)
We are interested in the policy leverages that are undertaken during economic downturns in the labour market, and more specifically in the links between labour market policy expenditure and economic variations, i.e. in the labour market reaction function. The economic literature offers very few studies on this issue. The relationship which is the most studied is the opposite one, relating labour market policy/expenditure and employment or unemployment in an evaluation perspective (Layard, Nickell, Jackman, 1991). However, analyzing policy reaction functions is a standard procedure for monetary and fiscal policies (Blanchard, Perotti, 2002, Taylor, 1993).
An exception for labour market policy analysis is the empirical work carried out by Ohlsson (Ohlsson, 1992), which focuses on the reaction function of direct job creation measures (targeted at the unemployed) to economic variations in Sweden. From the 1930s through to the late 1980s, these programmes of direct job creation – specifically developed in the public and non-market sector – constituted a central element of Swedish labour market policy, and more broadly of Swedish counter-cyclical policies.
Ohlsson’s objective is to find systematics in the funds granted to job creation measures in Sweden and whether they are a response to the prevailing economic conditions. His empirical analysis aims at determining whether the political commitment to fine-tuning of the economy by job creation measures has been carried out in practice.
Policies are supposed to obey the following rule:
�� = ��∗+ � [ �(��∗)− ��∗ ] + �� (1)
Where �� is actual grants in period t, ��∗ is target grants in period t, �(��∗) is unemployment allocated target grants in period t, ��∗ is target unemployment in period t, and �� is a random error. The parameter � captures the degree of systematic policy reaction, i.e. the extent to which an activist policy rule is in effect. This equation aims at estimating a reaction function with the grants awarded to job creation measures, depending on the labour market conditions.
Ohlsson considers that direct job creation measures fluctuate according to the size of the labour force on the one hand, and according to the number of unemployed on the other hand. If the labour force impacts on the grants, the target grants in period t can be expressed as: ��∗= �∗ .���−�, where a parameter �∗ is associated with the size of the active population in the previous fiscal year. The impact
of the labour market conditions on the funds granted before the fiscal year is measured by ��∗ , the level of “targeted” unemployment, which itself depends on the “targeted” unemployment rate multiplied by the active population of the previous fiscal year ���−�. Thus Equation (1) becomes:
�� = �0 + �1 .���−�+�2 .��−�+�� (2)
Where �1 = �∗− �2 ∗ �∗ and captures both the funds needed for objectives other than keeping unemployment low and the impact of the target number of unemployed. �2 ∗ ��−� represents the impact of unemployment from the previous fiscal year on the funds granted and �0 is the constant. Results are also controlled for political change and for the proximity of an election year.
In his empirical analysis, Ohlsson disentangles two main types of grants for Swedish direct job creation measures: the estimated grants, which are the funds granted before the fiscal year and the
extended grants, which are the additional funds granted during the fiscal year. This distinction is
crucial as the estimated grants in Sweden must be neutral to the economic situation and must not aim mainly at reducing unemployment. In contrast, the extended grants are counter-cyclical.
The empirical results suggest that the funds granted before the fiscal year in the period 1971-1987 follow both the increasing labour force trends and unemployment variations. Consequently, there is both a passive and an activist policy rule. Concerning the funds granted during the fiscal year, Ohlsson finds an activist policy rule: unemployment is the main determinant of these additional grants.
Our study is directly inspired by Ohlsson’s model, in the sense that we consider labour market expenditure as a potential response to economic variations, and therefore we are particularly interested in the activist side of the policy rule. However, we do not focus on the political economy of labour market expenditure that is likely to be very heterogeneous across OECD countries.
2.2 Data
We use labour market expenditure as the dependent variable, expressed as a percentage of GDP for each country (see Figure A3 for expenditures detailed by country). We also consider more disaggregated categories, namely active and passive expenditure, as well as the nine sub-categories of the OECD classification.5 In addition to the labour market situation we want to check if labour market policy is dependent on fiscal situations in OECD countries. Indeed, as noticed earlier, the importance of the fiscal constraint in the definition of public policies has been increasing over the last 20 years. To account for this potential effect, we run estimations in which public debt (as a percentage of GDP) is introduced as an explanatory variable.
In both estimation steps we introduce the output gap and the working age population as control variables.6 All these data (labour market expenditure, unemployment, debt, output gap, working age population) come from OECD database.
To capture the specific effect of crisis years on labour market policy, we introduce specific time dummies, corresponding to the first recession period (the years 1992, 1993 and 1994) and to the
5
Public employment services and administration; training; job rotation and job sharing; employment incentives; supported employment and rehabilitation; direct job creation; start-up incentives; out-of-work maintenance and support; early retirement. The corresponding results are not detailed in the article, but are available on request.
6
The output gap refers to the difference between actual and potential gross domestic product (GDP) as a percentage of potential GDP. (OECD glossary of statistical terms, 2013)
second Great Recession (the years 2008, 2009 and 2010). We also study the interactions between recession years and unemployment levels, as well as public debt indicators. Hence, we have four interacting terms in our estimations: unemployment rate*crisis1, unemployment rate*crisis2, public debt*crisis1 and public debt*crisis2. These interacting terms allow us to focus on the impact of the two economic variables in the specific years of crisis.
In addition, we run a last specification introducing an interaction between unemployment and public debt, to test for the potential relationship between the cyclical reactivity of labour market policies and debt levels.
Finally we introduce country fixed effects to account for structural country heterogeneity in labour market policies and differences in the economic cycle.7
2.3 Econometric specification and methodology
This study uses time-series cross-section data for 24 OECD countries (Australia, Austria, Belgium, Canada, Czech Republic, Denmark, Finland, France, Germany, Hungary, Ireland, Japan, Luxembourg, Netherlands, New Zealand, Norway, Poland, Portugal, Slovakia, Spain, Switzerland, Sweden, United Kingdom and United States) over the period from 1985 to 2010. Table 1 provides descriptive statistics for the variables used in the regressions.
Table 1: Summary statistics
Variable Mean Std. Dev. Min. Max. N n
Labour market expenditure 2.043948 1.325861 .11 7.21 580 24 Active labour market
expenditure .7210517 .4884954 .1 3.04 580 24 Passive labour market
expenditure 1.303603 .9492559 0 5.45 594 24 Unemployment rate 7.240123 3.890374 .47 21.33333 567 24 Public debt 45.99185 27.82569 .821 183.53 556 24 Log-GDP 12.81653 1.392538 9.338929 16.39151 600 24 Working age population 22021.65 38866.04 256 207647.5 624 24
The aim of this article is to analyze the relationship between labour market policy and the labour market situation along with the budget situation. More specifically, we want to test the argument that this relationship might be different in times of crisis. We proceed in several steps.
In Model 1, we estimate the following relationship:
��� =��� +�1∗ ���−1+ ∑ �� ���+��+��+ ��� (3)
where Yit denotes the dependent variable capturing labour market expenditure, Uit the variable
capturing unemployment/the labour market situation, �i country fixed effects, �� time fixed effects,
ΣkXk,it a set of control variables and εit an error term.
7
We control for economic and demographic variables. First, to account for the differences in the economic cycle across countries and over time we use the output gap as a control variable. Second, in order to ensure that the effect of unemployment variations is not mechanical, we control for the size of the working-age population.
Our second step corresponds to the introduction of the fiscal constraint, Dit the variable measuring the
debt ratio (Model 2):
��� =��� +�1∗ ���−1+ �2∗ ���−1+ ∑ �� ���+��+��+ ��� (4)
In a third step we add the crises dummies (Model 3) to capture specific crisis effects:
��� =��� +�1∗ ���−1+ �2∗ ���−1+ �3∗ ������1 + �4∗ ������2 + ∑ �� ���+��+��+ ��� (5)
Fourth, we introduce interacting terms for both unemployment and debt levels in order to isolate the joint effects of the unemployment rate or debt on labour market expenditure during crisis episodes (Model 4: Aiken, West, 1991). To test the robustness of these results we have also run two different specifications, including one single interaction term in order to prevent multicollinearity. 8
��� =���+�1∗ ���−1+ �3∗ ���−1∗ ������1 + �4∗ ���−1∗ ������2 + �5∗ ���−1+�6∗ ���−1∗
������1 + �7∗ ���−1∗ ������2 + �8∗ ������1 + �9∗ ������2 + ∑ �� ���+��+��+ ��� (6)
Lastly we estimate a model introducing an interaction between debt and the unemployment rate (Model 7, without other interacting terms; and Model 8, including all the interactions). The aim of this specification is to study whether labour market policies’ reactivity to unemployment is influenced by the level of public debt.
��� =��� +�1∗ ���−1+ �2∗ ���−1+�3∗ ���−1∗ ���−1+��+��+ ��� (7)
��� =��� +�1∗ ���−1+ �2∗ ���−1+�3∗ ���−1∗ ���−1+�4∗ ���−1∗ ������1 + �5∗ ���−1∗
������2 + �6∗ ���−1∗ ������1 + �7∗ ���−1∗ ������2 + ��+��+ ��� (8)
To test the robustness of our specification, models introducing year dummies (and no time fixed effects) instead of crisis dummies have also been estimated. In the results, we focus on dummies corresponding to crisis years (especially 1993 and 2008), and on the interactions between recession years (especially 1993 and 2008) and unemployment levels, as well as public debt indicators. Results of these estimations are presented in the appendix (Tables A1 to A3).
2.4 OLS/PCSE estimations
We run OLS with PCSE (Panel corrected standard errors) estimator from Beck and Katz (1995) appropriate for time-series cross-section data (TSCS). Before running regressions, we run unit root tests to check whether our variables are stationary or not. Following Maddala and Wu (1999), we run a Fisher test which assumes that some series are non-stationary under the null hypothesis. We find that our variables in level terms are stationary. Because Time-Series-Cross-Section (TSCS) data have
8
repeated observations on fixed units, both the temporal and spatial properties of TSCS data make the use of ordinary least squares (OLS) problematic.
The OLS regression assumes homoskedasticity and independence of the errors. These specific hypotheses are not verified. As a result, we are able to use the ordinary least squares (OLS) with Beck and Katz’s (1995) panel corrected standard errors (PCSE). We also test for multicollinearity between our variables, but none of them are significantly correlated. Finally, we run a Wooldridge test for autocorrelation in panel-data models: we fail to reject the null hypothesis of no serial correlation, concluding that the data have first-order autocorrelation. We correct for this using the PCSE procedure.
Results with the PCSE estimator are shown in the following tables. We present the results for both the total labour market expenditure, as a dependent variable and for a more detailed level of labour market expenditure which distinguishes active and passive labour market expenditure. The three tables present the six specifications we detailed above for each type of labour market expenditure.
3. Results
3.1 Total labour market expenditure
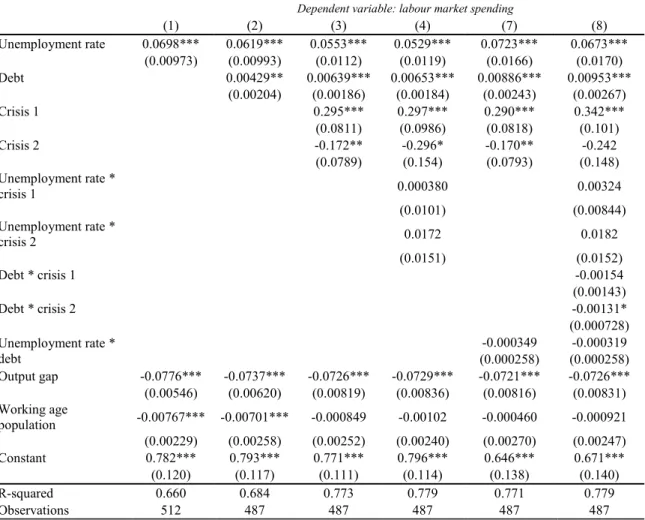
Table 2: PCSE estimation for total labour market expenditure – results of the models with crisis
dummies
Dependent variable: labour market spending
(1) (2) (3) (4) (7) (8) Unemployment rate 0.0698*** 0.0619*** 0.0553*** 0.0529*** 0.0723*** 0.0673*** (0.00973) (0.00993) (0.0112) (0.0119) (0.0166) (0.0170) Debt 0.00429** 0.00639*** 0.00653*** 0.00886*** 0.00953*** (0.00204) (0.00186) (0.00184) (0.00243) (0.00267) Crisis 1 0.295*** 0.297*** 0.290*** 0.342*** (0.0811) (0.0986) (0.0818) (0.101) Crisis 2 -0.172** -0.296* -0.170** -0.242 (0.0789) (0.154) (0.0793) (0.148) Unemployment rate * crisis 1 0.000380 0.00324 (0.0101) (0.00844) Unemployment rate * crisis 2 0.0172 0.0182 (0.0151) (0.0152) Debt * crisis 1 -0.00154 (0.00143) Debt * crisis 2 -0.00131* (0.000728) Unemployment rate * debt -0.000349 -0.000319 (0.000258) (0.000258) Output gap -0.0776*** -0.0737*** -0.0726*** -0.0729*** -0.0721*** -0.0726*** (0.00546) (0.00620) (0.00819) (0.00836) (0.00816) (0.00831) Working age population -0.00767*** -0.00701*** -0.000849 -0.00102 -0.000460 -0.000921 (0.00229) (0.00258) (0.00252) (0.00240) (0.00270) (0.00247) Constant 0.782*** 0.793*** 0.771*** 0.796*** 0.646*** 0.671*** (0.120) (0.117) (0.111) (0.114) (0.138) (0.140) R-squared 0.660 0.684 0.773 0.779 0.771 0.779 Observations 512 487 487 487 487 487
As expected, the PCSE estimator shows a positive correlation between unemployment and labour market expenditure over the period from1985 to 2010. Public debt also appears positively correlated with labour market policy expenditure, although the coefficients are very small. This means that over the long run, high LMP expenditures are associated with more expansionary budgetary policies. Given the negative sign of the output gap coefficients, we check that a positive output gap (indicating observed growth above the potential growth level) reduces expenditures, whereas negative values induce a rise in the LMP effort. Crisis dummies indicate a contrast between the 1990s crisis and the last recession (Model 3): the coefficients associated with the first crisis dummy are positive and significant, whereas they are negative (and most of the time significant) for the second one. This suggests that the crisis of early 1990s saw a larger impact on labour market expenditure than has been the case during the current crisis.
Besides, results for interactions (Model 4) indicate no significant relationship between unemployment and labour market expenditure in both recessions. These results indicate a low reactivity of total labour market spending to crises. The fiscal constraint does not seem to have been a main determinant of labour market policy expenditures in economic downturns (Model 8). Nevertheless it did become significantly negative (with a small coefficient) during the Great Recession, when the interaction between unemployment and debt is taken into account.
Finally, the analysis of country dummies reveals a strong heterogeneity across countries. Some countries display positive relationship to labour market policy expenditure over time (Austria, Denmark, Estonia, Finland, France, Ireland, Norway, the Netherlands, Slovakia, Slovenia), whereas others show a negative relationship (Canada, Hungary, Sweden and the UK)9.
9
3.2 Active and passive labour market expenditure
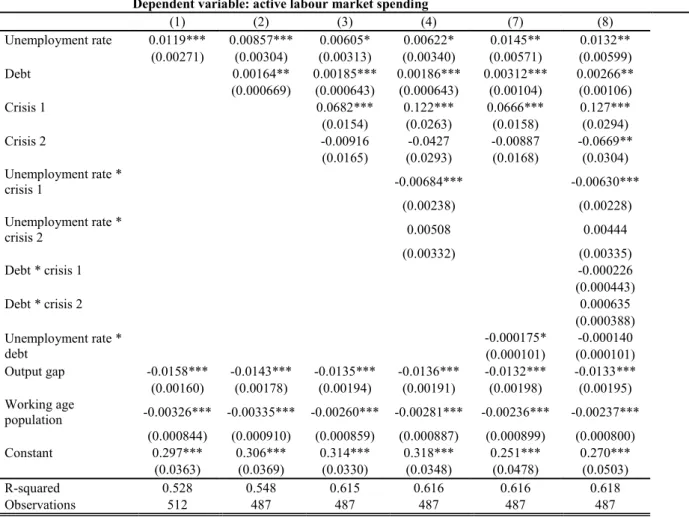
Table 3: PCSE estimation for active labour market expenditure: results of the models with crisis
dummies
Dependent variable: active labour market spending
(1) (2) (3) (4) (7) (8) Unemployment rate 0.0119*** 0.00857*** 0.00605* 0.00622* 0.0145** 0.0132** (0.00271) (0.00304) (0.00313) (0.00340) (0.00571) (0.00599) Debt 0.00164** 0.00185*** 0.00186*** 0.00312*** 0.00266** (0.000669) (0.000643) (0.000643) (0.00104) (0.00106) Crisis 1 0.0682*** 0.122*** 0.0666*** 0.127*** (0.0154) (0.0263) (0.0158) (0.0294) Crisis 2 -0.00916 -0.0427 -0.00887 -0.0669** (0.0165) (0.0293) (0.0168) (0.0304) Unemployment rate * crisis 1 -0.00684*** -0.00630*** (0.00238) (0.00228) Unemployment rate * crisis 2 0.00508 0.00444 (0.00332) (0.00335) Debt * crisis 1 -0.000226 (0.000443) Debt * crisis 2 0.000635 (0.000388) Unemployment rate * debt -0.000175* -0.000140 (0.000101) (0.000101) Output gap -0.0158*** -0.0143*** -0.0135*** -0.0136*** -0.0132*** -0.0133*** (0.00160) (0.00178) (0.00194) (0.00191) (0.00198) (0.00195) Working age population -0.00326*** -0.00335*** -0.00260*** -0.00281*** -0.00236*** -0.00237*** (0.000844) (0.000910) (0.000859) (0.000887) (0.000899) (0.000800) Constant 0.297*** 0.306*** 0.314*** 0.318*** 0.251*** 0.270*** (0.0363) (0.0369) (0.0330) (0.0348) (0.0478) (0.0503) R-squared 0.528 0.548 0.615 0.616 0.616 0.618 Observations 512 487 487 487 487 487
Note: Panel Corrected Standard errors in parentheses; * p < 0.10, ** p < 0.05, *** p < 0.01.
Active labour market expenditure is positively correlated with unemployment over the whole period of 1985 to 2010, in all specifications. However a positive and significant relationship (but with a very small coefficient) can also be found between public debt and active labour market expenditure in the long run. A positive coefficient is associated with the first crisis and a negative one with the second crisis – although it is not always significant.
When focusing on crisis episodes, the interactions with unemployment are negative for the first crisis, but not significant for the second one. As far as public debt is concerned, it seems to be positively correlated to ALMP during the late-2000s recession, although not significantly. These results reveal a contrast between the two recessions, with active policies potentially having priority in countries where public debt has been high over the recent years of recession. Nevertheless, crossed effects between unemployment and debt are significant only in one specification (Model 7).
Country fixed effects are generally positive with small coefficients (but higher for Denmark and Slovenia), and the only country with a negative and significant country dummy is the UK. The
decomposition of active expenditures by different categories confirms the general picture:10 job creation programmes, in the public and private sector (job subsidies) are positively correlated with unemployment over the whole period, and their reaction to unemployment was positive during the first crisis, whereas we find a negative sign for the interacting term during the second crisis. In fact, the second crisis is found to exert a positive influence on job search assistance expenditures.
Table 4: PCSE estimation for passive labour market expenditure – results of the models with crisis
dummies
Dependent variable: passive labour market spending
(1) (2) (3) (4) (7) (8) Unemployment rate 0.0562*** 0.0527*** 0.0540*** 0.0511*** 0.0573*** 0.0553*** (0.0108) (0.0114) (0.0119) (0.0120) (0.0171) (0.0169) Debt 0.00229 0.00467*** 0.00458*** 0.00515** 0.00654** (0.00192) (0.00159) (0.00159) (0.00236) (0.00266) Crisis 1 0.241*** 0.184* 0.239*** 0.226** (0.0723) (0.0960) (0.0724) (0.0978) Crisis 2 -0.177** -0.235 -0.176** -0.170 (0.0817) (0.145) (0.0817) (0.147) Unemployment rate * crisis 1 0.00718 0.00957 (0.0115) (0.0103) Unemployment rate * crisis 2 0.00917 0.0130 (0.0179) (0.0176) Debt * crisis 1 -0.00130 (0.00103) Debt * crisis 2 -0.00216*** (0.000759) Unemployment rate * debt -7.01e-05 -0.000116 (0.000282) (0.000291) Output gap -0.0615*** -0.0591*** -0.0586*** -0.0586*** -0.0585*** -0.0588*** (0.00725) (0.00790) (0.00917) (0.00931) (0.00917) (0.00930) Working age population -0.00443 -0.00385 0.00230 0.00197 0.00235 0.00173 (0.00784) (0.00798) (0.00653) (0.00669) (0.00661) (0.00653) Constant 0.496*** 0.496*** 0.415*** 0.441*** 0.392** 0.385** (0.157) (0.154) (0.125) (0.124) (0.153) (0.151) R-squared 0.611 0.630 0.752 0.751 0.751 0.755 Observations 526 501 501 501 501 501
Note: Panel Corrected Standard errors in parentheses; * p < 0.10, ** p < 0.05, *** p < 0.01.
As expected, the PCSE estimator shows a positive correlation between unemployment and passive labour market expenditure that consists mainly of unemployment benefits (and some early retirement programmes, especially in the 1980s). We also find robust evidence that public debt is positively correlated with passive labour market expenditure (with a small coefficient again). Nevertheless, contrary to the first crisis (positive and significant dummy), the recent downturn (2007 to 2010) is either not significantly or negatively related to passive expenditures in comparison to the whole period.
Moreover, the results for interaction terms indicate no significant relationship between unemployment and passive labour market expenditure during recessions. For public debt, interaction terms are not significant in the 1990s, and negative (and significant) at the end of 2000s. The result is therefore the opposite of the one obtained for ALMP, confirming that debt influences the labour market policy mix
10
and the choice between active and passive programmes. Country fixed effects are positive for Austria, Denmark, Estonia, Finland, France, Ireland, Norway, Slovenia and Slovakia, and negative for Canada, Hungary, Poland, the UK and Sweden.
To summarize, a first result is that labour market policy has been correlated with unemployment over the whole period of observation, and this relationship comes mainly from passive expenditures (according to marginal effects, see Table 5). This relationship is stable whatever the specification of the model, and even when interactions between debt and unemployment are taken into account (Model 6).
Table 5: Marginal effects of unemployment (Model 6)
Marginal effect of unemployment according to the dependent variables (1) (2) (3) Total labour market expenditure Active labour market expenditure Passive labour market expenditure Min 0.0945*** 0.0119** 0.0810*** (0.0138) (0.00552) (0.0155) Mean less one
standard deviation 0.0817*** 0.0104** 0.0715*** (0.0111) (0.00425) (0.0129) Mean 0.0611*** 0.00780** 0.0554*** (0.00919) (0.00337) (0.0110) Mean plus one
standard deviation 0.0405*** 0.00524 0.0393*** (0.0112) (0.00461) (0.0132) Max -0.0388 -0.00461 -0.0230 (0.0321) (0.0146) (0.0365) Rank 2 0.738 0.753 Observations 487 487 501
Note: Panel Corrected Standard errors in parentheses; * p < 0.10, ** p <
0.05, *** p < 0.01.
Second, both types of expenditures are positively related to public debt levels: budget constraints do not seem to displace labour market policies, but would surprisingly (slightly) increase them. This effect might be related to the inertia of these expenditures (they are socially difficult to reduce) and to the fact that such policies could sustain the goal of increased labour market efficiency in a context of rising public deficits.
During years of recession, policy reactions to unemployment have been limited, with the exception of a decrease in ALMP for a given level of unemployment during the first crisis. Public did not exert any significant influence in the 1990s, but reduced passive expenditures and increased active spending in the 2000s. Budget pressure has not led to cuts in overall labour market expenditure, but seems to influence the policy mix between active and passive measures.
Conclusion
Labour market policy expenditure has decreased in the long run as labour market policies have undergone major reforms for two decades. These reforms appear to influence the reactivity of labour market expenditure to the economic cycle.
The empirical results point out the positive relationship between unemployment and all types of labour market expenditure over the last 30 years. Thus labour market policy appears to react well to the economic situation in the long run. The relationship between overall labour market expenditure and unemployment is however not specific in times of crises, and we can attest that the importance of the economic situation in the response function of labour market expenditure is decreasing with time. The response to crises did nevertheless clearly change between the early 1990s crisis and the recent “Great Recession”. First, labour market policy was less expansionary during the 2008-2010 downturn. Second, while in the long run, the budget constraint is significantly and positively correlated with labour market expenditure, it seems rather to influence the policy mix during the most recent crisis (decreasing passive labour market policy and increasing active labour market policy). Therefore, both the reforms undertaken since the 1990s and the debt crisis matter for labour market policy, while its counter-cyclical function has been weakened. In contrast, very high levels of unemployment in the European Union might suggest stronger intervention focusing on job creation (Grahl and Teague, 2013).
Our results indicate a strong heterogeneity across countries. Some restrictive trends can be found in some Anglo-Saxon countries (Canada, UK), but also in Sweden, whereas a number of recent policies might indicate a change in priorities in some countries towards a more expansionary LMP (such as the increase in job creation programmes in France). But restrictions are getting stronger in Southern European and Baltic countries (Estonia has for instance launched an important labour market reform in 2009 that strengthen labour market flexibility (Eamets, 2013)).
Bibliography
Aiginger K., Horvath T., Mahringer H. (2012), “Why Labor Market Response Differed In The Great Recession: The Impact Of Institutions And Policy”, DANUBE Law and Economics Review 3.
Aiken, L. S., West, S. G. (1991). Multiple regression: Testing and interpreting interactions. Newbury Park, London, Sage.
Anxo D., Niklasson H. (2006), “The Swedish model in turbulent times”, International Labour Review, vol 145, n°4, pp. 339–371.
Beck, N., Katz, J.N. (1995), “What To Do (and Not To Do) with Times-Series-Cross-Section Data in Comparative Politics”, American Political Science Review, 89(3), 634-647.
Blanchard O., Perotti R. (2002), "An Empirical Investigation of the Dynamic Effects of Shocks to Government Spending and Taxes on Output", Quarterly Journal of Economics.
Bonoli G. (2012), “The postindustrial employment problem and active labour market policy”, 10th ESPAnet annual conference, Edinburgh, 6-8 September 2012.
Cazes S., Verik S., Heuer C. (2009), “Labour market policies in times of crisis”, Employment working
paper n° 35, ILO.
Cochard M., Cornilleau G. et Heyer E. (2010), « Les marchés du travail dans la crise », revue de l’OFCE, n° 113, avril.
COE (2012), L’emploi et les politiques de l’emploi depuis la crise : une approche internationale, rapport, mai 2012.
Eamets R. (2013), “Labour Market and Labour Market Policies during the Great Recession: the case of Estonia”, IZA Policy Paper No. 60.
EEO (2009), European Employment Observatory Quarterly reports: Executive summary, June 2009.
http://www.eu-employment-observatory.net/en/documents/
EEO, (2010), Quarterly report executive summary, March 2010.
Erhel C., Levionnois C. (2013), « Les politiques de l’emploi et la « Grande Dépression » du XXIe Siècle », in CEE, L’emploi en crise, Liaisons Sociales, May 2013.
Esping-Andersen G. (1990), The three worlds of welfare capitalism, Princeton University Press
Forslund A., Fredriksson P., Vikström J. (2011), “What active labor market policy works in a recession?”, IFAU working paper 2011:2.
Grahl J., Teague P. (2013), “Reconstructing the Eurozone: the role of EU social policy”, Cambridge
Journal of Economics, 37, 677-691.
Howell D. R., Azizoglu B. M. (2011), “Unemployment Benefits and Work Incentives: The U.S. Labor
Layard R., Nickell S., Jackman R. (1991), Unemployment, Oxford University Press (New edition 2005).
Lehndorff S. (2012), A triumph of failed ideas: European models of capitalism in the crisis, ETUI, Brussels.
Levionnois C. (2012), « Les réactions des politiques de l’emploi à la crise, comparaison européenne et historique », mémoire de Master PPD 2012, Paris School of Economics.
Maddala J.S., Wu S. (1999), “A Comparative Study of Unit Root Tests with Panel Data and a New Simple Test”, Oxford Bulletin of Economics and Statistics, 61, p. 631-652.
Möller J. (2010), “The German labor market response in the world recession – de-mystifying a miracle”, Zeitschrift für ArbeitsmarktForschung - Journal for Labour Market Research, Institut für Arbeitsmarkt- und Berufsforschung (IAB), Nürnberg, vol. 42(4), pages 325-336.
OECD (2007) “Activating the unemployed: what countries do”, OECD Employment outlook, 207-241. OECD (2012) OECD Employment outlook, chapter 1, box pages 44-45.
Ohlsson H. (1992), “Job Creation Measures as Activist Fiscal Policy –An Empirical Analysis of Policy Reaction Behavior”, European Journal of Political Economy 8, p.269-280.
Rinne U., Zimmermann K.F. (2013), “Is Germany the North Star of Labor Market Policy?”, IZA DP No. 7260, March.
Schmitt J. (2011), Labour Market Policy in the Great Recession: Some Lessons from Denmark and
Germany, CEPR, May 2011.
Taylor, J. B. (1993), “Discretion versus Policy Rules in Practice”, Carnegie-Rochester Conference
Appendix: additional figures
Figure A1: Ratio between active labour market policies (as a percentage of GDP) and the number of
unemployed
Source: OCDE, 2012, authors’ calculations.
0 5 10 15 20 25 30 35 40 45 50
Belgium Denmark France
Germany Ireland Netherlands
Spain Sweden United Kingdom
Figure A2: Evolution in the unemployment rate in 24 OECD countries, between 1985 and 2010 Source: OCDE, 2012. 0 5 10 15 20 0 5 10 15 20 0 5 10 15 20 0 5 10 15 20 0 5 10 15 20 1980 1990 2000 2010 1980 1990 2000 2010 1980 1990 2000 2010 1980 1990 2000 2010 1980 1990 2000 2010
Australia Austria Belgium Canada Czech Republic
Denmark Finland France Germany Hungary
Ireland Japan Luxembourg Netherlands New Zealand
Norway Poland Portugal Slovakia Spain
Sweden Switzerland United Kingdom United States
U ne m pl oy m e nt r at e year Graphs by country
Figure A3: Labour market expenditures in 24 OECD countries, between 1985 and 2010 Source: OCDE, 2012 0 2 4 6 8 0 2 4 6 8 0 2 4 6 8 0 2 4 6 8 0 2 4 6 8 1980 1990 2000 2010 1980 1990 2000 2010 1980 1990 2000 2010 1980 1990 2000 2010 1980 1990 2000 2010
Australia Austria Belgium Canada Czech Republic
Denmark Finland France Germany Hungary
Ireland Japan Luxembourg Netherlands New Zealand
Norway Poland Portugal Slovakia Spain
Sweden Switzerland United Kingdom United States
La bo ur m ar k e t s p en di ng year Graphs by country
Table A1. PCSE estimation for total labour market expenditure
Dependent variable: labour market spending
(1) (2) (3) (4) (5) (6) (7) Unemployment rate 0.0731*** 0.0607*** 0.0616*** 0.0602*** 0.0610*** 0.0382*** 0.0409*** (0.00880) (0.00926) (0.00925) (0.00928) (0.00927) (0.0116) (0.0113) Debt 0.00671*** 0.00683*** 0.00680*** 0.00694*** 0.00129 0.00158 (0.00172) (0.00169) (0.00173) (0.00169) (0.00247) (0.00246) 1993 0.682*** 0.666*** 0.612*** 0.706*** 0.650*** 0.664*** 0.669*** (0.0729) (0.0780) (0.0924) (0.0821) (0.0968) (0.106) (0.0848) 2008 -0.360*** -0.407*** -0.555*** -0.430*** -0.582*** -0.568*** -0.367*** (0.0906) (0.0983) (0.124) (0.0997) (0.123) (0.142) (0.110) Unemployment rate * 1993 0.00549 0.00724 0.00738 (0.00578) (0.00555) (0.00518) Unemployment rate * 2008 0.0226* 0.0228* 0.0252* (0.0131) (0.0131) (0.0151) Debt * 1993 -0.000905 -0.00119 -0.00150* (0.000883) (0.000917) (0.000891) Debt * 2008 0.000527* 0.000553* 0.000871** (0.000300) (0.000297) (0.000380) Unemployment rate * debt 0.000727*** 0.000649*** (0.000190) (0.000185) Output gap -0.0619*** -0.0547*** -0.0562*** -0.0554*** -0.0570*** -0.0488*** -0.0470*** (0.00705) (0.00676) (0.00697) (0.00677) (0.00696) (0.00695) (0.00673) Working age population 0.00785 0.00987* 0.0105** 0.00996* 0.0106** 0.00834 0.00773
(0.00546) (0.00576) (0.00533) (0.00572) (0.00527) (0.00551) (0.00603) Constant 0.616*** 0.664*** 0.657*** 0.665*** 0.658*** 0.839*** 0.822*** (0.0917) (0.0965) (0.0931) (0.0963) (0.0929) (0.108) (0.110) R-squared 0.721 0.738 0.756 0.739 0.758 0.761 0.740 Observations 512 487 487 487 487 487 487
Table A2. PCSE estimation for active labour market expenditure
Dependent variable: active labour market spending
(1) (2) (3) (4) (5) (6) (7) Unemployment rate 0.0101*** 0.00775** 0.00791** 0.00791** 0.00810** 0.0130*** 0.0125*** (0.00273) (0.00337) (0.00337) (0.00339) (0.00339) (0.00428) (0.00422) Debt 0.00163*** 0.00157** 0.00161** 0.00155** 0.00277*** 0.00281*** (0.000628) (0.000630) (0.000630) (0.000631) (0.000910) (0.000909) 1993 0.211*** 0.225*** 0.243*** 0.210*** 0.229*** 0.225*** 0.224*** (0.0149) (0.0223) (0.0311) (0.0290) (0.0349) (0.0338) (0.0213) 2008 0.0302 0.0353 -0.00629 0.0413 -7.50e-05 -0.00291 0.0265 (0.0201) (0.0297) (0.0358) (0.0323) (0.0395) (0.0366) (0.0291) Unemployment rate * 1993 -0.00245 -0.00310 -0.00313 (0.00215) (0.00212) (0.00222) Unemployment rate * 2008 0.00672* 0.00664* 0.00613* (0.00380) (0.00381) (0.00333) Debt * 1993 0.000338 0.000442 0.000511 (0.000453) (0.000454) (0.000449) Debt * 2008 -0.000139 -0.000132 -0.000201 (0.000288) (0.000286) (0.000309) Unemployment rate * debt -0.000157* -0.000151* (8.09e-05) (8.04e-05) Output gap -0.00900*** -0.00580** -0.00631** -0.00556** -0.00604** -0.00781*** -0.00759*** (0.00238) (0.00247) (0.00254) (0.00248) (0.00255) (0.00251) (0.00246) Working age population -0.00387** -0.00391* -0.00391* -0.00393* -0.00393* -0.00343 -0.00343 (0.00184) (0.00213) (0.00211) (0.00214) (0.00213) (0.00211) (0.00211) Constant 0.243*** 0.245*** 0.244*** 0.244*** 0.244*** 0.205*** 0.207*** (0.0371) (0.0381) (0.0380) (0.0382) (0.0381) (0.0430) (0.0428) R-squared 0.587 0.617 0.619 0.617 0.619 0.621 0.619 Observations 512 487 487 487 487 487 487
Table A3. PCSE estimation for passive labour market expenditure
Dependent variable: passive labour market spending
(1) (2) (3) (4) (5) (6) (7) Unemployment rate 0.0667*** 0.0545*** 0.0554*** 0.0538*** 0.0548*** 0.0254** 0.0283** (0.0102) (0.0110) (0.0109) (0.0110) (0.0109) (0.0116) (0.0119) Debt 0.00555*** 0.00568*** 0.00567*** 0.00582*** -0.00108 -0.000899 (0.00167) (0.00160) (0.00159) (0.00153) (0.00216) (0.00229) 1993 0.468*** 0.428*** 0.356*** 0.481*** 0.407*** 0.424*** 0.431*** (0.0637) (0.0743) (0.108) (0.0740) (0.109) (0.0990) (0.0730) 2008 -0.387*** -0.455*** -0.551*** -0.484*** -0.572*** -0.562*** -0.410*** (0.0754) (0.0834) (0.103) (0.0850) (0.0977) (0.100) (0.0840) Unemployment rate * 1993 0.00804 0.0104 0.0107 (0.0118) (0.0116) (0.0107) Unemployment rate * 2008 0.0156 0.0149 0.0181 (0.0114) (0.0119) (0.0118) Debt * 1993 -0.00123 -0.00162** -0.00203*** (0.000778) (0.000701) (0.000569) Debt * 2008 0.000721 0.000609 0.00103* (0.000451) (0.000508) (0.000609) Unemployment rate * debt 0.000903*** 0.000827*** (0.000212) (0.000208) Output gap -0.0521*** -0.0484*** -0.0496*** -0.0494*** -0.0507*** -0.0407*** -0.0386*** (0.00713) (0.00745) (0.00774) (0.00752) (0.00781) (0.00738) (0.00711) Working age population 0.0121 0.0146* 0.0150* 0.0147* 0.0151* 0.0124 0.0119 (0.00828) (0.00886) (0.00844) (0.00892) (0.00840) (0.00805) (0.00858) Constant 0.343*** 0.406*** 0.398*** 0.408*** 0.398*** 0.629*** 0.614*** (0.118) (0.126) (0.123) (0.127) (0.123) (0.126) (0.129) R-squared 0.724 0.738 0.753 0.739 0.756 0.767 0.745 Observations 526 501 501 501 501 501 501