HAL Id: hal-00695634
https://hal.archives-ouvertes.fr/hal-00695634
Submitted on 9 May 2012
HAL is a multi-disciplinary open access
archive for the deposit and dissemination of sci-entific research documents, whether they are pub-lished or not. The documents may come from teaching and research institutions in France or abroad, or from public or private research centers.
L’archive ouverte pluridisciplinaire HAL, est destinée au dépôt et à la diffusion de documents scientifiques de niveau recherche, publiés ou non, émanant des établissements d’enseignement et de recherche français ou étrangers, des laboratoires publics ou privés.
silica films: pore size and ortho-positronium escape
L. Liszkay, F. Guillemot, C. Corbel, J.P. Boilot, T. Gacoin, E. Barthel, A.
Pérez, M.F. Barthe, P. Desgardin, P. Crivelli, et al.
To cite this version:
L. Liszkay, F. Guillemot, C. Corbel, J.P. Boilot, T. Gacoin, et al.. Positron annihilation in latex templated macroporous silica films: pore size and ortho-positronium escape. New Journal of Physics, Institute of Physics: Open Access Journals, 2012, 14, pp.065009. �10.1088/1367-2630/14/6/065009�. �hal-00695634�
macroporous silica films: pore size and
ortho-positronium escape
L Liszkay1, F Guillemot2‡, C Corbel3, J-P Boilot2, T. Gacoin2, E Barthel4, P P´erez1, M-F Barthe5, P Desgardin5, P Crivelli6, U Gendotti6 and A Rubbia6
1CEA, Irfu, Centre de Saclay, F-91191 Gif-sur-Yvette, France
2Groupe de Chimie du Solide, Laboratoire de Physique de la Matiere Condens´ee,
UMR CNRS 7643, ´Ecole Polytechnique, 91128 Palaiseau, France
3Laboratoire des Solides Irradi´es, ´Ecole Polytechnique, 91128 Palaiseau, France 4Surface du Verre et Interfaces (CNRS/Saint-Gobain) UMR 125, 39 quai Lucien
Lefranc, 93303 Aubervilliers, France
5CNRS, UPR3079 CEMHTI, 3A rue de la F´erollerie 45071 Orl´eans Cedex 2, France 6Institute for Particle Physics, ETH Zurich, 8093 Zurich, Switzerland
E-mail: laszlo.liszkay@cea.fr
Abstract. Depth profiling of positron annihilation characteristics has been used to investigate the pore size distribution in macroporous PMMA latex templated SiO2
films deposited on glass or Si and prepared with 11-70% porosity. The correlation between the annihilation characteristics shows that o-Ps escape (re-emission) into vacuum occurs in all films with a porosity threshold that is pore size dependent. For 60± 2% porosity, the o-Ps reemission yield decreases from ∼ 0.25 to ∼ 0.11 as the pore size increases from 32 to 75 nm. The o-Ps reemission yield is shown to vary linearly with the specific surface area per mass unit and the slope is independent of pore size, 9.1±0.4 g cm−1. For 32 nm pores, the o-Ps annihilation lifetimes in the films, 17(2)ns and 106(5) ns, show that o-Ps annihilates from micropores with small effective size (1.4± 4 nm) and from macropores with large effective size (∼ 32 nm). Above the porosity threshold, the o-Ps-escape model predicts the annihilation lifetime in the films to be 19± 2 ns. Our results imply that o-Ps efficiently detects the microporosity present in the silica walls. At low porosity, its capture into the micropores competes with its capture into the macropores. At higher porosity (when the distance between micropores and macropores become small), this capture into the micropores assists the capture into the macropores.
PACS numbers: 78.70.Bj, 61.43.Gt, 41.75.Fr, 36.10.Dr,
Submitted to: New J. Phys.
1. Introduction
Porous silica exists in many different forms with a large variety of pore size and distribution. The pore size can extend from sub-nanometer channels in pure silica zeolites throug mesopores of a few nanometers diameter to macropores of 50-100 nm diameter. As it is known since the early studies of Paulin and Abrosino on silica nanopowders (fumed silica) [1], positron implantation in silica results in an abundant production of positronium (Ps), a bound positron-electron pair, that can escape from silica into vacuum.
Positron and positronium have been extensively used to probe various properties of condensed materials [2, 3, 4, 5]. Ps is formed for 25% in the antiparallel spin singlet state, para-positronium (p-Ps), and for 75% in the spin triplet state, ortho-positronium (o-Ps). In vacuum, Ps self-annihilates with the emission of two gamma photons of∼ 511 keV for the p-Ps state and of three gamma photons with a continuous energy distribution from 0 to 511 keV for the o-Ps state. The lifetimes in the ground state are 125 ps for p-Ps and, about three orders of magnitude longer, 142 ns for o-Ps. In matter, the interaction with electrons modifies the Ps states and reduces their lifetimes. The pick-off process, where annihilation takes place with an electron of the medium converts efficiently spin triplet into spin singlet, which quenches the o-Ps lifetime to lower values than 142 ns and reduces the three gamma annihilation mode. The lifetime depends on the electronic density and can be reduced to values as low as 0.3-1 ns. Vacancy–type defects, such as cavities or pores can capture Ps. This process gives rise to long lifetimes that, for a given material, depend on the pore size and pore surface chemistry. Calculations show that the lifetime increases with the pore size. The comparison between calculated and measured lifetime can be used to determine an effective size for the pores that localize Ps [6, 7, 8, 9, 10, 11].
Various slow positron beam-based spectroscopic methods can be used to investigate Ps annihilation in porous materials. The large variety of pore structures available in porous silica with well controlled pore size and symmetry provides a unique opportunity to study the positronium behaviour in pores. Various authors have reported such studies in mesoporous silica films with approximately 2-8 nm pores. A number of authors have observed that the porosity of the mesoporous silica films affects the re-emission ( i. e., escape) of positronium into vacuum [12, 13, 14, 15, 16, 17, 18, 19, 20, 21, 22]. Some of them have systematically investigated Ps escape as a function of porosity and have given evidence of the existence of a porosity threshold for o-Ps escape [23, 24, 21]. Recently, the formation of the Ps2 molecule [25], the effect of the quantum confinement of Ps
[26, 27, 28], Ps-Ps interactions [29, 30] and pore cavity–induced shift of the Ps Lyman-α transition [31] have also been investigated in mesoporous silica films.
To date, there is a lack of study concerning macroporous silica films with pores larger than 10 nm diameter. Such films are of potential interest for optical applications that require coatings with tunable and low refraction index [32, 33]. Compared to nanoporous silica films, macroporous silica films have the advantage to be much less
prone to capillary condensation of atmospheric water. Another applications are the production of positronium target clouds suitable for interaction with antiproton pulses in a next generation of antimatter experiments [34, 35] and improvement in the precision of Ps atomic level spectroscopy measurements [36]. One question is whether macroporous films can reemit o-Ps with efficiency as high as found in mesoporous silica films where o-Ps escape yield can reach more than 40%, depending on the film porosity [20].
In a set of silica films systematically prepared on glass or silicon using PMMA latex spheres (31-75 nm) as sacrificial templates, Guillemot et al [32, 33] have shown that it is possible to control extrinsic porosity for which they determined the following properties. The pore size distribution is sharp and centered at pore size 31, 32, 51 or 75 nm depending on the film [32]. The pores are homogeneously dispersed in the film volume and the distribution is disordered [32]. Furthermore, Guillemot et al performed ellipsometry-porosimetry based on ethanol vapor sorption in the films. For any pore size, the specific surface area per volume unit (σv) thus determined exhibits a steep
transition as porosity increases at values > 40− 55%. Below this threshold, σv is much lower than expected from the macropore size and associated porosity. Above, σv varies
quasi linearly and has a value about 1.7 higher than expected on the basis of geometrical model assuming spherical pores.
Similar batches to those in [32] of macroporous PMMA-templated silica films deposited on glass or Si are used here to investigate the depth dependence of positron lifetime spectra and/or 2γ and 3γ annihilation mode fractions. In addition, the effect of 900◦C annealing is investigated. For the films prepared with deposition on Si, the characterization of the porosity has been performed before 900◦C annealing as described in [32]. However, the ellipsometry based methods described in [32] fail to work in PMMA- template films deposited on glass. The optical contrast between the layer and the substrate is then too low for a reliable application of such methods.
As earlier described for mesoporous silica films [20, 21, 22] a unique lifetime spectrometer in-line on a (1-6 keV) positron beam (IRFU-ETHZ) was used to perform the lifetime measurements for one batch of PMMA- templated 32 nm pore size SiO2
films deposited on glass. The equipment records o-Ps annihilation decay both inside and outside of the film. The advantage of this equipment is that it allows a unique and reliable determination of the yield for o-Ps escape and annihilation lifetimes of the pores that reemit Ps. Energy spectroscopy of the annihilation gamma is used to determine the fractions of 2γ and/or 3γ annihilation mode in all other PMMA films on Si. The equipment is mounted in-line on a continuous (CEMHTI) slow positron beam. The depth dependence is investigated by varying the positron implantation energy in the range 0.5-15.5 keV.
The present work gives evidence that a porosity threshold for Ps reemission, at 57 < p(%) < 62, exists in the 32 nm films deposited on glass or Si. The o-Ps reemission yield is as high as 23(1)% at 62% porosity. Below this threshold, the annihilation lifetimes in the films give evidence that two kinds of pore distribution compete for capturing o-Ps. One type corresponds to micropores with small effective sizes (1.4± 0.4
nm). The other one corresponds to macropores with large effective sizes (∼ 32 nm). The smaller size is in agreement with the microporosity (< 2 nm) expected in the silica walls on the basis of FTIR measurements in [32] conducted on films deposited on Si. It follows that both the intrinsic microporosity in the silica walls and the extrinsic macroporosity between the silica walls are detected by o-Ps in the 32 nm films deposited on glass. For the larger pore size (51 and 75 nm), it is shown how to correlate the annihilation fractions in the films for the 3γ and 2γ modes to get evidence that o-Ps re-emission is triggered at porosity 52(1) < p(%) < 56(1). Above the o-Ps escape threshold, the 3γ annihilation mode is found to be proportional to the specific surface area of the pore distribution with a constant independent of the pore size.
The paper is organized as follows. After the Introduction in section 1, the experimental details are given in section 2. Section 3 presents the energy dependence of the positron annihilation measurements and their analysis. Section 4 introduces the positron and positronium quantum states that give rise to the annihilation characteristics and discusses their depth dependence. Section 5 examines how the pore size and/or porous volume - determined on ellipsometry based methods in films deposited on Si as in [32]- affects the Ps annihilation characteristics. Finally, section 6 demonstrates that via o-Ps annihilation lifetime and escape, positron annihilation spectroscopy yields novel information on both intrinsic and extrinsic porosity in the PMMA films deposited on glass.
2. Experimental details
Section 2 deals with experimental aspects. This section describes the positron spectroscopic techniques based on positron beam implantation that are used to obtain the data presented in Section 3. The basic properties of positron and positronium physics necessary for the interpretation of the data are introduced in Section 4.
For films on Si substrates (section 2.1), the pore structure is well characterized using ellipsometry related methods as described in [32]. Films on glass are not suitable for such characterization. Section 2.2 describes the energy spectroscopy of the annihilation gamma photons (0-511keV) that is used to investigate how the 2γ and the o-Ps 3γ annihilation mode change with the pore size and porous fraction in the films on Si. Section 2.2 introduces the o-Ps lifetime and reemission spectroscopy used in the present work as an alternative method for investigating the pore size distribution in films on glass. As earlier shown for mesoporous silica films [20, 21, 22], this spectroscopy is a unique tool for investigating o-Ps annihilation decay both inside and outside of the films. It yields information on the size of the pores that capture Ps and, via the o-Ps 3γ annihilation lifetime, on the pore capacity to reemit (or not) Ps into vacuum.
2.1. Macroporous PMMA-templated SiO2 films: preparation and properties
As described in [32], the porous PMMA latex templated silica films have been prepared by sol-gel method using PMMA latex nanoparticles of 31-32, 51 and 75 nm diameter as sacrificial templates with the porosity (i. e porous fraction in the films) in the range 11-70%. As many as 57 different porous films were measured by positron annihilation among which there were 25, 16 and 16 prepared with 31-32 nm, 51 and 75 nm pore diameter, respectively. The full width at half-maximum of the size distribution of the latex nanoparticles determined by dynamic light scattering (DLS) was less than 10 nm for all the three pore size distributions [32, 33]. The thin films were deposited on silicon or glass surface by spin coating. In the following we use the SiO2(d, Φ)/substrate
designation for a porous film of d (nm) pore size and Φ(%) porosity, deposited on a given substrate. From the 31-32 nm films, three sample sets were prepared. The same sol with varying porosity was deposited on silicon or glass in Batch 1 (SiO2(32nm, Φ)/glass
and SiO2(32 nm,Φ)/Si) while Batch 2 was prepared from a different sol and deposited
on silicon (SiO2(31 nm,Φ)/Si). The templates were removed by heating the films at
450◦C in air. In addition, for each pore size, a set of films with varying porosity was heated to 900◦C after preparation. The thickness, pore size and porous fraction were determined for each film preparation before 900◦C annealing using spectroscopic ellipsometry as described in [32]. As shown for several batches of films prepared in various conditions in [32, 33], the pore size distribution in the films, as experimentally determined on the basis of spectroscopic ellipsometry, and that of the sacrificial latex nanoparticles, as experimentally determined from dynamic light scattering, are the same. Other characterisations such as SEM ellipsometry-porosimetry and FTIR are expected to give similar results in these films as those obtained in [32] since the films are prepared in the same conditions. SEM pictures in [32] show clearly the disordered distribution of the pores. In addition, for 32 and 77 nm pore size, the mean thickness of the silica walls between the pores seen in the SEM pictures significantly decreases with porosity increasing from 0.34 to 0.70(6). Furthermore, the SEM pictures clearly show that for porosity values 0.34(1) and 0.46(2), the mean thickness of the walls increases with pore size. On the basis of spectroscopic ellipsometry [32] and using the density of dense fused silica, 2.2 g cm−3 for the SiO2 silica network in the walls between the extrinsic pores,
the porosity in the films varies in the range 0.11-0.71 depending on their preparation. This corresponds to a set of films where the density varies from 0.63-1.95 g cm−3 and the refractive index in the range 1.1 to 1.45 [32, 33].
In addition to the extrinsic porosity controlled by tuning the film preparation, there is also an intrinsic microporosity in the sol-gel silica walls that is less easy to control. From the porosity dependence of the refractive index, it seems that the contribution of the microporosity in the PMMA-templated films remains almost constant as more extrinsic porosity is introduced by increasing the fraction of sacrificial PMMA particles in the films. An interesting property of the microporosity in the films is reported in [32]. In contrast with the intrinsic microporosity (pore size < 2 nm), in a CTAB-templated
mesoporous silica (4 nm pore size), the partial pressure dependence of ethanol adsorption isotherms shows that ethanol capillary condensation is absent in the PMMA-templated films. This result suggests that micropores are not detected by this method. It is mentioned in [32] that FTIR experiments performed in films shows that curing the films at increasing temperature up to 450◦C results in a progressive decrease of the intensity for the Si-OH stretching band (950 cm−1) and for the hydroxyl stretching band (3000 cm−1). However, there is still a fraction of silanol groups remaining after heating at 450◦C, suggesting that a few percent of microporosity subsists in the silica walls.
For some films on Si, annealing is performed at 900◦C with 5◦C/min heating rate. The 900◦C heating is followed by a slow quenching stage where the film/Si samples are directly taken out of the oven and then let cool down at room temperature. The ellipsometric data (thickness, porous fraction) that have been determined for films on Si with big pores ( > 50 nm) as well as the morphology of the films as observed using SEM keep constant up to 900◦C annealing [33]. After heating at 1000◦C, the complete collapse of the porous structure and the oxidation of the silicon substrates are observed.
2.2. Positron annihilation measurements
The SiO2/glass or SiO2/Si films were re-heated at 450◦C with 1◦C/min heating rate a
few minutes before mounting in the vacuum chamber of the positron spectrometers. Our earlier studies on mesoporous films have indeed shown that re-heating such porous silica films is necessary for improving the reproducibility of the positron measurements. This is probably due to the removal of water that penetrates in the pores during ageing in ambient atmosphere. The energy distribution of the annihilation γ photons, 0-511 keV, was measured as a function of the positron beam energy in the 0.5-15.5 keV range at the slow positron beam at CEMHTI (Orleans, France [37]), equipped with a high purity, high resolution germanium detector. The 3γ annihilation fraction, i.e. the fraction of e+-e− pairs that annihilates emitting three gamma photons, was determined from the relation between the integral for the 511 keV annihilation peak and the integral over an energy range below the peak. The line shape of the 2γ annihilation gamma peak was determined using the low momentum annihilation fraction of the e+-e− pairs. It is calculated from the energy spectra as S2γ = Ac/Atot, where Ac is the integral for a
narrow energy region centered at 511 keV, 511±0.656 keV, and Atot is the total integral of the 511 keV annihilation peak. Typically 3× 10⁶ annihilation events were collected
at each positron energy value.
Energy dependent positron lifetime studies in the 1-6 keV energy range were performed at the large acceptance ortho-positronium lifetime spectrometer [21, 38], built in collaboration between IRFU and ETHZ and installed on a slow positron beam of ETHZ [39]. The spectrometer was designed to allow precise determination of positronium lifetime components in the 5-142 ns range in the presence of a significant ortho-positronium escape fraction. Its large detector can register all annihilation events with equal efficiency. Another fundamental problem with the correct measurement of
annihilation spectra where 3γ events are present is that the detection efficiency of the scintillator crystals is different for 3γ and 2γ annihilation signals. We used Monte-Carlo simulation of the detector to optimize the detection threshold of the annihilation photons and avoid distortion of the relative intensities due to this effect [38]. Approximately 3× 10⁶ events were collected in each lifetime spectra. The lifetime distribution was
analysed using the LT program [40].
3. o-Ps lifetime components, three gamma annihilation fraction and low e−-e+ pair momentum fraction versus positron energy
This section presents first the positron energy (Ee+) dependence of the longer
components (τ2, I2) and (τ3, I3) of the lifetime spectra in SiO2(32 nm)/glass and of the
3γ annihilation fraction (F3γ) in SiO2(32 nm)/Si. The sol-gel SiO2 have been prepared
in the same conditions for the films deposited on glass and those deposited on Si. The porosity varies in the range 20-62%.
Then the positron energy dependence of the 3γ annihilation fraction (F3γ) is
illustrated for the three batches of SiO2(31, 51 or 75 nm)/Si films. The sol-gel SiO2
films have been prepared in the same conditions for the three batches with porosity varying in the range 11-72% . In addition, the correlation between the three gamma annihilation fraction (F3γ) and the low e−-e+pair momentum fraction (S2γ) is illustrated
for SiO2(31 nm)/Si.
3.1. o-Ps lifetime components and 3γ annihilation fraction (F3γ) as a function of
positron energy (Ee+) in 32 nm pore structure for 20.9-61.6% porosity
o-Ps lifetime components versus Ee+ (1-6 keV). For each Ee+ value, the e+
annihilation lifetime distribution is assumed to be a sum of exponential lifetime decay components. After background corrections and convolution with the 5 ns FWHM resolution function of the spectrometer, the number of the exponential decay components resolved in the fitting of the spectra (see section 2.2) is three in SiO2(32 nm)/glass
over the whole range of porosity, 20.9-61.6%. Given the 5 ns resolution, the shortest component, τ1 < 4 ns is disregarded due to the possible inaccuracy of its determination.
Only the two longer ones, τ2,3 >∼ 10 ns are shown in figure 1 (abcd) versus Ee+. One
notices that the lifetime components for the lower porosity in the range 20.9-48.4% have similar features while the lifetime components for the higher porosity, 61.6%, behave quite differently.
For lower porosity, τ2(Ee+) varies between 9.4 and 20.6 ns with I2(Ee+) in the range
5-14%. The lifetimes τ3(Ee+) vary in the range 95 to 117 ns with the intensities I3(Ee+)
between 2 and 10%. A detailed examination of the curves shows that the porosity slightly affects the dependence of the components with positron energy Ee+ as follows.
- For Φ = 30.6%, as Ee+increases from 1 to 6 keV, the shorter lifetime, τ2, decreases.
The intensity I2 has the constant value of 6.6(4)% up to 4 keV and then increases
to 14.8(2) at 6 keV. The longer lifetime, τ3, decreases from 108(1) ns to 98(1) ns
between 1-4 keV. Then it stays constant at 95(3) ns. The intensity I3 decreases
continuously from 7.1(2) to 1.9(2)% between 1-6 keV.
- For Φ = 38.8%, as Ee+ increases from 1 to 6 keV, the shorter lifetime, τ2, decreases
with a step between 2-3 keV where it remains at the constant value, 15.4(3) ns, whereas the intensity I2 remains quasi-constant, 5(1)%. The longer lifetime τ3
remains constant, 103(3) ns, whereas the intensity I3 decreases continuously from
7.7(1) to 2.0(1)% from 1 to 6 keV.
- For Φ = 48.6%, as Ee+ increases from 1 to 6 keV, the shorter lifetime, τ2, decreases
with a step between 3-5 keV where it remains at the constant value, 14.4(2) ns, while the intensity I2 remains quasi-constant, 7(1)%. The longer lifetime, τ3, remains
constant, 106.8(1.4) ns, whereas the intensity I3 decreases continuously from 10.1(1)
to 2.5(1)% between 1 and 6 keV.
It is worth noting that the lifetime τ2, for 2-3 keV in SiO2(32nm,30.6 or 38.8%)/glass
and for 3-5 keV SiO2(32nm,48.6%)/glass, has the same value, 15.2+3−8 ns. The lifetime
τ3, for the whole range of Ee+ has quasi-equal values, 104(4) ns, for 38.8% and 48.6%
porosity. For each Ee+, τ3 tends to be lower for the 30.6% porosity than for the higher
ones. The difference, however, remains small, 5-10 ns. For 30.6% porosity, τ3 also tends
to decrease and to remain stable only above 4 keV. The lifetime τ3, for 4-6 keV, has
then a value 95(3) ns that is ∼ 10 ns lower than that in the higher porosity films. For the highest porosity 61.6%, the free decomposition for each Ee+ gives a longer
component (τ3, I3) well determined (6 ≤ I3 ≤ 22%) and found always to decay with
a lifetime, τ3 = 142± 2 ns. This value is characteristic of the o-Ps self-annihilation
lifetime in vacuum, τv = 142 ns. Accordingly, all lifetime spectra were fitted with τ3
constant and equal to 142 ns in order to obtain the remaining parameters of the fit, i.e.,
I2, I3, τ2, with better accuracy. The positron energy dependence of these parameters in
figure 1 (abcd) shows that the lifetime τ2 is nearly constant above 2 keV , 7.8(5) ns. I2
increases continuously from 4.4(1) to 27.2(1)%. I3, between 1-2 keV, remains constant,
21(1)%. Then it decreases continuously for Ee+≥ 3 keV. Its value at 6 keV is 6.3(1)%. F3γ versus Ee+ (0.5-15.5 keV). As seen in figure 1 (e), the porosity in the
SiO2(32nm)/Si films affects the positron energy dependence of the three gamma
annihilation fraction F3γ. For any Ee+ between 0.5 and 4 keV, one notices that F3γ
systematically increases with porosity, with a peculiarly steep step between 48.4 and 61.6%. F3γ for the lower porosity varies in the low range, 0.084-0.01, while the values
for the 61.6% porosity vary in the much higher range, 0.2-0.084. For any porosity, F3γ
reaches 0 for Ee+ ≥ 10 keV.
A detailed examination of the F3γ(Ee+) shows that the shape of the curves depend
on porosity. The curves F3γ(Ee+) (figure 1 (e)) show similar trends for the lower porosity
20.9-48.4%. F3γ decreases quasi continuously as Ee+ increases. The curves can be
a steep decrease. The decrease slows down in the second stage between∼ 0.73− ∼ 4.71 keV with a slight break at about 1.4-1.5 keV. The decrease slows down further in the third stage between∼ 4.71−10 keV. The F3γ(Ee+) curve for the porosity value of 61.6%
has a different shape than that for the lower porosity ones. It goes through a maximum between 0.5-1.42 keV and then decreases in two stages, steep between 1.42-5 keV and slow between 5-10 keV.
In summary, as concerns the Ps annihilation characteristics in SiO2 films on glass
or Si, both the Ps lifetime decomposition and the annihilation fraction F3γ single out a
specific behavior for the higher porosity, 61.6%, when compared to the characteristics at lower porosity ≤ 48.4%.
3.2. Three gamma annihilation fraction (F3γ) versus positron energy (Ee+) and versus
low e−-e+ pair momentum fraction (S2γ).
The three gamma annihilation fraction F3γ and the low e−-e+ pair momentum fraction
S2γversus Ee+was measured in all the films of the three SiO2(31, 51 or 75 nm)/Si batches
and of the three 900◦C annealed SiO2(31, 51 or 75 nm)/Si batches. The F3γ(Ee+) data
are illustrated here for low (∼ 17(6)%), medium (∼ 51(1)%) and high (∼ 65(2)%) porosity only in the as-prepared batches.
In addition, the pore size 31 nm has been chosen to show the typical F3γ(S2γ) curves
obtained with Ee+ as running parameter for low, medium and high porosity.
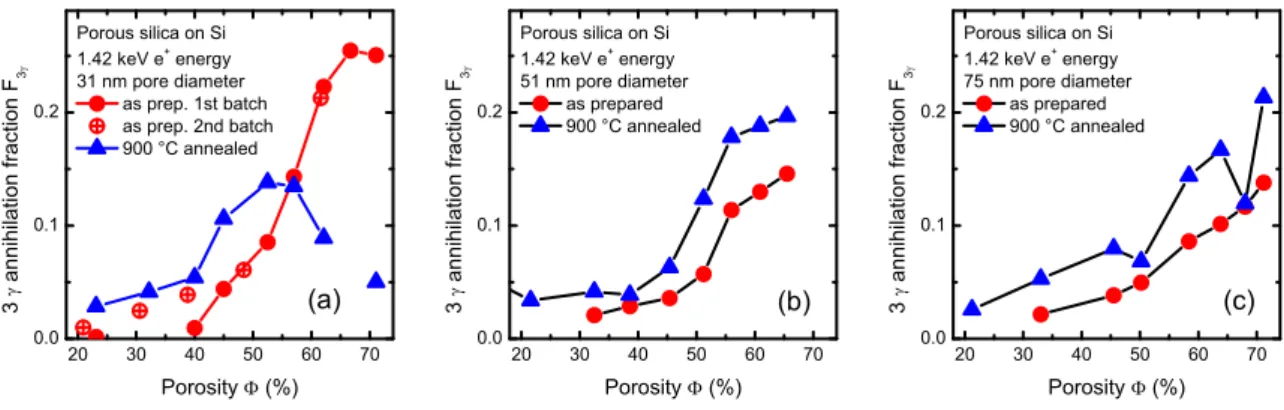
F3γ versus Ee+ (0.5-15.5 keV). The annihilation fraction F3γ versus Ee+
measured in SiO2(31, 51 or 75 nm)/Si at low (17(6)%), medium (51(1)%) and high
(65(2)%) porosity can be compared in figure 2 (abc) for the pore diameter values 32, 51 and 75 nm.
One notices that, as the pores size increases from 32 nm to 75nm, the increase between the values F3γ(Ee+) become less and less steep as the porosity increases from
low to high in figure 2 (abc). The range of F3γvalues is 0-0.25 in SiO2(31nm)/Si (figure 2
(a)), 0-0.17 in SiO2(51nm)/Si (figure 2 (b)) and 0-0.13 in SiO2(75nm)/Si (figure 2 (c)).
Independently of the size and porosity, one notices that F3γ becomes equal to 0 for
Ee+ ≥ 10 keV.
Porosity affects the shape of the curves in SiO2(31nm)/Si (figure 2 (a)) as seen
above for SiO2(32nm)/Si (figure 1 (e)). The curve F3γ(Ee+) goes through a maximum
at ∼ (0.9 − 1.42) keV for the porosity 66.7% in both films. The maximum value is 0.2535(5) in SiO2(31nm,66.7%)/Si and 0.210(2) in SiO2(32nm,66.7%)/Si.
For any value of the porosity in SiO2(51nm)/Si (figure 2 (b)) and SiO2(75nm)/Si
(figure 2 (c)), F3γ(Ee+) decreases continuously with a slight break at about 1.4-1.5 keV.
This break is better marked at medium porosity, 51.2%, SiO2(51nm)/Si and, medium
or high porosity, 50.2 or 63.8%, in SiO2(75nm)/Si.
F3γ versus S2γ with Ee+ as running parameter in SiO2
(31nm,23.1-66.7%.)/Si. The annihilation fraction F3γ versus low e−-e+ pair momentum fraction
quasi- linear segments in all the films (figure 3 (abc)). One notices that the number of segments is four (see the insert in figure 3 (a) for 23.1%). The end-points that marked the breaks between the segments correspond to the values (F3γ,S2γ) obtained at Ee+≤ 1
keV,∼ 1.42 keV, ∼5 keV and ≥ 10 keV, independent of porosity. One notices that the values (F3γ,S2γ) are equal to (0,0460(1)) for Ee+ ≥ 10 keV.
In summary, these sets of data for the three gamma annihilation mode F3γand the
two gamma annihilation mode S2γ indicates that the Ee+dependence of the annihilation
characteristics for both modes are strongly affected both by the pore size and porosity of the pore distribution in the PMMA-templated SiO2 films.
4. Depth dependence of positron and Ps quantum states
In this section, we examine the Ps annihilation characteristics and the annihilation fingerprints and nature of the Ps annihilation quantum states that give rise to the lifetime components (figure 1), the three gamma annihilation F3γ (figures 1, 2 and 3)
and the low e−-e+ pair momentum fraction S2γ (figure 3) in the SiO2/glass or SiO2/Si
films on glass or Si, respectively. For each pore size, the depth dependence is discussed at each porosity value.
4.1. Positron and Ps quantum annihilation states
The positron and Ps annihihation characteristics in SiO2(porosity)/substrate films
results from the superposition of annihilation in various positron and Ps quantum states that can be identified via the positron or Ps annihilation fingerprints in the given state [2]. In addition to p-Ps and pick-off o-Ps annihilation, positron quantum states can also contribute to the S2γ values.
The annihilation characteristics measured in the film/substrate in this work are the lifetime τa(Ee+), the three gamma annihilation fraction F3γ(Ee+) and the low e−-e+
pair momentum fraction S2γ(Ee+). They are linear combinations of the annihilation
fingerprints (τa,i, F3γ,i, S2γ,i), weighted by the fi(Ee+) annihilation probability from the
quantum states i that are accessible to positrons or Ps in the film/substrate. (τa, F3γ, S2γ)(Ee+) =
∑
fi(Ee+)(τa,i, F3γ,i, S2γ,i) (1)
The relationship between the lifetime components (Ii, τi) in the lifetime τ and
the annihilation lifetime, τa,i, in each state i depends on the processes by which the
thermalised positrons at the end of their slow down reach the quantum states from which they annihilate. F3γ,i is different from 0 only for triplet annihilation states and is
related to τa,i by the relationship F3γ,i = τa,i/τo−P svv where τo−P sv is the o-Ps lifetime
in vacuum, 142 ns. For 1 ≤ τa ≤ 142 ns, the F3γ,i values vary in the range 0.01-1 and,
for τi ≤ 1 ns, become negligeable, F3γ,i ≤ 0.01.
The annihilation lifetime in film/substrate, τa(Ee+), is experimentally determined
from the lifetime decomposition given in section 3 as
τa(Ee+) = ∑
4.2. Depth Profiling as a function of Ee+
For a given energy Ee+, the positron distribution as a function of depth z in a
film/substrate depends on the positron stopping profile (resulting from slowing down and thermalization) and on the diffusion of the thermalised positrons. In the assumption that the diffusion length is very short, the positron distribution in the film is given by the positron stopping profile. The positron stopping profile for a positron of energy Ee+
(keV) has been shown to be a Makhovian profie P (z) = mzm−1/zm
0 exp[−(z/z0)m], where
z is the depth, z0 = 0.884¯z and the parameter m is 1.8 [43]. The ¯z mean penetration
depth (nm) of positrons with implantation energy Ee+ in a material of ρ density is
calculated as ¯z = 40/ρE1.6 [43]. As the energy E
e+ increases, the positron distribution
gets broader. The probability of annihilation at the film surface decreases while the probability of annihilation in the film bulk contributes more. Above a certain energy, that depends on the film density and thickness, the substrate starts also to contribute. For the porosity (11-70%) and thickness (200-270 nm) of the PMMA-templated SiO2 films in this study, the Si substrate starts to contribute for Ee+ >∼ 5−10 keV. For Ee+ ≥ 10 keV, the positron distribution reaches 0.98 in the substrate. The annihilation
characteristics in the substrate can therefore be determined easily from figures 1, 2 and 3 as (F3γ,Si, S2γ,Si) = (0.000(1), 0.458(1)) for silicon single crystal. Clearly o-Ps is not
formed in Si, since F3γ is equal to 0.000(1) in agreement with earlier studies [3].
On the contrary, as shown by the lifetime components and the F3γ values, the
dominant annihilation quantum states in the films (0.5 < Ee+ < 5 keV) are related to
o-Ps. To understand the Ps behaviour in the films, it is useful to investigate in details first the films of the 32 nm batch for which the lifetime spectra have been measured and then the other batches.
4.3. Depth dependence of the annihilation states in SiO2(32,31,55,75 nm)
SiO2(32nm, 61.6%)/glass. For SiO2(31nm,61.6%)/glass, the existence in the lifetime
decay curve of the 142 ns lifetime gives evidence that the film bulk converts a fraction of the positrons implanted in the film bulk into free o-Ps. Depending on the authors, this process is referred as o-Ps reemission or o-Ps escape from the film. This process indicates that Ps annihilation quantum states |R⟩ exist in the film from which o-Ps escapes into vacuum. The reemission (or escape) yield, YRv, depends on the annihilation fingerprints
in the films τR, F3γ,R and S2γ,R and on the o-Ps escape rate from film to vacuum, κRv
[21].
The 142 ns lifetime exists in SiO2(31nm,61.6%)/glass for any Ee+ in the range
1-6 keV. The intensity decreases above 2 keV (figure 1 (de)), which indicates that the probability for o-Ps escape decreases as positrons get deeper implanted in the film/substrate. In addition to annihilations in vacuum, the existence of the short lifetimes, 8.3 to 7.4 ns with increasing intensity from 1 to 6 keV shows that o-Ps also annihilates in the film.
applied here. From the lifetime decomposition (I2, τ2) and (I3, τv = 142ns) (figure 1 (de))
one calculates the annihilation lifetime, τR, the escape rate κRv, the annihilation fraction fRf(Ee+) for the annihilation lifetime τR in the film and fRv(Ee+) for the annihilation
lifetime 142 ns in vacuum as follows
τR = [(τ2−1− τv−1)I2/(I2+ I3) + τv−1]−1 (3)
κRv = (τ2−1− τv−1)I3/(I2+ I3) (4)
fRf(Ee+) = τR−1(I2+ I3)/(τR−1+ κRv) (5)
fRv(Ee+) = κRv(I2+ I3)/(τR−1+ κRv) (6)
Figure 4 (a) shows that the calculated lifetime τR varies from 60 ns to 10 ns as Ee+
increases from 1 to 6 keV. The decrease of τR with increasing Ee+seems to indicate that
the |R⟩ states vary continuously with depth. As seen in figure 4 (a), for Ee+ ≥ 2 keV, the calculated curve τR(Ee+) has the striking property of being similar to the curves τ2(Ee+) experimentally determined in the SiO2(32nm)/glass films with lower porosity
≤ 38.6%. κRv decreases from 0.067 to as 0.024 ns−1 as Ee+ increases from 1 to 6 keV. F3γ and τa,o−P s can be calculated for each Ee+ value as
F3γ = (I2 + I3)(fRfF3γR+ fRvF3γv), (7)
with F3γ,R = τR/τo−P sv, F3γ,v = 1 (τo−P sv is the 142 ns o-Ps vacuum lifetime) and
τa,o−P s= (I2+ I3)(fRfτR+ fRvτv) (8)
For Ee+ in the range 1-6 keV, the F3γ,R(Ee+) in the film contribute for less than
20 % to F3γ(Ee+). For Ee+ = 2 keV, the reemission yield FRv at 2 keV is 0.207 nearly
equal to the three gamma annihilation fraction F3γ at 2 keV, 0.229 (figure 4 (b).
The curve F3γ(Ee+) calculated using the o-Ps escape model is compared in figure 4
(b) to a model curve scaled to the positron stopping profile calculated for the thickness and density of the SiO2(32nm,61.6%) film. The curve F3γ(Ee+) calculated using the
o-Ps escape model seems to decay less than expected from the positron stopping profile in the SiO2(32nm,61.6%) film.
SiO2(31nm,≤ 48.6%)/glass. For SiO2(31nm,≤ 48.6%)/glass, the absence in the
lifetime decay curves of the 142 ns lifetime indicates that there is no o-Ps escape from the film. The question is whether the two lifetime components in the lifetime spectra can be directly assigned to two types of o-Ps annihilation quantum states in the film that are independently populated. The good agreement between the values τR(Ee+)
calculated above for SiO2(31nm, 61.6%)/glass with the values τ2(Ee+) for Φ ≤ 38.8%
suggests that one can attribute the lifetime components to two independent kinds of o-Ps states, |nP ⟩ and |mP ⟩ in the films. The first one, |nP ⟩, gives rise to the lifetime values τnP(Ee+) = τ2(Ee+) and the other one, |mP ⟩ to the values τmP(Ee+) = τ3(Ee+).
For Φ < 38.8%, τnP decreases in the range 20.6-9.4 ns as depth gets deeper in the
film. For Φ = 48.4%, τnP is more stable as a function of depth and the value between
by the intensity I2(Ee+) are nearly independent on depth and porosity for Φ ≤ 48.6%
with the value 6(2)% between 2-5 keV.
The values τmP are quasi-constant 104(4) ns in the whole depth range for 38.8% and
48.6% porosity and tend to decrease as depth increases for Φ = 30.6% and to remain lower by 10 ns than for the higher porosity. Fore each Ee+ value, the value F3γ and
τa,o−P s are calculated from the lifetime components (τ2, I2) and (τ3, I3) as
F3γ ≈ I2F3γ,nP + I3F3γ,mP (9)
with F3γ,nP = τnP/τo−P sv and F3γ,mP = τmP/τo−P sv and
τo−P s ≈ I2τnP + I3τmP (10)
SiO2(31 nm, 20.6-61.6%)/Si, SiO2(32 nm,23.1-66.7%)/Si. The comparison
of the annihilation characteristics between the two different batches of films SiO2(31
nm, 20.6-61.6%)/Si and SiO2(32 nm,23.1, 66.7)/Si can be made on the basis of the Ee+
dependence of the three gamma annihilation fraction F3γ in figure 1 (a) and figure 2
(a). The effect of porosity has the same trends in both batches. The F3γ annihilation
fraction increases with porosity with a steep increase in F3γ(Ee+) between 50 -60 %
porosity for any Ee+ ≤ 10 keV. One notices however that at lower porosity, F3γ is
lower in SiO2(32nm,23.1%)/Si than in SiO2(31nm, 20.9%)/Si. It shows that the o-Ps
quantum states accessible in the films can fluctuate with the film preparation, even for similar pore size and porosity, and have an occupancy or nature that depends on the film preparation.
The correlation between F3γ and S2γ (figure 3) indicates another interesting
property of the annihilation characteristics in the films. As the porosity increases from 23.1 to 61.8%, it becomes easier to distinguish where the depth dependence of the annihilation characteristics reflects a change in the nature or in the occupancy of the annihilations states. The nature of the annihilation states differ at z > 1 keV, ∼ 1.42 keV, ∼ 5 keV and > 10 keV. Between these four mean depths, the linear variation indicates that only the occupancy of the states differs as positrons penetrate deeper in the film/substrate. Independent of porosity, as depth increases in the film from
∼ ¯z(1.42keV ) to ∼ ¯z(5keV ), both F3γ and S2γ decrease from the values (F3γ, S2γ) at
∼ ¯z(1.42keV ) to (F3γ, S2γ) at mean depth ∼ ¯z(5keV ). Independent of porosity, as the
depth increases from ∼ ¯z(5keV ) in the film to the substrate, F3γ goes on decreasing
while S2γ increases to reach the values (F3γ,Si, S2γ,Si) in the Si substrate.
The annihilation characteristics in the films, (F3γ, S2γ) at mean depth ∼
¯
z(1.42keV ), and at ∼ ¯z(5keV ) differ more or less depending on the porosity. However,
independent of porosity, F3γ and S2γ in the films are lower at ∼ ¯z(5keV ) than at
∼ ¯z(1.42keV ). Various annihilation modes contribute to S2γ: p-Ps, positron and
singlet states resulting from o-Ps quenching. The question is whether one of this mode dominates the others and may explain the correlated decrease of F3γ and S2γ
as the mean depth increases in the film. If p-Ps and o-Ps are the only modes, as they are formed for 25% and 75% respectively, F3γ and S2γ are expected to vary in
a correlated way. One can observe that, for any porosity, the changes in F3γ and S2γ
are uncorrelated. Consequently, other modes contribute, such as positron annihilation and/or o-Ps quenching.
SiO2(32nm,23.1- 66.7%)/Si, SiO2(51nm,11.4-65.5%)/Si, SiO2
(75nm,11.2-63.8%)/Si. The strong effect of the size of the pores on the values F3γ(Ee+) in the
three different batches of films, SiO2(32nm,23.1- 66.7%)/Si, SiO2(51nm,11.4-65.5%)/Si
and SiO2(85nm,11.2-63.8%)/Si (figure 2), indicates that the occupancy or nature of
the o-Ps quantum states in the films change when, for a given porosity, the pore size increases.
In summary, to compare the effect of the pore size and porosity on the o-Ps
quantum sates, it is safer to choose an energy in the range 1.42-2 keV to minimize the surface effect and maximise the positron distribution in the film as far as possible from the film/substrate interface. The mean positron implantation depth at 1.42 keV positron energy varies in the range 11 to 35 nm for the film density of 0.63-1.95 g cm−3.
5. Pore size and porosity effect on o-Ps annihilation and escape
The annihilation characteristics in the PMMA-templated SiO2 films have a porosity
(Φ) dependence that needs to be examined for each pore size, 31, 32, 51 and 75 nm, to understand how the occupancies and nature of the o-Ps annihilation states in the films,
|nP ⟩, |mP ⟩, |R⟩, and in vacuum |v⟩ are affected by porosity.
5.1. Annihilation lifetimes and fractions at 2 keV in SiO2(32nm,30.6-61.6%)/glass
Figure 5 (a) illustrates how porosity affects the decay slopes in the lifetime spectra at 2 keV as porosity increases from low (30.6%) to high (61.6%) in SiO2(32nm)/glass films.
On the left of the resolution peak, there are clearly two slopes in the decay curves for the low and high porosity. Both decay slopes change as porosity increases from 30.6 to 61.6%. The fast decay is shorter for 61.6% than for 30.6% whereas the slow decay is longer. The ratio of the number of annihilation events in the slow decay to the fast decay one increases by nearly a factor of∼ 4.6 as porosity increases from 30.6 to 61.6%. As shown in figure 5 (b), for porosity in the range 30.6-48.4%. the short annihilation lifetimes τnP at 2 keV have a constant value, 16(1) ns. The annihilation fractions fnP
in figure 5 (c) are also constant, 0.06(1). For porosity at 61.6%, the short annihilation lifetimes τR at 2 keV has the value 19(2) ns. The annihilation fraction fR has the value
0.16(1).
The long annihilation lifetimes τmP at 2 keV (figure 5 (d)) tend to increase, from
102(1) to 109(1) ns with increasing porosity from 30.6 to 48.4%. The annihilation fraction fmP (figure 5 (d)) also increases from 0.06(1) to 0.08(1). For 61.6% porosity
o-Ps escape gives rise to the vacuum lifetime 142 ns. The annihilation fraction in vacuum
fRv has the value 0.20 (1).
15% the same over the whole range of porosity 30.6-61.6%. τnP and τR lifetimes having
the same value, it is proposed that the |nP ⟩ and |R⟩ states have a similar origin. The threshold for o-Ps escape from the |nP ⟩ states is between 48.4-61.6%. From the annihilation fractions fnP, it can be inferred that the occupancy for the |nP ⟩ states is
rather independent of porosity below 48.4% and increases strongly at 61.6%. It is also proposed that the |mP ⟩ states, giving rise to the lifetime τmP(32nm), 105(4) ns over the whole range of porosity 30.6-48.4%, have a common origin. From the annihilation fraction fmP, the occupancy for the |mP ⟩ states tends to increase with porosity. The
occupancy for the v states at porosity of 61.6% is much higher than for the |mP ⟩.
5.2. Three versus two gamma mode in SiO2 porous films at 1.42 keV
This section concerns a detailed analysis of F3γ(S2γ) at 1.42 keV obtained with porosity
as running parameter. The analysis is performed for the pore size 31, 32, 51 and 75 nm. It shows that, for a given pore size, the correlation between 3γ and 2γ annihilation mode is strongly dependent on porosity. The pore size affects the porosity dependence of the correlation between 3γ and 2γ annihilation modes.
Independent of pore size, the F3γ(Φ) curve has an S like shape and the F3γ(S2γ)
curve has break points where the F3γ variation rate with S2γ changes from positive to
negative as porosity increases. The details are as follows.
- F3γ(Φ) and F3γ(S2γ) at 1.42 keV in SiO2(32nm,20.9-61.6%.)/Si and
SiO2(31nm,23.1-71.1%.)/Si. The sol-gel preparation is different for the
SiO2(32nm,20.9.6-61.6%.)/Si and the SiO2(31nm,23.1-71.1%.)/Si batches. The
effect of this preparation difference on the reproducibility of the F3γ(Φ) curve can
be examined in figure 6 (a). The F3γ values tend to be lower in the second batch,
0.009 instead of 0.03, at porosity < 40% whereas they are quite comparable for porosity ≥ 45%. The curves have very similar S like shapes for the two batches with a well marked step where F3γ increases about a factor of 4, from 0.06 to 0.25,
while porosity increases by a factor of 1.3 from 48.4 to 66.7%.
The F3γ(S2γ) curves at 1.42 keV with porosity as running parameter (figure 6 (b))
have three well marked break points. The porosity that corresponds to these break points are 47(1), 57 and 61(1)%. Each break point separates two regions where the rate of variation for F3γ versus S2γ changes significantly. The break point at
57% is peculiarly interesting because it separates two regions. A transition exists at∼ 57% where the F3γ and S2γ variations change from being positively (< 50.2%)
to negatively (≥ 50.2%) correlated.
- F3γ(Φ) and F3γ(S2γ) at 1.42 keV for 51 nm pore size in SiO2
(51nm,11.4-65.5%.)/Si. For 51 nm pore size in SiO2(51nm,11.4-65.5%.)/Si, the F3γ versus
porosity (figure 6 (a)) curve has a S like shape with the steep step, 0.057 to 0.113, occurring within 4% of porosity change, between 51-56%. The steep stage separates two regions where F3γ increases with porosity at lower rates. The F3γ(S2γ) curves
∼ 45.5%. For porosity < 45.5%, the F3γ and S2γ variations correlate whereas for
porosity > 45.5% the variations anti-correlate.
- F3γ(Φ) and F3γ(S2γ) at 1.42 keV for 75 nm pore size in SiO2
(75nm,11.2-71.2%)/Si. For 75nm pore size in SiO2(75nm,11.2-71.2%)/Si, the F3γ(Φ) curve
(figure 6 (a)) has a faint S like shape with the steeper step, 0.0496-0.0861, occurring within 8% of porosity change, between ∼ 50 − 58%. The F3γ(S2γ) curve with
porosity as running parameter(figure 6 (b)) has a break point at porosity∼ 50.2%. For porosity < 45.5%, the F3γ and S2γ variations correlate whereas for porosity
> 45.5% the variations anti-correlate.
5.3. Pore size and porosity effect on annihilation states |nP ⟩, |mP ⟩ and |R⟩
The full set of annihilation characteristics (τ, F3γ, S2γ) in the PMMA-templated SIO2
films has been experimentally determined for the 32 nm films whereas only (F3γ, S2γ)
data exist in the other 31, 51 and 75 nm films (see section 3). To understand how pore size and porosity affects the annihilation states |R⟩, |nP ⟩ and |mP ⟩, it is easier to consider first the SiO2(32nm)/glass and SiO2(32nm)/Si batches.
For the 32 nm films on glass, the F3γ(Φ) curve is calculated by taking the values
calculated at 2 keV (figure 4 (b)) using the lifetime components measured in these films within the framework of the annihilation models described in section 4. The comparison of the calculated and measured curves at 2 or 1.42 keV in the 32 nm films shows that both curves exhibit a steep step in the porosity range 48.4-61.6%. In this range, the annihilation lifetimes give evidence in the 32 nm films on glass that o-Ps escape is triggered. Furthermore, it is in the same porosity range where the variation rate of
F3γ with S2γ from positive becomes negative. The consistency between the porosity
values suggests that o-Ps escape also affects S2γ. S2γ is sensitive to the changes in
the two gamma annihilation mode and reflects changes in p-Ps and/or e+ annihilation
induced by the triggering of o-Ps escape. As previously reported [41], the triggering of p-Ps escape is also expected at the threshold for o-Ps escape. The p-Ps escape reduces the annihilation fraction from the p-Ps states in the films and, consequently, induces a decrease in S2γ at 1-2 keV. In addition, o-Ps escape reduces o-Ps quenching, which also
induces a decrease in S2γ at 1-2 keV.
The positive to negative transition slope in the variation rate of F3γ vs. S2γ at
1.42 keV is used in the the 31, 51, 75 nm films measurements to determine the porosity at which of o-Ps escape is triggered. On this basis, the porosity thresholds for o-Ps escape are in the range 57-62%, 51-56%, 52-58% for the 31, 51 and 75 nm pore size films, respectively. The comparison of these thresholds shows that for porosity ≤ 51%, o-Ps annihilation takes place only in the films independently on the pore size, 31, 51 or 75 nm. It shows also that o-Ps escape is triggered at porosity < 57(1)% for the bigger pores, 51 and 75 nm, and above > 57(1)% for the smaller, 31 nm pores.
For porosity ≤ 47%, the (F3γ, S2γ) annihilation characteristics in the films are in
higher for the bigger pores (75 nm). For each pore size, F3γ varies quasi-llinearly with
S2γ, which suggests that the 3γ and 2γ annihilation mode reflects mainly Ps annihilation
in triplet and singlet states that arises from the same Ps states. As shown in the F3γ
calculation for the 32 nm SiO2 films, the states that contribute for 80-90% to F3γ are the
|mP ⟩ states with τmP, 104(9) ns pores. Another most interesting feature for the films with smaller(32 and 31 nm) pores is that, in addition to the o-Ps escape transition at porosity > 57%, there is a precursor transition at porosity > 48.4% where the variation rate of F3γ with 2γ increases by a factor 2.5. This precursor transition is absent in
the 51 or 75 nm films. This precursor transition occurs in a range of porosity where the annihilation fraction for the longer o-Ps lifetime, τmP, increases (figure 5). This is
consistent with the high contribution of o-Ps and p-Ps in these states to F3γ and S2γ,
respectively.
5.4. Effect of 900 ◦C annealing on 3γ annihilation mode at 1.42 keV
The comparison of the F3γ(Φ) curves measured in as-prepared and 900◦C annealed
SiO2(31, 51 or 75 nm) films on Si shows that the discussion of the effect of annealing
requires to consider the pore size before annealing. The porosity and pore size in figure 7 are determined before 900◦C annealing.
The most dramatic changes occur for the small pores (31 nm). The 900◦C annealing effect depends on the porosity and can be discussed in considering first a low porosity range ≤ 52.5% and a high porosity range > 57% separated by a narrow region ∼ 57%, where the annealing has a minimum of effect. In the low porosity range, ≤ 52.5%, the annealing induces an increase in F3γ. For porosity ≤ 40%, the annealing effects remain
weak within the fluctuations for F3γ measured in various batches. Between 45-52.5%,
the values in 900◦C annealed films are 1.5 -2 times higher than the values F3γ measured
in as-prepared films. In the high porosity range > 57%, the 900◦C annealing induces a steep decrease in F3γ and the effect is worse with increasing porosity.
For the bigger pores (51 or 75 nm), the trend is systematic as concern the effect of 900◦C annealing. Independently on porosity, F3γ is higher in the annealed films than in
the as-prepared films. The increase tends to be larger with porosity increasing in the range, ≥∼ 45% and ≥∼ 55%, for 51 nm and 75 nm pores, respectively.
There is a clear effect on the occupancy or nature of the o-Ps annihilation quantum states induced by the 900◦C annealing. A process takes place that increases the annihilation probability from states with longer o-Ps annihilation lifetimes. An additional process seems to take place for the 31 nm pores at porosity ∼ 57% that overcomes this process. This second process gives rise to annihilations that produces shorter lifetimes than in annealed films. It overcomes the first process very efficiently as porosity increases.
6. Ps annihilation and escape in intrinsic and extrinsic pores
The nature of positron or Ps quantum states accessible in a material is controlled by the potential fluctuations in the material. Regions with missing atoms, i.e. open volume defects, give rise to lower potential regions where positrons are repelled by the repulsive electrostatic potential between their positive charge and the nuclei of the atom network that forms the material. If the potential fluctuations are deep enough compared to the potential in the atom network, positrons get localised and annihilate at the site of the open-volume defects. This process has been at the basis of positron (or Ps) defect spectroscopy in matter that is used to detect defects from the atomic (i.e. one missing atom or monovacancy) to nanopore scale. The trapping (i.e., capture) to the open-volume defects can be transition-limited, direct (mono, divacancy etc) or precursor state assisted (dislocations, negatively charged defects) or diffusion limited (cavities, surface). The trapping rate is calculated using the Fermi golden rule [2, 42, 3].
6.1. o-Ps lifetimes in nanopores (< 2nm) and in macropores (31-32 nm)
In the case of porous solids, Ps can be captured in pores depending on the pore size and density per unit volume. The quenching models for o-Ps annihilation by electron pick-off in pores indicate that the ranges 9-20 ns for τnP or τR and 95-117 ns for τmP
(figure 1 (d)) are consistent with o-Ps annihilation from localized states in pores. For a given chemistry of the pore surface, the lifetime increases with increasing pore volume depending on the specific pore geometry. According to the rectangular extension of the Tao-Eldrup model (RTE) [11] that uses rectangular pores instead of the spherical ones in the Tao-Eldrup model [6, 7], the length of the cube that describes the pore in the model increases from 1.08, 1.65 and 1.80 nm with increasing lifetime 9, 16 and 19 ns, respectively. The same model gives for 31, 51 and 75 nm pores approximately 122, 130 and 135 ns ortho-positronium lifetime, respectively.
For τmP measured in the 32 nm pore SiO2/glass films, 95-117 ns at any depth or
102-111 ns at ¯z(2 keV), the expected lifetimes are longer by only a factor ∼ 1.0 − 1.3
indicating that o-Ps capture takes place in pores with effective size close to 32 nm. It is puzzling that the comparison between the calculated o-Ps lifetimes in pores and the experimental τnP, τR lifetimes gives pore sizes much smaller than the extrinsic 32 nm
pores. It follows that in addition to the extrinsic 32 nm pores in [32] o-Ps is captured in micropores of small effective sizes (< 2 nm). In earlier studies on CTAB mesoporous films there was a rather good agreement between the measured o-Ps lifetime values and those expected on the basis of the RTE model [11] for the size of the extrinsic pores,
∼ 4 nm, determined by ellipsometry porosimetry [21]. These extrinsic pores were also
the only pore distribution sampled by o-Ps below the o-Ps escape in these films. For the 32 nm films on glass, F3γ at 2 keV in figure 4 (b) is calculated using the
lifetime τnP, τmP, 142 ns in vacuum and the corresponding annihilation fractions (section
4). The porosity dependence of F3γ calculated at 2 keV for the 32 nm film on glass or
are in excellent agreement. This consistency suggests that the nature and occupancy of the |nP ⟩, |R⟩ and |mP ⟩ annihilation states are quite similar in the 31-32 nm films on glass or Si. However it is difficult to obtain evidence for the existence of the |nP ⟩ states from F3γ. The ratio between the calculated contributions of the|mP ⟩ and |nP ⟩
states to the F3γ values increase with porosity as follows: ∼ 5.1, 6.4 and 8 for 30.5%,
38.6% and 48.4% porosity, respectively. This shows that, for ≤ 48.4% porosity, the contribution to F3γ arises for more than 83% from annihilation from the |mP ⟩ states.
For 61.6% porosity, F3γ arises mostly from annihilation in vacuum.
To get a better insight into the nature of the pore distributions, using, on the one hand, positron annihilation, as in this present work, or, on the other hand, ellipsometry-porosimetry (as in reference [32]), it is useful to examine how porosity affects the correlation between the 3γ annihilation mode, F3γ at 1.42 keV, and the experimental
specific surface area per volume unit (σv) (or per mass unit (σv) (from [32]).
For a homogeneous distribution of spherical pores with d diameter and Φ porosity in the SiO2 films, the calculated σv and σm are respectively given by σv = αΦ/d and σm = σv/ρ(1 − Φ), where ρ the SiO2 density in the walls between the pores that is
taken in [32] equal to the density for dense fused silica 2.2 g cm−3 and α is a constant value. Using the porosity, pore size and specific surface area experimentally determined for each film as in [32], the σv and σm expressions are used to calculate the values
expected in the film for a homogeneous distribution of spherical pores of pore size and porosity(dexp(nm), Φexp(%)).
6.2. Influence of porosity on 3γ annihilation mode, specific surface area per unit volume and specific surface area per unit mass
F3γ annihilation fraction at 1.42 keV and σv specific surface per unit volume [32] versus porosity Φ. σv has been determined versus porosity in [32] from
ellipsometry-porosimetry using ethanol vapor in SiO2(31, 55 and 77 nm)/Si batches
prepared in the same or similar conditions as the SiO2(32 nm)/glass and SiO2(31, 32,
55 and 77 nm)/Si used in this paper for positron spectroscopy. The comparison of the porosity dependence of F3γ at 1.42 keV and σv [32] shows a better correlation for the
higher, 51-55 and 75-77 nm pore size in figure 7 (bc) than for the lower ones, 31-32 nm in figure 7 (a).
For the small (31-32 nm), intermediate (51 nm) and large (75 nm) pore size, both quantities increases in three stages with a S like shape. The second stage is steeper than the first and third stage. The details vary depending on pore size. For example, for the small pores for which the discrepancy between the two curves is the largest, the porosity threshold for the steep stage is at > 40 % or > 50% for [32] and > 36% for
σv. The threshold for the third stage is at ≥ 66.7(1)%, for [32] while it is at porosity ≥ 43(1)%, for σv.
Independently on the pore size, one notices a systematic trend for the porosity threshold at which the second, steep, and third stage begins. The thresholds are
systematically shifted to lower porosity for σv than for F3γ. For the steep stage, the
porosity shifts between σv and F3γ are about 5-10%: from 36 to 45% for the small (31-32
nm) pores, 45 to 51% for the medium (51-55 nm) ones and 45 to 50% for the large (75-77 nm) ones. For the third stage, the porosity shifts between σv and F3γ are about 6-25%:
from 42 to 66.7% for the small (31-32 nm) pores, 53 to 56% for the medium (51-55 nm) ones and, 52 to 58% for the large (75-77 nm) ones.
As seen above, the o-Ps quantum states that contribute mainly to F3γ(1.42keV ) are
the |mP ⟩ or |R⟩ states, respectively. The threshold for o-Ps escape from the |R⟩ state has been determined (see section 5) to be triggered at porosity in the range 57-62%, 51-56%, 52-58% for the 31, 51 and 75 nm pores, respectively. The porosity threshold of o-Ps escape are well above the steep stage of increase in σv: about 21% higher for
31 nm pore size and by 6-7% higher for 51 and 75 nm pore size. Furthermore, such porosity values are well above those for the threshold of the third stage in σv for the 31
nm pores. They correspond to them for the 51 and 75 nm pores. In this third stage, one notes also that σv evolves quasi-linearly.
The preceeding comparison shows that, independently on the pore size, the o-Ps escape is triggered at porosity where the specific surface area per volume detected by ellipsometry-porosimetry evolves quasi-linearly. The slopes for the different pores sizes (31,55 and 77 nm) have the values (321,31), (172,55), (120,77) (m2 cm−3, nm). It is worth mentioning that the ratios between the slopes for the different pores sizes are equal to the ratios between the pore diameters although the experimental σv values are
1.7 higher than the calculated values for a homogeneous distribution of spherical pores [32].
F3γ annihilation fraction at 1.42 keV versus specific surface area per unit
volume (σv) or mass (σm) with porosity as running parameter. In this part,
the σm value for a given porosity and a given pore size is determined from the σv value.
This is obtained from the experimental slopes determined, as indicated above, for the third stage in the pore size dependent curves σv(Φ) and using the film density calculated
as mentioned above.
The correlation between the shapes of the curves, F3γ and σv as a function of
porosity leads to examine the curves F3γ(σv), or shown in figure 9 (a), F3γ(σm) obtained
with porosity as running parameter for the 31, 32, 51 or 75 nm pore size in the SiO2/Si
films. In figure 9 (a), as σm increases, one notices that F3γ(σv) systematically increases
independently on pore size. The detailed examination shows that for 31, 32 and 51 nm pore size, there is a clear transition that separates two ranges of σm values where F3γ varies linearly as a function of σm with different slopes. The transition is wide
for 31-32 nm pore size and more steep for 51 nm pore size. It is hardly visible for 75 nm pore size because the slopes are almost the same over the whole range of σm
values. The transition region for 31-32 nm pore size corresponds to the σm values that
are calculated for the porosity where the precursor transition takes place. Independent of pore size, the higher range of σm corresponds to the values calculated for porosity
porosity values are above those for the o-Ps escape threshold. Most interesting is that the F3γ increase rate per σm unit in the higher σm range has a value independent of pore
size: 9.1(4)× 10−4m2g−1. This is illustrated in figure 10 (b) for the porosity 60± 2%.
Most striking also in figure 10 (b) is how different the F3γ annihilation fraction can be
for the same porosity but different size pores.
When σm is replaced by σv, the same types of correlation are found in the values F3γ(σv). However, the lower and higher range of porosity where the linear relationships
exist tend to slightly differ. The higher one corresponds to porosity above the o-Ps escape threshold.
6.3. Intrinsic and extrinsic pore distribution in the PMMA-templated SiO2 films
The macropores in the PMMA-templated SiO2 films are expected to capture Ps. In
addition to this external pore distribution, as mentioned in section 2, there is more elusive evidence in [32] that the silica network between the pores contain an intrinsic microporosity of a few %. To attribute the existence of the |nP ⟩ annihilation states to micropores present in the SiO2walls appears to be consistent with the microporosity that
is assumed to exist from FTIR data in [32]. As mentioned already above, the occupancy and the lifetime|nP ⟩ are nearly independent of porosity up to 48.4%. This is consistent with the porosity–independent contribution of the SiO2 walls to the refractive index in
[32]. In addition, as seen in section 6.1, the τnP values are associated to effective pore
size, ≤ 1.80 nm, which is consistent with the micropore size (≤ 2 nm) expected in SiO2
sol-gel films.
The|mP ⟩ annihilation states have annihilation characteristics consistent with those that can be expected from the extrinsic pore distribution. Their occupancy tends to increase with porosity. As seen above, the effective pore sizes estimated from τmP,
106(4) ns in the SiO2(32nm)/glass films appears to be however slightly smaller than the
expected size. This trend gets more marked as porosity gets lowers.
The |R⟩ annihilation states exist in all films above the porosity threshold for o-Ps escape. For the 61.6% porosity in SiO2(32nm)/glass, it seems that the intrinsic pore
distribution in the walls as well as the extrinsic pore distribution contribute to these states.
The microporous silica network in the PMMA–templated SiO2 films is the region
where positrons slow down and reach thermal energy. One possible mechanisms for positronium formation in insulators is described by the spur reaction model [44]. In this model, conduction electrons created by positron slowing-down can be captured by positrons at the end of their track to form Ps. Once thermalised, the diffusion length of e+ and Ps before annihilation are expected to be very short, a few ˚A, in the PMMA–
templated SiO2 films on the basis of the good agreement between the scaling of the three
gamma annihilation fraction F3γ dependence with positron energy to that of the positron
stopping profile. Diffusion lengths as short as 8(2) nm for positron and 11(2) nm for o-Ps has been reported in vitreous α-SiO2 [45], about one-two orders of magnitude lower


![Figure 9. Porosity dependence of 3γ annihilation fraction F 3γ at 1.42 keV positron energy (right scale) and specific surface area per volume unit (σ v ) form [32] (left scale) in (a) 31-32 nm, (b) 51-59 nm and (c) 75-77 nm pore size silica films deposited](https://thumb-eu.123doks.com/thumbv2/123doknet/13232622.394791/34.892.122.846.150.354/figure-porosity-dependence-annihilation-fraction-positron-specific-deposited.webp)
