HAL Id: hal-02130489
https://hal.archives-ouvertes.fr/hal-02130489
Submitted on 4 Jun 2020
HAL is a multi-disciplinary open access
archive for the deposit and dissemination of
sci-entific research documents, whether they are
pub-lished or not. The documents may come from
teaching and research institutions in France or
abroad, or from public or private research centers.
L’archive ouverte pluridisciplinaire HAL, est
destinée au dépôt et à la diffusion de documents
scientifiques de niveau recherche, publiés ou non,
émanant des établissements d’enseignement et de
recherche français ou étrangers, des laboratoires
publics ou privés.
3D mesh description using ”Subdivided
Shape-Curvature-Graphs”
Florian Beguet, Jacques A. de Guise, Thierry Cresson, Matthieu Schmittbuhl,
Jean-Luc Mari
To cite this version:
Florian Beguet, Jacques A. de Guise, Thierry Cresson, Matthieu Schmittbuhl, Jean-Luc Mari.
3D mesh description using ”Subdivided Shape-Curvature-Graphs”.
40th Annual Conference of
the European Association for Computer Graphics, Eurographics 2019, May 2019, Genoa, Italy.
�10.2312/egp.20191054�. �hal-02130489�
EUROGRAPHICS 2019/ O. Bimber and A. Fusiello Poster
3D mesh description using "Subdivided Shape-Curvature-Graphs"
Florian Beguet1,2,3Jacques De Guise2,3Thierry Cresson2,3Matthieu Schmittbuhl3,4Jean-Luc Mari1
1Aix Marseille Univ, Université de Toulon, CNRS, LIS, Marseille, France 2Ecole de Technologie Supérieure, Montréal QC, Canada
3Laboratoire de recherche en imagerie et orthopédie, CRCHUM, Montréal QC, Canada 4Faculté de médecine dentaire, Université de Montréal, Canada
Abstract
This paper presents a shape descriptor for 3D meshes using a graph to represent a polyhedral mesh which is then used to extract patterns from the shape. The use ofSubdivided Shape-Curvature-Graphs makes it possible to not only recognize the similarities of mesh details but also determine the self-similarity of local portions of the object by adding topological information to the graph. The proposed method divides the mesh into 8 categories of patches using the discrete curvatures. These patches are cleaned; afterwards, to add topological information, a new "segmentation" patch is added. Finally, an approach is developed to extract and compare the subgraphs and thus be able to obtain the self-similarity of local parts of the mesh.
CCS Concepts
• Computing methodologies → Shape descriptors; Discrete curvatures; 3D mesh; Graphs;
1. Introduction
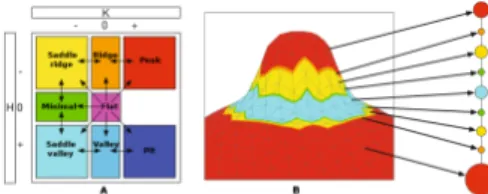
As extraction and comparison of shapes on meshes are important steps in applications requiring shape recognition, there are many studies dealing with extraction of shapes or features of meshes us-ing discrete curvatures, e.g. via a skeleton usus-ing an average cur-vature [Kea13], via a mesh divided into patches using a method of growth by region surrounded by strong variations of curva-ture [Lea05], and using the Gaussian curvature to extract the salient lines in a multi-scale framework [Yea12]. These algorithms break down the meshes into patches of homogeneous curvature or patches of salient features but it is not possible to extract and to pair similar local shapes of the mesh according to a percentage of similarity. Polette et al. [Pea17] propose a curvature-based analysis technique to construct a graph representative of the shape characteristics of a surface mesh. This makes it possible to find all the occurrences of a particular subgraph resulting from a known shape and according to a threshold of similarity. In the study [Pea17], the mesh is di-vided into eight categories of patches according to local curvature: vertices can be a peak, ridge, saddle ridge, minimum, saddle valley, valley, pit or flat spot (Figure1.A). The ridge, minimal and valley patches are considered as transition boundaries between patches and must be added to ensure consistent continuity. This leads to a more consistent and robust descriptor graph that allows the charac-terization of a local form (Figure1.B). However, this method has two flaws. The first is that it does not automatically extract topolog-ically consistent subgraphs from the created graph, the other one is related of complex and closed meshes for which a particular node will take a central place. The graph shown in Figure2.A is an
ex-ample of a graph obtained for this kind of mesh. The central node, here circled in red prevents the proper extraction of subgraphs that can correctly describe the shape of the mesh. Our goal is to extend the existing method to categorize a 3D mesh with a Subdivided Shape-Curvature-Graph, then to subdivide the graph into several subgraphs with a finer structural meaning. According to a similar-ity criterion, these different subgraphs can then be compared with each other to determine self-similarity but also with known sub-graphs which would allow the detection of deformations in cases where the similarity is lower than expected.
Figure 1: A. Adjacency rules between the patches. B. Shape-Curvature-Graph after enrichment. (Image from [Pea17])
2. Construction of the Subdivided Shape-Curvature-Graph The proposed method consists of four stages:
• In the first step, an initial graph is computed based on the adja-cency rules in Figure1. This graph is then cleaned to remove all patches with a number of vertices less than a given number to ob-tain noise-resistant patches. When necessary, junctions between patches are added to maintain continuity [Pea17].
c
2019 The Author(s)
Florian Beguet et al. / Subdivided Shape Curvature Graphs
Figure 2: A. Shape-Curvature-Graph [Pea17] computed on an elephant mesh with the central node circled in red. The colors on the mesh represent the patches according to the Figure.B. Subdivided Shape-Curvature-Graph computed on the same mesh with the segmentation nodes circled in red. The gray color on the mesh represents the segmentation patches.
• In the second step, the yellow saddle ridge central node is re-moved. To this end we propose adding to the graph structural information obtained from the segmentation of the mesh. Mesh segmentation is a process of breaking down a mesh into smaller meaningful sub-meshes. Inspired by Shamir et al. [Sha08], we chose an algorithm based on an approach using the Shape Di-ameter Function (SDF) presented by Shapira et al. [Sea08] since it makes it possible to break down the mesh while maintaining a topological similarity between the different clusters. Once the mesh has been segmented, new nodes are created and consist of the points located at the junction between the segmented sets. Figure2.B shows the graph obtained on the same mesh as Fig-ure2.A after the addition of segmentation patches shown in gray on the mesh. The segmentation nodes have been circled in red. As the central node is no longer present, the graph can be ex-ploited.
• The purpose of the next step is to extract all subgraphs from the main graph so that they can be compared to each other. To this end, we consider the nodes added in the previous step as bounds of each subgraph. By browsing the main graph, it becomes easy to extract them. Subdivision nodes are not added to subgraphs, as we retain only nodes from the curvature calculation. To increase the robustness of the extracted subgraphs, a pruning algorithm is used at the end of the process to remove all nodes below a defined number. This makes it possible to delete the small sub-patches created because of the cutting node.
• Finally, the subgraphs are compared to each other. To this end, the algorithm described by Nicolic et al. [Nik12] is used to de-fine a similarity value between two graphs. Assuming that two nodes are considered similar if the neighbor nodes of the first graph can be associated with similar neighbor nodes of the sec-ond one, a similarity matrix can be constructed. The similarity value between the two graphs can then be determined by taking the average of the best pairs of nodes.
3. Results
We applied the proposed algorithm to complex closed mod-els with similar curvature-related components. Here we took an elephant model (Figure 3.A) provided with the CGAL mesh processing library and an inner ear 3D model (Figure 3.B) available athttp://audilab.bmed.mcgill.ca/~daren/3Dear/ index.html. Each color on each of the meshes represents a group of sub-graphs of matched shapes for a similarity greater than 80%. The comparison was not made between meshes. The four legs of the elephant could be paired correctly (green); two of the
semicir-cular canals of the inner ear (purple) were also paired correctly; it is important to note that the third canal was not paired, Indeed, the characteristics of its local curvature form a different subgraph.
Figure 3: A. 3D elephant model B. 3D inner ear model. The colors on the two meshes correspond to clusters of paired form subgraphs. 4. Conclusion
The use of a mesh segmentation method allows us to "break" the yellow saddle ridge super-patch and to exploit a Subdivided Shape-Curvature-Graphto extract the associated subgraphs. These sub-graphs can then be easily paired and the local information provided by the graph makes it possible to disqualify some of the pairings while the overall shape seems similar. This could be useful for ap-plications focusing on local malformations. However, the primary drawback is the dependence of this approach on a mesh segmenta-tion method. Indeed, it will be necessary to adapt this step accord-ing to the type of mesh the user is tryaccord-ing to describe. In future work, we plan to store more topological information such as the shape of the curvature patch on the nodes of the graph to reduce the chances of false positives during the matching step, especially for simple subgraphs.
References
[Kea13] KUDELSKID.,ET AL.: Skeleton extraction of vertex sets lying on arbi-trary triangulated 3d meshes. In Discrete Geometry for Computer Imagery (2013), Springer Berlin Heidelberg, pp. 203–214.1
[Lea05] LAVOUÉ,ET AL.: A new cad mesh segmentation method, based on curva-ture tensor analysis. Comput. Aided Des. 37, 10 (Sept. 2005), 975–987.1
[Nik12] NIKOLI ´CM.: Measuring similarity of graph nodes by neighbor matching. Intell. Data Anal. 16, 6 (Nov. 2012), 865–878.2
[Pea17] POLETTEA.,ET AL.: “Shape-Curvature-Graph”: Towards a New Model of Representation for the Description of 3D Meshes. In Augmented Reality, Virtual Reality, and Computer Graphics(Cham, 2017), Springer International Publishing, pp. 369–384.1,2
[Sea08] SHAPIRA,ET AL.: Consistent mesh partitioning and skeletonisation using the shape diameter function. Visual Computer 24, 4 (2008), 249–259.2
[Sha08] SHAMIRA.: A survey on mesh segmentation techniques. Computer Graph-ics Forum 27, 6 (2008), 1539–1556.2
[Yea12] YANGY.-L.,ET AL.: Multi-scale salient features for analyzing 3d shapes. Journal of Computer Science and Technology 27, 6 (Nov 2012), 1092–1099.1
c
2019 The Author(s) Eurographics Proceedings c 2019 The Eurographics Association.
![Figure 2: A. Shape-Curvature-Graph [Pea17] computed on an elephant mesh with the central node circled in red](https://thumb-eu.123doks.com/thumbv2/123doknet/14664749.740478/3.892.196.717.123.262/figure-shape-curvature-graph-computed-elephant-central-circled.webp)
