HAL Id: halshs-01502001
https://halshs.archives-ouvertes.fr/halshs-01502001v2
Submitted on 31 Dec 2018
HAL is a multi-disciplinary open access archive for the deposit and dissemination of sci-entific research documents, whether they are pub-lished or not. The documents may come from teaching and research institutions in France or abroad, or from public or private research centers.
L’archive ouverte pluridisciplinaire HAL, est destinée au dépôt et à la diffusion de documents scientifiques de niveau recherche, publiés ou non, émanant des établissements d’enseignement et de recherche français ou étrangers, des laboratoires publics ou privés.
Employee stock ownership and the cost of capital
Nicolas Aubert, Alexander Kern, Xavier Hollandts
To cite this version:
Nicolas Aubert, Alexander Kern, Xavier Hollandts. Employee stock ownership and the cost of capital. Research in International Business and Finance, Elsevier, 2017, �10.1016/j.ribaf.2017.04.007�. �halshs-01502001v2�
Employee stock ownership and the cost of capital
1Nicolas AUBERT2 Alexander KERN3 Xavier HOLLANDTS4
Abstract
This paper investigates the relationship between employee stock ownership and the cost of capital, the main determinant of shareholder value creation computed through economic val-ue added (EVA). By reducing agency conflicts within the firm, we hypothesize that employ-ee share ownership reduces the firm’s cost of capital by affecting its two components, i.e. the cost of equity and the cost of debt. We test this hypothesis in France, a leading country in terms of employee ownership, based on a panel of the 120 largest listed companies for the 2000-2011 period. We find: (i) no significant relationship between employee stock owner-ship and the cost of equity; (ii) a negative curvilinear relationowner-ship between employee stock ownership and the cost of debt; (ii) a negative curvilinear relationship relationship between employee stock ownership and the weighted average cost of capital. These results suggest debtholders regard ESO as positive as long it is moderate because it shifts risk from them to employees and that this effect is still perceptible in the weighted average cost of capital.
Keywords: Shared capitalism, employee ownership, corporate governance, cost of equity, cost of debt, cost of capital, agency conflicts.
JEL: J33, J54, J63, L74, L85, M52
1 We wish to thank for their valuable comments the participants of the following conferences: 2016 French
ac-counting association conference, 2015 French finance association conference, the 2014 International corporate governance.
2 Aix-Marseille Univ, CERGAM, Puyricard, France. 3 Aix-Marseille Univ, CERGAM, Puyricard, France.
1. Introduction
Employee profit sharing and stock ownership allows “to take the workman permanently out the position in which his gain is his employer’s loss”. This assertion by renowned economist John Bates Clark5 (Clark 1907), quoted by Blasi and Kruse (2006) sums up the main goal of shared capitalism, i.e. reducing conflicts of interests between employees and employers. Kruse et al. (2010) define shared capitalism as “employment relations where the pay or wealth of workers is directly tied to workplace or firm performance”. They restrict this term to “plans that tie worker pay or wealth to the performance of their own workplace, whether at the level of the work group, establishment, or company” (p. 5). Employee ownership is the major form of shared capitalism since it is a situation in which employees own part of the firm’s equity. Through employee stock ownership schemes, employees can increase their personal wealth, and are more closely linked to the firm's success. However, the decision of implementing and developing employee ownership often lies with management. Two main motivations underlie managers’ decision to promote employee stock ownership: to incentivize employees, thus enhancing corporate performance; or to keep their position because of a tendency for employ-ee owners to vote in favor of the management in the case of a takeover threat (Aubert et al. 2014). Indeed, a large body of literature analyses whether employee ownership affects corpo-rate performance and corpocorpo-rate governance. From the performance perspective, improved attitudes at work may translate into better corporate performance. From the governance per-spective, the literature underlines employee ownership schemes as a potential entrenchment tool. This paper examines the relationship between employee stock ownership and the cost of capital, i.e. the weighted average cost of capital (WACC from now), compounded by both the cost or equity and the cost of debt. The WACC is the main determinant of shareholder value
creation, used in the computation of the economic value added (EVA from now)6. EVA is both and accounting and financial performance measure. Because of this hybrid feature, EVA becomes a popular measure of shareholder value creation. On the accounting side, the com-ponents of the EVA are the capital employed, the earnings before interest tax. On the econom-ic side, the main component of the EVA is the WACC usually calculated with asset preconom-icing techniques such as the capital asset pricing model. The WACC is also often used to value company assets through the discounted cash flows (DCF from now) method. Bancel et Mittoo (2013) survey 396 European corporate valuation experts belonging to the Chartered financial analyst institute and the the Société française des analystes financiers among others. 80% of these experts use the DCF method and use the capital asset pricing model to estimate the cost of equity. By reducing agency conflicts within the firm, we hypothesize that employee share ownership (ESO) reduces the cost of capital and subsequently, increases the EVA ceteris
pa-ribus. Barney adopted the same approach investigating separately the relationship between
employee ownership and the cost of equity on one hand (Barney, 1990a), and that of employ-ee ownership and the cost of debt on another hand (Barney, 1990b). These two costs are part of the cost of capital measured by the WACC. Based on Barney’s approach, our paper ex-pands the results of earlier studies thanks to a richer dataset. Indeed, Barney’s studies were limited to the electronics industry and based on a sample of Japanese firms. We use three de-pendent variables: the cost of equity, the cost of debt and the WACC i.e. a weighted measure of both two costs. From a corporate finance perspective, employee ownership is presented as an alternative way to fund business investment. From the agency perspective, employee own-ership could have a potential impact on the cost of capital. We assume that employee
6 The EVA formula is:
where
and
ship, a form of shared capitalism, tends to reduce conflicts that may arise between employees and managers, resulting in a lower cost of capital.
We test the relationship between employee ownership and the cost of financing based on a comprehensive sample of the largest French companies listed on the SBF 120 index between 2000 and 2011. France has features making it an interesting case to study: - a long tradition of shared capitalism that goes back to the 1960s; - a civil law system with robust worker em-ployment protection and specific governance features; - a market economy very opened to foreign investors.
Examining large French companies also allows us to study whether varying levels of shared capitalism (i.e employee ownership) impacts the cost of financing of French listed firms. France is often regarded as a leading country, with 3.7 million employee owners holding 37 billion euros in shares (FAS 2014). France is the only country in the world where profit shar-ing is mandatory for companies above 50 employees. Because profit sharshar-ing bonuses granted to employees are an important source of investment in employee ownership, it boosts the amount invested in employers’ stocks. According to the 2015 European Federation for Em-ployee Shareownership report (Mathieu, 2015), France is the first European country in terms of number of employee owners (more than 3 million) before the UK (around 2 million) and Germany (around 800,000). The EFES data reports that there are 8 million employee owners in the 31 European countries surveyed. The 2015 EFES report also points that France is the first European country in terms of the proportion of overall employees having employee own-ership. This proportion is 40% in France compared to 30% in the UK and 15% in Germany. France is also the first European country for the proportion of companies having significant employee ownership (more than 1% of the equity hold by employees). This proportion reach-es more than 80% for France, lreach-ess than 80% in the UK and around 40% in Germany when the European mean is 57%. Finally, France is also the first European country in terms of the total
amount of shares hold by employees with more than 100 Billion of euros before the UK with 85 Billion euros.
France is a civil law country whose legal system inspired several other countries according to Belot et al (2014). La Porta et al (2000) consider that the legal system is one of the principal remedies to the agency problem. They further argue that common law countries offer the best legal protection against majority shareholders whereas civil law countries’ protection is weak-er. They further argue that, among civil law countries, French law countries have the weakest protection. Regarding corporate governance system, French law mandates that employees of large publicly listed companies be allowed to elect directors for two reasons. First, privatized companies must appoint two or three (depending on board size) board seats for trade-union representatives. Second, the 2006 law makes also compulsory the appointment of board em-ployee owners representatives, if emem-ployee owners hold at least 3% of outstanding shares. Additionally, French law allows but does not mandate that listed firms may adopt a two-tiered supervisory and management board structure, as the German model. Taken together, these regulations and governance options have produced significant cross-sectional variation in the extent and type of employee ownership and board employee representation.
Despite its features of the civil law countries, France is very opened to foreign investors. 46.7% of the market value of the CAC 40 index companies was hold by foreign investors at the end of 2013. This proportion reached 42, 7% for all listed companies. More than half of the companies belonging to the CAC 40 index are actually controlled by foreign investors7. The CAC 40 companies are included in our dataset. The results show that employee owner-ship is not associated with the cost of equity and that there is a U shaped relationowner-ship between the cost of debt and ESO. This combined effects result in a U shaped relationship between ESO and the WACC. On the cost of debt side, our results suggest that debt holders regards
ESO - up to a certain level - as a way to shift risk from them to employees by making com-pensation policy more flexible. The rest of the paper is structured as follows: Section 2 anal-yses the literature on the relationship between employee ownership and the cost of capital as a combination of the cost of equity and the cost of debt. Section 3 focuses on methodology and data analysis. Section 4 presents the results. Results are discussed in section 5, and conclu-sions are drawn in section 6.
2. Literature Review
Employee ownership is a strategy which primarily focuses on offering company shares to employees. Such compensation plans are often used as a corporate finance and management strategy that may match the company’s interests with those of employees and shareholders. In order to promote employee ownership, many countries offer tax incentives.
In the academic literature, we find evidence for both bright and dark sides of employee own-ership: a bright side involving enhanced corporate performance, and a dark side leading to management entrenchment and decreased shareholder value. On the bright side, the literature emphasizes that positive effects of employee ownership on corporate performance are primar-ily due to enhanced work attitudes. Researchers in the field of human resource management set out to determine how employee ownership affects work attitudes in terms of implication, involvement, satisfaction, absenteeism, and turnover intention. Klein (1987) shows that em-ployee ownership increases worker motivation and satisfaction. Hence, emem-ployee owners show more positive attitudes (French, 1987; Klein, 1987; Rosen et al., 1986; Buchko 1992, 1993; Gamble et al., 2002; Kruse et al., 2010, 2012). They are more motivated, more satisfied, exhibit lower turnover and absenteeism rates. This generally translates into better corporate performance thanks to higher productivity and cost savings. Collective incentive plans such as employee share ownership schemes, are often accused of stimulating free-riding behaviors.
Based on a large survey of more than 40,000 employees, representative of the entire US work-ing population, Kruse et al. (2010) conclude that shared capitalism (includwork-ing employee own-ership) tends to neutralize free-riding behaviors. Given that employee stock ownership is a way for a firm to motivate workers, increase productivity and retain the workforce, it has ef-fects on corporate performance. Kruse and Blasi (1997) review a wide range of empirical tests on effects of employee stock ownership on performance (often measured in terms of productivity and profitability). Kruse (2002) summarizes results and findings from the empir-ical literature, suggesting either a positive or null effect of employee stock ownership on per-formance. This part of the literature points out the "bright side" of employee ownership, viewed as a "stabilizing force" that helps improve performance and ensure a business’s long-term survival (Blair et al., 2000).
Another body of literature on employee stock ownership focuses on its negative effects on corporate governance, i.e. the "dark side" of employee ownership. Employee stock ownership is regarded as a powerful entrenchment tool because it lowers the probability of a takeover (Shivdasani, 1993; Beatty, 1995) . According to Gamble (2000) and Benartzi et al. (2007), executive management uses employee ownership schemes to put shares in ”friendly hands''. The contention is that collusion between management and employee owners is something really natural. Pagano and Volpin (2005) state that: ”managers and workers are natural allies against takeover threats'' (2005:841). From the viewpoint of employees, takeovers and subse-quent mergers are often associated with layoffs. Employee ownership provides a voice to workers in order to try and prevent such layoffs. Faleye et al. (2006) use dichotomous and continuous variables to assess the effects of employee ownership, demonstrating that it nega-tively affects market valuation, long-term investment, research and development expenses, operating risk, sales growth, employment growth, total factor productivity, and labor produc-tivity. Some event studies evidence negative reactions of financial markets when employee
stock ownership plans (ESOPs) are implemented, in line with the management-entrenchment hypothesis (Chang, 1990; Chang and Mayers, 1992; Conte et al., 1996). Chaplinsky et Niehaus (1994) find that employee ownership may be even more powerful than poison pills or golden parachutes as takeover defense. Besides, Park and Song (1995) show that poison pills and golden parachutes are less frequently used when employee stock ownership plans are im-plemented. Rauh (2006) confirms that employee ownership has a deterrence effect on takeo-ver probabilities.
Considering the controversial perspective on employee ownership, we use an agency frame-work to link the puzzle pieces together regarding employee ownership and the cost of capital. To the best of our knowledge, the study by Aubert et al. (2014) is only one attempt to model the above mentioned bright (incentive effect) and dark sides (entrenchment mechanism) of employee ownership. They do not come up with a single solution. The possible solutions de-pend on the relative levels of management performance. Based on the parameter values, they underline that both good managers and bad ones are incentivized to use employee ownership as an entrenchment mechanism. Indeed, the best way to solve this kind of problem is to avoid a decision (to implement or increase employee ownership schemes) based on the sole discre-tion of managers. However, this model does not focus on the cost of capital as a market proxy of agency conflicts within the firm. Even though agency theory has as primary interests the conflicts of interest between shareholders and executive managers, Jensen et Meckling (1976) are obviously aware that it applies to all contractual arrangements within the firm: “Contrac-tual relations are the essence of the firm, not only with employees but with suppliers, custom-ers, creditors, and so on. The problem of agency costs and monitoring exists for all of these contracts” (p. 310). Focusing on managers/shareholders relationships Jensen et Meckling (1976) state that “shareholders will realize that the owner-manager’s interests will diverge
somewhat from theirs; hence, the price which they will pay for shares will reflect the monitor-ing costs and the effect of the divergence between the manager’s interest and theirs” (p. 313). In turn, agency conflicts will be reflected in the stock price changes and, subsequently, in the cost of equity. Barney (1990) argues that employee ownership may reduce agency costs since it is the binding link between the interests of both investors and employees. Like in the man-agers-shareholders relationship, the actions of employees will impact outside the stockhold-ers’ wealth. He suggests that employee ownership decreases agency costs within the compa-ny, through alignment of interests. Lower agency costs within the firm should result in a low-er cost of equity. Barney comes up with results from a sample of Japanese firms. Ivanov and Zaima (2011) confirm Barney’s findings showing that ESOPs’ adoptions by US firms be-tween 1994 and 2008 affected negatively their cost of capital through lowering the cost of equity. Based on the above mentioned literature, we consider that employee ownership has both positive and negative effects on agency costs: it leads to lower agency costs by increas-ing employees’ incentives to behave accordincreas-ing to shareholders’ interests; and to higher agen-cy costs by strengthening management entrenchment.
Recent empirical studies on the relationships between employee ownership and corporate per-formance tend to strengthen the validity of such assertions. Investigating the largest French companies listed over the 2000-2005 period, Guedri et Hollandts (2008) argue that ESO has an inverted U-shaped relationship with accounting-based measures of performance. This re-sult is also supported by a recent study by Kim et Ouimet (2014). According to them, small US firms offering an ESOP to their employees display good performance benefiting both em-ployees and shareholders. They also find that positive results are much weaker in large com-panies where employee ownership is often implemented for bad reasons: “conserving cash by substituting wages with employee shares or forming a worker-management alliance to thwart takeover bids” (p. 1). Taking into consideration the two conflicting effects of employee
own-ership, we expect to find a non-linear relationship between employee ownership and the cost of equity.
Hypothesis 1: There is a nonlinear relationship between employee ownership and the cost of equity.
In another paper, Barney (1990b) investigates how profit-sharing – another form of shared capitalism – affects the cost of debt. Profit-sharing is also regarded as a way of aligning inter-ests of stockholders with those of management, but also of decreasing potential agency con-flicts within the firm. Barney (1990b) argues that “when positive cash flow are threatened, firms can reduce the cost of doing business by reducing the size of bonuses paid to employ-ees. Such an action increases the likelihood that firms would be able without the secondary negative consequences of other cost saving activities, including laying off personnel. Such profit-sharing bonus compensation plans shift risk from debt holders to employees. In an effi-cient capital market, this shift will be reflected in a lower cost of debt” (p. 49). At the macroe-conomic level, this conception of shared capitalism arrangements as a way of making em-ployee compensation more flexible is consistent with the findings by Weitzman (1984) who argues that shared capitalism may decrease unemployment. Barney (1990b) also validates this hypothesis based on a sample of Japanese firms. Profit-sharing is well developed in France. Indeed, it is the first country in the world to make it compulsory for companies hiring over 50 employees. This obligation makes all the largest French listed firms eligible for profit-sharing. Assuming that there is a substitution effect between fixed salary and employee ownership, we may find the same negative relationship between employee ownership and the cost of debt as that evidenced by Barney (1990b).
Hypothesis 2: There is a negative relationship between employee ownership and the cost of debt.
Since the WACC is a combination of the cost of equity and of the cost of debt, the relation-ship between ESO and the WACC is undetermined.
3. Data and methodology
In this section, we present an empirical examination of the relationship between employee ownership and the cost of equity, between employee ownership and the cost of debt, and fi-nally between employee ownership and the WACC. We take into account variables that may affect this relationship and then test our research hypotheses based on the main French market index, the SBF 120 (over the 2000-2011 period).
3.1. Employee stock ownership in France
In France, there are five main forms of ESO according to Ginglinger et al. (2011). Firstly, direct employee ownership is characterized by employees buying shares of the company they are working for, at any given time at the given market price. Secondly, there is indirect stock ownership – called Fonds commun de placement d’entreprise (FCPE) – which is more com-plex and represents collective ownership of the company’s shares by employees. However, this common enterprise placement fund is a tool to motivate employees to participate in ESOP. Thus it is usually held for a certain period of time and only concerns shares that are reserved for employees. Thirdly, companies can also offer free stocks or free options to their employee. Fourthly, they have the option to give out shares at prices under their market val-ue. Therefore, the most popular method is to link the price to the length of time the shares will be held: if shares are held for five years, the discount is up to 20% of the market value; if they
are held for ten years, up to 30%. Fifthly, ESO basically combines the first four methods de-scribed above. Nonetheless, the most common way of implementing employee ownership in French corporations is through FCPE plans.
Our dataset is longitudinal, covering the period from 2000 to 2011. The sample of the re-search has been retrieved from the IODS DataCG Corporate Governance database (INSEAD OEE Data Services), using the SBF120 index to gather governance data, and the Bloomberg indexes to collect financial data. The same dataset was used by Ginglinger et al. (2011). The sample includes 118 unique companies covering 1,416 company*year observation over a pe-riod from 2000 until 2011. The research uses the biggest French corporations, since the SBF120 index includes the 120 largest firms by market capitalization and by trading volume of the Euronext Paris. Our final dataset excludes financial firms within GICS 40, since these banks, funds, insurance companies, and their employees, have different ownership patterns compared to that of other Global Industry Classification Standards (GICSs). Indeed, employ-ees of financial firms are constantly confronted with financial matters. Our final panel dataset uses 106 firms due to exclusion of financial firms and missing data.
3.2. Dependent variables
The cost of equity, the cost of debt and the WACC are collected from Bloomberg. All costs of capital are computed using the Capital Asset Pricing Model.
Cost of equity: the stockholders’ required rate of return on their investment in stocks,
comput-ed with the capital asset pricing model.
WACC: a weighted average of the cost of debt and the cost of equity. It is calculated using
government bond rates, a debt adjustment factor, the proportions of short and long term debt to total debt, and the stock's effective tax rate. The debt adjustment factor represents the aver-age yield above government bonds for a given rating class. The lower the rating, the higher the adjustment factor.
3.3. Independent and control variables
Employee ownership, our main independent variable, is defined as the percentage of company stocks owned by nonexecutive employees, relative to the total amount of company shares (Blasi et al., 1996; Gamble, 2000; Ginglinger et al., 2011). The literature underlines the need to include corporate governance variables to take into account the link between corporate governance and the cost of equity. Our sample, includes the board's structure, CEO duality, and ownership concentration. We added the board type because two-tiered boards tend to strengthen the supervisory board’s independence, which helps decrease the entrenchment and opportunistic attitudes of executives (Rose, 2005) . The dual structure is a dummy variable which takes 1 in the presence of a dual governance structure (supervisory and executive board), and 0 otherwise. Duality is also a dummy variable: it takes 1 when the executive of-ficer does not hold the position of chairman of the board. We included a measure of owner-ship concentration as a control variable since it may positively impact companies’ profit
mar-gins (Sanchez-Ballesta and Garcia-Meca, 2007) . We also used the percentage of equity hold by the major shareholder.
Other financial variables were also included: debt to equity ratio, return on assets, asset turno-ver, total assets, industry dummies, and price-to-book ratio. According to the agency theory, debt has a disciplinary impact by limiting the degree of managerial discretionary power. The return on assets ratio was used to assess firm performance. The ROA (return on assets) is an indicator of how profitable a company is relative to its total assets. It gives an idea as to how efficient management is at using its assets to generate earnings. The asset turnover ratio measures how efficiently the company uses its assets to generate revenue. We control for firm size as a determinant of performance, through economies of scale and market power (Beard and Dress, 1981). Firm size was measured by the number of total assets of the company. Ex-tensive research also stresses the need for an industry identifier, since industry types might have different effects (Mauri and Michaels, 1998; Short et al., 2007). Finally, the price-to-book ratio is used, which is the ratio of a stock's price divided by the price-to-book value per share (Guedri and Hollandts, 2008).
3.4. Methodology
Our research question was tackled using a panel dataset, based on the SBF120 index from 2000 to 2011. With panel data analysis, our models control for time-invariant omitted varia-bles that may bias observed relationships. We run Arellano et Bover (1995) general methods of moments (GMM) regressions and Blundell et Bond (1998) system GMM regressions. The first method estimates the models in levels with an orthogonal transformation and instruments
the endogenous variables with the variables in first differences. The second method estimates
simultaneously the models in first differences and levels and instruments the endogenous variables with the lagged variables in levels and in first differences. Even though these two
methods compute different estimators, they both use lagged values of the dependent variables as independent variables.
4. Results
4.1. Descriptive statistics
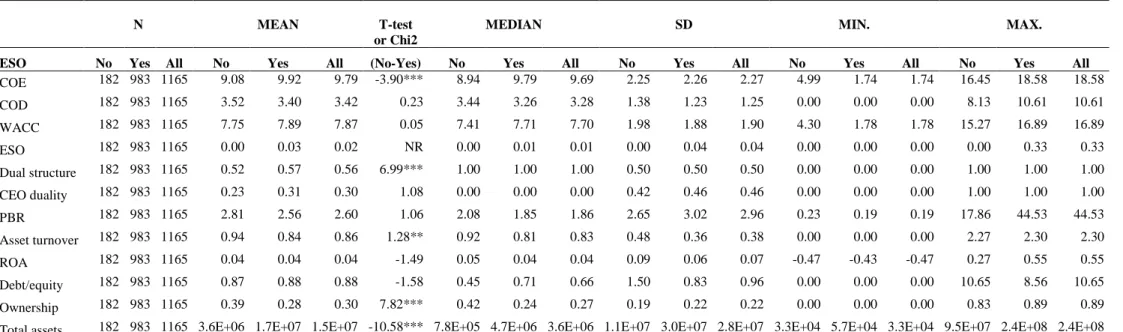
Table 1 in the appendix summarizes the descriptive statistics of all variables used. We report statistics for the two subsamples of companies with and without employee ownership. The mean of cost of equity is 9.79, with a standard deviation of 2.26, with a minimum cost of eq-uity and maximum cost of eqeq-uity of 1.74 and 18.58, respectively. The mean of cost of debt is 3.42, with a standard deviation of 1.25, with a minimum cost of debt and maximum cost of debt of 0 and 10.61, respectively. The mean of WACC is 7.87, with a standard deviation of 1.90, with a minimum WACC and maximum WACC of 1.78 and 16.89, respectively. Differ-ences between companies with and without employee ownership are significant (two groups t-test and chi2) for: the cost of equity (higher in ESO firms), the dual board structure dummy (more frequent in ESO firms), the ownership concentration (less in ESO firms) and the total assets (larger in ESO firms). The negative sign of the t-test associated with the cost of equity suggests that negative effects of ESO dominate its positive effects.
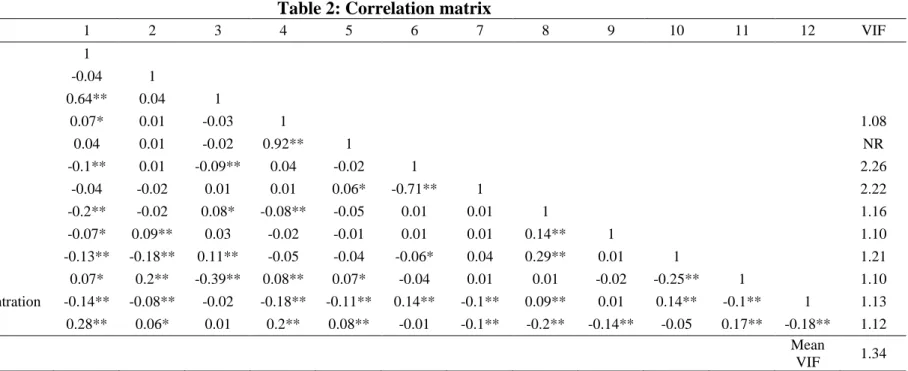
Table 2 in the appendix reports the correlation matrix between variables. A low variance in-flation factor (VIF) was evidenced, thereby excluding the presence of any multicolinearity. The VIF are reported in the table 2.
4.2. Regression analysis
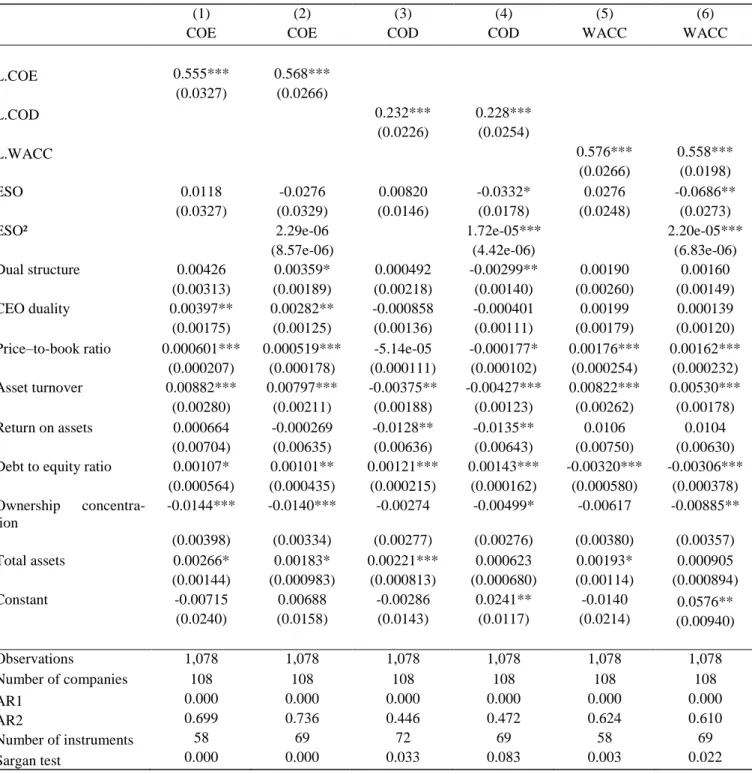
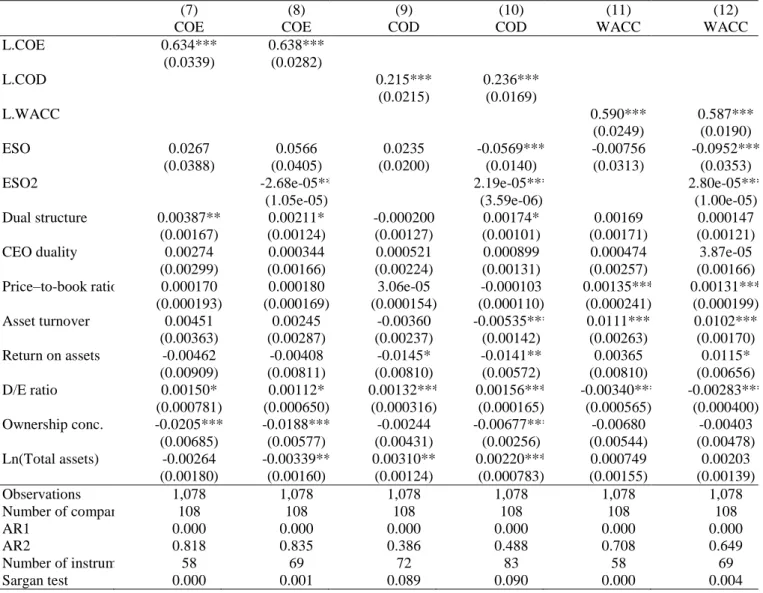
In order to validate our models, the GMM and system GMM regression estimates are dis-played tables 3 and 4. Our research design is based on the use of a panel dataset, including cross-section firm data from all industries: the sampled French companies were listed in the
SBF120 over the period from 2000 to 2011 (only excluding those operating in the financial industry; i.e. within GICS 40). In our research design, we resorted to a hierarchical approach for each one of the dependent variable: the cost of equity, the cost of debt and the WACC. The first model includes employee ownership as a endogeneous variable. In our second mod-el, we added employee ownership squared to test the nonlinear relationship between employee ownership and the cost of equity. Therefore, the regression analyses are presented as follows. Models 1, 2, 7 and 8 outline results of the analyses of the relationship between employee ownership and the cost of equity. Models 3, 4, 9 and 10 include results of the analyses of the relationship between employee ownership and the cost of debt. Models 5, 6, 11 and 12 show results of the analyses of the relationship between employee ownership and the WACC. Re-sults of the Arellano and Bover (1995) GMM regressions are displayed in table 3. ReRe-sults of the Blundell and Bond (1998) system GMM regressions are reported in the table 4. The Sargan overidentification tests are reported in both tables. It shows that the instruments used in the regressions are exogene. The AR(1) and AR(2) tests reported in the tables indicates the absence/presence of autocorrelations. In both tables, the results of AR(1) point to the absence of autocorrelations for the regressions involving the cost of equity, the cost of debt and the WACC. The values of AR(2) also reveal the absence of autocorrelations for the cost of equity, the cost of debt and the WACC in both tables. The results reported in the two tables are very consistent in terms of significance and signs associated to the coefficients. A slight difference can be mentioned for the cost of equity and the cost of debt. In model 8 (cost of equity curvi-linear regression), the coefficient associated to ESO2 is negative and significant whereas it is not significant in model 2. In both tables the coefficient associated to ESO is not significant. In model 10 (cost of debt curvilinear regression), the coefficient associated to ESO is signifi-cant at 1% whereas this rate is 10% in model 4.
Regarding the cost of equity (models 1, 2, 7, 8), ESO displays no significant coefficient in our first model. In our second model, none of the coefficients related to the ESO or ESO2 varia-bles are significant. We do not document a curvilinear relationship between the cost of equity and ESO. As for the cost of debt (models 3, 4, 9, 10), ESO is not associated to a significant coefficient in our first model. In our second model, ESO exhibits a negative and significant impact, while ESO² has a positive one. Results from our second model therefore show a non-linear relationship (U-shaped) between employee ownership and the cost of debt. Concerning the WACC (models 5, 6, 11, 12), although we do not find a direct relationship with ESO, our second model also documents a nonlinear relationship since the coefficient associated to ESO is negative and significant. As Barney (1990b) assumes with profit-sharing, employee owner-ship may shift risk from debt holders to employees, resulting in a decrease of the cost of debt. This effect is valid up to a certain percentage of equity hold by employees.
Several control variables exhibit significant coefficients: Dual structure: models 2, 7, 8, 10 (+), 4 (-); CEO duality: models 1 and 2(+); Price-to-book ratio: models 1, 2, 5, 6, 11, 12(+), 4(-); Asset turnover: models 1, 2, 5, 6(+), 3, 4(-); Return on assets: models 3, 4, 9, 10(-); Debt to equity ratio: models 1 to 4, 7 to 10(+), 5, 6, 11, 12(-); Ownership concentration: models 1, 2, 4, 6(-) and 7, 8, 10(-); Total assets: models 1 to 3, 5, 9, 10(+) and 8(-).
Several robustness tests were performed in order to examine the validity of results obtained. We conducted another robustness check excluding 2001 and 2008, both years of crisis. The results of this regression model are stable.We included the GICS 40 (finance sector) to our sample and found that the impact of financial institutions is relatively minor. Results remain stable. Hence, our model is valid in times of crisis and whatever the industries considered. Because representation on the board of directors is one of the French specificity, we tested how this variable could affect our results. We use the proportion of employee owners on the board as an independent variable. We run several regressions including ESO representation on
the board as an additional variable and computing an interaction effect (by multiplying ESO by ESO representation on the board). We do not find any significant relationship between ESO representation on the board and the dependent variables.
5. Discussion
The present research evidences: - no significant relationship between employee ownership and the cost of equity (models 1, 2, 7, 8); - a U-shaped relationship between employee owner-ship and the cost of debt (models 4 and 10); - a U-shaped relationowner-ship between ESO and the WACC (models 6 and 12). The first finding does not corroborate our first hypothesis but the second partially validates our second hypothesis. Although they do not validate totally our research hypotheses, our findings are innovative in several ways. Two early 90's papers by Barney (1990 a,b) investigated the relationship between a form of shared capitalism and the cost of financing before. One paper highlighted a negative relationship between ESO and the cost of equity and the second one found a negative relationship between profit-sharing and the cost of debt. Our research does not validate the first finding in France between 2000 and 2011 but confirm the second for ESO over the same period. In our case the negative relationship is only up to a certain level of employee ownership. The curvilinear effects we document are also valid for the WACC. Outside the US (Ivanov and Zaima 2011) and Japan (Barney 1990 a,b), our paper is the only attempt to investigate the relationship between ESO and the cost of capital to our knowledge. The empirical studies of Barney focused on a small number of Jap-anese firms. As for the US, it has very different features. Although ESO is widespread in the small and medium sized companies in the US, employee ownership is more developed in large listed corporations we included in our sample. This development in large corporations is the consequence of the privatizations of large State owned companies since the 1980s whereas in the US relative to other countries, employees are the driving force behind establishing
ESOPs (Clark and Philippatos 1998). Ivanov and Zaima (2011) find than ESOPs affect nega-tively the cost of capital through lowering the cost of equity. According to recent papers (Kim and Ouitmet 2014; Ginglinger et al. 2011), ESO is most efficient below 5 percent of the out-standing equity. Ginglinger et al. (2011) demonstrate that big French listed companies with a fair percentage of employee ownership plans have increased their corporation's value through greater efficiency and profitability. Our paper gives an alternative view, focusing on the cost of financing. We uncover a different relationship between employee ownership and the cost of financing. Our results differ from Barney (1990 a) who finds a negative relation between ESO and the cost of equity. Barney argue that this relationship is the consequence of ESO lowering agency costs within the firms. Regarding corporate performance, Guedri and Hollandts (2008) evidence an inverted U-shape of the relationship between employee owner-ship and firm performance, meaning that productivity increases up to a certain level, and de-creases after a given rate of employee ownership. Increased performance would theoretically lower the cost of equity and vice versa. We emphasize no significant relationship between ESO and the cost of equity and curvilinear negative link (U-shaped) between ESO and the cost of debt and between ESO and the WACC. Our research builds on the mixed results doc-umented by the academic literature on the effects of employee ownership. The literature is often pointing at the bright and the dark sides of ESO and our results confirm that these op-posing strengths are at work. Our research goes deeper in the understanding of shared capital-ism’s effects by showing that ESO affects the value of the firm through the cost of financing. Our results prove that shareholders and debtholders take into account ESO as a determinant of the cost of money they invest in a listed company. Either they consider ESO as a strength or as weakness. On the debtholders’ side and according to our results, we find that there should be an optimal level of employee ownership below and above which ESO increases the risk. Overall, our results show that conflicting forces are at work as suggested by the theoretical
model of Aubert et al. (2014). Our results are in line with some recent papers that underline that ESO exhibit curvilinear relationship with major performance variables. Findings by Kim and Ouimet (2014) indicate that small ESOPs (under 5% of shares) tend to increase the size of the overall economic pie, benefitting both employees and shareholders. Faleye et al. (2006) show that significant employee ownership (over 5% of share capital) pushes away rather than towards shareholder-value maximization in terms of corporate performance, valuation, in-vestment and risks. Similar results were found by Guedri and Hollandts (2008), Aubert et al. (2014) in the French context. In this context, our results on the relationship between employee stock ownership and the cost of financing also exhibits mixed results.
From the shareholders’ point, negative and positive aspects seem to cancel each other. As far as the WACC is concerned – and having in mind that the WACC is a weighted average of the cost of equity and the cost of debt –, our findings are the consequence of the two conflicting effects of ESO. In other words, the bright side of employee ownership counterbalances its dark side up to a certain level of ESO above which ESO affects negatively shareholder value maximization. Despite our focus on the French listed companies, we believe our findings have implications for other countries because France is very exposed to foreign investors and it has an intermediary form of governance. Employee ownership is a highly developed system in France which does not exist in that form in other European countries. In times of crisis or when the company is being sold, it would be beneficial if a group of employees bought a sig-nificant number of shares in order to keep the company running. This would benefit both them and the wider economy. Hence, it would be appropriate to develop this French system into a general European scheme which could be applied by companies operating in EU mem-ber states.
We cannot exclude that our results are driven by the data. Our results regarding the cost of equity have two possible explanations. Although it is commonly used as a measure of
em-ployee ownership, our dependent variable does not measure how significant ownership is for each worker and how ownership is spread among the employees. On one hand, corporations may have given only a small amount of shares to each employee, whom are not positively motivated. Employee motivation does not increase, and therefore productivity effects remain low. Hence, for the cost of equity, the benefits are offset by the costs. In fact, the administra-tive procedures required to give out shares to employees, to manage accounting actions, and to align stakeholders’ interests, which may lead to lower cost of equity, are pricy. On the other hand, the shares given out to employees may have been given out only to executives and management. Nevertheless, French context is characterized by broad-based ESO schemes (Ginglinger et al., 2011) and we believe that our variables fairly capture ESO and broadly, the level of "shared capitalism" for the companies included in our dataset. Regarding our theoreti-cal framework mainly rooted in agency theory, our paper suggests that ESO, due to his com-plex pattern, can be seen as a double edged-sword. The dark side of ESO is highlighted by several papers. By giving employees a voice in corporate governance and corporate decision-making, ESO may have a negative impact. The voice of employee owners can be split in two ways: their equity ownership and their potential implication at the board level via board em-ployee-ownership directors. Regarding equity ownership by employees, the "natural alliance" between employees and managers (Hellwig 2000) encourages CEOs to establish implicit tracts with employee shareholders (Pagano et Volpin 2005) in exchange for a "friendly" con-trol of employee owners (Gamble 2000 ; Benartzi et al. 2007). Faleye et al. (2006) underline that the "dark side" of employee ownership leads to a bilateral entrenchment: CEOs may be more easily entrenched with employee ownership, but employees also tend to entrench them-selves, benefitting from the CEOs' protection, e.g. against layoffs (Atanassov et Kim 2009). Regarding board employee representation, empirical results in the German context (Fauver et Fuerst 2006) with mandatory board-employee directors do not document such a negative
im-pact. In the French context, results from Ginglinger et al. (2011) underline that the presence of directors elected by employee shareholders at the board level increase firm valuation and profitability.
The bright side perspective emphasize that ESO plays a role by aligning shareholders and employees’ interests and favors the rise of the "shared corporation" (Kruse et al. 2010) by sharing the value (Porter et Kramer 2011). ESO schemes clearly promote a more equitable firm that contributes to reward employees regarding their individual and collective contribu-tion to corporate and economic performance.
Beyond this contrasted view of ESO ‒ a major form of "shared capitalism" ‒, it can be seen as an evidence of a recent evolution of capitalism. Blair (1999), Rajan and Zingales (1998, 2000, 2001) explicitly mentioned employee ownership as an evidence of the evolution of the nature of the corporation and the nature of capitalism. By developing ESO schemes within firms, governments and executive managers try to address the actual modern firm environ-ment, characterized by intellectual and human capital prevalence (Asher et al. 2005). As Blair and Stout (1999) explain: “the key assets a corporation uses in production is intellectual capi-tal – that is, the knowledge and experience residing in the minds of its employees, rather than the hands of its shareholders” (p. 261). In a knowledge-intensive economy, specific human capital appears to be the most important asset in competitive advantage creation. Thus em-ployees, like shareholders, matter for firm governance. Arguably, employees should play a significant role in corporate governance but also in the financing of the company.
6. Conclusion
Our study is the first since Barney's papers (1990a,b) investigating the relationship between ESO and the cost of financing. We examined our research question based on a panel dataset, and found mixed results. Our paper finds that ESO has: no significant relationship with the
cost of equity; a negative curvilinear relationship (U-shaped) with the cost of debt; a negative curvilinear relationship (U-shaped) with the weighted average cost of capital.
Our mixed results can be explained by the complex pattern offered by employee stock owner-ship. It can be either interpreted as the recognition of human capital investment, in line with recent evolution of companies and capitalism or more closely as a corporate financing tool with corporate governance impacts. Our results, based on a French sample, show a positive impact of employee ownership on the cost of debt that reduces the cost of capital. In other words, the bright side of employee ownership surpasses its dark side up to a certain level. Our results and our paper must be also understood in a broader context of the rise and the preva-lence of human capital. As pointed out by major researchers and practitioners, ESO can be an answer to address the question of the recognition and the implication of employee in the mod-ern firms. Employee motivation, participation, and communication increase with higher levels of employee ownership. Therefore, ESO can reduce the agency costs and risks beyond a cer-tain level of employee ownership, which reflects for example in a lower cost of capital. Over-all, in employee ownership organizations, for example, better work conditions may mitigate the unaligned interests of the different stakeholders (Faleye et Trahan 2011). Further research is required to know more about such a relationship.
23 Appendix
Table 1: Descriptive statistics of the variables included in the regression analyses
N MEAN T-test or Chi2 MEDIAN SD MIN. MAX.
ESO No Yes All No Yes All (No-Yes) No Yes All No Yes All No Yes All No Yes All
COE 182 983 1165 9.08 9.92 9.79 -3.90*** 8.94 9.79 9.69 2.25 2.26 2.27 4.99 1.74 1.74 16.45 18.58 18.58 COD 182 983 1165 3.52 3.40 3.42 0.23 3.44 3.26 3.28 1.38 1.23 1.25 0.00 0.00 0.00 8.13 10.61 10.61 WACC 182 983 1165 7.75 7.89 7.87 0.05 7.41 7.71 7.70 1.98 1.88 1.90 4.30 1.78 1.78 15.27 16.89 16.89 ESO 182 983 1165 0.00 0.03 0.02 NR 0.00 0.01 0.01 0.00 0.04 0.04 0.00 0.00 0.00 0.00 0.33 0.33 Dual structure 182 983 1165 0.52 0.57 0.56 6.99*** 1.00 1.00 1.00 0.50 0.50 0.50 0.00 0.00 0.00 1.00 1.00 1.00 CEO duality 182 983 1165 0.23 0.31 0.30 1.08 0.00 0.00 0.00 0.42 0.46 0.46 0.00 0.00 0.00 1.00 1.00 1.00 PBR 182 983 1165 2.81 2.56 2.60 1.06 2.08 1.85 1.86 2.65 3.02 2.96 0.23 0.19 0.19 17.86 44.53 44.53 Asset turnover 182 983 1165 0.94 0.84 0.86 1.28** 0.92 0.81 0.83 0.48 0.36 0.38 0.00 0.00 0.00 2.27 2.30 2.30 ROA 182 983 1165 0.04 0.04 0.04 -1.49 0.05 0.04 0.04 0.09 0.06 0.07 -0.47 -0.43 -0.47 0.27 0.55 0.55 Debt/equity 182 983 1165 0.87 0.88 0.88 -1.58 0.45 0.71 0.66 1.50 0.83 0.96 0.00 0.00 0.00 10.65 8.56 10.65 Ownership 182 983 1165 0.39 0.28 0.30 7.82*** 0.42 0.24 0.27 0.19 0.22 0.22 0.00 0.00 0.00 0.83 0.89 0.89 Total assets 182 983 1165 3.6E+06 1.7E+07 1.5E+07 -10.58*** 7.8E+05 4.7E+06 3.6E+06 1.1E+07 3.0E+07 2.8E+07 3.3E+04 5.7E+04 3.3E+04 9.5E+07 2.4E+08 2.4E+08
24
Table 2: Correlation matrix
1 2 3 4 5 6 7 8 9 10 11 12 VIF 1. COE 1 2. COD -0.04 1 3. WACC 0.64** 0.04 1 4. ESO 0.07* 0.01 -0.03 1 1.08 5. ESO² 0.04 0.01 -0.02 0.92** 1 NR 6. CEO duality -0.1** 0.01 -0.09** 0.04 -0.02 1 2.26 7. Dual structure -0.04 -0.02 0.01 0.01 0.06* -0.71** 1 2.22 8. PBR -0.2** -0.02 0.08* -0.08** -0.05 0.01 0.01 1 1.16 9. Asset turnover -0.07* 0.09** 0.03 -0.02 -0.01 0.01 0.01 0.14** 1 1.10 10. ROA -0.13** -0.18** 0.11** -0.05 -0.04 -0.06* 0.04 0.29** 0.01 1 1.21 11. Debt/equity 0.07* 0.2** -0.39** 0.08** 0.07* -0.04 0.01 0.01 -0.02 -0.25** 1 1.10 12. Ownership concentration -0.14** -0.08** -0.02 -0.18** -0.11** 0.14** -0.1** 0.09** 0.01 0.14** -0.1** 1 1.13 13. Total assets 0.28** 0.06* 0.01 0.2** 0.08** -0.01 -0.1** -0.2** -0.14** -0.05 0.17** -0.18** 1.12 Mean VIF 1.34 Notes: * p<0.05, ** p<0.01.
25
Table 3: the relationship between employee ownership and the cost of capital (2000-2011) - Arellano et Bover (1995) GMM regressions
Notes: L.COE is the lagged value of the cost of equity. L.COD is the lagged value of the cost of debt. L.WACC is the lagged value of the WACC. ESO is the percentage of shares held by employees. ESO2 is ESO squared. DUAL STRUCTURE is a dummy variable that takes the value of 1 in the presence of a dual structure (supervisory board and executive board). CEO DUALITY is a dummy variable that takes the value of 1 if the CEO also holds the position of chairman of the board. PBR is the price–to-book ratio computed by dividing the market value by the book value of the firm. ROA is the return on assets. DEBT/EQUITY is the total debt-divided by the total equity. OWNERSHIP CONCENTRATION refers to the percentage of the equity hold by the first shareholder. TOTAL ASSETS is the total value of the assets of the firm. Standard errors in parentheses *** p<0.01, ** p<0.05, * p<0.1
(1) (2) (3) (4) (5) (6)
COE COE COD COD WACC WACC
L.COE 0.555*** 0.568*** (0.0327) (0.0266) L.COD 0.232*** 0.228*** (0.0226) (0.0254) L.WACC 0.576*** 0.558*** (0.0266) (0.0198) ESO 0.0118 -0.0276 0.00820 -0.0332* 0.0276 -0.0686** (0.0327) (0.0329) (0.0146) (0.0178) (0.0248) (0.0273)
ESO² 2.29e-06 1.72e-05*** 2.20e-05***
(8.57e-06) (4.42e-06) (6.83e-06) Dual structure 0.00426 0.00359* 0.000492 -0.00299** 0.00190 0.00160
(0.00313) (0.00189) (0.00218) (0.00140) (0.00260) (0.00149) CEO duality 0.00397** 0.00282** -0.000858 -0.000401 0.00199 0.000139 (0.00175) (0.00125) (0.00136) (0.00111) (0.00179) (0.00120) Price–to-book ratio 0.000601*** 0.000519*** -5.14e-05 -0.000177* 0.00176*** 0.00162***
(0.000207) (0.000178) (0.000111) (0.000102) (0.000254) (0.000232) Asset turnover 0.00882*** 0.00797*** -0.00375** -0.00427*** 0.00822*** 0.00530*** (0.00280) (0.00211) (0.00188) (0.00123) (0.00262) (0.00178) Return on assets 0.000664 -0.000269 -0.0128** -0.0135** 0.0106 0.0104
(0.00704) (0.00635) (0.00636) (0.00643) (0.00750) (0.00630) Debt to equity ratio 0.00107* 0.00101** 0.00121*** 0.00143*** -0.00320*** -0.00306***
(0.000564) (0.000435) (0.000215) (0.000162) (0.000580) (0.000378) Ownership concentra-tion -0.0144*** -0.0140*** -0.00274 -0.00499* -0.00617 -0.00885** (0.00398) (0.00334) (0.00277) (0.00276) (0.00380) (0.00357) Total assets 0.00266* 0.00183* 0.00221*** 0.000623 0.00193* 0.000905 (0.00144) (0.000983) (0.000813) (0.000680) (0.00114) (0.000894) Constant -0.00715 0.00688 -0.00286 0.0241** -0.0140 0.0576** (0.0240) (0.0158) (0.0143) (0.0117) (0.0214) (0.00940) Observations 1,078 1,078 1,078 1,078 1,078 1,078 Number of companies 108 108 108 108 108 108 AR1 0.000 0.000 0.000 0.000 0.000 0.000 AR2 0.699 0.736 0.446 0.472 0.624 0.610 Number of instruments 58 69 72 69 58 69 Sargan test 0.000 0.000 0.033 0.083 0.003 0.022
26
Table 4: the relationship between employee ownership and the cost of capital (2000-2011) - Blundell et Bond (1998) system GMM regressions
Notes: L.COE is the lagged value of the cost of equity. L.COD is the lagged value of the cost of debt. L.WACC is the lagged value of the WACC. ESO is the percentage of shares held by employees. ESO2 is ESO squared. DUAL STRUCTURE is a dummy variable that takes the value of 1 in the presence of a dual structure (supervisory board and executive board). CEO DUALITY is a dummy variable that takes the value of 1 if the CEO also holds the position of chairman of the board. PBR is the price–to-book ratio computed by dividing the market value by the book value of the firm. ROA is the return on assets. DEBT/EQUITY is the total debt-divided by the total equity. OWNERSHIP CONCENTRATION refers to the percentage of the equity hold by the first shareholder. TOTAL ASSETS is the total value of the assets of the firm. Standard errors in parentheses *** p<0.01, ** p<0.05, * p<0.1
(7) (8) (9) (10) (11) (12)
COE COE COD COD WACC WACC
L.COE 0.634*** 0.638*** (0.0339) (0.0282) L.COD 0.215*** 0.236*** (0.0215) (0.0169) L.WACC 0.590*** 0.587*** (0.0249) (0.0190) ESO 0.0267 0.0566 0.0235 -0.0569*** -0.00756 -0.0952*** (0.0388) (0.0405) (0.0200) (0.0140) (0.0313) (0.0353)
ESO2 -2.68e-05** 2.19e-05*** 2.80e-05***
(1.05e-05) (3.59e-06) (1.00e-05) Dual structure 0.00387** 0.00211* -0.000200 0.00174* 0.00169 0.000147
(0.00167) (0.00124) (0.00127) (0.00101) (0.00171) (0.00121) CEO duality 0.00274 0.000344 0.000521 0.000899 0.000474 3.87e-05 (0.00299) (0.00166) (0.00224) (0.00131) (0.00257) (0.00166) Price–to-book ratio 0.000170 0.000180 3.06e-05 -0.000103 0.00135*** 0.00131***
(0.000193) (0.000169) (0.000154) (0.000110) (0.000241) (0.000199) Asset turnover 0.00451 0.00245 -0.00360 -0.00535*** 0.0111*** 0.0102*** (0.00363) (0.00287) (0.00237) (0.00142) (0.00263) (0.00170) Return on assets -0.00462 -0.00408 -0.0145* -0.0141** 0.00365 0.0115* (0.00909) (0.00811) (0.00810) (0.00572) (0.00810) (0.00656) D/E ratio 0.00150* 0.00112* 0.00132*** 0.00156*** -0.00340*** -0.00283*** (0.000781) (0.000650) (0.000316) (0.000165) (0.000565) (0.000400) Ownership conc. -0.0205*** -0.0188*** -0.00244 -0.00677*** -0.00680 -0.00403 (0.00685) (0.00577) (0.00431) (0.00256) (0.00544) (0.00478) Ln(Total assets) -0.00264 -0.00339** 0.00310** 0.00220*** 0.000749 0.00203 (0.00180) (0.00160) (0.00124) (0.000783) (0.00155) (0.00139) Observations 1,078 1,078 1,078 1,078 1,078 1,078 Number of companies 108 108 108 108 108 108 AR1 0.000 0.000 0.000 0.000 0.000 0.000 AR2 0.818 0.835 0.386 0.488 0.708 0.649 Number of instruments 58 69 72 83 58 69 Sargan test 0.000 0.001 0.089 0.090 0.000 0.004
27 References
Arellano, M., Bover, O. (1995). Another look at the instrumental variable estimation of error-components models. Journal of econometrics 68 (1): 29-51.
Asher, C. C., Mahoney, J. M., Mahoney, J. T. (2005). Towards a property rights foundation for a stakeholder theory of the firm. Journal of Management & Governance 9 (1): 5-32. Atanassov, J., Kim, E. H. (2009). Labor and corporate governance: International evidence
from restructuring decisions. Journal of Finance 64 (1): 341-374.
Aubert, N., Garnotel, G., Lapied, A., Rousseau, P. (2014). Employee ownership: A theoretical and empirical investigation of management entrenchment vs. Reward management.
Economic Modelling 40: 423-434.
Bancel, F., Mittoo, U. R. (2013) In Analyse financière, Vol. 48 Paris, pp. 80-83.
Barney, J. B. (1990a). Employee stock ownership and the cost of equity in japanese electronic firms. Organization Studies 11 (3): 353-372.
Barney, J. B. (1990b). Profit sharing bonuses and the cost of debt: Business finance and compensation policy in japanese electronics firms. Asia Pacific Journal of Management 7 (1): 49-64.
Beard, D. W., Dess, G. G. (1981). Corporate-level strategy, business-level strategy, and firm performance. Academy of management Journal 24 (4): 663-688.
Beatty, A. (1995). The cash flow and informational effects of employee stock ownership plans. Journal of Financial Economics 38 (2): 211-240.
Belot, F., Ginglinger, E., Slovin, M. B., & Sushka, M. E. (2014). Freedom of choice between unitary and two-tier boards: An empirical analysis. Journal of Financial Economics, 112(3), 364-385.
Benartzi, S., Thaler, R. H., Utkus, S. P., Sunstein, C. R. (2007). The law and economics of company stock in 401 (k) plans. Journal of Law and Economics 50 (1): 45-79.
Blair, M. M. (1999). Firm-specific human capital and theories of the firm. In Employees and
corporate governance (Eds, Blair, M. M., Roe, M. J.). Washington, DC: Brookings
Institution Press, 58-90.
Blair, M. M., Kruse, D. L., Blasi, J. R. (2000). Employee ownership: An unstable form or a stabilizing force? In The new relationship: Human capital in the american corporation (Ed, Blair, M. M. K., Thomas A.). Washington D.C.: Brookings Institution Press, 241-298. Blair, M. M., Stout, L. A. (1999). A team production theory of corporate law. Virginia Law
Review: 247-328.
Blasi, J., Conte, M., Kruse, D. (1996). Employee stock ownership and corporate performance among public companies. Industrial and Labor Relations Review 50 (1): 60-79.
Blasi, J., Kruse, D. (2006). Are diversification and employee ownership incompatible?
Journal of Employee Ownership Law and Finance 18 (4): 19-38.
Blundell, R., Bond, S. (1998). Initial conditions and moment restrictions in dynamic panel data models. Journal of econometrics 87 (1): 115-143.
Buchko, A. A. (1992). Employee ownership, attitudes, and turnover: An empirical assessment. Human Relations 45 (7): 711-733.
Buchko, A. A. (1993). The effects of employee ownership on employee attitudes: An integrated causal model and path analysis. Journal of Management Studies 30 (4): 633-657. Chang, S. (1990). Employee stock ownership plans and shareholder wealth: An empirical
investigation. Financial Management 19 (1): 48-58.
Chang, S., Mayers, D. (1992). Managerial vote ownership and shareholder wealth: Evidence from employee stock ownership plans. Journal of Financial Economics 32 (1): 103-131.
28
Chaplinsky, S., Niehaus, G. (1994). The role of esops in takeover contests. Journal of Finance 49 (4): 1451-1470.
Clark, J. B. (1907). The philosophy of wealth: Economic principles newly formulated. Ginn & Company.
Clark, R. W., & Philippatos, G. C. (1998). Employee stock ownership plans (ESOPs): an international comparison and analysis. Managerial Finance, 24(4), 19.
Conte, M. A., Blasi, J., Kruse, D., Jampani, R. (1996). Financial returns of public esop companies: Investor effects vs. Manager effects. Financial Analysts Journal 52 (4): 51-61. Faleye, O., Mehrotra, V., Morck, R. (2006). When labor has a voice in corporate governance.
Journal of Financial & Quantitative Analysis 41 (3): 489-510.
Faleye, O., Trahan, E. A. (2011). Labor-friendly corporate practices: Is what is good for employees good for shareholders? Journal of Business Ethics 101 (1): 1-27.
FAS. (2014). Guide de l'épargnant et de l'actionnaire salarié. Paris Aumage éditions.
Fauver, L., Fuerst, M. E. (2006). Does good corporate governance include employee representation? Evidence from german corporate boards. Journal of Financial Economics 82 (3): 673-710.
French, J. L. (1987). Employee perspectives on stock ownership: Financial investment or mechanism of control? Academy of Management Review 12 (3): 427-435.
Gamble, J. E. (2000). Management commitment to innovation and esop stock concentration.
Journal of Business Venturing 15 (5-6): 433-447.
Gamble, J. E., Culpepper, R., Blubaugh, M. G. (2002). Esops and employee attitudes - the importance of empowerment and financial value. Personnel Review 31 (1-2): 9-26.
Ginglinger, E., Megginson, W., Waxin, T. (2011). Employee ownership, board representation, and corporate financial policies. Journal of Corporate Finance 17 (4): 868-887.
Guedri, Z., Hollandts, X. (2008). Beyond dichotomy: The curvilinear impact of employee ownership on firm performance. Corporate governance: an international review 16 (5): 460-474.
Hellwig, M. (2000). On the economics and politics of corporate finance and corporate control. In Corporate governance : Theoretical and empirical perspectives (Ed, Vives, X.). Cambridge, UK: Cambridge University Press.
Ivanov, S. I., & Zaima, J. K. (2011). Analysis of the effects of ESOP adoption on the company cost of capital. Managerial Finance, 37(2), 173-188.
Jensen, M. C., Meckling, W. H. (1976). Theory of the firm: Managerial behavior, agency costs and ownership structure. Journal of Financial Economics 3 (4): 305-360.
Kim, E. H., Ouimet, P. (2014). Broad-based employee stock ownership: Motives and outcomes. Journal of Finance 69 (3): 1273-1319.
Klein, K. J. (1987). Employee stock ownership and employee attitudes: A test of three models. Journal of Applied Psychology 72 (2): 319-332.
Kruse, D. (2002). Research evidence on the prevalence and effects of employee ownership.
Journal of Employee Ownership Law and Finance 14 (4): 65-90.
Kruse, D., Blasi, J., Freeman, R. (2012). Does linking worker pay to firm performance help the best firms to do even better? National Bureau of Economic Research 17745.
Kruse, D., Freeman, R. B., Blasi, J. R. (Eds.) (2010). Shared capitalism at work : Employee
ownership, profit and gain sharing, and broad-based stock options. The University of
29
Kruse, D. L., Blasi, J. R. (1997). Employee ownership, employee attitudes, and firm performance. In The human resource management handbook, part i (Ed, David Lewin, D. J. B. M., and Mahmood A. Zaidi). Greenwich: JAI Press, 113-152.
La Porta, R., Lopez-de-Silanes, F., Shleifer, A., & Vishny, R. (2000). Investor protection and corporate governance. Journal of financial economics, 58(1), 3-27.
Mathieu, M. (2015). Annual economic survey of employee ownership in European countries. European Federation for Employee Shareownership.
Mauri, A. J., Michaels, M. P. (1998). Firm and industry effects within strategic management: An empirical examination. Strategic Management Journal 19 (3): 211-219.
Pagano, M., Volpin, P. F. (2005). Managers, workers, and corporate control. Journal of
Finance 60 (2): 841-868.
Park, N. K., Mezias, J. M., Song, J. (2004). A resource-based view of strategic alliances and firm value in the electronic marketplace. Journal of Management 30 (1): 7-27.
Park, S., Song, M. H. (1995). Employee stock ownership plans, firm performance, and monitoring by outside blockholders. Financial Management 24 (4): 52-65.
Porter, M. E., Kramer, M. R. (2011). Creating shared value. Harvard business review 89 (1/2): 62-77.
Rajan, R., Zingales, L. (2000). The governance of the new enterprise. In Corporate
governance: Theoretical and empirical perspectives (Ed, Vives, X.). Cambridge: Cambridge
University Press, 201-227.
Rajan, R. G., Zingales, L. (1998). Power in the theory of the firm. Quarterly Journal of
Economics 113: 387-432.
Rajan, R. G., Zingales, L. (2001). The firm as a dedicated hierarchy: A theory of the origins and growth of firms. The Quarterly Journal of Economics 116 (3): 805-851.
Rauh, J. D. (2006). Own company stock in defined contribution pension plans: A takeover defense? Journal of Financial Economics 81 (2): 379-410.
Rose, C. (2005). The composition of semi‐two‐tier corporate boards and firm performance.
Corporate Governance: An International Review 13 (5): 691-701.
Rosen, C. M., Klein, K. J., Young, K. M. (1986). Employee ownership in america: The equity
solution. Lexington, MA: Lexington Books.
Sánchez‐Ballesta, J. P., García‐Meca, E. (2007). Ownership structure, discretionary accruals and the informativeness of earnings. Corporate Governance: An International Review 15 (4): 677-691.
Shivdasani, A. (1993). Board composition, ownership structure, and hostile takeovers.
Journal of Accounting and Economics 16: 167-198.
Short, J. C., Ketchen, D. J., Palmer, T. B., Hult, G. T. M. (2007). Firm, strategic group, and industry influences on performance. Strategic Management Journal 28 (2): 147-167.
Weitzman, M. L. (1984). The share economy: Conquering stagflation. Cambridge, MA and London: Harvard University Press.