HAL Id: hal-02444498
https://hal.archives-ouvertes.fr/hal-02444498
Submitted on 17 Jan 2020HAL is a multi-disciplinary open access archive for the deposit and dissemination of sci-entific research documents, whether they are pub-lished or not. The documents may come from teaching and research institutions in France or
L’archive ouverte pluridisciplinaire HAL, est destinée au dépôt et à la diffusion de documents scientifiques de niveau recherche, publiés ou non, émanant des établissements d’enseignement et de recherche français ou étrangers, des laboratoires
A Long Noncoding RNA lincRNA-EPS Acts as a
Transcriptional Brake to Restrain Inflammation
Maninjay Atianand, Wenqian Hu, Ansuman Satpathy, Ying Shen, Emiliano
Ricci, Juan Alvarez-Dominguez, Ankit Bhatta, Stefan Schattgen, Jason
Mcgowan, Juliana Blin, et al.
To cite this version:
Maninjay Atianand, Wenqian Hu, Ansuman Satpathy, Ying Shen, Emiliano Ricci, et al.. A Long Non-coding RNA lincRNA-EPS Acts as a Transcriptional Brake to Restrain Inflammation. Cell, Elsevier, 2016, 165 (7), pp.1672-1685. �10.1016/j.cell.2016.05.075�. �hal-02444498�
A long noncoding RNA lincRNA-EPS acts as a transcriptional
brake to restrain inflammation
Maninjay K. Atianand1, Wenqian Hu2,3, Ansuman T. Satpathy4, Ying Shen4, Emiliano P.
Ricci5,6, Juan R. Alvarez-Dominguez2, Ankit Bhatta1, Stefan A. Schattgen1, Jason D. McGowan1, Juliana Blin1, Joerg E. Braun5, Pallavi Gandhi1, Melissa J. Moore5, Howard Y.
Chang4, Harvey F. Lodish2, Daniel R. Caffrey1, and Katherine A. Fitzgerald1,7
1Program in Innate Immunity, University of Massachusetts Medical School, Worcester, MA 01605, USA
2Whitehead Institute; Massachusetts institute of technology (MIT), Cambridge, MA, USA
4Center for Personal Dynamic Regulomes and Program in Epithelial Biology, Stanford University School of Medicine, Stanford, CA 94305, USA
5Howard Hughes Medical Institute, and Department of Biochemistry and Pharmacology, University of Massachusetts Medical School, Worcester, MA, USA
7Centre for Molecular Inflammation Research, Department of Cancer Research and Molecular Medicine, NTNU, 7491 Trondheim, Norway
SUMMARY
Long intergenic noncoding RNAs (lincRNA) are important regulators of gene expression. Although lincRNAs are expressed in immune cells, their functions in immunity are largely unexplored. Here we identify an immunoregulatory lincRNA, lincRNA-EPS, that is precisely regulated in macrophages to control the expression of immune response genes (IRGs).
Transcriptome analysis of macrophages from lincRNA-EPS-deficient mice, combined with gain-of-function and rescue experiments, revealed a specific role for this lincRNA in restraining IRG expression. Consistently, lincRNA-EPS-deficient mice manifest enhanced inflammation and lethality following endotoxin challenge in vivo. lincRNA-EPS associates with chromatin at
Correspondence: Katherine A. Fitzgerald, Program in Innate Immunity, University of Massachusetts Medical School, Worcester, MA
01605. 508.856.6518 (ph), 508.856.8447 (fax), [email protected].
3Current address: Department of Biochemistry and Molecular Biology, Mayo Clinic, Rochester, MN, USA
6Current address: Centre International de Recherche en Infectiologie, Ecole Normale Supérieure de Lyon, Université de Lyon, 69364 Lyon, France
Publisher's Disclaimer: This is a PDF file of an unedited manuscript that has been accepted for publication. As a service to our
customers we are providing this early version of the manuscript. The manuscript will undergo copyediting, typesetting, and review of the resulting proof before it is published in its final citable form. Please note that during the production process errors may be discovered which could affect the content, and all legal disclaimers that apply to the journal pertain.
AUTHOR CONTRIBUTIONS
M.K.A and K.A.F designed the research, analyzed results and wrote the manuscript. M.K.A performed the majority of the experiments with contributions from W.H, E.P.R, J.R.A.D, S.A.S, A.B, J.D.M, J.B, J.E.B and P.G. D.R.C performed bioinformatics analyses, and contributed to data analysis and manuscript preparation. A.T.S, Y.S and H.Y.C performed ATAC-seq analysis. H.L and M.J.M provided critical reagents and suggestions. All authors read and provided suggestions during manuscript preparation.
HHS Public Access
Author manuscript
Cell
. Author manuscript; available in PMC 2017 June 16.Published in final edited form as:
Cell. 2016 June 16; 165(7): 1672–1685. doi:10.1016/j.cell.2016.05.075.
A
uthor Man
uscr
ipt
A
uthor Man
uscr
ipt
A
uthor Man
uscr
ipt
A
uthor Man
uscr
ipt
regulatory regions of IRGs to control nucleosome positioning and repress transcription. Further, lincRNA-EPS mediates these effects by interacting with heterogeneous nuclear ribonucleoprotein L via a CANACA motif located in its 3′ end. Together, these findings identify lincRNA-EPS as a repressor of inflammatory responses highlighting the importance of lincRNAs in the immune system.
Graphical abstract
INTRODUCTION
Cell-type specific regulatory circuits control gene expression in complex, dynamic and temporally regulated manners (Smale et al., 2013). Understanding these regulatory networks is critical for a better understanding of the biological processes that contribute to human health and disease. The innate immune system represents a first line of defense against microbial infection and relies on dynamic transcriptional changes, initiated when germline-encoded pattern recognition receptors (e.g. TLRs) detect microbial products (Janeway and Medzhitov, 2002; Medzhitov and Horng, 2009). These receptors trigger signaling cascades that converge on well-defined transcription factors including NF-κB and interferon
regulatory factors (e.g. IRF3), which induce transcription of hundreds of IRGs. As sustained expression of IRGs can lead to tissue damage and immune pathology, their expression must be carefully regulated (Chen and Nunez, 2010). Both transcriptional and post-transcriptional regulatory checkpoints ensure that the magnitude and duration of these events are rigorously controlled, and that these pathways are turned off in a timely manner.
A large proportion of the human and mouse genome is transcribed as noncoding RNAs (ncRNAs) (Derrien et al., 2012; Djebali et al., 2012). Amongst these ncRNAs, microRNAs are well known regulators of gene expression. In addition, long noncoding RNAs (lncRNAs) also regulate gene expression in diverse biological contexts (Morris and Mattick, 2014). lncRNAs are arbitrarily defined as having 200 or more nucleotides, to distinguish them from
A
uthor Man
uscr
ipt
A
uthor Man
uscr
ipt
A
uthor Man
uscr
ipt
A
uthor Man
uscr
ipt
small noncoding RNAs. These RNAs can be either intergenic (between protein coding genes; lincRNA), intronic, natural antisense transcripts (NATs) or transcribed from divergent enhancers and promoters (Ulitsky and Bartel, 2013). lncRNAs control gene transcription by binding to chromatin modifying factors, hnRNPs, or transcription factors. lncRNAs also act via post-transcriptional mechanisms targeting the splicing, stability, or translation of host mRNAs (Guttman and Rinn, 2012). Although lncRNAs have been identified in virtually all immune cells, their functions in these cells are only beginning to emerge (Atianand and Fitzgerald, 2014; Guttman et al., 2009). For example, lincRNA-Cox2 was identified as a dynamically regulated gene induced by TLR ligands that, in turn, acts to both promote and repress inflammatory gene expression (Carpenter et al., 2013). Several additional lincRNAs including THRIL (Li et al., 2014), lnc13 (Castellanos-Rubio et al., 2016) and an antisense lncRNA, AS-IL-1α (Chan et al., 2015) also regulate inflammatory gene expression in myeloid cells. In T cells, NeST regulates IFN-γ gene transcription and persistent infection with Theiler’s virus (Gomez et al., 2013), while the lncRNA Rmrp regulates effector functions of T-helper 17 cells (Huang et al., 2015).
In this study, we define lincRNA-EPS as an important transcriptional brake that curbs inflammatory gene expression in macrophages, and in mice. lincRNA-EPS is expressed in macrophages and dendritic cells but downregulated in cells stimulated with microbial ligands, including lipopolysaccharide (LPS), which signals via TLR4/MD2. Genome-wide transcriptional analysis of macrophages from wild-type and lincRNA-EPS−/− mice revealed that lincRNA-EPS specifically repressed the expression of IRGs in both resting and TLR4-activated cells. Consistently, gain-of-function and rescue studies further defined lincRNA-EPS as a potent repressor of IRG expression. lincRNA-lincRNA-EPS associates with chromatin and interacts with hnRNPL, a member of a large family of heterogeneous ribonucleoproteins, to alter nucleosome positioning and repress the transcription of IRGs. Finally, lincRNA-EPS−/− mice had increased susceptibility to LPS challenge in vivo. Collectively, these results demonstrate that lincRNA-EPS is an inhibitor of IRG expression acting as a regulatory checkpoint that is downregulated prior to the inducible expression of IRGs.
RESULTS
lincRNA-EPS is suppressed in macrophages exposed to microbial ligands
Previous work from our lab utilized RNA-sequencing to define the transcriptome of TLR2-activated bone marrow-derived macrophages (BMDMs), and identified lincRNA-Cox2, a highly inducible lincRNA that in turn regulated IRG expression. This approach also identified lncRNAs that were downregulated in macrophages stimulated through TLR2 (Figure 1A). Amongst these was an annotated lincRNA, lincRNA-EPS (erythroid prosurvival, also known as Ttc39aos1), originally identified as a regulator of erythrocyte differentiation (Hu et al., 2011). As lincRNA-EPS was highly expressed in resting macrophages and downregulated following TLR ligation, we hypothesized that lincRNA-EPS might regulate IRG expression.
We employed reverse-transcription coupled to quantitative PCR (RT-qPCR) to examine the kinetics of lincRNA-EPS expression in BMDMs exposed to TLR ligands including Pam3CSK4 (TLR2/1), LPS (TLR4) and polyinosinic-polycytydilic acid (polyI:C) (TLR3).
A
uthor Man
uscr
ipt
A
uthor Man
uscr
ipt
A
uthor Man
uscr
ipt
A
uthor Man
uscr
ipt
The expression of lincRNA-EPS was downregulated in response to all three TLR ligands in a time-dependent manner (Figure 1B). TLR4-mediated suppression of lincRNA-EPS was also observed in dendritic cells (BMDC) (Figure 1C). Notably, lincRNA-EPS suppression in LPS-stimulated BMDMs was dose- and time-dependent, and inversely correlated with levels of the proinflammatory gene IL6 (Figures S1A and S1B). TLR-dependent suppression of lincRNA-EPS was dependent on MyD88 and Trif since MyD88−/−/Trif−/− BMDMs had a reduced ability to downregulate lincRNA-EPS (Figure 1D). To evaluate the role of NF-κB, a well characterized regulator of IRGs, in controlling the suppression of lincRNA-EPS, BMDMs were pretreated with DMSO (control) or BAY11-7082, an irreversible inhibitor of the IKK kinases, followed by LPS stimulation for 6 hr. The LPS (TLR4)-mediated
suppression of lincRNA-EPS was impaired in BAY11-7082 treated BMDMs relative to the control cells (Figure 1E). Induction of IL-1α mRNA, a known target of the NF-κB pathway, was impaired in these cells (Figure 1E). Consistent with these findings, LPS-induced suppression of lincRNA-EPS was also impaired in IKKβ-deficient BMDMs (Figure 1F). We also observed a similar suppression of lincRNA-EPS expression in BMDMs infected with Sendai virus or Listeria monocytogenes (Figure 1G), and in cells exposed to TNFα or type I interferon (IFN) (Figure 1H). However, stimulation of BMDMs with the anti-inflammatory cytokine IL-10, did not alter lincRNA-EPS expression, or interfere with TLR4-mediated suppression of lincRNA-EPS (Figure S1C). We also find that macrophages express ~11 lincRNA-EPS molecules per cell (Figure S1D). Collectively, these results indicate that lincRNA-EPS levels in macrophages are dynamically regulated in response microbial and inflammatory triggers.
Genetic deletion of lincRNA-EPS leads to enhanced basal and TLR4 induced expression of IRGs in macrophages
To test our hypothesis that lincRNA-EPS regulates IRGs, we generated mice lacking lincRNA-EPS (Figure S2A–C). lincRNA-EPS−/− mice were generated by deleting the entire 4 kb genomic locus harboring lincRNA-EPS and replacing it with a neomycin resistance cassette. lincRNA-EPS−/− animals were healthy and reproduced at expected Mendelian frequencies with no gender bias, and did not manifest any gross developmental defects (data not shown). Although this lincRNA had been implicated in erythroid differentiation (Hu et al., 2011), features of erythropoiesis including hematocrit and hemoglobin levels, and red blood cell (RBC) numbers were all normal in lincRNA-EPS−/− mice (Figure S2D). In addition the numbers of macrophages, DCs, B cells, T cells, and natural killer (NK) cell were comparable in spleens of lincRNA-EPS−/− and WT animals (Figure S2E).
To assess the impact of lincRNA-EPS deficiency on IRG expression in macrophages, we performed unbiased transcriptome profiling using RNA-seq in WT and lincRNA-EPS−/− BMDMs stimulated with LPS for 2 and 6 hr. The absence of lincRNA-EPS altered the expression of 113, 197 and 290 genes at 0, 2 and 6 hr post-LPS stimulation, respectively (≥ 2-fold change, Q-value < 0.05) (Figure 2A and Table S1). The majority of these genes were upregulated in lincRNA-EPS−/− BMDMs relative to WT BMDMs. Furthermore, mRNA levels of these genes was increased in both resting and LPS-treated conditions. A GO enrichment analysis demonstrated that IRGs were significantly overrepresented in these differentially expressed genes (Figure 2B). The time course indicated that lincRNA-EPS
A
uthor Man
uscr
ipt
A
uthor Man
uscr
ipt
A
uthor Man
uscr
ipt
A
uthor Man
uscr
ipt
regulated the expression of many IRGs in a temporal manner, since their RNA levels were often altered at specific times following LPS treatment (Figure 2C). Amongst the genes that were most significantly increased were cytokines and chemokines (Cxcl10, Cxcl9, Tnfsf10, Tnfsf8 and IL-27), as well as interferon-stimulated genes (ISGs) including Ifit2, Rsad2 (Viperin), Oasl1 and multiple members of the guanylate-binding protein (GBP) family (Figures 2D and S2G). Genes that were differentially expressed between WT and lincRNA-EPS−/−BMDMs were often IRGs that were clustered within specific chromosomal locations (Figure 2E). In particular, a large cluster of IRGs on chromosome 5, that included Cxcl10, Cxcl9, Plac8, and several GBP-family members, was upregulated in lincRNA-EPS−/− BMDMs. We further confirmed the upregulation of the chromosome-5 gene cluster (Figure 2F) and others (Figure S2H) using RT-qPCR in both untreated and LPS-stimulated (2 and 6 hr) wild-type and lincRNA-EPS−/− BMDMs. Moreover, we found increased levels of Cxcl10, Ccl5 and IL6 responses in lincRNA-EPS−/− BMDMs at both the mRNA (Figure 2G), and protein levels (Figure 2H). Notably, lincRNA-EPS−/− BMDMs did not display any changes in the expression of lincRNA-EPS neighboring genes Eps15 and Ttc39a relative to WT cells (Figure S2I). Furthermore, these cells also proliferated normally (Figure S2J). Together, these results indicate that lincRNA-EPS contributes in a specific manner to the temporal regulation of IRGs.
Gain-of-function and rescue studies define lincRNA-EPS as a negative regulator of inflammatory responses in macrophages
We next conducted ‘gain-of-function’ studies by generating macrophages that ectopically expressed lincRNA-EPS or vector control (EV Ctl) (Figure 3A). We stimulated these cells with LPS and measured the mRNA levels of IRGs. These studies revealed that LPS-induced expression of a number of IRGs including cytokines (IL6, IL15, IL1α), chemokines (Cxcl10, Cxcl2, Ccl5, Ccl4), and antiviral ISGs (Ifit1, Oas2, Ifi204 and Rsad2/viperin) were severely impaired in lincRNA-EPS expressing BMDMs compared to control cells (Figure 3B). We also confirmed these effects for some of these genes using RT-qPCR (Figure S3A). lincRNA-EPS mediated suppression of IRGs was also observed in cells stimulated with double-stranded DNA (Figure S3B). Ectopic expression of lincRNA-EPS also impaired LPS-induced expression of IRGs in J774.1 macrophages (Figures S3C and S3D). These results collectively indicate that ectopic expression of lincRNA-EPS blocks IRG expression in macrophages.
We next used retroviral transduction to restore expression of the mature RNA transcript in lincRNA-EPS−/− derived iBMDM cells. In these cells, lincRNA-EPS was restored to levels comparable to that seen in WT cells (Figure 3C). RT-qPCR analysis of Cxcl10, Ccl5, Rsad2/ Viperin and IL6 expression revealed that the LPS-induced levels of these genes, as expected, were increased in lincRNA-EPS−/− iBMDMs as compared to WT cells (Figure 3D).
However, ectopic expression of lincRNA-EPS in these KO cells reduced the mRNA levels of these genes back to that observed in WT cells (Figure 3D). Similar results were obtained for additional IRGs (Figure S3E).
In fetal erythroblasts, lincRNA-EPS was shown to regulate the expression of pro-apoptotic genes (Hu et al., 2011). One of the proposed target genes, Pycard, encodes ASC (apoptosis
A
uthor Man
uscr
ipt
A
uthor Man
uscr
ipt
A
uthor Man
uscr
ipt
A
uthor Man
uscr
ipt
associated speck-like protein containing CARD), a critical adaptor protein required for the assembly of the inflammasome, a caspase-1 activating complex that controls the maturation of interleukin-1β (Lamkanfi and Dixit, 2012). The best-studied inflammasome NLRP3 is activated in response to microbial infections, environmental toxins, and endogenous danger signals (Lamkanfi and Dixit, 2012). We therefore tested if activation of the NLRP3 inflammasome was altered in cells expressing lincRNA-EPS. Control iBMDMs and those ectopically expressing lincRNA-EPS were exposed to LPS alone or LPS together with nigericin, a pore-forming toxin or E. coli that both activate Nlrp3 (Figure 3E). In both cases production of IL-1β was severely impaired in lincRNA-EPS expressing macrophages compared to control cells (Figure 3E). We subsequently compared the levels of
inflammasome components and substrates by immunoblotting in WT and lincRNA-EPS overexpressing cells (Figure 3F). While the levels of pro-IL-1β, pro-caspase-1 and Nlrp3 were all equivalent in both cell types, the levels of ASC was greatly diminished (Figure 3F). Notably, genetic rescue of ASC in these cells fully restored IL-1β responses to levels comparable to that of control cells (Figures 3G and 3H).
lincRNA-EPS is chromatin associated in resting macrophages
To understand how lincRNA-EPS regulates IRGs, we examined its localization by performing sub-cellular fractionation and analyzed levels of lincRNA-EPS by RT-qPCR. This analysis revealed that lincRNA-EPS was predominantly nuclear in resting BMDMs (Figure 4A). As expected, the mature β-actin and IL-1β transcripts were localized to the cytosol, while NEAT1 (a nuclear lincRNA) was confined to the nucleus. The nuclear localization of lincRNA-EPS was also confirmed using single molecule RNA fluorescent in situ hybridization (FISH) in resting primary BMDMs (Figure 4B). In these cells, the majority of detectable lincRNA-EPS foci (>80%) were nuclear (Figure 4C). Furthermore, the lincRNA-EPS FISH signal was reduced in cells exposed to LPS (Figure 4D).
We next determined whether lincRNA-EPS was present in free nucleoplasmic or chromatin-associated fractions. BMDMs were chemically cross-linked to preserve endogenous chromatin-RNA complexes, and the nuclear lysates subjected to sucrose-gradient
fractionation following sonication/DNaseI treatment (Figure 4E). We immunoblotted histone H3 and identified chromatin-rich fractions 4–15 (Figure 4F, upper panel). We purified RNA from three randomly selected chromatin rich fractions (F4, F13 and F15), and performed reverse-transcription using oligo-dT primers to specifically detect mature full-length transcripts, and avoid detection of nascent (pre-mRNA) transcripts. RT-qPCR analysis revealed that lincRNA-EPS was detected across all three of these chromatin-rich fractions (Figure 4F, lower panel). Importantly, β-actin and IL-1β were undetectable in these samples, while known chromatin associated lncRNAs (NEAT1 and JPX), and snRNAs (U1 and 7SK) were present. Further histone H3 RNA immunoprecipitation (RIP) followed by RT-qPCR analysis of co-purified RNA confirmed that the majority of mature lincRNA-EPS was associated with chromatin (Figure 4G).
lincRNA-EPS maintains a repressed chromatin state at IRGs
We next explored the possibility that lincRNA-EPS controls the expression of IRGs by regulating their transcription. We performed chromatin immunoprecipitation (ChIP)
A
uthor Man
uscr
ipt
A
uthor Man
uscr
ipt
A
uthor Man
uscr
ipt
A
uthor Man
uscr
ipt
followed by qPCR to monitor the recruitment of RNA polymerase II (RNA pol II) to regulatory regions of IRGs that were upregulated in the absence of lincRNA-EPS. RNA pol II was recruited near the transcription start site (TSS) of Cxcl10, Ccl5 and Rsad2/Viperin in TLR4-activated cells (Figure 5A). However, these responses were impaired in BMDMs ectopically expressing lincRNA-EPS. We also observed similar effects at the TSS of IL6, Irf7 and ASC genes (Figure S4A). Consistent with these observations, the inducible
recruitment of RNA pol II at Cxcl10, Ccl5 and Rsad2/Viperin genes in LPS-treated cells was enhanced in lincRNA-EPS−/− BMDMs compared to WT cells (Figure 5B). These results indicate that lincRNA-EPS regulates the expression of these IRGs at the level of transcription.
Based on these findings, we hypothesized that lincRNA-EPS may contribute to epigenetic silencing of IRGs to restrain their basal expression. We performed ChIP-qPCR to quantify H3K4me3, a mark of active transcription near the TSS of genes that were transcriptionally suppressed by lincRNA-EPS. H3K4me3 levels were increased in both resting and LPS-stimulated BMDMs that lacked lincRNA-EPS (Figure 5C). Notably, in resting cells, the H3K4me3 levels at the Cxcl10, Ccl5, Rsad2/Viperin, IL6, Irg1 and Ifit1 TSSs were
increased in lincRNA-EPS−/− BMDMs compared to WT cells (Figure 5C). lincRNA-EPS−/− BMDMs apparently displayed near saturating levels of H3K4me3 marks since these levels were comparable to those detected upon LPS stimulation of WT cells. Similar patterns of elevated H3K4me3 marks were also observed for Ifit2, Gbp4 and Cxcl9 (Figure S4B). We also performed ChIP to monitor RNA pol II Ser2P, a mark of active/ongoing transcription. In unstimulated conditions, RNA pol II Ser2P levels were uniformly low, but comparable between WT and lincRNA-EPS−/− BMDMs (Figure 5D). However, following LPS
stimulation, RNA pol II Ser2P levels at Cxcl10, Ccl5, Rsad2/Viperin, IL6, Irg1 and Ifit1 loci were greatly enhanced in lincRNA-EPS−/− BMDMs relative to WT cells (Figure 5D). Similar results showing elevated RNA pol II Ser2P levels in lincRNA-EPS−/− BMDMs were also observed at additional IRGs (Figure S4C).
To examine the possibility that lincRNA-EPS binds to regulatory region(s) of target genes we performed RNA antisense purification (RAP) in extracts of cross-linked resting macrophages using biotinylated, lincRNA-EPS specific antisense RNA probes. The RNA probes specifically target lincRNA-EPS and purify the endogenous lncRNA and its
associated chromatin. RAP followed by RT-qPCR analysis of the retrieved RNA showed that nearly 50% of the endogenous lincRNA-EPS was specifically pulled down in lincRNA-EPS specific RAP conditions relative to several controls that included no-probes and control RAP targeting the Firefly luciferase gene (Figure 5E) as well as no-RT conditions (not shown). Highly abundant β-actin and 18S rRNA were undetectable in lincRNA-EPS RAP pulldown conditions, further confirming the specificity of lincRNA-EPS purification. In the same experiments, we examined Cxcl10, Ccl5 and ASC genomic regions since these genes were particularly affected by lincRNA-EPS in both gain-of-function and loss-of-function studies. Purified DNA was subjected to qPCR analysis, which showed that the Cxcl10, Ccl5 and ASC genomic regions near their TSS were highly enriched following lincRNA-EPS RAP, relative to the control RAP (Figure 5F). These results suggest that lincRNA-EPS binds (either directly or indirectly) to these gene loci. We conclude from all of these approaches that the nuclear localized lincRNA-EPS controls the expression of IRGs by binding to
A
uthor Man
uscr
ipt
A
uthor Man
uscr
ipt
A
uthor Man
uscr
ipt
A
uthor Man
uscr
ipt
regulatory regions of these genes, and maintaining chromatin in an epigenetically repressed state to prevent IRG expression in the absence of activating signals.
To investigate if lincRNA-EPS repressed the expression of IRGs by altering chromatin accessibility, we performed assays for transposase accessible chromatin (ATAC-Seq) (Buenrostro et al., 2013). ATAC-Seq in WT and lincRNA-EPS−/− BMDMs demonstrated dynamic epigenomic changes following LPS stimulation (Figures S4D and S4E), including increased accessibility at promoters and gene bodies of key immune genes such as Irg1 and Ccl5 (Figure S4F). While global genome accessibility was largely unaltered in lincRNA-EPS−/− BMDMs relative to WT cells, several IRGs that are normally suppressed by EPS showed an increase in chromatin accessibility at their promoters in lincRNA-EPS−/− BMDMs at baseline (Figure 5G and Table S2). These included genes such as Cxcl10, Irg1 and Ifit2, which show features of increased transcriptional activity in lincRNA-EPS deficient macrophages (Figures 5C and 5D). This increase in chromatin accessibility at IRGs was most pronounced in unstimulated lincRNA-EPS−/− BMDMs and was comparable to that seen in WT cells after stimulation with LPS for 2 or 6 hr (Figure S4G and Table S2). We next exploited the ability of ATAC-seq to capture nucleosome positions in order to assess whether increased chromatin accessibility in lincRNA-EPS−/− BMDMs reflected
nucleosome depletion at target gene promoters. To this end, we mapped the nucleosome positions centered within a 1 kb window of the TSS of genes using the recently described NucleoATAC algorithm, which captures nucleosome fingerprints across regulatory regions of the genome (Schep et al., 2015). Notably, aggregate nucleosome signals across all lincRNA-EPS repressed IRGs (identified by RNA-seq) showed an average re-positioning of −1 nucleosome further away from their TSSs in lincRNA-EPS−/−BMDMs (Figure 5H and Table S3), while nucleosome signals across all genes (background model) were comparable between WT and lincRNA-EPS−/− BMDMs (Figure 5H). These analyses indicate that the nucleosome fingerprints around the TSS of lincRNA-EPS target genes are selectively altered in lincRNA-EPS−/− cells. Interestingly, changes in nucleosome positioning were no longer evident in lincRNA-EPS−/−BMDMs compared to WT cells after 2 or 6 hr of LPS stimulation (Figure S4H), which is analogous to the results obtained for overall chromatin accessibility changes. These changes in nucleosome positioning in lincRNA-EPS deficient cells were better resolved by examining the genomic loci of individual target IRGs, including Cxcl10 (Figure 5I), Gpr84 (Figure 5J), and Irf7 and Cxcl2 (Figures S4I and 4J). Although the overall chromatin accessibility at promoters of these IRGs were largely comparable between WT and lincRNA-EPS deficient cells, there was a clear depletion of nucleosomes near the TSS of these genes in lincRNA-EPS−/− BMDMs compared to WT. These results collectively indicate that lincRNA-EPS promotes nucleosome occupancy at target IRG promoters to repress their transcription at baseline conditions.
Identification of hnRNPL as a binding partner for lincRNA-EPS
We next attempted to identify the protein partners of lincRNA-EPS. To this end, we performed RNA-protein binding assays by incubating in vitro-transcribed biotinylated lincEPS or it’s antisense control RNA with nuclear extracts from BMDMs. RNA-protein complexes were captured using streptavidin magnetic beads, resolved on SDS-PAGE, and protein bands (50 – 75 kD) that were specifically enriched in lincRNA-EPS
A
uthor Man
uscr
ipt
A
uthor Man
uscr
ipt
A
uthor Man
uscr
ipt
A
uthor Man
uscr
ipt
pulldown were subjected to Mass Spectrometry for identification (Figure 6A). This approach identified 6 RNA binding proteins that showed at least 2-fold enrichment in lincRNA-EPS pulldowns relative to antisense controls (Figure S5A). hnRNPL was the most abundant RNA binding protein identified in these pulldowns. The ability of hnRNPL to bind lincRNA-EPS was confirmed by western blotting (Figure 6B). lincRNA-EPS specifically interacted with hnRNPL, but not with hnRNP-A2/B1, or the DNA methyltransferase I (DNMT1) (Figure 6B). We also confirmed lincRNA-EPS: hnRNPL interaction in vivo by purifying
endogenous hnRNPL in macrophages, and analyzing co-purified RNA by RT-qPCR (Figures 6C and 6D). Native hnRNPL RIP in non cross-linked BMDMs followed by RT-qPCR analysis of co-purified RNAs showed that lincRNA-EPS was specifically enriched in hnRNPL immunoprecipitates (Figure 6C). Notably, in formaldehyde (FA) cross-linked BMDMs, lincRNA-EPS showed an even higher enrichment in the hnRNPL RIP condition compared to the control (Figure 6D). Enrichment of lincRNA-EPS in both native and FA cross-linked hnRNPL conditions were notably higher than several other control RNAs including NEAT1 and U1 snRNA (Figures 6C and 6D). These results indicate that lincRNA-EPS specifically interacts with hnRNPL both in vitro and in vivo.
We next generated macrophages with knockdown of hnRNPL using three independent shRNA lines with distinct non-overlapping sequences (Figure 6E). TLR4-induced
expression of Cxcl10 mRNA and protein levels were enhanced in hnRNPL-knockdown cells compared to control shRNA cells (Figures 6F and 6G). Similar results were obtained for Ccl5, IL6, Rsad2, Cxcl9 and Ifit1 mRNAs, as well as Ccl5 and IL6 protein levels in these experiments (Figures S5B and S5C). Expression of IL18, a gene that is not targeted by lincRNA-EPS, was comparable between control and hnRNPL knockdown cells (Figure S5B). Consistent with our findings in lincRNA-EPS KO BMDMs, hnRNPL knockdown also led to increased H3K4me3 levels at the promoters of Cxcl10, IL6, Irg1 and Ifit1 compared to control cells (Figure S5D). Importantly, knockdown of hnRNPL had no effect on the levels of either the unspliced or spliced (mature) forms of lincRNA-EPS (Figure 6H).
We also took advantage of a series of deletion mutants of lincRNA-EPS to map the hnRNPL-binding region. The results from in vitro binding assays indicated that hnRNPL interacted with the 3′- 531 nucleotide region of lincRNA-EPS (Figures 6I and 6J). This region was both necessary and sufficient to bind hnRNPL (Figure 6J). Consistently, ectopic expression of this region in lincRNA-EPS KO cells was sufficient to suppress Cxcl10 (Figure 6K). The expression of Tnfα, which is not regulated by lincRNA-EPS, was not affected in these studies. The relative expression level of WT and lincRNA-EPS deletion mutants was comparable (Figure S5E). We next assessed the role of CANACA motifs, commonly found in hnRNPL interacting RNAs (Ray et al., 2013). The lincRNA-EPS sequence contains 3 CANACA motifs within the 3′-531 region– CA1, CA2 and CA3 (Figure 6L). To define the contribution of individual CA motifs we performed mutagenesis of CA1, CA2 and CA3 and analyzed hnRNPL binding and regulation of Cxcl10 in reconstituted cells. This analysis revealed that CA3 but neither CA1 nor CA2 disrupted lincRNA-EPS: hnRNPL binding (Figure 6M). Consistently, ectopic expression of full-length lincRNA-EPS reduced Cxcl10, Ccl5 and Ccl4 expression, while two distinct CA3 mutants (EPS_CA3a and EPS_CA3b) lost this activity (Figure 6N). The relative expression of WT and lincRNA-EPS mutants were comparable in these cells (Figure S5F). The predicted RNA
A
uthor Man
uscr
ipt
A
uthor Man
uscr
ipt
A
uthor Man
uscr
ipt
A
uthor Man
uscr
ipt
secondary structure of the lincRNA-EPS 3′-531 region indicates that the CA3 motif spans a stem-loop region (Figure S5G). A similar prediction of lincRNA-EPS CA3 mutant reveals that the secondary structure around this region is vastly altered (Figure S5G). Mutations in a stem-loop region are more likely to disrupt the secondary structure than disruption of CA1 and CA2, which reside in the loop region. These data indicate that lincRNA-EPS interacts with hnRNPL via a CANACA motif in its 3′-531 region, and this motif is essential for hnRNPL binding and suppression of IRGs.
lincRNA-EPS restrains inflammation in vivo
As lincRNA-EPS deficient cells exhibit upregulated expression of IRGs under both basal and TLR4-stimulated conditions, we hypothesized that lincRNA-EPS-deficient animals would exhibit signs of heightened inflammation in vivo. We employed a model of
“endotoxic-shock” induced by intraperitoneal (i.p.) injection of E. coli LPS, characterized by high systemic levels of inflammatory mediators as well as death. WT and lincRNA-EPS−/− mice were challenged with LPS i.p. for 5 hrs and cytokine levels measured using multiplex assays. Following LPS challenge, lincRNA-EPS−/− animals had significantly elevated levels of inflammatory cytokines in serum (Figure 7A), peritoneal fluid (Figure 7B), liver (Figure 7C) and spleen (Figure 7D). Notably, the protein levels of key immune genes including Cxcl10, Ccl5 and IL6 were significantly elevated both locally in peritoneal fluid as well as systemically in serum, spleen and liver in lincRNA-EPS−/− animals compared to WT animals. Further, the inducible expression of IRG mRNAs were also enhanced in the spleen of lincRNA-EPS deficient animals relative to WT animals (Figure 7E). Flow cytometry analysis of peritoneal fluid in LPS-challenged mice however indicated that the recruitment of immune cells including neutrophils and inflammatory monocytes were comparable between WT and lincRNA-EPS−/− mice (Figure S6). We also analyzed the basal expression of a subset of lincRNA-EPS regulated IRGs in spleens in vivo by RT-qPCR (Figure 7F). Interestingly, lincRNA-EPS deficient animals showed increased levels of several IRGs relative to WT counterparts (Figure 7F). These results demonstrate that lincRNA-EPS plays an important role in controlling both the homeostatic and TLR4-inducible program of IRG expression in vivo.
Finally, we assessed the role of lincRNA-EPS in controlling the survival of these animals. At a sub-lethal dose of LPS challenge (25 mg/kg mice weight, i.p.), lincRNA-EPS−/− mice showed significantly higher susceptibility to endotoxic-shock (p = 0.0016; Log-rank (Mantel-Cox) test) since 100% of these mice succumbed to death by 30 hr (Figure 7G, left panel). In contrast, only 50% of WT animals succumbed to death at this dose and time-point. WT animals that failed to succumb recovered with no visible signs of illness by day 3 post-LPS challenge. We also performed similar survival studies at a low (non-lethal) dose of post-LPS. Notably, lincRNA-EPS deficient animals were significantly susceptible to this non-lethal dose of LPS since only 20% of lincRNA-EPS−/− mice survived up to 5 days post-LPS challenge in contrast to 100% survival rate observed for WT mice (Figure 7G, right panel). Taken together, these results demonstrate that lincRNA-EPS plays an important role in restraining lethal inflammatory responses in vivo.
A
uthor Man
uscr
ipt
A
uthor Man
uscr
ipt
A
uthor Man
uscr
ipt
A
uthor Man
uscr
ipt
DISCUSSION
Effective immune defense against pathogen challenge is dependent on a broad transcriptional program induced in macrophages and other immune cells. Enormous progress has been made in delineating how this transcriptional program is induced and regulated. Numerous factors acting at the level of receptor ligation, signaling, transcription factor activation, and chromatin state collectively coordinate the intensity and duration of these responses. Mammalian genomes also encode regulatory RNAs that control immune gene expression. While the role of microRNAs in these processes is well established (O’Connell et al., 2012), the role of lncRNAs in the immune system are still poorly understood.
In this study we demonstrate that lincRNA-EPS downregulates IRG expression in
macrophages. In resting cells, lincRNA-EPS suppresses the transcription of immune genes by controlling nucleosome positioning to maintain a repressed chromatin state. In response to microbial ligands, however, this brake is released and IRG expression induced in a temporal manner (Figure 7H). Notably, the kinetics of lincRNA-EPS suppression in immune cells is consistent with its role as a temporal regulator since it is expressed in resting macrophages but suppressed soon after the proinflammatory response is initiated.
Using both gain-of-function and loss-of-function approaches we have gained critical insights into the biological functions of lncRNA-EPS at both the cellular and organismal level. Unbiased genome-wide transcriptome profiling of lincRNA-EPS−/− BMDMs demonstrated that lincRNA-EPS selectively downregulated the expression of a large number of immune genes, all of which play key roles in host defense against pathogens. Notably, we found that ectopic expression of lincRNA-EPS in lincRNA-EPS−/− macrophages reversed the enhanced expression of IRGs. Thus deletion of the lincRNA-EPS DNA locus did not affect regulatory element(s) other than those controlling lincRNA-EPS expression. lincRNA-EPS also downregulated inflammasome-dependent responses by controlling levels of ASC. Our work also demonstrates that lincRNA-EPS restrains inflammation in vivo. lincRNA-EPS deficient mice produced elevated systemic levels of cytokines in response to LPS challenge.
Moreover, lincRNA-EPS deficient animals were more susceptible to LPS-induced lethality compared to their wild-type counterparts. While we cannot be certain that all of these effects are due only to the absence of lincRNA-EPS expression in macrophages, these results provide compelling genetic evidence for in vivo functions of lincRNA-EPS in the immune system.
In addition to identifying physiologic functions for this lincRNA both in isolated cells and in vivo, we provide mechanistic insights into how lincRNA-EPS controls IRG expression. Consistent with its nuclear localization, we find that lincRNA-EPS controls the basal and TLR4-inducible expressions of IRGs at the transcriptional level. The role of lincRNA-EPS in repressing gene transcription is supported by RNA pol II ChIP studies. Moreover, ATAC-seq and NucleoATAC analysis collectively indicate that lincRNA-EPS promotes a repressed chromatin state by controlling nucleosome positioning at TSSs of target IRGs in the absence of an activating signal. The evidence from our RNA FISH experiments, which reveals multiple foci throughout the nucleus, lend support to the idea that lincRNA-EPS might act
A
uthor Man
uscr
ipt
A
uthor Man
uscr
ipt
A
uthor Man
uscr
ipt
A
uthor Man
uscr
ipt
directly at multiple genomic loci, rather than indirectly by affecting only major regulators in the genome.
Our mechanistic studies also indicate that lincRNA-EPS functions at least in part through its interaction with hnRNPL. Our results identify a CANACA motif in the 3′-531 region that is critical for both hnRNPL binding and lincRNA-EPS-dependent suppression of some IRGs. Despite the presence of three such motifs in this region, only CA tract 3 (2386 – 2391 nt), that spans a predicted stem-loop region is functionally important. These findings indicate that either the sequence or secondary structure of this region is involved in mediating lincRNA-EPS functions. Further studies will be required however to determine if all the lincRNA-EPS dependent effects we have observed are dependent on its interaction with hnRNPL. hnRNPs are important functional partners for numerous additional lincRNAs. These include lincRNA-p21 which functions via hnRNPK (Huarte et al., 2010), Xist and Firre which both function via hnRNPU (Hacisuleyman et al., 2014; Hasegawa et al., 2010), as well as lincRNA-Cox2 which utilizes hnRNP-A2/B1 (and hnRNP-A/B) (Carpenter et al., 2013). It is well known that hnRNPs are involved in mRNA biogenesis. In addition, a role for hnRNPL in the transcriptional regulation of gene expression is also beginning to emerge. For instance, hnRNPL is a component of the Med23 mediator complex that plays an important role in gene transcription in epithelial cells (Huang et al., 2012). Moreover, hnRNPL is functionally linked to the transcriptional program mediated by Aire in developing T cells (Giraud et al., 2014). hnRNPL also interacts with an intronic lncRNA, THRIL to control transcription of TNFα in THP-1 monocytes (Li et al., 2014). The identification of hnRNPL as a functional binding partner of lincRNA-EPS adds further support to the role of hnRNPs in transcriptional regulation, expanding the role of these RBPs beyond their well known functions in mRNA processing.
The mechanism whereby lincRNA-EPS specifically localizes to the genomic loci of IRGs to mediate gene repression remains to be fully defined. At least three possibilities exist. First, lincRNA-EPS could interact directly with nascent pre-mRNAs at their genomic loci via RNA:RNA interactions to block their ongoing transcription. Similar interactions involving lncRNA:pre-mRNAs at specific genomic loci have been recently described for NEAT1 and MALAT1 (West et al., 2014), as well U1 snRNA (Engreitz et al., 2014). Alternatively, lincRNA-EPS might interact directly with target DNA sequences to form higher-order DNA:RNA triplex structures, similar to the recently described model for lncRNA genes PARTICLE (O’Leary et al., 2015) and MEG3 (Mondal et al., 2015). Finally, lncRNA-EPS may target genes through a ribonucleoprotein complex that does not rely on specific base-pairing with either DNA or mRNA. Instead, such RNP complexes, which in the case of lincRNA-EPS appears to involve hnRNPL, would target specific genes through a carefully coordinated set of multiprotein interactions that resemble transcription factor recruitment at specific genomic sites.
In summary, we have employed detailed molecular and genetic approaches to demonstrate that the precise regulation of lincRNA-EPS expression in macrophages is essential to control inflammatory responses by suppressing the transcription of key immune genes. lincRNA-EPS therefore acts as an important component of the molecular circuitry to prevent spontaneous activation of immune genes, chronic inflammation, and immune pathologies.
A
uthor Man
uscr
ipt
A
uthor Man
uscr
ipt
A
uthor Man
uscr
ipt
A
uthor Man
uscr
ipt
The insights obtained from this study further advance our understanding of the physiological roles of lncRNAs in general and the growing importance of these molecules in the immune system.
EXPERIMENRAL PROCEDURES
Cell culture and stimulation
BMDMs were differentiated from bone-marrow cells with 20% L929 supernatant for 7 days, and stimulated with LPS (100 ng/ml), Pam3CSK4 (200 ng/ml), poly(I:C) (25 μg/ml), type I IFN (500 U/ml), TNFα (10 ng/ml) and IL-10 (10 ng/ml).
Generation of lincRNA-EPS knockout mice
lincRNA-EPS KO mouse was generated by replacing the lincRNA-EPS genomic locus (4 kb) with a neomycin cassette under control of a Pgk1 promoter. lincRNA-EPS targeting vector was electroporated into C57BL/6 mouse embryonic stem (ES) cells. Positive ES cells were injected into blastocytes to generate chimeric mice. lincRNA-EPS heterozygous mice were obtained by gamete line transmission from mating the chimeric mice with WT C57BL/6 mice.
RNA-seq and data analysis
WT and lincRNA-EPS−/− BMDMs (2 mice/group) were stimulated with LPS (100 ng/ml) for 0, 2, and 6 hr. RNA-seq libraries were prepared from total RNA depleted of rRNA, and sequenced on Illumina Hiseq2000 as described (Heyer et al., 2015).
Cytokine analysis
Cytokines levels in supernatants were measured by ELISA: Cxcl10 and Ccl5 (R&D Systems), IL6, TNFα and IL-1β (eBioscience). Multiplex protein analysis was performed by LUNARIS™ Mouse 12-Plex Cytokine Kit (AYOXXA Biosystems, Germany), and Mouse Cytokine/Chemokine Array 31-Plex (EVE Technologies Corporations, Canada). ATAC-seq
WT and lincRNA-EPS−/− BMDMs were stimulated with LPS (100 ng/ml) for 0, 2, or 6 hr in biological duplicates (2 mice/group) and subjected to ATAC-seq as described (Buenrostro et al., 2013). Briefly, nuclei pellets isolated from 50,000 cells were resuspended in 50 μL transposition buffer containing Tn5 transposase (Illumina), and incubated at 37° C for 30 min. Barcoded ATAC-seq libraries were sequenced on Illumina Nextseq.
Accession Number
RNA-seq data is available in the ArrayExpress database (E-MTAB-4088). ATAC-seq data available in Gene Expression Omnibus (GSE78873).
A detailed description of the methods is provided in the extended experimental procedure section.
A
uthor Man
uscr
ipt
A
uthor Man
uscr
ipt
A
uthor Man
uscr
ipt
A
uthor Man
uscr
ipt
Supplementary Material
Refer to Web version on PubMed Central for supplementary material.
Acknowledgments
We sincerely thank Zhaozhao Jiang and Kelly Army for animal care and technical help, Mona Motwani and Shruti Sharma for help with flow cytometry, Alicia Schep for NucleoATAC analysis, Rui Li for help during initial stages of ATAC-seq library preparation, and all members of the Fitzgerald laboratory as well as Susan Carpenter (UCSC, CA) for their insightful comments. We thank Michael Karin (UCSD, CA) for providing RNA samples, and Scott Schaffer and John Leszyck (UMass, Worcester, MA) for Mass Spectrometry. This study was supported by American Heart Association grant (14POST18930001) to M.K.A, by NIH grant (P50-HG007735) to H.Y.C, by NIH grant (DK068348) to H.F.L, and by grants from the Kenneth Rainin Foundation, Lupus Research Foundation and NIH (AI067497) to K.A.F.
References
Atianand MK, Fitzgerald KA. Long non-coding RNAs and control of gene expression in the immune system. Trends in molecular medicine. 2014; 20:623–631. [PubMed: 25262537]
Buenrostro JD, Giresi PG, Zaba LC, Chang HY, Greenleaf WJ. Transposition of native chromatin for fast and sensitive epigenomic profiling of open chromatin, DNA-binding proteins and nucleosome position. Nature methods. 2013; 10:1213–1218. [PubMed: 24097267]
Carpenter S, Aiello D, Atianand MK, Ricci EP, Gandhi P, Hall LL, Byron M, Monks B, Henry-Bezy M, Lawrence JB, et al. A long noncoding RNA mediates both activation and repression of immune response genes. Science. 2013; 341:789–792. [PubMed: 23907535]
Castellanos-Rubio A, Fernandez-Jimenez N, Kratchmarov R, Luo X, Bhagat G, Green PH, Schneider R, Kiledjian M, Bilbao JR, Ghosh S. A long noncoding RNA associated with susceptibility to celiac disease. Science. 2016; 352:91–95. [PubMed: 27034373]
Chan J, Atianand M, Jiang Z, Carpenter S, Aiello D, Elling R, Fitzgerald KA, Caffrey DR. Cutting Edge: A Natural Antisense Transcript, AS-IL1alpha, Controls Inducible Transcription of the Proinflammatory Cytokine IL-1alpha. J Immunol. 2015; 195:1359–1363. [PubMed: 26179904] Chen GY, Nunez G. Sterile inflammation: sensing and reacting to damage. Nature reviews
Immunology. 2010; 10:826–837.
Derrien T, Johnson R, Bussotti G, Tanzer A, Djebali S, Tilgner H, Guernec G, Martin D, Merkel A, Knowles DG, et al. The GENCODE v7 catalog of human long noncoding RNAs: analysis of their gene structure, evolution, and expression. Genome research. 2012; 22:1775–1789. [PubMed: 22955988]
Djebali S, Davis CA, Merkel A, Dobin A, Lassmann T, Mortazavi A, Tanzer A, Lagarde J, Lin W, Schlesinger F, et al. Landscape of transcription in human cells. Nature. 2012; 489:101–108. [PubMed: 22955620]
Engreitz JM, Sirokman K, McDonel P, Shishkin AA, Surka C, Russell P, Grossman SR, Chow AY, Guttman M, Lander ES. RNA-RNA interactions enable specific targeting of noncoding RNAs to nascent Pre-mRNAs and chromatin sites. Cell. 2014; 159:188–199. [PubMed: 25259926] Giraud M, Jmari N, Du L, Carallis F, Nieland TJ, Perez-Campo FM, Bensaude O, Root DE, Hacohen
N, Mathis D, et al. An RNAi screen for Aire cofactors reveals a role for Hnrnpl in polymerase release and Aire-activated ectopic transcription. Proceedings of the National Academy of Sciences of the United States of America. 2014; 111:1491–1496. [PubMed: 24434558]
Gomez JA, Wapinski OL, Yang YW, Bureau JF, Gopinath S, Monack DM, Chang HY, Brahic M, Kirkegaard K. The NeST long ncRNA controls microbial susceptibility and epigenetic activation of the interferon-gamma locus. Cell. 2013; 152:743–754. [PubMed: 23415224]
Guttman M, Amit I, Garber M, French C, Lin MF, Feldser D, Huarte M, Zuk O, Carey BW, Cassady JP, et al. Chromatin signature reveals over a thousand highly conserved large noncoding RNAs in mammals. Nature. 2009; 458:223–227. [PubMed: 19182780]
Guttman M, Rinn JL. Modular regulatory principles of large non-coding RNAs. Nature. 2012; 482:339–346. [PubMed: 22337053]
A
uthor Man
uscr
ipt
A
uthor Man
uscr
ipt
A
uthor Man
uscr
ipt
A
uthor Man
uscr
ipt
Hacisuleyman E, Goff LA, Trapnell C, Williams A, Henao-Mejia J, Sun L, McClanahan P,
Hendrickson DG, Sauvageau M, Kelley DR, et al. Topological organization of multichromosomal regions by the long intergenic noncoding RNA Firre. Nature structural & molecular biology. 2014; 21:198–206.
Hasegawa Y, Brockdorff N, Kawano S, Tsutui K, Tsutui K, Nakagawa S. The matrix protein hnRNP U is required for chromosomal localization of Xist RNA. Developmental cell. 2010; 19:469–476. [PubMed: 20833368]
Heyer EE, Ozadam H, Ricci EP, Cenik C, Moore MJ. An optimized kit-free method for making strand-specific deep sequencing libraries from RNA fragments. Nucleic acids research. 2015; 43:e2. [PubMed: 25505164]
Hu W, Yuan B, Flygare J, Lodish HF. Long noncoding RNA-mediated anti-apoptotic activity in murine erythroid terminal differentiation. Genes & development. 2011; 25:2573–2578. [PubMed: 22155924]
Huang W, Thomas B, Flynn RA, Gavzy SJ, Wu L, Kim SV, Hall JA, Miraldi ER, Ng CP, Rigo FW, et al. DDX5 and its associated lncRNA Rmrp modulate TH17 cell effector functions. Nature. 2015; 528:517–522. [PubMed: 26675721]
Huang Y, Li W, Yao X, Lin QJ, Yin JW, Liang Y, Heiner M, Tian B, Hui J, Wang G. Mediator complex regulates alternative mRNA processing via the MED23 subunit. Molecular cell. 2012; 45:459–469. [PubMed: 22264826]
Huarte M, Guttman M, Feldser D, Garber M, Koziol MJ, Kenzelmann-Broz D, Khalil AM, Zuk O, Amit I, Rabani M, et al. A large intergenic noncoding RNA induced by p53 mediates global gene repression in the p53 response. Cell. 2010; 142:409–419. [PubMed: 20673990]
Janeway CA Jr, Medzhitov R. Innate immune recognition. Annual review of immunology. 2002; 20:197–216.
Lamkanfi M, Dixit VM. Inflammasomes and their roles in health and disease. Annual review of cell and developmental biology. 2012; 28:137–161.
Li Z, Chao TC, Chang KY, Lin N, Patil VS, Shimizu C, Head SR, Burns JC, Rana TM. The long noncoding RNA THRIL regulates TNFalpha expression through its interaction with hnRNPL. Proceedings of the National Academy of Sciences of the United States of America. 2014; 111:1002–1007. [PubMed: 24371310]
Medzhitov R, Horng T. Transcriptional control of the inflammatory response. Nature reviews Immunology. 2009; 9:692–703.
Mondal T, Subhash S, Vaid R, Enroth S, Uday S, Reinius B, Mitra S, Mohammed A, James AR, Hoberg E, et al. MEG3 long noncoding RNA regulates the TGF-beta pathway genes through formation of RNA-DNA triplex structures. Nature communications. 2015; 6:7743.
Morris KV, Mattick JS. The rise of regulatory RNA. Nature reviews Genetics. 2014; 15:423–437. O’Connell RM, Rao DS, Baltimore D. microRNA regulation of inflammatory responses. Annual
review of immunology. 2012; 30:295–312.
O’Leary VB, Ovsepian SV, Carrascosa LG, Buske FA, Radulovic V, Niyazi M, Moertl S, Trau M, Atkinson MJ, Anastasov N. PARTICLE, a Triplex-Forming Long ncRNA, Regulates Locus-Specific Methylation in Response to Low-Dose Irradiation. Cell reports. 2015; 11:474–485. [PubMed: 25900080]
Ray D, Kazan H, Cook KB, Weirauch MT, Najafabadi HS, Li X, Gueroussov S, Albu M, Zheng H, Yang A, et al. A compendium of RNA-binding motifs for decoding gene regulation. Nature. 2013; 499:172–177. [PubMed: 23846655]
Schep AN, Buenrostro JD, Denny SK, Schwartz K, Sherlock G, Greenleaf WJ. Structured nucleosome fingerprints enable high-resolution mapping of chromatin architecture within regulatory regions. Genome research. 2015; 25:1757–1770. [PubMed: 26314830]
Smale ST, Plevy SE, Weinmann AS, Zhou L, Ramirez-Carrozzi VR, Pope SD, Bhatt DM, Tong AJ. Toward an understanding of the gene-specific and global logic of inducible gene transcription. Cold Spring Harbor symposia on quantitative biology. 2013; 78:61–68. [PubMed: 24747344] Ulitsky I, Bartel DP. lincRNAs: genomics, evolution, and mechanisms. Cell. 2013; 154:26–46.
[PubMed: 23827673]
A
uthor Man
uscr
ipt
A
uthor Man
uscr
ipt
A
uthor Man
uscr
ipt
A
uthor Man
uscr
ipt
West JA, Davis CP, Sunwoo H, Simon MD, Sadreyev RI, Wang PI, Tolstorukov MY, Kingston RE. The long noncoding RNAs NEAT1 and MALAT1 bind active chromatin sites. Molecular cell. 2014; 55:791–802. [PubMed: 25155612]
A
uthor Man
uscr
ipt
A
uthor Man
uscr
ipt
A
uthor Man
uscr
ipt
A
uthor Man
uscr
ipt
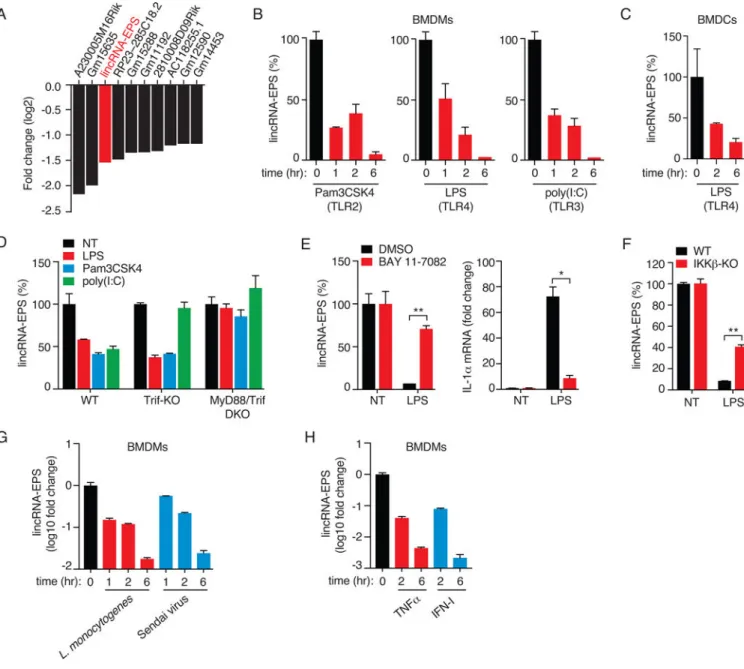
Figure 1. Suppression of lincRNA-EPS in macrophages exposed to TLR ligands
(A) Top 10 lncRNAs downregulated in TLR2-activated BMDMs. Expression levels (log2
-FC) are from the RNA-seq dataset from BMDMs stimulated with Pam3CSK4 for 5 hr (Carpenter et al., 2013).
(B and C) RT-qPCR analysis of lincRNA-EPS expression in BMDMs (B) and DCs (C) stimulated with TLR ligands.
(D) RT-qPCR analysis of lincRNA-EPS expression in WT, Trif-KO or MyD88/Trif-DKO BMDMs stimulated with TLR ligands for 6 hr.
(E) WT BMDMs were pretreated with BAY11-7082 (10 μM) or DMSO, followed by LPS stimulation for 6 hr. Expression of lincRNA-EPS (left) and IL-1α (right) was quantified by RT-qPCR. Data are shown relative to DMSO treated cells. *, p < 0.05; **, p < 0.01.
(F) lincRNA-EPS expression in WT and IKKβ-deficient BMDMs that were treated or not with LPS for 6 hr. *, p < 0.05; **, p < 0.01.
A
uthor Man
uscr
ipt
A
uthor Man
uscr
ipt
A
uthor Man
uscr
ipt
A
uthor Man
uscr
ipt
(G and H) lincRNA-EPS expression in BMDMs exposed to microbial infections (G) or proinflammatory cytokines (H) for indicated times.
See also Figure S1
A
uthor Man
uscr
ipt
A
uthor Man
uscr
ipt
A
uthor Man
uscr
ipt
A
uthor Man
uscr
ipt
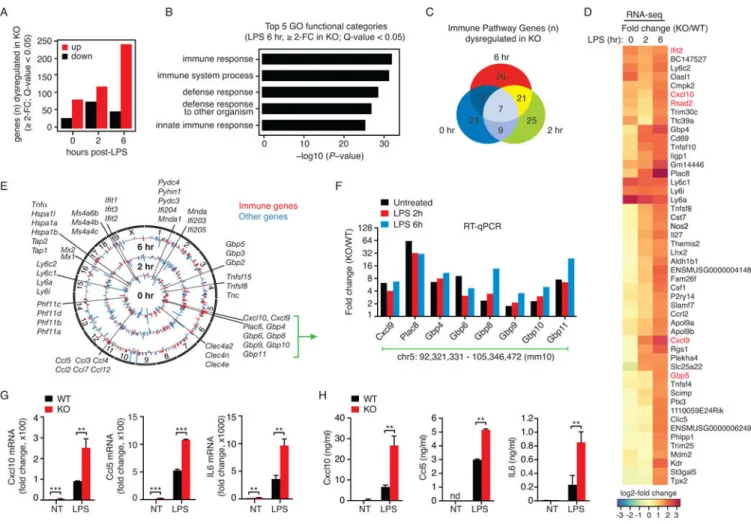
Figure 2. Genetic-deficiency of lincRNA-EPS leads to elevated levels of basal and TLR4-induced expression of IRGs
(A) Numbers of differentially expressed genes (≥ 2-FC over WT; Q-value < 0.05) in lincRNA-EPS−/− BMDMs relative to WT cells in resting (0 hr) and LPS treated cells (2 and 6 hr). Data are from RNA-seq performed in biological duplicates.
(B) Gene ontology (GO) analysis of differentially expressed genes (≥ 2-FC over WT; Q-value < 0.05 in RNA-seq) between lincRNA-EPS−/− BMDMs and WT BMDMs following LPS treatment for 6 hr. The top 5 most significantly enriched GO terms (−log10 P-values for
biological processes) in differentially expressed genes relative to all other genes in the genome (background model) are shown.
(C) Venn diagram represents the number of immune genes (defined in extended
experimental methods) that were differentially expressed (≥ 2-FC over WT; Q-value < 0.05 in RNA-seq) in lincRNA-EPS−/− BMDMs.
(D) Heatmap of top 50 upregulated genes in lincRNA-EPS−/− BMDMs relative to WT cells at 6 hr post-LPS treatment. log2-FC values were calculated from RNA-seq (FPKM+1), and are equivalent to lincRNA-EPS KO/WT. A subset of common IRGs are highlighted in red. (E) Circos plot of differentially expressed genes (≥ 2-FC over WT in RNA-seq) for untreated cells (inner track) and LPS-stimulated cells (middle track 2 hr, outer track 6 hr). Immune genes (defined in extended experimental methods) are highlighted in red and all other genes are in blue.
A
uthor Man
uscr
ipt
A
uthor Man
uscr
ipt
A
uthor Man
uscr
ipt
A
uthor Man
uscr
ipt
(F) RT-qPCR analysis of lincRNA-EPS regulated IRGs in untreated, and LPS-treated WT and lincRNA-EPS−/− BMDMs.
(G) mRNA levels of cytokine genes in WT and lincRNA-EPS−/− BMDMs stimulated with LPS for 6 hr. **, p < 0.01.
(H) Protein levels of indicated cytokines in WT and lincRNA-EPS−/− BMDMs stimulated with LPS for 12 hr, and analyzed by ELISA. **, p < 0.01; nd, non-detectable.
See also Figure S2 and Table S1.
A
uthor Man
uscr
ipt
A
uthor Man
uscr
ipt
A
uthor Man
uscr
ipt
A
uthor Man
uscr
ipt
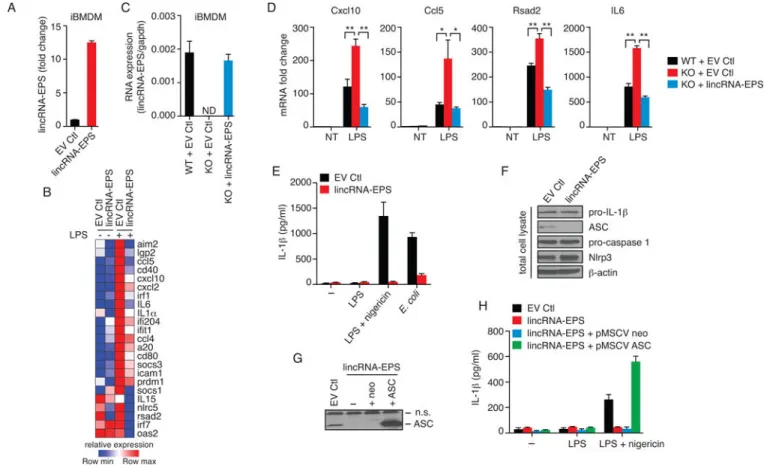
Figure 3. Gain-of-function and rescue studies demonstrate that lincRNA-EPS acts as a repressor of IRG expression
(A) RT-qPCR analysis of lincRNA-EPS levels in iBMDMs expressing ectopic lincRNA-EPS or empty vector control (EV Ctl).
(B) Heatmap of gene expression in iBMDMs expressing ectopic lincRNA-EPS or EV Ctl that were treated or not with LPS for 6 hr, and analyzed by NanoString. Data are shown for 23 genes (out of 94 genes) that were suppressed by at least 2-fold in cells expressing ectopic lincRNA-EPS.
(C and D) Rescue of lincRNA-EPS function in lincRNA-EPS−/− macrophages through
ectopic expression. lincRNA-EPS levels in WT iBMDMs, or lincRNA-EPS−/− iBMDMs
expressing ectopic lincRNA-EPS or EV Ctl analyzed by RT-qPCR (C). These cells were stimulated with LPS for 6 hr and analyzed by RT-qPCR to measure lincRNA-EPS regulated IRGs (D). *, p < 0.05; **, p < 0.01.
(E and F) iBMDMs expressing ectopic lincRNA-EPS or EV Ctl were stimulated as indicated, or infected with E. coli (10 MOI; multiplicity of infection). Levels of secreted IL-1β was quantified by ELISA (E), and cell lysates analyzed by western blot (F).
(G and H) Addback of ASC expression in iBMDMs expressing ectopic lincRNA-EPS was confirmed by immunoblotting ASC (G), and IL-1β levels measured by ELISA (H). n.s, non-specific.
See also Figure S3.
A
uthor Man
uscr
ipt
A
uthor Man
uscr
ipt
A
uthor Man
uscr
ipt
A
uthor Man
uscr
ipt
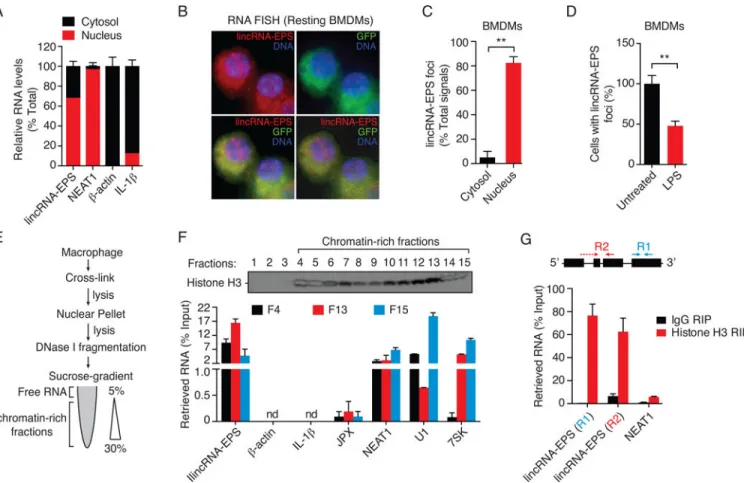
Figure 4. lincRNA-EPS is associated with chromatin in resting macrophages
(A) RT-qPCR analysis of RNAs purified from nuclear (red) and cytosolic (black) compartments in BMDMs.
(B) Single molecule RNA FISH detecting endogenous lincRNA-EPS molecules (red) in resting BMDMs. DNA (blue) was stained with DAPI, and autofluorescence detected by staining with probes against GFP (green). A representative image (100× magnification) is shown. DIC, differential interference contrast.
(C) Quantification of lincRNA-EPS foci detected by RNA FISH in resting BMDMs. Results are shown as % of cells that showed either a nuclear or cytosolic lincRNA-EPS foci in >500 randomly selected cells. **p < 0.01.
(D) Quantification of cells with lincRNA-EPS foci (nuclear or cytosolic) detected by RNA FISH in BMDMs in response to LPS stimulation for 6 hr. **p < 0.01.
(E) Schematic for the isolation of chromatin-associated RNAs following cross-linking (formaldehyde and glutaryldehyde).
(F) Western blotting of histone H3 (upper panel) in nuclear fractions isolated by sucrose-gradient fractionation. Purified RNA was reverse-transcribed using oligo-dT primer, and analyzed by qPCR (lower panel).
(G) Histone H3 RIP followed by RT-qPCR analysis of co-purified RNAs in formaldehyde cross-linked BMDMs.
A
uthor Man
uscr
ipt
A
uthor Man
uscr
ipt
A
uthor Man
uscr
ipt
A
uthor Man
uscr
ipt
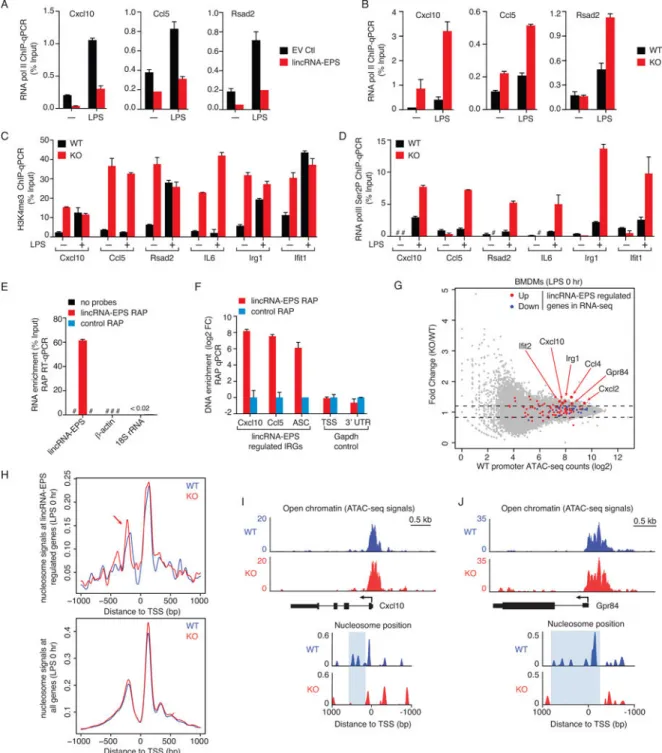
Figure 5. lincRNA-EPS controls nucleosome positioning and suppresses the transcription of IRGs
(A) ChIP-qPCR analysis of RNA pol II at lincRNA-EPS regulated IRGs in macrophages expressing ectopic lincRNA-EPS or EV Ctl that were treated or not with LPS for 5 hr. ChIP purified DNA was analyzed by qPCR targeting the TSSs of indicated genes.
(B) ChIP-qPCR analysis of RNA pol II at lincRNA-EPS regulated IRGs in WT and lincRNA-EPS−/− (KO) BMDMs that were treated or not with LPS for 5 hr.
(C and D) ChIP-qPCR analysis of H3K4me3 (C) and RNA pol II Ser2P levels (D) in WT and lincRNA-EPS−/− BMDMs that were treated or not with LPS for 5 hr.
A
uthor Man
uscr
ipt
A
uthor Man
uscr
ipt
A
uthor Man
uscr
ipt
A
uthor Man
uscr
ipt
(E and F) RNA antisense purification (RAP) of endogenous lincRNA-EPS in BMDMs, followed by RT-qPCR analysis of retrieved RNA (E), and qPCR analysis of co-purified DNA (F). qPCR analysis of Cxcl10, Ccl5 and ASC genomic regions was performed using oligos directed around their TSS. #, not detected.
(G) ATAC-seq results showing fold change of ATAC-seq signals (KO/WT) versus ATAC-seq signals at WT promoters (+/− 1 kb of TSS) for lincRNA-EPS regulated genes identified in RNA-seq (red: upregulated; blue: downregulated) (Figure 2A; Table S1), and all other genes (gray dots). lincRNA-EPS target genes showing more open chromatin are highlighted. Dash lines represent 1.2 fold change.
(H) NucleoATAC analysis showing nucleosome signals in WT (blue) and lincRNA-EPS−/− BMDMs (KO; red) at basal state. Aggregate nucleosome signals are shown within the promoters (+/− 1 kb of TSS) of genes that are regulated by lincRNA-EPS (above panel), or within the promoters of all genes on a genome-wide level (bottom panel). Repositioning of −1 nucleosomes away from TSS in lincRNA-EPS−/− BMDMs is highlighted by an arrow. (I and J) Genome tracks of Cxcl10 (I) and Gpr84 (J) showing chromatin accessibility (normalized ATAC-seq signal), and nucleosome positioning (NucleoATAC signals) centered around their transcription start sites in WT and lincRNA-EPS−/− BMDMs at basal
conditions.
See also Figure S4 and Tables S2 and S3.
A
uthor Man
uscr
ipt
A
uthor Man
uscr
ipt
A
uthor Man
uscr
ipt
A
uthor Man
uscr
ipt
Figure 6. Identification of hnRNPL as a binding partner of lincRNA-EPS
(A) SDS-PAGE analysis of proteins purified from in vitro binding assay using biotinylated lincRNA-EPS or antisense control RNA, and macrophage nuclear extracts. The highlighted protein bands were subjected to Mass Spectrometry analysis.
(B) Western blot confirms lincRNA-EPS and hnRNPL interaction in vitro.
(C and D) hnRNPL RIP followed by RT-qPCR analysis of co-purified RNAs in non-cross-linked BMDMs (C) and formaldehyde cross-non-cross-linked BMDMs (D). Immunoprecipitation of hnRNPL was assessed by western blot (inset, panel C).
(E) Western blot assessing the knockdown of hnRNPL in iBMDMs stably expressing shRNAs targeting non-overlapping regions of hnRNPL, and the control shRNA against GFP. (F and G) Control iBMDMs or those expressing hnRNPL specific shRNAs were stimulated with LPS, and subjected to RT-qPCR analysis of Cxcl10 mRNA (F), and ELISA against Cxcl10 protein levels (G).
(H) RT-qPCR analysis of unspliced and spliced forms of lincRNA-EPS in iBMDMs expressing control or hnRNPL specific shRNAs. *, p < 0.05.
(I) Schematic of lincRNA-EPS deletion mutants used in RNA-protein binding assays.
A
uthor Man
uscr
ipt
A
uthor Man
uscr
ipt
A
uthor Man
uscr
ipt
A
uthor Man
uscr
ipt
(J) hnRNPL binds 3′-region of lincRNA-EPS. In vitro RNA: protein binding assay was performed using biotinylated full-length or deletion mutants of lincRNA-EPS and the nuclear extracts isolated from BMDMs, captured using streptavidin beads, and subjected to western blot against hnRNPL.
(K) The 3′-region (2000 – 2531 nt) of lincRNA-EPS is necessary and sufficient to suppress Cxcl10 expression. lincRNA-EPS−/− iBMDMs expressing full-length or deletion mutants of lincRNA-EPS were stimulated with LPS for 6 hr, and mRNA levels analyzed by RT-qPCR. *, p < 0.05; **, p < 0.01.
(L) Schematic of CANACA motifs in the 3′-region (2000 – 2531 nt) of lincRNA-EPS. The nucleotide mutations in CANACA tracts are highlighted.
(M) lincRNA-EPS binds hnRNPL through a CANACA motif (2386 – 2391 nt) embedded in its 3′-region. In vitro RNA: protein binding assay was performed using biotinylated WT or CANACA tract mutant versions of the full-length lincRNA-EPS, captured using streptavidin beads, and subjected to western blot against hnRNPL.
(N) Functional role of CANACA motif (2386 – 2391 nt) of lincRNA-EPS. lincRNA-EPS−/− BMDMs expressing WT or the point mutants of the full-length lincRNA-EPS (defective in hnRNPL binding) were stimulated with LPS for 6 hr, and mRNA levels analyzed by RT-qPCR. **, p < 0.01.
See also Figure S5.
A
uthor Man
uscr
ipt
A
uthor Man
uscr
ipt
A
uthor Man
uscr
ipt
A
uthor Man
uscr
ipt
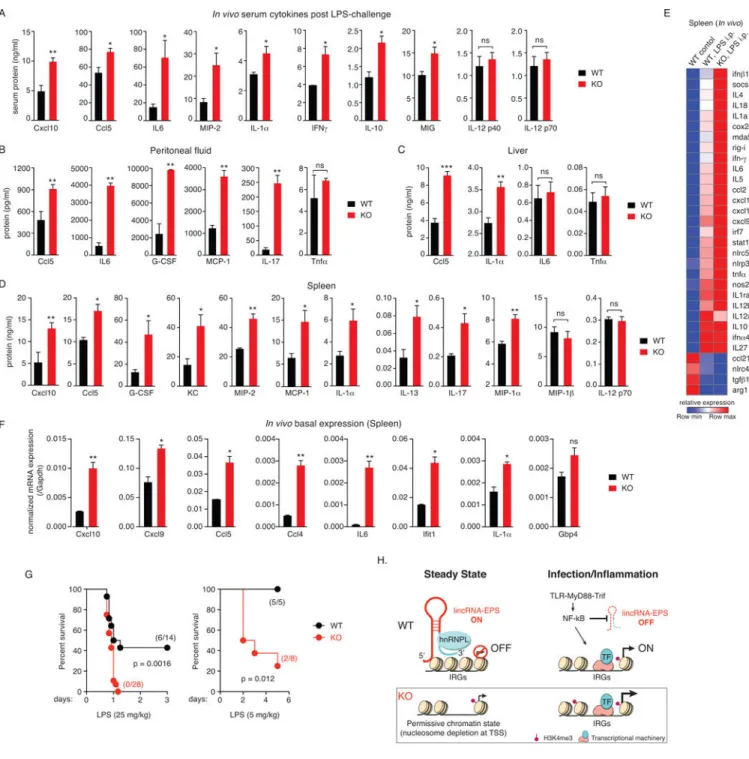
Figure 7. lincRNA-EPS restrains inflammation in vivo
(A–D) Cytokine levels in serum (A), peritoneal fluid (B), liver (C) and spleen (D) of WT and lincRNA-EPS−/− (KO) mice challenged i.p. with E. coli LPS (5 mg/kg/mice) for 5 hr.
Data are shown as mean ± SEM (n = 4–6 mice per group). *, p < 0.05; **, p < 0.01, ***, p < 0.001; ns, not significant.
(E) Heatmap of gene expression in spleens isolated from WT and lincRNA-EPS−/− mice
challenged i.p. with LPS for 5 hr, and analyzed by NanoString. Image represents fold change relative to untreated WT mice for all genes that were differentially expressed at least 2-fold in response to LPS (n = 4–6 mice per group).
A
uthor Man
uscr
ipt
A
uthor Man
uscr
ipt
A
uthor Man
uscr
ipt
A
uthor Man
uscr
ipt
(F) Basal gene expression profiles of IRGs in vivo in spleens isolated from WT and lincRNA-EPS−/− mice, and analyzed by RT-qPCR. *, p < 0.05; **, p < 0.01; ns, not significant.
(G) Survival data of WT and lincRNA-EPS−/− mice in response to LPS challenge. The numbers of mice that survived in each condition is provided. The statistical test of differences was calculated using Log-rank (Mantel-Cox) test with p < 0.05 considered as significant.
(H) Integrated model depicting lincRNA-EPS as a transcriptional brake that controls basal and inducible expression of IRGs in macrophages. TF, transcription factor.
See also Figure S6.