HAL Id: hal-00329298
https://hal.archives-ouvertes.fr/hal-00329298
Submitted on 19 Mar 2004
HAL is a multi-disciplinary open access
archive for the deposit and dissemination of
sci-entific research documents, whether they are
pub-lished or not. The documents may come from
teaching and research institutions in France or
abroad, or from public or private research centers.
L’archive ouverte pluridisciplinaire HAL, est
destinée au dépôt et à la diffusion de documents
scientifiques de niveau recherche, publiés ou non,
émanant des établissements d’enseignement et de
recherche français ou étrangers, des laboratoires
publics ou privés.
Horizontal maps of echo power in the lower stratosphere
using the MU radar
M. Hirono, Hubert Luce, M. Yamamoto, S. Fukao
To cite this version:
M. Hirono, Hubert Luce, M. Yamamoto, S. Fukao. Horizontal maps of echo power in the lower
stratosphere using the MU radar. Annales Geophysicae, European Geosciences Union, 2004, 22 (3),
pp.717-724. �hal-00329298�
SRef-ID: 1432-0576/ag/2004-22-717 © European Geosciences Union 2004
Annales
Geophysicae
Horizontal maps of echo power in the lower stratosphere using the
MU radar
M. Hirono1, H. Luce2, M. Yamamoto1, and S. Fukao1
1Radio Science Center for Space and Atmosphere, Kyoto University, Gokasho, Uji, Kyoto 611-0011, Japan
2LSEET Laboratoire de Sondages Electromagn´etiques de l’Environnement Terrestres Universit´e de Toulon et du Var BP 132 83957 La Garde Cedex, France
Received: 4 December 2002 – Revised: 28 August 2003 – Accepted: 4 September 2003 – Published: 19 March 2004
Abstract. In recent works, zenithal and azimuthal angle
variations of echo power measured by VHF Stratosphere-Troposphere (ST) radars have been analyzed in detail using different radar multi-beam configurations. It was found that the azimuthal angle corresponding to maximum echo power is closely related to the direction of the horizontal wind shear. These properties indicate that local wind shear affects the tilt of the scatterers. Moreover, horizontal maps of echo power collected using a large set of beams steered pulse-to-pulse up to 40 degrees off zenith revealed that the power distribu-tion pattern in the troposphere is often skewed. In this work, a three-dimensional description of echo power variations up to 24 degrees off zenith is shown for measurements in the lower stratosphere (i.e. up to approximately 20 km) using a “sequential multi-beam” (SMB) configuration. Such a de-scription was not possible above the tropopause with clas-sical multi-beam configurations because of the loss of radar sensitivity due to the limited integration time by the use of a large number of beams. This work attempts to complete previous descriptions of the phenomenon by some observa-tions in the lower stratosphere discussed in association with complementary balloon measurements.
Key words. Meteorology and atmospheric dynamics
(turbu-lence) – Radio Science (remote sensing)
1 Introduction
Flexible VHF Stratosphere-Troposphere (ST) radars such as the Middle and Upper atmosphere (MU) radar (Shigaraki, Japan, 34.85◦N, 136.10◦E) make it possible to volume-image the distribution of echo power by pulse-to-pulse steer-ing of multiple radar beams. This ability permits us to im-prove our knowledge of VHF backscattering. The zenith as-pect sensitivity, i.e. the decrease of echo power as the radar beam is pointed away from zenith, observed very early after the development of the ST radar technique, indicates that the Correspondence to: M. Hirono
scatterers are anisotropic at the Bragg scale (i.e. the half radar wavelength). This property was mainly observed in the lower stratosphere (Gage and Green, 1978; R¨ottger and Liu, 1978). Recently, the azimuthal dependence of echo power was thoroughly analyzed (Tsuda et al., 1997; Worthington and Thomas, 1997; Palmer et al., 1998), and it was found that the azimuth angle for which the power maximum is ob-served is strongly related to the horizontal wind shear direc-tion. This property implies that the local wind shear affects the azimuthal distribution of the scatterers. Worthington et al. (1999) reported that the phenomenon could be observed at zenith angles larger than 10 degrees in the troposphere, where it was previously believed that the isotropic backscat-tering mechanism is dominant. Power imbalances between oppositing beam directions can reach 10 dB or more at 10 degrees off zenith after 1-h averaging.
From measurements performed using a multi-beam scheme with pulse-to-pulse beam steering, (e.g. Palmer et al., 1998; Worthington et al., 1999, 2000), it was clearly shown that horizontal maps of echo power are skewed and sometimes very scattered. This property indicates that the azimuthal dependence of echo power does not merely result from tilting of scattering layers (for example, tilts produced by a long-period gravity wave or the tilt of isentropic surfaces at synoptic scales), but rather results from facets of corru-gated layers with a predominant orientation constrained by the local wind shear. It is now suggested that this mecha-nism is a more likely source than anisotropic turbulence (e.g. Hocking and Hamza, 1997; Worthington et al., 2000). The horizontal maps produce an image of the angular distribu-tion of the facets’ tilts smeared by the radar volume and time averaging. This idea is quite different from the hypothesis proposed by Tsuda et al. (1997), who considered a model of monochromatic gravity waves with large horizontal wave-lengths to explain the azimuthal dependence of echo power at a fixed zenith angle. However, the latter model cannot explain the skew of the distribution which can also produce sinusoidal variations when considering a fixed zenith angle. Worthington et al. (1999) proposed that the characteristics of power maps result rather from a small-scale KHI mechanism.
718 M. Hirono et al.: Horizontal maps of echo power
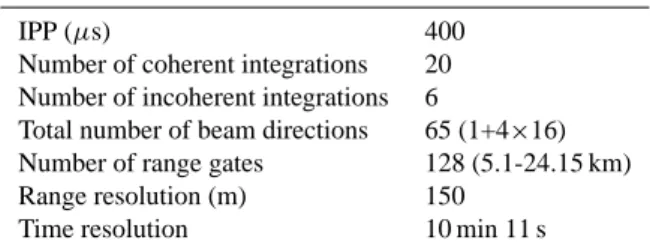
Table 1. SMB configuration.
IPP (µs) 400
Number of coherent integrations 20 Number of incoherent integrations 6
Total number of beam directions 65 (1+4×16) Number of range gates 128 (5.1-24.15 km) Range resolution (m) 150
Time resolution 10 min 11 s
However, since the azimuthal dependence seems to be quite systematic, it is still not well-understood if the KHI mecha-nism is always the source of the phenomenon or not, and if the various characteristics result from KHI events at different stages of their development. More conclusive results could perhaps be obtained with more quantitative comparisons.
The purpose of this work is to describe the characteris-tics of the zenithal and azimuthal aspect sensitivity in the lower stratosphere in comparison to balloon measurements. Horizontal power maps have already been obtained with the MU radar up to 40 degrees off zenith but only in the tropo-sphere, i.e. below approximately 10 km because the radar sensitivity decreases as the number of beams increases when steered pulse-to-pulse. Indeed, if the number of beams is in-creased by factor n, the number of coherent integrations is divided by n for the same Nyquist frequency of the Doppler spectra. The received power is then reduced by factor n2. Maps have been obtained using the same technique in the lower stratosphere (up to approximately 15 km) but for zenith angles smaller than 5 degrees for the same reason (echoes cannot be detected at larger zenith angles). Therefore, the characteristics of the horizontal power maps at zenith angles larger than 5–10 degrees in the lower stratosphere are still poorly documented. Since the lower stratosphere is usually affected by instabilities due to long-lived gravity waves, the detailed characteristics of power maps may be particularly interesting. Mapping is not possible using a classical multi-beam configuration, except perhaps during exceptional con-ditions of intense reflectivity episodes related to strong turbu-lent events. However, such events may not be representative of the dominant features in the lower stratosphere.
We propose a configuration to perform observations up to 24 degrees off zenith by using several consecutive 5-beam DBS modes at different zenith and azimuth angles, which we call the “Sequential multi beam” (SMB) configuration. SMB permits us to preserve the same radar sensitivity as the standard DBS mode and yet obtain reliable observations up to 20 km or higher. Section 2 describes the advantages and drawbacks of SMB, and describes the radar parameters of the SMB experiment on 11–12 November 2001. Some ob-servational results for stratospheric ranges are described in Sect. 3 and discussed under the dynamic stability conditions deduced from radar and balloon measurements. Finally, con-cluding remarks are given in Sect. 4.
2 The SMB configuration
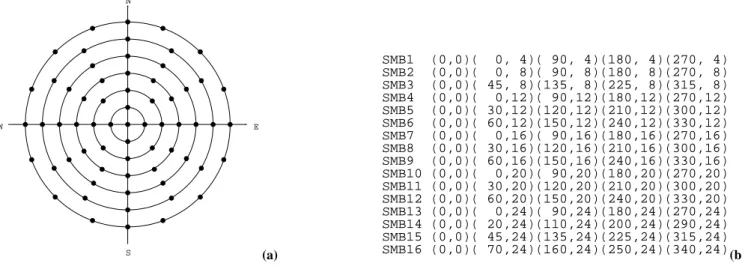
Figure 1 shows the radar beam distribution viewed from above. Sixteen groups of five beams (steered every inter-pulse-period set at 400 µs), corresponding to a total num-ber of 65 beam directions, have been used and observations with each group were performed sequentially. Each group includes the vertical beam for observations overhead, with a time resolution corresponding to the acquisition time of a single group. The oblique beams of the sixteen groups were steered such that observations could be performed up to 24 degrees off zenith in steps of 4 degrees and at azimuths given by (α, α + 90, α + 180, α + 270) degrees, where α is the az-imuth of the first oblique beam (see Fig. 1). Such a configu-ration allows for 16 estimates of wind profiles to be obtained. Table 1 lists other parameters of the SMB experiment. The maximum radial velocity is 40.31 ms−1, in order to avoid Doppler aliasing for beam angles far from the zenith. The maximum speed of the jet-stream was about 62 ms−1at an altitude of 11.40 km.
It should be noted that SMB experiments are carried out to the detriment of the acquisition time. Furthermore, the data for the first and last group are collected with significant time differences, while the data obtained with the classical multi-beam configuration are almost simultaneous for all the directions. The total acquisition time needed for operating all sixteen groups is about 10 min (8 min 11 s plus time lags corresponding to switching between groups) with the param-eters of the experiment performed on 11–12 November 2001. However, it is worth noting that it is less than twice the to-tal time acquisition of the 320 beam configuration used by Worthington et al. (1999) and that the acquisition time could be reduced to approximately 100 s without the 6 incoherent integrations performed in real time, to reduce the amount of data and to improve the detectability of the radar signal.
Since the power imbalances between opposite beams strongly depend on the shear direction (Worthington and Thomas, 1997), it was expected that relevant data sets could be obtained in the lower stratosphere if the data acquisi-tion time were significantly shorter than the dominant inertial gravity wave period such, that the wind shear direction, mod-ulated by the the gravity wave, does not change significantly. In order to reduce possible power fluctuations resulting from time lags between observations using different groups, we performed 2-h averaging on the collected maps. This experi-ment was therefore intended to analyze the persistent features and was not used to describe the more or less sporadic vari-ations which can appear at very high temporal resolution, as shown by Worthington et al. (2000).
Horizontal maps for each altitude range were obtained by linearly interpolating the oblique profiles at altitudes of the vertical sampling, and the loss of antenna gain has been cor-rected in the same manner as Worthington et al. (1999).
N S E W (a) SMB1 (0,0)( 0, 4)( 90, 4)(180, 4)(270, 4) SMB2 (0,0)( 0, 8)( 90, 8)(180, 8)(270, 8) SMB3 (0,0)( 45, 8)(135, 8)(225, 8)(315, 8) SMB4 (0,0)( 0,12)( 90,12)(180,12)(270,12) SMB5 (0,0)( 30,12)(120,12)(210,12)(300,12) SMB6 (0,0)( 60,12)(150,12)(240,12)(330,12) SMB7 (0,0)( 0,16)( 90,16)(180,16)(270,16) SMB8 (0,0)( 30,16)(120,16)(210,16)(300,16) SMB9 (0,0)( 60,16)(150,16)(240,16)(330,16) SMB10 (0,0)( 0,20)( 90,20)(180,20)(270,20) SMB13 (0,0)( 0,24)( 90,24)(180,24)(270,24) SMB14 (0,0)( 20,24)(110,24)(200,24)(290,24) SMB15 (0,0)( 45,24)(135,24)(225,24)(315,24) SMB16 (0,0)( 70,24)(160,24)(250,24)(340,24) SMB11 (0,0)( 30,20)(120,20)(210,20)(300,20) SMB12 (0,0)( 60,20)(150,20)(240,20)(330,20) (b)
Fig. 1. Layout of the 65 radar beams of the SMB experiment (left) and a table showing the azimuth and zenith directions of the each DBS
set (right).
3 Observation results
3.1 HTI plots of echo power
Figure 2a shows the height-time intensity plot of vertical echo powers for the complete observation period. Strong vertical power enhancements are observed above 9 km, sug-gesting the tropopause altitude. This result is confirmed by the stability (Br¨unt V¨ais¨al¨a frequency (N2)) profile ob-tained from balloon temperature and pressure measurements at 00:43 LT (Fig. 3). This profile reveals a significant N2 enhancement above 9 km characteristic of the tropopause. As classically reported with the MU radar, for example, (Tsuda et al. 1986), intense and long-lived echoing layers are detected in the lower stratosphere (Figure 2b). Their heights vary slowly while many successive echoing layers show downward motions in the high troposphere. These lay-ers may result from stratospheric air intrusions (e.g. recently, Vaughan and Worthington, 2000). We did not analyze these structures in detail since their study is not the topic of the present paper. Figure 2b shows echo power profiles averaged from 22:39 to 00:46 LT for zenith angles from 0 to 24 de-grees. The oblique-beam echo power profiles have been av-eraged in azimuth, in order to show the zenithal aspect sensi-tivity only. The profiles can be divided into three categories: (1) the echoes are particularly intense and aspect sensitive above 9 km and below 14 km (the vertical echo power en-hancement is about 20 dB with respect to the power received at 24◦ off zenith); (2) a nearly isotropic region can be no-ticed between 16 and 20 km (the vertical enhancement does not exceed 7 dB). A thick and nearly isotropic echoing layer is detected between 17 and 18 km; (3) the very thin peak lo-cated at 14.25 km has intermediate characteristics: It is as-sociated with a vertical echo power enhancement similar to case (1) but the received power decreases more slowly than below 14 km (i.e. the angular aspect sensitivity is wider than below 14 km).
The characteristics of echo power maps at two height ranges delimited by the horizontal dotted and dashed lines (13.05–14.25 km and 17.10–18.30 km, respectively) will be analyzed in detail. They will be called hereafter “AS” (aspect sensitive) and “NI” (nearly-isotropic) regions, respectively, for simplicity. These regions have been chosen because the power maps reveal very specific characteristics and because the AS region contains ranges corresponding to cases (1) and (3) and the NI region to case (2).
3.2 Stability conditions
Figure 3c shows the Richardson number (Ri) profile at the radar range resolution (150 m). The Ri parameter describes the dynamic stability of the flow. It is estimated from the ra-tio between N2 (Fig. 3b) and the modulus squared of the wind shear S=p(1u/1z)2+(1v/1z)2 (Fig.3a) deduced from radar measurements of the zonal (u) and meridional (v) wind components. Unfortunately, the balloon burst at around 15 km, so that temperature data are not available above this altitude and the dynamic conditions cannot be analyzed for the NI region. The Ri number is larger than 0.25, indicated by vertical dotted-dashed line in Fig. 3c everywhere (a local
Rismaller than 0.25 is a necessarily condition for dynamic instability), but this parameter is scale-dependent and values larger than 0.25 at a 150-m scale do not necessary mean the absence of local instabilities. The AS region is roughly, but significantly, associated with a minimum Ri number (close to 0.25). It results mainly from a shear enhancement, since the static stability N2does not differ from the stability be-low the AS region and above 9 km. The presence of shear instabilities is therefore plausible.
720 M. Hirono et al.: Horizontal maps of echo power
Fig. 2. (a) Time-height variations of the echo power and (b) height variations of the echo power averaged from 22:39 to 00:46 LT
corre-sponding to the period delimited by the two solid vertical lines in (a). The dotted and solid horizontal lines in (b) correspond to the analyzed ranges shown in Figs. 5a and b, respectively.
Fig. 3. Height variations of (a) the horizontal wind shear S, (b) the Br¨unt V¨ais¨al¨a frequency N2and (c) the Richardson number Ri = N2/S2.
N2is obtained from temperature and pressure measurements by a balloon launched at 00:43 LT and the wind shear, measured by the MU radar, is averaged from 22:39 to 00:46 LT. The horizontal dotted lines in (c) correspond to the analyzed range shown in Figs. 5a. The vertical dotted-dashed line in (c) indicates the critical Richardson number of 0.25 which is necessary for dynamic instability.
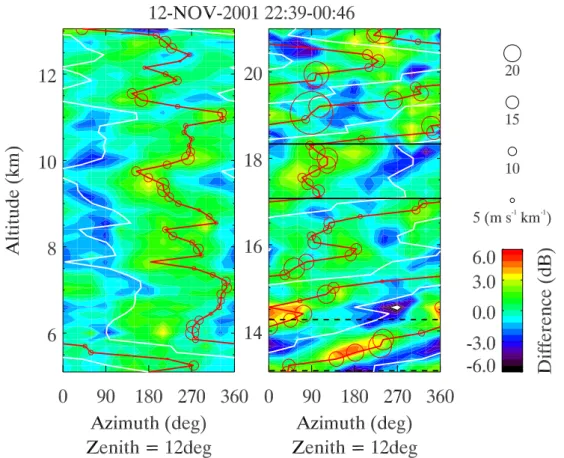
Fig. 4. Height variations of the azimuth dependence of echo power averaged from 22:39 to 00:46 LT. The red and white lines indicate wind
shear direction defined by S = (−1u/1z, −1v/1z) and S = (1u/1z, 1v/1z), respectively. The radius of red circles indicates the wind shear magnitude. The horizontal black dotted and solid lines correspond to the analyzed ranges shown in Figs. 5a and b, respectively.
3.3 Azimuthal dependence of echo power at 12 degrees off zenith
Figure 4 shows a typical example of height variations of the azimuth angle dependence of echo power averaged over 2 h between 22:39 LT and 00:46 LT at 12 degrees off zenith. The mean echo power value has been subtracted from the ob-served echo power at each height. A similar example was shown by Tsuda et al. (1997) but at 6 degrees off zenith be-tween 11 and 15.6 km and for observation intervals of 137 s. The corresponding wind shear direction measured by the MU radar is also indicated by a red curve. The radius of the red circles indicates the wind shear magnitude. This figure con-firms the relationship between the maximum of echo power and the direction of the wind shear vector as shown previ-ously by Worthington and Thomas (1997). The plots reveal only single humped height variations; double humped vari-ations, similar to those revealed by Tsuda et al. (1997, their Fig. 4), have not been found either because they are more sel-dom or because the phenomenon is more sporadic and disap-peared due to time averaging. Similar effects can be deduced from echo power maps shown in Fig. 5 of Worthington et al. (2000) at smaller zenith angles and with a shorter time resolution.
Above the tropopause, a clockwise rotation of both wind shear vectors and direction of echo power maximum is
clearly observed at some altitude ranges (within the AS re-gion, for example). This feature is a clear signature of a dominant inertia-gravity wave of 1–2 km vertical wavelength usually observed above the MU radar location (e.g. Fritts et al., 1988; Sato, 1994). The AS region is associated with the strongest azimuthal power dependence, while this depen-dence is not so strong within the NI region or between 9 and 13 km, where the aspect sensitivity is similar. It is also worth noting that the selected NI and AS regions correspond to en-hanced wind shears, as indicated by the red circles.
3.4 Power maps
Figure 5a shows the corresponding horizontal maps of echo power for 9 consecutive gates within the AS region from 13.05 to 14.25 km. The wind shear, resulting from the av-erage of several estimates from different groups at 8, 12 and 16 degrees off zenith is indicated by white arrows. The black dots indicate the direction of the radar beams and the white dashed circles correspond to a zenith angle of 10 degrees used for standard DBS observations.
Owing to the configuration used, the characteristics of the horizontal distribution of echo power up to 24 degrees are then described in the lower stratosphere and complete the works by Palmer et al. (1998) and Worthington et al. (1999, 2000). As expected from Fig. 4, the relationship between the
722 M. Hirono et al.: Horizontal maps of echo power (a)
(b)
Fig. 5. Horizontal maps of echo power from (a) 13.05 km to 14.25 km and (b) 17.10 km to 18.30 km averaged from 22:39 to 00:46 LT.
White arrows indicate the wind shear direction and magnitude. The white dashed circles correspond to a zenith angle of 10◦. The black dots indicate the direction of the radar beams.
skew of the distribution and the direction of the wind shear is evident. Both parameters show a gradual clockwise rotation with altitude increase. The altitude range covered by the map series corresponds to one vertical wavelength of the quasi-monochromatic gravity wave. Even at 10 degrees off zenith, the power dependence can still be very significant: for exam-ple, a difference of 8–10 dB is observed at 13.50 km between the north and south directions. It is interesting to note that the asymmetry of the power distribution can still reach 5 dB or more at a zenith angle of 24 degrees. These results for the stratosphere (a strongly stratified region) are consistent with those given by Worthington et al. (1999) for the troposphere (a less stratified region). The gates at 14.10 and 14.25 km
(corresponding to case 3) and at 13.50 and 13.65 km (case 1) do not reveal significant differences but the former show a less pronounced skew.
It is to be noted that, since the resolution of the grid is not sufficient around the zenith, it is not possible to identify the exact position of the maximum and then to show if the skew of the distribution is also related to a tilted structure on average.
Figure 5b shows the power maps for the NI region between 17.10 and 18.30 km. The scatter of the distribution appears to be more pronounced. These maps are similar to some ob-served in the troposphere in the present data sets (not shown) and by Worthington et al. (2000). Some maps, at 17.70 km or
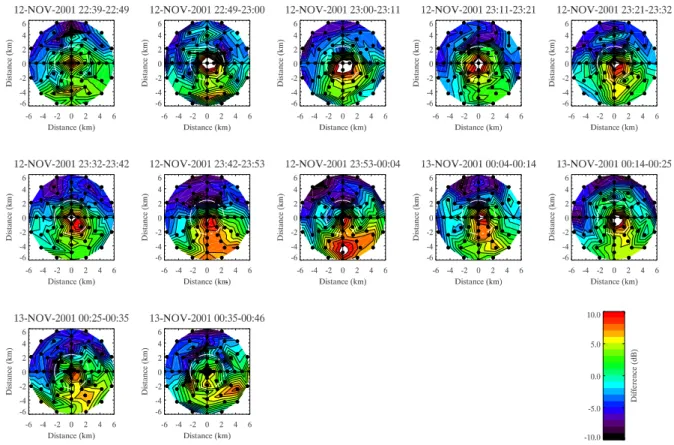
Fig. 6. Non averaged maps of echo power from 22:39 to 00:46 LT at 13.50 km.
18.15 km, for example, seem to suggest a power maximum far away from the zenith, as already noted by Worthington et al. (1999), for weakly zenith aspect sensitive echoes in the troposphere. If produced by fully-developed, 3-D turbu-lence, these maps suggest that the tilts of the small-scale tur-bulent irregularities are still oriented predominantly by the local wind shear but that the distribution of tilt angles are, however, more scattered than for the case where the echoes are produced by stable layers.
Figure 6 shows horizontal echo power distributions with-out time averaging at 13.50 km. It is interesting to note that all these maps reveal the same gross features as the averaged map shown in Fig. 5a, even though, as expected, they appear more variable. This result tends to indicate that the time lags between the 16 radar configurations for collecting a complete map are not a drawback in practice and that the spread of the distribution after 2-h averaging does not result from the time averaging. In the present case, the 2-h averaged maps are, therefore, representative of the main characteristics revealed by maps that would have been obtained at a shorter time ac-quisition.
4 Dicussion and concluding remarks
In this work, we analyzed the 3-D echo power distribu-tion within the lower stratosphere obtained with a sequential multi-beam experiment in association with balloon
observa-tions. The power maps reveal similar features to those re-ported by Palmer et al. (1998) and Worthington et al. (1999) within the troposphere. The skew of the distribution varies but is observed at all altitudes. The characteristics of the power maps are clearly affected by inertial gravity waves. However, in the troposphere, there is no signature of such waves. It is then important to emphasize that the relation-ship between the wind shear direction and the direction of the skew of the echo power distribution is not constrained by the presence of a gravity wave. A similar feature is observed within the NI region.
The strong aspect sensitivity observed between 9 and 14 km is related to a strong azimuthal dependence only in the AS region (13.05–14.25 km), where the Ri number is close to 0.25 (Figs. 4 and 5a). This characteristic seems to indicate that stable layers are distorted by the onset of instabilities within the AS region, while they are not so distorted below 13 km. Since zenith aspect sensitivity is still strong, it may be suggested that the instabilities are not sufficient to pro-duce wave-breaking after which turbulence could attenuate the zenithal and azimuthal echo power dependence. How-ever, the detailed underlying mechanisms which produce the power maps of Figs. 5a and b are still not clearly identified. The NI region may also correspond to a height range where dynamic instabilities occur. Contrary to the AS region, these instabilities may have produced a thick turbulent region lead-ing to nearly isotropic echoes with a much weaker, but still significant, azimuthal dependence. The absence of rotation
724 M. Hirono et al.: Horizontal maps of echo power of wind shear within the NI region may indicate that
tur-bulent mixing, possibly resulting from wave breaking, may have affected the wave propagation. However, we do not have Ri information from balloon measurements to confirm this hypothesis.
Significant power imbalances are observed at beam angles larger than 10 degrees when echoes are zenithally aspect sen-sitive. Similar to the zenithal dependence of echo power, the observed azimuthal dependencies do not seem to affect dramatically the accuracy of the wind measurements, since no bias was reported by Luce et al. (2001) when compar-ing GPS and MU radar wind observations. However, small effects, statistically not representative, can still occur in the case of strong azimuthal dependence, and more dramatic ef-fects cannot be ignored for smaller zenith angles. Thus, wind correction using a simple model, assuming solely zenith an-gle dependence of the echo power (Hocking et al., 1990) may not be suitable. A specific analysis will be performed in a fu-ture paper.
Acknowledgements. The data used in this study were collected with the MU radar operated by RASC, Kyoto University. We are deeply indebted to Dr. N. Kawano and Dr. G. Hassenpflug for the helpful comments and suggestions.
Topical Editor U.-P. Hoppe thanks a referee for his help in eval-uating this paper.
References
Fritts, D. C., Tsuda, T., Sato, T., Fukao, S., and Kato, S.: Observa-tional evidence of a saturated gravity wave spectrum in the tro-posphere and lower stratosphere, J. Atmos. Sci., 45, 1741–1759, 1988.
Gage, K. S. and Green, J. L.: Evidence for specular reflection from monostatic VHF radar observations of the stratosphere, Radio Sci., 13, 991–1001, 1978.
Hocking, W. K., Fukao, S., Tsuda, T., Yamamoto, M., Sato, T., and Kato, S.: Aspect sensitivity of stratospheric VHF radio
wave scatterers, particularly above 15-km altitude, Radio Sci., 25, 613–627, 1990.
Hocking, W. K. and Hamza, A. M.: A quantitative measure of the degree of anisotropy of turbulence in terms of atmospheric parameters with particular relevance to radar studies, J. Atmos. Terr. Phys., 59, 1011–1020, 1997.
Luce, H., Fukao, S., Yamamoto, M., Sidi, C., and Dalaudier, F.: Validation of winds measured by MU radar with GPS radioson-des during the MUTSI campaign, J. Atmos. Ocean. Tech., 18, 817–829, 2001.
Palmer, R. D., Larsen, M. F., Fukao, S., and Yamamoto, M.: On the relationship between aspect sensitivity and spatial interferomet-ric in-beam incidence angles, J. Atmos. Terr. Phys., 60, 37–48, 1998.
R¨ottger, J. and Liu, C. H.: Partial reflection and scattering of VHF radar signals from the clear air atmosphere, Geophys. Res. Lett., 5, 357–360, 1978.
Sato, K.: A statistical study of the structure, saturation and sources of inertia gravity waves in the lower stratosphere observed with the MU radar, J. Atmos. Terr. Phys., 56, 755–774, 1994. Tsuda, T., Gordon, W. E., and Saito, H.: Azimuth-angle variations
of specular reflection echoes in the lower atmosphere observed with the MU radar, J. Atmos. Terr. Phys., 59, 777–784, 1997. Tsuda, T., Sato, T., Hirose, K., Fukao, S., and Kato, S.: MU radar
observations of the aspect sensitivity of backscattered VHF echo power in the troposphere and the lower stratosphere, Radio sci., 21, 971–980, 1986.
Vaughan, G. and Worthington, R. M.: Break-up of a stratospheric streamer observed by MST radar, Q. J. R. Meteorol. Soc., 126, 1751–1769, 2000.
Worthington, R. M., Palmer, R. D., and Fukao, S.: Complete maps of the aspect sensitivity of VHF atmospheric radar echoes, Ann. Geophysicae, 17, 1116–1119, 1999.
Worthington, R. M., Palmer, R. D., Fukao, S., Yamamoto, M., and Astin, I.: Rapid variations in echo power maps of VHF radar backscatter from the lower atmosphere, J. Atmos. Sol. Terr. Phys., 62, 573–581, 2000.
Worthington, R. M. and Thomas, L.: Long-period unstable gravity waves and associated VHF radar echoes, Ann. Geophysicae, 15, 813–822, 1997.