HAL Id: hal-03236421
https://hal.inria.fr/hal-03236421
Submitted on 26 May 2021
HAL is a multi-disciplinary open access
archive for the deposit and dissemination of
sci-entific research documents, whether they are
pub-lished or not. The documents may come from
teaching and research institutions in France or
abroad, or from public or private research centers.
L’archive ouverte pluridisciplinaire HAL, est
destinée au dépôt et à la diffusion de documents
scientifiques de niveau recherche, publiés ou non,
émanant des établissements d’enseignement et de
recherche français ou étrangers, des laboratoires
publics ou privés.
Kwollect: Metrics Collection for Experiments at Scale
Simon Delamare, Lucas Nussbaum
To cite this version:
Simon Delamare, Lucas Nussbaum. Kwollect: Metrics Collection for Experiments at Scale. CNERT
2021 - Workshop on Computer and Networking Experimental Research using Testbeds, May 2021,
Virtual, United States. pp.1-6. �hal-03236421�
Kwollect: Metrics Collection
for Experiments at Scale
Simon Delamare
∗and Lucas Nussbaum
†∗Univ Lyon, EnsL, UCBL, CNRS, Inria, LIP, F-69342, LYON, France. †Université de Lorraine, CNRS, Inria, LORIA, F-54000 Nancy, France
Abstract—It has become a common requirement for testbeds to provide a service in charge of collecting and exposing met-rics, thus assisting experimenters with the central task of data collection. This paper describes Kwollect, a service designed and developed in the context of the Grid’5000, to collect infrastructure metrics (including high-frequency wattmeters) and expose them to experimenters. Kwollect scales to high frequencies of metrics collection for hundreds of nodes. It can also be leveraged by the experimenter to collect custom metrics.
Index Terms—testbeds; experiments; metrics collection; mea-surement; monitoring
I. INTRODUCTION
Most testbed experiments require collecting metrics about the system, service or application under test, and its sur-rounding environment. This encompasses different kinds of metrics, such as (1) metrics about the experimental environ-ment, reflecting aspects that can influence the experiment – for example, environmental metrics (temperature, humidity) can influence performance, as a hotter machine limits the ability of its CPU to temporarily increase its performance; (2) metrics that are part of the output of experiments, such as power consumption of the system under test, measured outside the node, or inside it, using interfaces such as Intel RAPL; (3) metrics that help understand the experiment behavior, such as network metrics as seen from network equipments.
Whether testbeds address experiments on IoT, 5G, HPC or clouds, it has thus become a common requirement for them to provide services supporting users through the process of ac-cessing and collecting those metrics, by providing interfaces to infrastructure metrics and facilitating data collection. However, as we will detail later, those services are often limited in terms of features, and in terms of their ability to scale up to large number of metrics collected at high frequency.
This paper describes Kwollect, a service to provide access to infrastructure metrics (including high-frequency wattmeters, hence the name) and facilitate data collection from all nodes involved in an experiment. It has been developed in the context of the Grid’5000 testbed, but it is designed to be used on any infrastructure. Kwollect can collect metrics at high frequency (sub-second), and then expose them to the experimenter either through a REST API, or through a web interface that provides interactive visualization. In addition to providing access to a wide range of infrastructure metrics, Kwollect can also be extended by the experimenter to collect additional custom
metrics. Kwollect is also built from the lessons learned while operating a first version of a monitoring service, Kwapi [1].
The paper is organized as follows. Section II provides background about Grid’5000 (II-A), and analyzes related work (II-B). Section III details Kwollect’s design. Its deployment on Grid’5000, along with an example use case, is presented in Section IV. Performance is evaluated in Section V.
II. BACKGROUND
A. The Grid’5000 testbed
Grid’5000 [2] focuses on all areas of distributed systems re-search, including High Performance Computing (HPC), cloud and edge computing, and AI. It can be seen as an European equivalent to testbeds like Chameleon and CloudLab.
In the research areas addressed by Grid’5000, the ability to experiment at scale is crucial, and the testbed optimizes for this use case, for example by encouraging rather short reservations of many simultaneous resources. The testbed is composed of sites, with each site gathering up to 374 nodes (servers), for a total of 806 nodes. It is not unusual to see experiments running on hundreds of nodes, which stresses correspondingly the monitoring service. Also, in those research areas (and especially in HPC), experimenters are often interested in subtle behavior that is only visible when metrics are collected at a high frequency (1 Hz or higher).
The main historical motivation for providing a measurement service to Grid’5000 users was the very active national re-search community around energy efficiency. Their experiments rely heavily on specific hardware (wattmeters) for precise power measurements, able to uncover the impact of application behavior on power consumption.
B. Related work
There are three types of solutions that serve similar, yet different purposes.
Testbed infrastructure monitoring services (TIMS) are ser-vices that are used by testbed operators to monitor the health of the testbed, using solutions such as Munin, Nagios, Gan-glia [3] or more recentlyPrometheus[4]. Given they serve this purpose very well, it might be tempting to design a service exposed to experimenters on top of such solutions. However those services are generally designed to provide coarse-grained metrics at low frequency (one measurement every few seconds, or more), and the design of their metrics storage solution makes them hardly compatible with the requirements of most
experiments, that need high frequency measurements to un-derstand subtle system or application behavior. In addition, these solutions are primarily designed to monitor metrics collected by nodes’ operating systems. Their ability to monitor external devices, such as Power Delivery Unit (PDU) or server’s Baseboard Management Controller (BMC, such as Dell’s iDRAC) is often provided as a second-class extension, whereas it is a primary objective of Kwollect.
Testbed-provided measurement services (TPMS) are ser-vices, like Kwollect, that are responsible for collecting data and exposing it. They can cover infrastructure data (from network equipment, power distribution equipment, baseboard management cards), data from environmental sensors, and also sometimes experimenter-provided data (by running an agent on nodes). A common such service on wireless testbeds, de-ployed for example on the COSMOS testbed [5], isOML [6], [7] (ORBIT Measurement Library), which is part of the Orbit Management Framework (OMF) [8]. On the Chameleon Cloud testbed, the OpenStack Gnocchi service [9] is used for the same purpose, relying on collectd as the agent running on each node (with data retrieved every 10s), and completing it with power data retrieved over IPMI [10]. On the Grid’5000 testbed, Kwapi [1] was used before Kwollect replaced it. In the past, PlanetLab provided COMon [11] to expose statistical information about testbed nodes and slices allocated to users. Experimenter-managed measurement services (EMMS) are services installed and managed by the experimenter, as part of the experiment setup, that are responsible for collecting data. They range from basic tracing scripts and system tracing tools (strace, eBPF, etc.) to more complex solutions such as Monex [12], that combines off-the-shelf solutions such as Prometheus, InfluxDB and Grafana.
While TIMS are out of scope for this work, TPMS and EMMS both provide complementary perspectives. With an EMMS, experimenters are fully in charge of designing how data will be extracted from their experiments, which brings a lot of power and flexibility at the expense of the corresponding engineering burden. With a TPMS, the experimenter has to fit into the provided model for metrics collection, but is freed from most of the corresponding engineering burden. A compelling advantage of TPMS over EMMS is that they can provide access to metrics that are not normally accessible to users (data from infrastructure components such as network equipment, power distribution equipment, servers management cards, sensors, etc.) while limiting the impact on the security of the infrastructure, because the necessary filters can be implemented inside the TPMS if needed.
III. KWOLLECTDESIGN
This section describes Kwollect’s design and explain choices that were made. Figure 1 gives an overview of Kwollect components that will be presented here. At its core, Kwollect leverages TimescaleDB (a PostgreSQL extension) to provide efficient metrics storage. Its REST API is directly provided through another PostgreSQL extension, maximizing performance. Metrics are collected by a set of Kwollectors,
Fig. 1: Kwollect components
that are autonomous programs and can run in parallel, to ensure scalability when polling a large number of targets. Fi-nally, a graphical user interface is also provided for interactive visualization. Kwollect is free software. Its source code and installation instructions are available online1.
A. Metrics storage
Kwollect uses a PostgreSQL database with its TimescaleDB extension for metric storage. Using a well established rela-tional database such as PostgreSQL delivers many benefits: it allows to associate metrics with other data available to PostgreSQL (made available using PostgreSQL’s foreign data wrappers) using standard SQL joins. It also takes advantage of PostgreSQL’s maturity and rich ecosystem.
However, by default, PostgreSQL do not offer strong per-formance when managing large timeseries-oriented datasets. A naive approach consisting in inserting data into a single table would not scale, as the table would keep growing which would eventually cause performance problems: table’s indexes would not fit in system memory, causing intensive input/output operations each time data are accessed.
TimescaleDB solves this problem by performing automatic partitioning of tables according to the timestamps of the data being inserted: It assumes that for most workloads, it is likely that data being inserted or accessed relate to a recent time period. Slicing tables such as the most recent partition would always fit in system memory, and would ensure consistent performance over time, even if large amount of data is being inserted.
TimescaleDB also comes with other useful features for timeseries, such as compression, used by Kwollect to decrease disk usage by a factor of 100, continuous data aggregation and customizable retention policy.
B. Metrics format
Kwollect stores every metrics it collects inside a database table named metrics, using the schema described in Table I.
This format is largely inspired by Prometheus and its derived standard named OpenMetrics.
Each metric data is associated with this information: 1https://gitlab.inria.fr/grid5000/kwollect
Column Type
timestamp timestamp with time zone device_id text
metric_id text
value double precision labels jsonb
TABLE I: Kwollect metrics format used in database
− name : b m c _ p o w e r _ w a t t d e v i c e _ i d : node −1
u r l : snmp : / / p u b l i c @ n o d e −1− admin . domain . com
,→ / 1 . 3 . 6 . 1 . 4 . 1 . 6 7 4 . 1 0 8 9 2 . 5 . 4 . 6 0 0 . 3 0 . 1 . 6 . 1 . 3 u p d a t e _ e v e r y : 5000
− name : p r o m _ n o d e _ p r o c s _ r u n n i n g d e v i c e _ i d : node −2
u r l : p r o m e t h e u s : / / node − 2 . domain . com : 9 1 0 0 /
,→ n o d e _ p r o c s _ r u n n i n g u p d a t e _ e v e r y : 15000
Fig. 2: Kwollector configuration example
• timestamp: The time of the measurement, with micro-second precision;
• device_id: The identifier of the device that is being measured;
• metric_id: The identifier of the metric being measured. The name should also follow Prometheus guidelines2, e.g. metric name suffix should indicate metric’s unit;
• value: The value of the metric at measurement time, as a floating point number;
• labels: Some additional arbitrary values, as JSON (e.g. an alternative name for the device, additional properties that cannot be represented by value field, etc.).
C. Collecting metrics
Kwollectors are in charge of reading metrics from devices and storing resulting values into the database. Kwollectors are autonomous processes: they only need to access the database and the devices they monitor. Therefore there can be several Kwollectors running to monitor different devices and their deployment can be distributed over additional machines. This design allows reading and storing metrics task to easily scale with a very high number of monitored devices.
The implementation we propose for the main Kwollector currently supports reading metrics from Simple Network Man-agement Protocol (SNMP), Intelligent Platform ManMan-agement Interface (IPMI) and Prometheus export protocols. It is written in Python, using the asyncio library to exploit the high concurrency of I/O operations performed by the monitoring task. A single core from a standard server is enough to run a Kwollector that take cares of hundreds of devices with hundreds of metrics each. Kwollectors accept configuration files describing devices and metrics to fetch. An example is provided in Figure 2.
Some Kwollectors dedicated to particular devices have been implemented to address their specificities, such as a Kwollec-tor for high frequency wattmeters available in Grid’5000.
2https://prometheus.io/docs/practices/naming/ [ { " t i m e s t a m p " : " 2 0 2 0 − 1 1 − 2 6 T11 : 5 3 : 5 0 . 1 6 4 8 1 3 + 0 1 : 0 0 " , " d e v i c e _ i d " : " node − 1 " , " m e t r i c _ i d " : " ,→b m c _ p o w e r _ w a t t " , " v a l u e " : 1 3 8 , " l a b e l s " : { } } , { " t i m e s t a m p " : " 2 0 2 0 − 1 1 − 2 6 T11 : 5 3 : 5 0 . 1 6 4 8 1 3 + 0 1 : 0 0 " , " d e v i c e _ i d " : " node − 2 " , " m e t r i c _ i d " : " ,→ p r o m _ n o d e _ p r o c s _ r u n n i n g " , " v a l u e " : 3 9 3 , " l a b e l s " : { } } , { " t i m e s t a m p " : " 2 0 2 0 − 1 1 − 2 6 T11 : 5 3 : 5 5 . 1 7 5 1 2 3 + 0 1 : 0 0 " , " d e v i c e _ i d " : " node − 1 " , " m e t r i c _ i d " : " ,→b m c _ p o w e r _ w a t t " , " v a l u e " : 1 3 8 , " l a b e l s " : { } } , { " t i m e s t a m p " : " 2 0 2 0 − 1 1 − 2 6 T11 : 5 4 : 0 5 . 1 5 0 1 3 9 + 0 1 : 0 0 " , " d e v i c e _ i d " : " node − 2 " , " m e t r i c _ i d " : " ,→ p r o m _ n o d e _ p r o c s _ r u n n i n g " , " v a l u e " : 3 7 1 , " l a b e l s " : { } } ]
Fig. 3: Example result from Kwollect’s REST API
Fig. 4: Illustrative screenshot of the Kwollect visualization dashboard based on Grafana
D. User API
Kwollect provides a REST API for users to retrieve metrics values. The API accepts parameters such as devices list from which to retrieve values, the start and the end of the time period, or to filter by metric name. It returns results in JSON format. An example of result is provided in Figure 3.
The REST API is provided by PostgREST3, that provides a REST API over a PostgreSQL database. Existence of Post-gREST highlights the benefits of using mainstream storage solution such PostgreSQL: it allows Kwollect to provide an API without any need of in-house software development.
Pushing values to the database is also possible for authenti-cated users (access control is based on user privileges defined inside the database).
E. Graphical interface
Using a PostgreSQL-based storage allows using existing visualization solutions, such as Grafana4. Kwollect provides
a preconfigured Grafana dashboard to display metrics values. An example of such dashboard is given in Figure 4.
As Grid’5000 has specific needs conflicting with what Grafana offers (i.e. we require a more constrained interface as we are facing untrusted users), we also developed an alterna-tive dashboard5 using Jupyter notebooks and IPywidgets6, and
Voila7 to convert the notebook to a standard Web application.
3https://postgrest.org/ 4https://grafana.com/
5https://gitlab.inria.fr/grid5000/kwollect-dashboard 6http://ipython.org/
Machine Name CPUs Memory Database Storage
dahu 2x Intel Xeon Gold 6130 (2.10GHz, 16 cores/CPU) 192 GB HDD (Seagate ST4000NM0265-2DC, 4TB) taurus 2x Intel Xeon E5-2630 (2.30GHz, 6 cores/CPU) 32 GB HDD (2x SEAGATE ST3300657SS RAID0, 598GB) troll 2x Intel Xeon Gold 5218 (2.30GHz, 16 cores/CPU) 384 GB + 1.5 TiB Intel Optane DC PMEM SSD NVME (Dell PM1725, 1.6TB) yeti 4x Intel Xeon Gold 6130 (2.10GHz, 16 cores/CPU) 768 GB SSD NVME (Dell PM1725, 1.6TB)
TABLE II: Hardware characteristics of each server hosting Kwollect in the experimentation setup
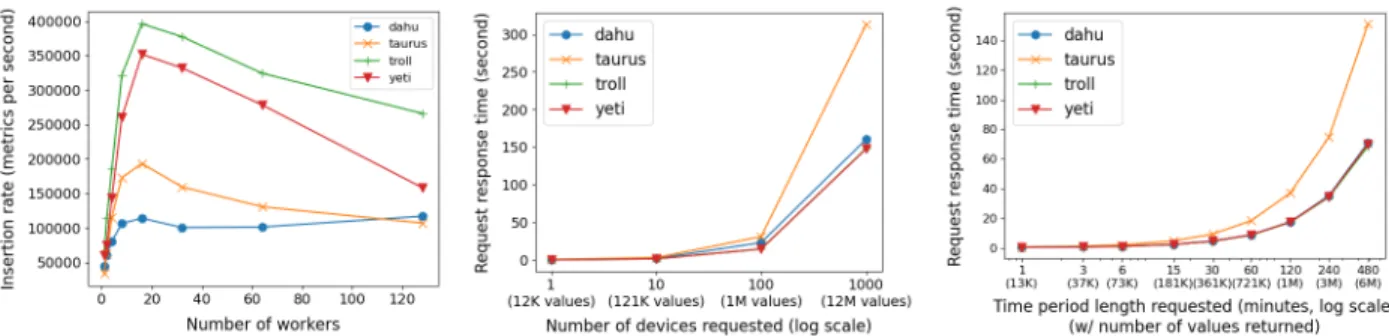
(a) Maximum number of metrics which can be ingested each second, according to the number of workers performing inser-tions in parallel.
(b) Time needed to retrieve metrics val-ues, according to the number of devices involved (over a period of 10 minutes).
(c) Time needed to retrieve metrics values, according to the length of the time period (requesting values for 10 devices.
Fig. 5: Performance results of the experimentation setup where devices have 100 different metrics monitored every 5 seconds. Each results is the average of 5 measurements (dispersion is negligible).
F. Specific features
The versatility of PostgreSQL allows to implement specific features required by a testbed-oriented monitoring solution directly at the database definition level, without requiring any other development, as illustrated by the following examples.
1) Job scheduler integration: Kwollect provides its users an easy way of retrieving metrics from an experiment. In Grid’5000, experiments are orchestrated by OAR, a job scheduling system (an experiment being represented by a job). Integrating metrics information with job scheduler infor-mation is performed by PostgreSQL using JOIN operation between metrics table and data imported from OAR. As a result, metrics can be selected according to a job identification number from a PostgreSQL VIEW, which is in turn automat-ically available through the REST API for users.
2) On demand metrics: To avoid unnecessary disk space and resource consumption, Kwollect allows some metrics not to be collected by default but only on demand. On-demand metrics monitoring must be enabled by filling a dedicated database table, listing devices and on-demand metrics to enable. The table is exposed to Kwollectors to inform them of the on-demand metrics to retrieve on the devices they monitor. In Grid’5000, not every possible metrics are activated by default, but we allow Kwollect users to enable them by spec-ifying appropriate options to their job submission command. Internally, as information about OAR job scheduler is available to Kwollect’s PostgreSQL, it is straightforward to fill the on-demand metrics table with metrics requested by users for their jobs.
IV. GRID’5000DEPLOYMENT AND USE CASE SCENARIO
In this section, we present Kwollect deployment on Grid’5000 an give an example scenario demonstrating the use of Kwollect by users.
Grid’5000 is distributed over 9 sites and each of them has an independent Kwollect instance deployed on a virtual machine hosting the database and a single Kwollector to monitor the site’s nodes and devices.
The following metrics are monitored by default:
• Energy consumption measured at the power outlet, every
second, for nodes connected to a monitorable PDU or a dedicated wattmeter using SNMP protocol.
• Most important metrics from nodes’ BMC sensors, every 5 seconds using SNMP or IPMI protocols, depending on what the device supports.
• Network equipments traffic, every second using SNMP.
• Most important metrics from Prometheus exporters (in-cluding some GPU metrics), every 15 seconds.
• Arbitrary metrics pushed by users from nodes by writing to a specific file periodically parsed by Kwollectors. In addition, more metrics are available on demand, when users enable them explicitly. This is used to instruct wattmeters to perform 50 measurements per second or to enable BMC or Prometheus metrics not kept by default.
In total, 88 distinct metrics on 2500 different devices are available for monitoring on Grid’5000 and between 5000 and 10000 values are collected each second.
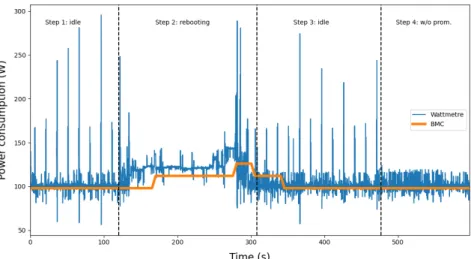
We now consider an example use case consisting in an investigation of causes of energy consumed by a server. Using Kwollect, a user is able to visualize energy consumed by a Grid’5000 node over time, using values reported by dedicated wattmeters and node BMC (Figure 6).
Fig. 6: Evolution of energy consumption reported by server BMC and dedicated wattmeter during the example scenario
After an idle period, the node is rebooted. Power con-sumption increases as the node is being busy and operating system energy saving mechanisms are missing. Once boot is completed at step 3, node goes back to an idle state.
Measurements performed by the two devices seem sound: they follow the same global evolution, BMC values being shifted by a few seconds in time and a few Watts less.
A remarkable observation is consumption spikes reported by wattmeter devices which are absent from values reported by BMC. One might wonder if they correspond to noise or to an actual consumption which cannot be seen by only looking at consumption reported by BMC, being not precise enough. It appears that some of the spikes are caused by the Prometheus Exporter installed on the node, which is queried every 15 seconds. After stopping it (step 4), the spikes disappear.
This example shows that Kwollect can be used to analyze power consumption, including comparing data from several sources and at different resolutions to analyze spikes. By averaging the values provided by Kwollect during idle steps with or without Prometheus running, we can estimate the power cost of running this service to be 0.35 W.
V. PERFORMANCE EVALUATION
In this section, we present Kwollect performance results from two contexts: an experimental setup and the real-world deployment of Kwollect in Grid’5000.
A. Experimentation Setup
We evaluate Kwollect in an experimental setup where 1000 devices are monitored. Each device has 100 different metrics collected every 5 seconds. Database is filled in advance with data representing two days of monitoring (using a longer period would not have any effect, as database partitioning is set to a 2-hour period and compression is enabled for 24-hour-old data). Evaluation is performed with Kwollect installed on a single server. Different server characteristics, described in Table II, are compared to exhibit performance that can be achieved according to hardware available.
We measure maximum metrics ingestion rate using parallel SQL COPY statements (similarly to what Kwollector does) ac-cording to the number of parallel workers performing COPYs. We also measure the time needed to retrieve metrics values using the API, using different parameters where the number of devices involved or the time period requested vary. Results are presented in Figure 5.
Maximum ingestion rate is achieved when several workers perform insertions in parallel (16 in our case). Using too many workers is inefficient as ingestion will be limited by storage performance and parallelization overhead. We found that a single instance of Kwollect is able to ingest more than 350000 metrics each second if SSD storage is used.
In our measurement, we observe that requests response time scales linearly with the size of the workload, except for taurus configuration. For the others, we did not get significant differ-ences between the different machines as requested workload were small enough to fit in system memory and not to be limited by storage, but by the CPU. On this kind of hardware, Kwollect is able to serve 500000 metrics values in about 10 seconds. The taurus configuration has less memory and performance degrade once the request size becomes important. This analysis confirms that, with appropriate hardware, Kwollect can manage several hundreds of thousands of metrics per second and can deliver millions of metrics values to users in less than a minute.
B. Grid’5000 Deployment
We now present some performance results from Kwollect deployment in Grid’5000, from two Grid’5000 sites: Nancy, which is the largest (by default and for results presented in this section, 1350 distinct devices are monitored, for an average of 4000 metrics per seconds) and Lyon, which is of average size, but has many devices monitored by high-frequency wattmeters (by default, 250 devices are monitored giving 850 metrics per second, and in addition for results presented here, 20 high frequency wattmeters performing 50 measures per sec-ond each, have been activated on demand). Virtual machines
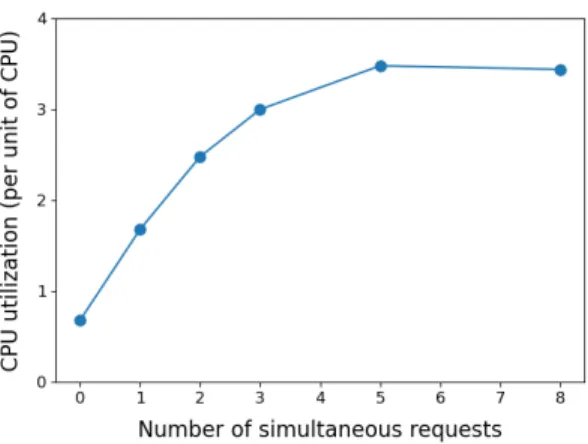
Fig. 7: Virtual machine CPU load as unit of CPU being busy (reported not being in the idle state by the vmstat tool), depending on the number of simultaneous user requests ongoing (average load over 60 seconds for each results)
Fig. 8: Time needed for Kwollect to serve users requests asking metrics values associated to their job. Numbers at the top of the bars are the approximate number of values in each request (average results from 3 different runs, except for "lyon, 20 nodes - 2-hour job" configuration, where a single run has been performed)
hosting Kwollect have 4 virtual CPUs, 16 GB or memory, 500GB of storage space (mechanical disks at Lyon, SSD at Nancy). The CPU load of Nancy Kwollect virtual machine under normal service conditions with or without user queries being performed is presented in Figure 7.
Results show that in the absence of requests, less than one unit of CPU is required to run Kwollect, used by the Kwollec-tor to get data from devices and ingest it: Kwollect does not require more than a single CPU to monitor hundred of devices. We also find that one request keeps approximately one CPU busy, indicating CPU requirement to handle more requests in parallel (even if storage performance would become another bottleneck).
Request latency is presented in Figure 8, where users ask Kwollect to get metrics associated to a 5-minute-long job, a two-hour-long job and to this same job, but 24 hours after it has ended (they are requested as soon as the job finishes
otherwise). Different job configurations are considered: they might include 2 or 20 nodes (thus including 10 times more metrics) or be located at Nancy or Lyon (thus including 50 wattmeter metrics per nodes and per second of job). The approximate number of metrics corresponding to each request is also indicated on the figure.
Results show that, even on modest hardware in used for Grid’5000 deployment, Kwollect can deliver tens of thousands of values in few seconds and millions of values in few minutes. These durations are largely compatible with the experimentation needs of Grid’5000 users.
VI. CONCLUSIONS
In this article, we presented the design, performance evalu-ation and use cases for Kwollect, a testbed service to collect and expose metrics in the context of experiments. Kwollect has been successfully deployed in the Grid’5000 testbed, met user expectations, and overcame all limitations of our previous solution. We will further extend Kwollect to monitoring more metrics and improve its integration with experiment control tools and libraries. We also now look forward to porting Kwollect to other environments, such as wireless or IoT testbeds.
REFERENCES
[1] F. Clouet et al., “A unified monitoring framework for energy consumption and network traffic,” in TRIDENT-COM, 2015.
[2] D. Balouek et al., “Adding virtualization capabilities to the Grid’5000 testbed,” in Cloud Computing and Services Science, 2013.
[3] M. L. Massie et al., “The ganglia distributed monitor-ing system: Design, implementation, and experience,” Parallel Computing, 2004.
[4] Prometheus monitoring system, https://prometheus.io/. [5] J. Yu et al., “COSMOS: Optical architecture and
pro-totyping,” in Optical Fiber Communication Conference, Optical Society of America, 2019, M3G–3.
[6] M. Singh et al., “Orbit measurements framework and library (OML): Motivations, implementation and fea-tures,” in TRIDENTCOM, 2005.
[7] Orbit measurement library, https : / / github . com / mytestbed/oml.
[8] T. Rakotoarivelo et al., “OMF: A control and man-agement framework for networking testbeds,” ACM SIGOPS Operating Systems Review, vol. 43, 2010. [9] Gnocchi, https://gnocchi.xyz/.
[10] Metrics using Gnocchi in the Chameleon tested, https: / / chameleoncloud . readthedocs . io / en / latest / technical / metrics.html.
[11] K. Park and V. S. Pai, “Comon: A mostly-scalable mon-itoring system for planetlab,” ACM SIGOPS Operating Systems Review, vol. 40, no. 1, pp. 65–74, 2006. [12] A. Saif et al., “MonEx: An Integrated Experiment
Mon-itoring Framework Standing on Off-The-Shelf Compo-nents,” in P-RECS, 2018.