HAL Id: tel-02937886
https://tel.archives-ouvertes.fr/tel-02937886
Submitted on 14 Sep 2020
HAL is a multi-disciplinary open access archive for the deposit and dissemination of sci-entific research documents, whether they are pub-lished or not. The documents may come from teaching and research institutions in France or abroad, or from public or private research centers.
L’archive ouverte pluridisciplinaire HAL, est destinée au dépôt et à la diffusion de documents scientifiques de niveau recherche, publiés ou non, émanant des établissements d’enseignement et de recherche français ou étrangers, des laboratoires publics ou privés.
Electrochemiluminescence at different scales : From new
fundamental properties to surface-confined microscopy
Silvia Voci
To cite this version:
Silvia Voci. Electrochemiluminescence at different scales : From new fundamental properties to surface-confined microscopy. Chemical engineering. Université de Bordeaux, 2019. English. �NNT : 2019BORD0294�. �tel-02937886�
Thèse de doctorat de l’Université de Bordeaux
École Doctorale des Sciences Chimiques
Par Silvia Voci
Pour obtenir le grade de Docteur
Spécialité : Chimie-Physique
Electrochemiluminescence at different scales:
From new fundamental properties
to surface-confined microscopy
Sous la direction de Professeur Neso Sojic
Présentée et soutenue publiquement à Bordeaux le Décembre 2019 Devant la commission d’examen composée par :
Anxolabéhère-Mallart Elodie DR CNRS, Université de Paris Examinatrice
Kanoufi Frédéric DR CNRS, Université de Paris Rapporteur
Miomandre Fabien PR, École normale supérieure de Cachan Rapporteur
Paolucci Francesco PR, Università di Bologna Examinateur
Sojic Neso PR, Bordeaux INP Directeur de thèse
3
Abstract
Electrogenerated chemiluminescence (ECL) is a light emission phenomenon initiated by electrochemically generated radical species, which then undergo a series of electron transfer reactions. It leads to the final generation of an excited state that radiatevely decays to the ground state. In this work, my goal was to develop fundamental aspects of ECL as well as analytical applications at different scales. In the first part, two supramolecular systems are studied. The ECL performances of spirofluorene derivatives based on trigonal truxene-core structure are investigated, focusing on the role of the different functional groups on the ECL properties. Then a bis-pyrene scaffold mounted on a constrained polyether macrocycle displaying intense excimer fluorescence has been selected to study the circularly polarized ECL. We show for the first time that ECL can discriminate enantiomers. In the second part of the thesis, annihilation ECL is enhanced by exploiting nanogap amplification. Furthermore, ECL imaging experiments enabled to demonstrate the increase in the performances of a bipolar electrochemistry system by employing a solid-state micropore configuration. Finally, the first steps in the development of a new ECL-based microscopy are presented. Using a unique ECL mechanism, which involves short-lifetime electrogenerated radicals, surface-confinement of ECL microscopy was demonstrated by cellular membranes’ imaging. ECL microscopy applied to cells imaging was further improved by adding a permeabilization step during cells labeling procedure. Disposable transparent carbon nanotube-based electrodes inkjet-printed on classic microscope glass coverslips, were used to image cells in both reflection and transmission configurations.
4
Résumé
L’électrochimiluminescence (ECL) est un phénomène d’émission de lumière obtenue suite à la génération d’espèces très réactives à l’électrode. Ces dernières vont subir une série de réactions de transfert d’électrons qui conduisent à la formation d’un état excité qui mène à l’émission finale de photons. La première partie de mon travail de thèse a porté sur l’étude de deux systèmes supramoléculaires. Les performances ECL d’un dérivé du spirofluorène et de trois composés modifiés avec un truxène comme partie centrale sont examinées. L’étude d’un deuxième système supramoléculaire, [18]-C-6bispyréne, a permis de démontrer une nouvelle propriété de l’ECL, maintenant capable de distinguer entre deux énantiomères, grâce à la détection du niveau de polarisation de l’émission ECL résultante. La combinaison entre ECL et systèmes confinés est présentée dans la deuxième partie de ma thèse. L’amplification du signal ECL par annihilation a été possible grâce à l’emploi d’un dispositif comprenant deux électrodes séparées par une distance de 100 nm. De plus, l’imagerie ECL a été utilisée pour mettre en évidence l’amélioration des performances de l’ECL bipolaire en utilisant une configuration comprenant un micropore planaire de 20 µm de long. Enfin, une nouvelle microscopie basée sur l’ECL a été développée. En perméabilisant la membrane cellulaire, l’ensemble de la cellule est visualisé par ECL. De plus, en se basant sur la distribution de l’émission ECL dans différents plans focaux, nous avons pu démontrer qu’une des caractéristiques fondamentales de cette nouvelle microscopie ECL est d’être confinée à la surface de l’électrode du fait des temps de vie limités des radicaux électro-générés. L’utilisation
5
d’électrodes transparentes de nanotubes de carbone imprimés sur une lamelle de microscope a permis de réaliser l’imagerie ECL de cellules marquées aussi bien en réflexion qu’en transmission.
6
Résumé de thèse
Dans les dernières décennies, le domaine de l’électrochimiluminescence (ECL), également appelée chimiluminescence électrogénérée, a très fortement évolué et est passé du statut de phénomène luminescent restreint aux laboratoires de recherche à une technique analytique puissante employée commercialement pour la bio-analyse. Le succès de l’ECL comme technique analytique peut être attribuée à plusieurs caractéristiques intrinsèques dont une forte résolution spatiale et temporelle, une grande sensibilité et sélectivité.1 En effet, après une première étape électrochimique se produisant au niveau de la surface de l’électrode, les radicaux électrogénérés vont subir une série de transfert d’électrons aboutissant à la formation de l’état excité du luminophore. La première étape de nature électrochimique permet un contrôle précis du moment, de la durée, de la position et de la zone où l’émission ECL se produit. Il est possible de distinguer deux mécanismes réactionnels ECL principaux : la voie par annihilation et la voie utilisant un coréactif. La première implique la génération des radicaux cations et anions du luminophore par des impulsions alternées entre le potentiel de réduction et d’oxydation du luminophore. Les deux radicaux vont ensuite réagir et produire l’état excité par annihilation. Dans le cas de la seconde voie avec un coréactif, l’émission ECL est produite grâce à l’ajout d’un composé supplémentaire, appelé coréactif, qui, après réduction ou oxydation, peut réagir avec la forme oxydée ou réduite du luminophore. Cela conduit à la formation de l’état excité et donc in fine à l’émission ECL. Ce second mécanisme ne nécessite que l’application d’un saut de potentiel.2 Le système ECL le plus employé, spécialement en
bio-analyse, est formé du complexe [Ru(bpy)3]2+, utilisé comme luminophore et de la
tri-n-propylamine (TPA) comme coréactif. Il permet la génération du signal ECL en solutions aqueuses à pH neutre. Les dernières études ECL visent au développement de nouveaux luminophores ECL présentant des performances plus élevées mais également à la production de systèmes analytiques plus sélectifs et capables de détecter simultanément plusieurs analytes.3
Cette thèse de doctorat est centrée sur l’étude du phénomène ECL à différentes échelles spatiales, depuis l’échelle moléculaire jusqu’à l’échelle micrométrique. Le but est de démontrer de nouvelles propriétés originales de l’ECL. A l’échelle moléculaire, mes recherches ont porté sur l’étude des propriétés ECL de nouveaux luminophores et l’établissement de lien structure/activité. De même, j’ai utilisé un système supramoléculaire chiral pour effectuer la détection de la polarisation de l’émission ECL. Ensuite, la combinaison de l’ECL avec
7
l’électrochimie a été réalisée dans des espaces confinés, tels que des dispositifs intégrant des électrodes séparées par une distance de 100 nm ou des micropores. Enfin, j’ai contribué au développement d’une microscopie ECL appliquée à l’imagerie de cellules marquées.
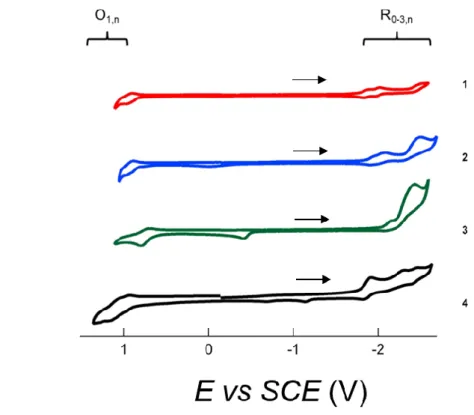
Le chapitre I présente les fondements théoriques, les principaux « acteurs » intervenant dans le processus ECL ainsi que les applications (bio)analytiques majeures. Dans la première partie du chapitre II, un dérivé du spirofluorène4 (Fig. 1, 1) et trois composés dans lesquelles le spirofluorène est substitué avec un truxène central (Fig. 1, 2, 3 and 4) sont étudiés. La caractérisation électrochimique des composés a permis de montrer que les radicaux électrogénérés sont suffisamment stables pour produire un signal ECL par annihilation. Le luminophore 2, grâce au groupe donneur d’électrons triphénylamine, montre la meilleure efficacité ECL : 314 % par rapport au complexe [Ru(bpy)3]2+ pris comme référence.
Figure 1. Structures chimiques des luminophores étudiées 1-4.
Pour la série de luminophores 1-4, le coréactif, peroxyde de benzoyle (en anglais « benzoyl peroxide » ou BPO), a été utilisé pour évaluer l’efficacité ECL. Comme précédemment, 2 montre le signal ECL le plus élevé, plus précisément 4.5 fois plus intense que celui de [Ru(bpy)3]2+. Les composés 1 et 3 présentent des performances ECL meilleures avec
8
Figure 2. Spectres ECL de 1 (rouge), 2 (bleu), et 3 (vert) en DMF. Les spectres ECL ont été enregistrés dans DMF / 10 mM BPO / 0,1 M TBAPF6.
Comme illustré par la Figure 2, il a été possible d’enregistrer les spectres ECL avec BPO comme coréactif pour les complexes 1-3. Par contre, la faible solubilité et les caractéristiques du système 4 n’ont pas permis l’obtention de son spectre ECL. La différence entre les performances ECL peut être interprétée comme dépendant de la meilleure stabilité des radicaux électrogénérés pour le système 2 comparé aux autres systèmes. En particulier, dans le luminophore 3, la substitution du groupe triphénylamine par la diphénylamine induit probablement une diminution significative de la stabilité des radicaux, tout spécialement du radical cation. La deuxième partie du chapitre II démontre la possibilité de réaliser la détection de la polarisation circulaire de l’émission ECL (CP-ECL) pour un système organique chiral (Fig. 3, a). La stabilité du signal ECL et l’intensité ECL élevée, associée à l’émission de l’excimère des sub-unités pyrène (lequel est favorisé dans la configuration du systèmes supramoléculaire) ont permis la détection du signal CP-ECL (Fig. 3, b) pour les deux énantiomères et pour le mélange racémique.
9
Figure 3. a) Structure moléculaire de [18]-C-6bispyrène; b) Signal CP-ECL pour (+)-[18]-C-6-bispyrène (ligne rouge), (-)-[18]-C-6-(+)-[18]-C-6-bispyrène (ligne bleu) et mélange racémique (ligne noire). Les spectres ont été enregistrés dans une solution dégazée de CH3CN contenant une concentration de
[18]-C-6-bispyrène de 0,7 mM, de BPO de 10 mM, et TBAPF6 0,1 M. L’émission ECL a été obtenue en
appliquant un potentiel de -2.45 V vs Ag pendant 240 s à l’électrode de travail.
Comme déjà observé pour la polarisation circulaire de photoluminescence (CPL),5 l’énantiomère (+)-[18]-C-6-bispyrène donne un signal négatif alors que (-)-[18]-C-6-bispyrène produit un signal positif. Une polarisation proche de zéro est obtenue pour le mélange racémique. Les facteurs de dissymétrie pour l’émission ECL sont respectivement de +8,4 × 10 -3 et -7,3 × 10⁻³ pour (-)-[18]-C-6-bispyrène et (+)-[18]-C-6-bispyrène. Elles sont comparables
aux valeurs mesurées pour le facteur de dissymétrie en photoluminescence (CPL).5-6 En conséquence, il est possible de conclure que l’ECL peut distinguer entre l’émission de deux énantiomères, si le signal ECL est assez stable et intense.7
La chapitre III de ma thèse combine l’ECL et l’électrochimie dans des espaces confinés. La première étude démontre qu’en utilisant un espacement nanométrique entre les électrodes (« nanogap »), une augmentation du signal ECL du [Ru(bpy)3]2+ estobtenue par annihilation.
Cela a été rendu possible grâce au phénomène de « redox cycling ».8 L’espacement était de 100
10
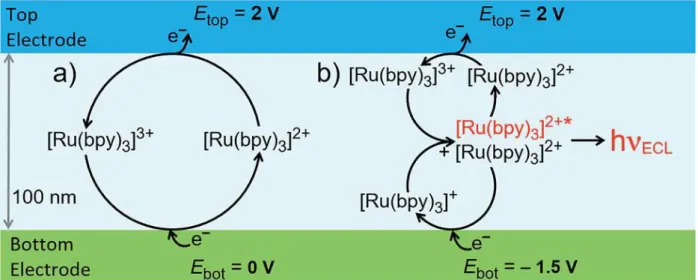
Figure 4. Schéma des deux voies réactionnelles dans le « nanogap »: (a) redox cycling, et (b) annihilation, avec émission ECL.
Le schéma de la Figure 4 montre deux différents modes électrochimiques utilisés dans le système nano-confiné. Dans le mode « redox cycling », le complexe [Ru(bpy)3]2+ est oxydé
à l’électrode « top », en appliquant un potentiel de 2 V et ensuite régénéré à l’électrode « bottom », par l’application d’un potentiel de 0 V vs Ag dans une solution d’acétonitrile. Le chemin diffusif réduit entre les deux électrodes assure une régénération continue du luminophore. Dans le mode « annihilation », une valeur de potentiel de -1,5 V vs Ag est appliquée à l’électrode « bottom », qui est maintenant capable de réduire le complexe [Ru(bpy)3]2+ en[Ru(bpy)3]+. Dans le mode « redox cycling » (Fig. 4, a), la régénération du
complexe à l’état [Ru(bpy)3]2+ a lieu à l’électrode « bottom » alors que, dans le mode
« annihilation », [Ru(bpy)3]2+ est régénéré par annihilation au centre du « nanogap », avec la
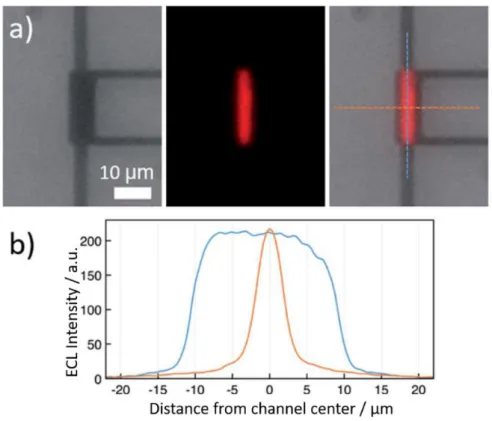
production de l’état excité qui relaxe à l’état fondamental en émettant l’ECL. Les images ECL et les profils correspondants d’intensité (Fig. 5) confirment que l’émission est confinée dans le canal du nanodispotif.
11
Figure 5.(a) De gauche à droite: Vue des électrodes formant le « nanogap » ; émission ECL enregistré dans l’obscurité, et superposition des deux images (lignes pointillées: direction des profils présentés en (b)). (b) Profils d’intensité ECL parallèlement (bleu) et perpendiculairement (orange) à l’axe longitudinal du canal nanofluidique. Une solution d’acétonitrile contenant 10 mM de Ru(bpy)3(PF6)2 et
0,1 M TBAPF6 a été utilisée. Un potentiel de 2 V a été appliqué à la « top » électrode et de 1,5 V vs. Ag
à la « bottom » électrode.
L’imagerie ECL a été utilisée aussi pour démontrer l’amélioration des performances de l’électrochimie bipolaire dans un micropore. Un système microfluidique à base de silicium a été développé au Laboratoire d'Analyse et d'Architecture des Systèmes (LAAS, Toulouse) avec deux électrodes source d’or et une restriction spatiale formant un micropore d’une longueur de 20 µm. Seules la base et les parois du micropore ont été désoxydées et étaient donc conductrices. Dans des conditions d’électrochimie bipolaire classique, une électrode bipolaire présentant une longueur de 20 µm nécessiterait l’application d’un potentiel de l’ordre de quelques kV.9 Par
contre, grâce à la configuration particulière du micropore, la polarisation asymétrique de l’électrode bipolaire a été possible en appliquant un potentiel de 7 V. En introduisant la solution de PBS (pH = 7,4) contenant [Ru(bpy)3]2+ et TPA dans le système microfluidique, l’imagerie
12
les profils d’intensité ECL (Fig. 6, d et e) montrent bien que l’émission ECL est confinée au pôle anodique du micropore, démontrant sa polarisation asymétrique.
Figure 6. a) PL , b) ECL et c) superposition des deux images de luminescence, de la même région d’intérêt autour du micropore. Les deux axes ont été représentés et l’origine O des axes a été définie au centre du micropore. Les lignes pointillées délimitent les parois du micropore. Les profils d’intensité ECL parallèlement à l’axe X (d) et à l’axe Y (e) ont été enregistrés dans le micropore dans une solution PBS (pH 7,4) contenant 1 mM de [Ru(bpy)3]2+ et 50 mM de TPA, en appliquant un potentiel pulsé de
10 V pendant 0.3 s.
Mon travail a commencé par l’étude de systèmes supramoléculaires (chapitre II) et s’est achevé par l’imagerie ECL, à l’échelle micrométrique, de cellules et de leurs membranes (chapitre IV). Une nouvelle microscopie basée sur l’émission ECL et complémentaire à la microscopie de fluorescence a été développée. La microscopie ECL a été appliquée à l’étude des membranes cellulaires. Des cellules de la lignée « Chinese Hamster Ovary » (CHO) ont été cultivées à la surface d’électrodes de carbone vitreux. Après 48 h, elles étaient incubées avec une solution de biotine X, une protéine capable de réagir avec les protéines de la membrane cellulaire. La forte interaction chimique entre la biotine et la streptavidine a été utilisée pour le
13
marquage des cellules biotinylées par le luminophore [Ru(bpy)3]2+ . Ce dernier a été modifié
par la streptavidine et est noté [email protected] L’image PL (Fig. 7, a) confirme que toute la membrane cellulaire a été marquée avec [Ru(bpy)3]2+. En éteignant la source d’excitation
lumineuse et en appliquant un potentiel de 1.4 V vs Ag/AgCl en présence d’un excès de TPA, l’image ECL (Fig. 7, b) a été enregistrée.
Figure 7.a) PL, b) ECL et c) superposition des deux images de luminescence de cellules CHO marquées par SAv@Ru. Les deux images, PL et ECL, ont été enregistrées en réflexion. L’image ECL a été obtenue dans une solution de PBS (pH = 7,4) contenant 100 mM de TPA et en appliquant un potentiel de 1,4 V vs Ag/AgCl/KCl 3 M. Barre d’échelle : 10 µm.
Contrairement à l’image PL, l’image ECL montre que l’émission est localisée aux bords de la cellule (Fig. 7).10 Même si l’image ECL permet une meilleure visualisation des pseudopodes de la cellule, aucune émission n’est observée dans la partie centrale de la cellule. Les luminophores localisés à une distance supérieure à 2-3 µm de l’électrode ne peuvent pas réagir avec les radicaux issus de l’oxydation de la TPA, en raison de leurs faibles durées de vie.11 L’oxydation directe à l’électrode du seul coréactif limite l’émission ECL à la région accessible aux radicaux électrogénérés.12 L’émission ECL est donc confinée à la surface de l’électrode. Pour augmenter l’accessibilité de la TPA et ne pas être limité par la membrane cellulaire qui joue le rôle de barrière diffusionnelle, une étape de perméabilisation des cellules a été ajouté après leur fixation.13 L’image ECL d’une cellule perméabilisée (Fig. 8, b) confirme que l’étape de perméabilisation permet une extension de l’émission ECL à la partie centrale de la membrane cellulaire. Les deux nucléoles visibles dans l’image ECL en Figure 8, b) sont restés sombres, probablement parce que leur membrane n’a pas été perméabilisée par la procédure employée (Triton X). La microscopie ECL peut donc fournir des informations sur le transport passif à travers la membrane cellulaire.14
14
Figure 8. a) PL, b) ECL et c) superposition des deux images de luminescence des cellules CHO perméabilisées et ensuite marquées avec SAv@Ru. Les deux images, PL et ECL, ont été enregistrées en réflexion. L’image ECL a été obtenue dans une solution de PBS (pH = 7,4) contenant 100 mM de TPA et en appliquant un potentiel de 1,4 V vs Ag/AgCl/KCl 3 M. Barre d’échelle : 10 µm.
Après cette première preuve de concept, les électrodes en carbone vitreux ont été substituées par des électrodes jetables réalisées par impression à jet d’encre par le Dr. Andreas Lesch à l’Ecole Polytechnique Fédérale de Lausanne.14-15 Les nanotubes de carbone imprimés
sur une lamelle de microscope constituent l’électrode de travail. Cette électrode a permis d’obtenir des images ECL pas seulement en réflexion mai aussi en transmission (Fig. 9, ii).
Figure 9. Schéma des deux configurations optiques utilisées pour la microscopie ECL confinée à la surface de l’électrode : i) en mode réflexion avec le carbone vitreux comme matériau d’électrode de travail ; ii) en mode transmission à travers l’électrode transparente composée par les nanotubes de carbone imprimés sur une lamelle de microscope.
La Figure 10 b) montre un exemple d’image ECL de cellules perméabilisées obtenue avec ce dispositif à base de nanotubes de carbone. Il est possible d’observer qu’en PL (Fig. 10, a) les cellules sont bien séparées les unes des autres. Au contraire, dans l’image ECL (Fig. 10, b) les cellules apparaissent plus rapprochées car la partie de la membrane plus proche de la surface d’électrode est plus visible en ECL qu’en PL.
15
Figure 10. a) PL, b) ECL et c) superposition des deux images de luminescence des cellules CHO, obtenues par transmission en utilisant l’électrode de travail à base de nanotubes de carbone imprimés sur une lamelle de microscope. Les images PL et ECL ont été enregistré dans la même région d’intérêt. L’image ECL a été obtenue dans une solution de PBS (pH = 7,4) contenant 100 mM de TPA et en appliquant un potentiel de 1,4 V vs Ag/AgCl/KCl 3 M. Barre d’échelle : 20 µm.
Dans le futur, l’étude de système de marquage plus spécifique, basée sur l’interaction anticorps- antigène pour l’imagerie de composants intracellulaires, ainsi que l’utilisation d’autres systèmes ECL (luminophore/coréactif) sont prévus.
En conclusion, ces travaux de thèse ont porté sur l’étude du phénomène ECL. Des nouveaux luminophores ECL ont été étudiés. Des propriétés originales de l’émission ECL ont été démontrées. Des systèmes confinés aux échelles nanométriques et micrométriques ont permis de mettre en évidence de nouvelles caractéristiques de l’ECL. Enfin, les bases d’une nouvelle microscopie confinée à la surface et basée sur l’ECL ont été posées.
16
References
(1) Richter, M. M. Chemical Reviews 2004, 104, 3003.
(2) a)Miao, W. Chemical Reviews 2008, 108, 2506; b)Bard,A.J.
Electrogenerated Chemiluminescence; M. Dekker: New-York, 2004.
(3) a)Liu, Z.; Qi, W.; Xu, G. Chemical Society Reviews 2015, 44, 3117; b)Zhou, J.; Nie, L.; Zhang, B.; Zou, G. Analytical Chemistry 2018, 90, 12361; c)Guo, W.; Ding, H.; Gu, C.; Liu, Y.; Jiang, X.; Su, B.; Shao, Y. Journal of the American
Chemical Society 2018, 140, 15904; d)Zou, G.; Tan, X.; Long, X.; He, Y.; Miao, W. Analytical Chemistry 2017, 89, 13024.
(4) Li, H.; Daniel, J.; Verlhac, J.-B.; Blanchard-Desce, M.; Sojic, N. Chemistry – A
European Journal 2016, 22, 12702.
(5) Homberg, A.; Brun, E.; Zinna, F.; Pascal, S.; Górecki, M.; Monnier, L.; Besnard, C.; Pescitelli, G.; Di Bari, L.; Lacour, J. Chemical Science 2018, 9, 7043.
(6) a)Zinna, F.; Di Bari, L. Chirality 2015, 27, 1; b)Longhi, G.; Castiglioni, E.; Koshoubu, J.; Mazzeo, G.; Abbate, S. Chirality 2016, 28, 696.
(7) Zinna, F.; Voci, S.; Arrico, L.; Brun, E.; Homberg, A.; Bouffier, L.; Funaioli, T.; Lacour, J.; Sojic, N.; Di Bari, L. Angewandte Chemie International Edition 2019, 58, 6952. (8) Al-Kutubi, H.; Voci, S.; Rassaei, L.; Sojic, N.; Mathwig, K. Chemical Science
2018, 9, 8946.
(9) Ismail, A.; Voci, S.; Pham, P.; Leroy, L.; Maziz, A.; Descamps, L.; Kuhn, A.; Mailley, P.; Livache, T.; Buhot, A.; Leichlé, T.; Bouchet-Spinelli, A.; Sojic, N. Analytical
Chemistry 2019.
(10) Valenti, G.; Scarabino, S.; Goudeau, B.; Lesch, A.; Jović, M.; Villani, E.; Sentic, M.; Rapino, S.; Arbault, S.; Paolucci, F.; Sojic, N. Journal of the American Chemical Society
2017, 139, 16830.
(11) Miao, W.; Choi, J.-P.; Bard, A. J. Journal of the American Chemical Society
2002, 124, 14478.
(12) Sentic, M.; Milutinovic, M.; Kanoufi, F.; Manojlovic, D.; Arbault, S.; Sojic, N.
Chemical Science 2014, 5, 2568.
(13) Bondarenko, A.; Lin, T.-E.; Stupar, P.; Lesch, A.; Cortés-Salazar, F.; Girault, H. H.; Pick, H. Analytical Chemistry 2016, 88, 11436.
(14) Voci, S.; Goudeau, B.; Valenti, G.; Lesch, A.; Jović, M.; Rapino, S.; Paolucci, F.; Arbault, S.; Sojic, N. Journal of the American Chemical Society 2018, 140, 14753.
(15) Jović, M.; Zhu, Y.; Lesch, A.; Bondarenko, A.; Cortés-Salazar, F.; Gumy, F.; Girault, H. H. Journal of Electroanalytical Chemistry 2017, 786, 69.
17
O amazement of things! Even the least particle! Oh spirituality of things! I sing the Equalities, modern or old, I sing the endless finales of things; I say Nature continues – Glory continues; I praise with electric voice; For I do not see one imperfection in the universe; And I do not see one cause or result lamentable at last in the universe. I believe a leaf of a grass is no less than the journey-work of the stars, And the pismire is equally perfect, and a grain of sand, and the egg of the wren. And the question, o me? O life? So sad, recurring – what good amid these, o me? O life? Answer: That you are here – that life exists and identity, That the powerful play goes on, and you may contribute a verse.
19
Preface
Light has always attracted the human kind all over the millennials and it was surely one of the first studied subject. As it happens for other chemical and physical processes, light cannot always be seen with naked eyes. The writer and chemist Primo Levi wrote that a chemist is like a blind assembler or disassembler, which uses many smart tricks to touch and see. What we tried to do in these years could be considered developing tricks, smart enough I hope, for “blinds” to “see” chemical processes related with a very marvelous light phenomenon that is electrogenerated chemiluminescence (ECL).
In this dissertation, ECL phenomenon represents the nucleus of original systems investigated at different scales. The successive experimental chapters are ordered depending on the scale of the systems under investigation: from the supramolecular scale, to the nano-scale, finally reaching the micrometric scale. In addition, since light is the final output of the ECL phenomenon, different potentialities of ECL such as microscopy and circularly polarized luminescence are developed.
In chapter I, an overview of ECL is presented. After a brief historical introduction, ECL will be introduced and distinguished from the other forms of light emission, such as photoluminescence
20
and chemiluminescence. The fundamentals of ECL will then be discussed, in particular ECL annihilation and coreactant pathways. Both inorganic and organic ECL luminophores and nanomaterials are reported as well as the main analytical applications of ECL in bioanalysis, which represented the main project of my PhD.
Chapter II is devoted to the analysis of two supramolecular systems. Electrochemical characterization and ECL analysis via annihilation and via reductive-oxidative coreactant pathways of new spirofluorene derivatives is reported, evidencing the role of the synthetic design in tuning the ECL performances. In the second part of the chapter, a new property of ECL is disclosed. Circularly polarization of ECL emission, originated from the enantiomers of a supramolecular purely organic system, is reported for the first time.
In chapter III, ECL meets the spreading field of “single-entity” electrochemistry. An enhancement of ECL emission in annihilation mode, thanks to the confinement in a nanofluidic channel, is discussed. ECL imaging permits to demonstrate an enhancement of bipolar electrochemistry performances, by exploiting a solid-state micropore configuration, in the second part of the chapter.
In chapter IV, a new microscopy, based on the ECL phenomenon, is developed and applied to the imaging of single cellular membranes. The surface confinement of ECL microscopy is demonstrated, with important consequences in terms of resolution and monitoring of passive transport properties through cellular membrane. Furthermore, the first steps towards potential analytical applications were moved, by testing the cellular membrane ECL imaging on a disposable analytical device, composed by a microscope coverslip and carbon nanotubes as an electrodic material.
21
Table of contents
List of Abbreviations ... 1 Symbols ... 5 I. Overview of Electrogenerated Chemiluminescence ... 7 1.1 Introduction ... 7 1.2 Light emission phenomena ... 8 1.2.1 Photoluminescence ... 9 1.2.2 Chemiluminescence ... 11 1.2.3 Light in electron transfer reactions ... 11 1.3 ECL mechanisms ... 14 1.3.1 ECL annihilation ... 14 1.3.2 Coreactant ECL ... 16 1.3.2.1 Mechanism of the coreactant ECL model system [Ru(bpy)3]2+/TPA ... 17 1.4 ECL luminophores ... 21 1.4.1 Inorganic systems ... 21 1.4.2 Organic systems ... 27 1.5 ECL coreactants ... 32 1.6 ECL analytical applications ... 34 1.6.1 ECL biorelated applications ... 34 1.7 Conclusions ... 38 References ... 39 II. Supramolecular ECL ... 45 2.1 Introduction ... 45 2.2 ECL study of trigonal truxene-core spirofluorene dyes ... 46 2.2.1 Electrochemical characterization ... 48 2.2.2 ECL via annihilation... 52 2.2.3 ECL via reductive-oxidative coreactant pathway ... 56 2.3 Circularly polarization of ECL from a chiral bispyrene organic macrocycle ... 59 2.3.1 Synthesis ... 63 2.3.2 Electrochemical characterization ... 65 2.3.3 ECL analysis ... 67 2.3.4 ECL mechanisms ... 68 2.3.5 PL and ECL spectra ... 72 2.3.6 CP-ECL ... 74 2.3.6.1 Experimental set-up ... 75 2.3.6.2 CP-ECL of [18]-C-6-bispyrene enantiomers ... 76
22
2.4 Conclusions ... 80 References ... 81 III. ECL in Confined Environments ... 85 3.1 Introduction ... 85 3.2 ECL by nanofluidic confinement ... 95 3.2.1 Nanogap device description ... 95 3.2.2 Enhanced annihilation ECL ... 97 3.2.2.2 Two electrochemical modes ... 99 3.2.2.3 ECL imaging ... 102 3.2.3 ECL via coreactant pathway ... 104 3.2.3.1 ECL analysis ... 104 3.2.3.2 ECL imaging ... 106 3.3 Enhanced bipolar electrochemistry at solid-state micropores ... 110 3.3.1 Solid-State Micropore Description and Characterization ... 111 3.3.2 ECL analysis... 113 3.3.3 ECL imaging ... 116 3.3.4 Simulations ... 118 3.4 Conclusions ... 120 References ... 122 IV. Surface-Confined ECL Microscopy ... 125 of Cellular Membranes ... 125 4.1 Introduction ... 125 4.2 Development of ECL microscopy of cellular membranes ... 133 4.2.1 Cellular membrane labeling procedure ... 133 4.2.2 Single cell ECL imaging: proof of concept ... 133 4.2.3 [Ru(bpy)3]2+/ TPA mechanisms ... 135 4.2.4 Single cell ECL imaging: permeabilization step ... 137 4.2.5 [Ru(bpy)3]2+/DBAE ECL system for singlecell ECL imaging ... 140 4.2.6 Comparison between fluorescence and ECL microscopies ... 142 4.3 Towards disposable device-based analysis... 148 4.3.1 Transparent electrodes for applications in microscopy ... 148 4.3.2 CNTs-based inkjet-printed electrodes ... 149 4.3.3 CNTs inkjet-printed electrodes: application to ECL microscopy ... 151 4.4 Conclusions ... 152 References ... 154 Experimental section ... 157 1. Chapter II – Supramolecular ECL ... 157
23 1.2 ECL study of trigonal truxene-core spirofluorene dyes ... 157 1.2.2 Materials ... 157 1.2.2 Electrochemical characterization ... 157 1.2.3 Electrochemiluminescence ... 158 1.3 Circularly polarization of ECL from a chiral bis-pyrene organic macrocycle ... 158 1.3.1 Materials ... 158 1.3.2 Electrochemical and ECL characterization ... 158 1.3.3 CP-ECL measurements ... 159 2. Chapter III – ECL in confined environments ... 159 2.1 ECL by nanofluidic confinement ... 159 2.1.1 Materials ... 160 2.1.2 Device fabrication ... 160 2.1.3 Electrochemical and ECL characterizations ... 160 2.1.4 ECL Imaging ... 160 2.2 Enhanced bipolar electrochemistry at solid-state micropores ... 160 2.2.1 Materials ... 161 2.2.2 Fabrication of silicon with integrated micropore ... 161 2.2.3 Electrochemical and ECL characterization ... 161 2.2.4 Imaging ... 161 3. Chapter IV - Surface-Confined ECL Microscopy of Cellular Membranes ... 161 3.1 Materials ... 162 3.2 Cell culture, labeling and permeabilization ... 162 3.3 ECL analysis ... 162 3.4 Imaging ... 163 3.5 Atomic force microscopy ... 163 References ... 164 Conclusions and Perspectives... 165 Acknowledgements ... 169
1
List of Abbreviations
Abbreviation Meaning
ABA p-aminobenzoic acid AFM atomic force microscopy AFP alpha fetoprotein
APDEA N-(3-aminopropyl)diethanolamine a.u. arbitrary units
BHQ black hole quencher BODIPY boron-dipyrromethene BPE bipolar electrode BPO benzoyl peroxide CE counter electrode
CEA carcinoembryonic antigen CD circular dichroism
CHO mammalian Chinese hamster ovary cells CL chemiluminescence
CNT carbon nanotube
CP-ECL circular polarization of electrogenerated chemiluminescence CPL circular polarization of luminescence
CSP-HPLC chiral stationary phase – high-performance liquid chromatography DAA1 9,10-bis(N-methylimidazolium-3-propoxyphenil)anthracene
DAA2 9,10-bis(N-methylimidazolium-3-propoxyphenil-2,6 dimethylphenyl)anthracene DBAE 2-(dibutylamino)ethanol
DMF dimethylformamide DNA deoxyribonucleic acid DPA 9,10-diphenylanthracene DSN doping silica nanoparticle
2
ECR enzymatically cyclic release
ECL electrogenerated chemiluminescence EGFR epidermial grow factor receptor ELISA enzyme-linked immunosorbent assay EMCCD electron multiplying charge coupled device Eq. equation
ESR electron spin resonance
et al. et altera / and others
Fig. figure
f-MWCNTs functionalized multi walled carbon nanotubes FO functional oligonucletotide
FTO fluorine doped tin oxide GC glassy carbon
GHD glucose dehydrogenase HCR hybridization chain reaction HOMO highest occupied molecular orbital
i.e. id est / for example
ITO indium doped tin oxide
L012 8-amino-5-chloro-7-phenylpyrido[3,4-d]-pyridazine-1,4(2H, 3H)-dione] LC ligand centered
Luminol 5-amino-2,3-dihydrophtalazine-1,4-dione LUMO lowest unoccupied molecular orbital MC metal centered
MLCT metal to ligand charge transfer NA numerical aperture
NADH nicotinamide adenine dinucleotide NCs nanocrystals
NHE normal hydrogen electrode NHS N-hydroxysuccinimide NPs nanoparticles
3
NSOM near-field scanning optical microscopy NDs nanodots
OPV oligo (p-phenylenevinylene) OTE optically transparent electrode PAH polyaromatic hydrocarbons
PALM photoactivated localization microscopy PDMS polydimethylsiloxane
Pdots polymer dots
PEEK polyether ether ketone PEM photoelastic modulator PET polyethylene PFA paraformaldeide Ph phenyl PITX palitoxin PL photoluminescence PMT photomultiplier tube PSA prostate specific antigen PTFE polytetrafluoroethylene
pt-TOxT-Sq pyrydilthiazole ligand with trioxatridecane chain and squarate amide ethyl ester QDs quantum dots
QRE quasi reference electrode RE reference electrode RNA ribonucleic acid
ROS reactive oxygen species
SAv@Ru [Ru(bpy)3]2+- labeled streptavidin
SCE saturated calomel electrode
SECM scanning electrochemical microscopy SEM scanning electron microscope
SERS surface enhanced Raman spectroscopy SPR surface plasmon resonance
4
ssDNA single stranded deoxyribonucleic acid STED stimulated emission depletion
STORM stochastic optical resolution microscopy TBA tetrabutylammonium
TIRF total internal reflection fluorescence microscopy TPA tri-n-propylamine
TTA triplet-triplet annihilation UV ultraviolet
WE working electrode
5
Symbols
Symbol
Meaning
Unit
d distance between feeder electrodes m
D diffusion coefficient cm2s-1
ΔEp peak to peak separation V
ΔG° free energy J or eV ΔH° enthalpy J or eV ΔI difference in the luminescence intensity a.u. Δ difference between wavelengths maxima nm
ΔS° entropy J/K or eV/K ΔVBE interfacial potential difference V
ΔVFE feeder electrodes potential difference V
E° standard potential of a redox couple V Ep peak potential V
Es energy of singlet excited state eV
Eexc energy of the excimer eV
F Faraday constant 96485,3329 s A/mol
FL fluorescence quantum yield (%) -
ECL ECL efficiency (%) -
gLUM luminescence dissymmetry factor -
gECL ECL dissymmetry factor -
h Planck’s constant Js IL left-circularly polarized light intensity a.u.
IR right-circularly polarized light intensity a.u.
L length of the BPE m wavelength nm
6
frequency Hz On,n oxidation n potential of compound n V
pKa acid dissociation constant - r resolution m Rn,n reduction n potential of compound n V
§ paragraph -
h Planck’s constant 6.62607015 × 10⁻³⁴ Js
T temperature K ᴓ disk electrode diameter m τ1/2 half-lifetime s
7
I. Overview of Electrogenerated
Chemiluminescence
1.1 Introduction
Electrogenerated chemiluminescence (or electrochemiluminescence, ECL) is the emission of light from excited states produced by reactive intermediates generated at an electrode surface.1 The first studies of chemiluminescence resulting from electrogenerated species were reported in 1920s.2 In 1927, Dufford et al.3 published a study of the phenomenon with Grignard compounds in anhydrous ether applying between 500 V and 1500 V at cathode or anode. In 1929, Harvey4 observed luminescence during electrolysis from a solution of 5-amino-2,3-dihydrophthalazine-1,4-dione (luminol) at basic pH at the interface with anode surface (by applying about 2.8 V). He suggested to apply the phenomenon as a test for active oxygen detection. After few studies,2,5 more detailed investigations followed in 1960s, due to the introduction of the use of aprotic solvents.6 These first ECL experiments involved the generation of the oxidized and reduced form of the luminophore, generating the excited state via annihilation reaction. The wider potential range availability of aprotic solvents allowed ECL analysis of several organic molecules (vide § 1.4).1 ECL emission from aromatic hydrocarbons
(such as diphenylanthracene, anthracene and rubrene) was described by Hercules7 in 1964, by cycling the electrode potential and by applying a dc current to two closely spaced Pt electrodes. In the same years, other studies permitted a deeper understanding of ECL on aromatic hydrocarbons.8 First ECL observations for the complex [Ru(bpy)3]2+ were reported by Lytle
8
and Hercules in 19669 and by Tokel and Bard in 1972,10 respectively in water and acetonitrile. In 1977, for the first time ECL generation with the use of coreactants was proposed.11 The concomitant oxidation of oxalate and various ECL luminophores (diphenylanthracene, rubrene, Ru(bpy)3(ClO4)2 and Os(bpy)3(ClO4)2) at the electrode surface produced ECL emission. Other
reducing agents where studied in the successive years, to react with the ECL luminophores, for potential analytical applications.12 Tri-n-propylamine (TPA) and other aliphatic amines became in the successive years the most studied and utilized coreactants, thanks to the high ECL efficiencies correlated with the use of those systems.13 The first ECL instrument for the detection of ECL labels ([Ru(bpy)3]2+) on the surface of magnetic beads in presence of TPA
was commercialized by Roche in 1994.14 In parallel with the development of new ECL luminophores, coreactants and analytical applications, fundamentals of ECL were investigated and rate constants for several annihilation reactions were calculated.1,15 Moreover, ECL
provided the first evidence of the Marcus inverted region. The generation of very reactive intermediates directly at the electrode surface has permitted to observe experimentally that the formation of the excited states results kinetically (very low activation energy barrier) more favored than the thermodynamically (highly negative free energy) more favored back electron transfer to the ground state.16 To date, ECL immunoassay systems for the sensitive and selective detection of several types of biomolecules are commercialized, for example, by Roche Diagnostic Corporation and Mesoscale Diagnostics.14
1.2 Light emission phenomena
The phenomenon of radiative deactivation of a species at the electronically excited state is called luminescence. Different types of luminescence are known, depending on the pathway followed for the generation of the emitting state. In photoluminescence (PL), light emission is caused by an initial photoexcitation step, while in chemiluminescence (CL) the excitation occurs following chemical reactions. This latter is called electrogenerated chemiluminescence when the reactants are electrochemically generated.14 Electroluminescence is instead correlated with the radiative recombination of holes and electrons in a material, after the application of a strong electric field or current flow.1 Other light emission phenomena are bioluminescence17 (chemiluminescence from living organisms), sonoluminescence18 (excitation from nonlinear motion of gas bubble, i.e. by ultrasonication or by energy transfer), and radiochemiluminescence19 (radiation-induced chemical excitation). In this paragraph,
9
photoluminescence and chemiluminescence are described. In addition, the role of light in electron-transfer reactions is briefly discussed.
1.2.1 Photoluminescence
The interaction between light and molecular systems is generally an interaction between one photon and one molecule:
A + h → A* (1.1) Where A represents the molecule at the electronically ground state, h the absorbed photon and A* the molecule in the electronically excited state. After light absorption, A* can undergo different deactivation pathways: chemical reaction (with the generation of other species), non-radiative deactivation (degradation to heat) and non-radiative deactivation. This latter is defined as photoluminescence.20 The processes of light absorption and emission can be conveniently discussed by the Jablonski diagram (Fig. 1.1).
Figure 1.1 A representation of Jablonski diagram.21
The electronic states are represented as thick horizontal lines. The vertical ones indicate the state of higher energies. S0 represents the electronically ground state (singlet as usual for
10
with higher energies are not considered in the scheme. The triplet excited state T1 is represented
on the right, horizontally separated to distinguish the multiplicity. Vibrational levels of each electronic state are represented as thin lines, the lowest one indicates = 0. Absorption is indicated with solid arrows, radiative deactivations with dot arrows and radiationless transitions with wavy arrows.20 Photoexcitation permits the population of electronic states with higher energy than the ground state. Following absorption, molecules relax usually to the lowest vibrational level ( = 0) of the populated state (vibrational relaxation) in a very short time (< 10-12 s). According to Kasha’s rule, emission can usually be observed only from the lowest excited state of any multiplicity. A radiation less transition occurs, called internal conversion, in a lower range of time than relaxation to the ground state (Fig. 1.1). Several pathways can lead to the deactivation of the molecule at the state S1. Radiationless transitions to the ground
state (internal conversion) can occur. Otherwise, a spin-forbidden non-radiative transition, called inter system crossing, allows the population of T1 and from this latter to the ground state
S0. Photoluminescence can be divided in fluorescence and phosphorescence. Fluorescence
indicates light emission from a spin-allowed electronic transition, where the multiplicity of the states is the same. Therefore, an example of fluorescence can be related to the electronic transition:
S1 → S0 (1.2)
from the first excited singlet state to different vibrational levels of the singlet ground state, which then rapidly relax to = 0. A spin-forbidden transition is called phosphorescence and it is generally shifted to longer wavelengths than fluorescence, for example:
T1 → S0 (1.3)
The lowest probability of this latter transition, caused by a change in multiplicity, results in rate constants several orders of magnitude lower than those for fluorescence.20-21 Phosphorescence is extended on a longer time interval (from milliseconds to seconds) and it is usually shifted to longer wavelengths than fluorescence. In presence of heavy atoms, spin-orbit coupling becomes high enough to facilitate intersystem crossing and therefore enhance phosphorescence quantum yields. Generally, the energy of emission transitions are lower than absorption ones. Consequently, radiative deactivation transitions occur at longer wavelengths than absorption
11
transitions. This phenomenon is called Stokes shift and is caused by the rapid vibrational relaxation to the lowest vibrational level of S1. On the other hand, further decay to higher
vibrational levels of S0 could also result in loss of excitation energy by thermalization of the
excess vibrational energy. Effects correlated with the solvent, excited-state reactions and bimolecular processes like complex formation account for the Stokes shifts.20-21
1.2.2 Chemiluminescence
In chemiluminescence, light emission results from an electronically excited state produced by a chemical reaction in a homogeneous phase. Such chemical reaction generates sufficient energy to induce the promotion of an electron from the ground state to an excited electronic state. Even if the process to reach the excited state is different, the radiative deactivation process is the same as photoluminescence. A chemiluminescent reaction can follow two mechanisms. In a direct route, a part of the product or intermediate can be generated at the electronic excited state, which then relaxes via light emission. Otherwise, chemiluminescence can occur from the excited state of a species that is not directly involved in the chemical reaction. An energy transfer from a product or intermediate of the reaction at the excited state to a fluorophore can occur, resulting in chemiluminescent emission from the sensitized species.22 The most studied chemiluminescent system is luminol, thanks to its analytical applications, in particular for the detection of oxidants or metal ions (due to their use as catalysts) or products of enzymatic activities. By reaction with a strong oxidizing agent (i.e. H2O2), and in presence of a catalyst
(such as a metal, a metal-containing compound or an enzyme) in strong basic conditions, luminol can produce 3-aminophthalate in an excited electronic state, which then can emit chemiluminescent light.
1.2.3 Light in electron transfer reactions
Electron transfer reactions are particularly important in the connection between light and chemistry.23 Light can act as a catalyst (photocatalysis) or as a reactant (photochemical
reactions):
A + B + h → A* + B → A- + B+ (1.4)
12
A- + B+→ A* + B → A + B + h () The generation of the electronically excited state of a molecule involves usually the promotion of an electron from a low energy (bonding) orbital to a high energy (antibonding) orbital. Therefore, a species at the excited state will be a better electron donor and a better electron acceptor than at the corresponding ground state. When the Stokes shift is small, it is possible to approximate the reduction and the oxidation potentials of a molecule (A) at the excited state as: E° (A*/A-) = E° (A/A-) + E (A*) (1.6) E° (A*/A+) = E° (A/A+) + E (A*) (1.7) Where E° (A/A-) and E° (A/A+) are respectively the reduction and the oxidation potentials of A at the ground state and E (A*) is the electronic spectroscopic energy, equal to the difference between the first ( = 0) vibrational level of the ground state and the first (’ = 0) vibrational level of the excited state, which can be approximated as14:
E (A*) = h c / (1.8) Where h is the Plank constant (4.13 × 10⁻¹⁵ eV), c is light speed (3.00 × 10⁸ ms-1) and is the
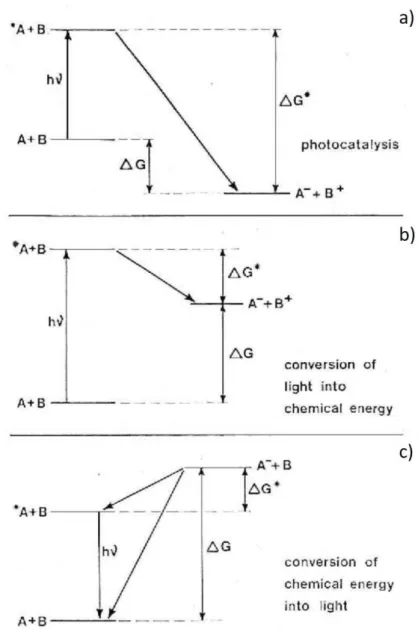
emission wavelength. Figure 1.2 reports three different electron transfer processes involving light for the reaction:
A + B ↔ A- + B+ (1.9)
In the first scheme (Fig. 1.2, a), the electron transfer process is exoergonic and a high activation energy is needed. The excited state A* is generated by photoexcitation of A. A* acts as a stronger oxidant than A, and the electron transfer reaction between A* and B presents a decreased activation energy barrier due to the increase in reaction exoergonicity. In this case, light plays the role of a catalyst (photocatalysis), by modifying the kinetic barrier of the reaction.
13
The case shown in Figure 1.2 b) corresponds to a highly endoergonic reaction. The generation of A* by photoexcitation allows the electron transfer process. A fraction of the light energy can be converted in chemical energy of the products. In the third reported situation (Fig. 1.2, c), the reaction from A + B to A- + B+ cannot be driven neither thermally or photochemically. The generation of A- + B+ at the electrode surface by an alternate pulsing at appropriate potential values would allow the back electron transfer to A + B to occur with complete dissipation of the excess of free energy into heat or via the intermediate formation of A* + B. The preferential pathway can be estimated by the Marcus theory of electron transfer.24 The deactivation of A* to A converts a fraction of the free energy in light energy by radiative emission. This particular
Figure 1.2 Schematic representations of three possible ways in which light can be involved in electron transfer processes. (Reported with modifications from [23])
14
case of chemiluminescence emission is denominated electrogenerated chemiluminescence (ECL).20,23-24
1.3 ECL mechanisms
In this section, fundamentals of ECL generation are treated, describing the two main pathways for the excited states production: ion annihilation and coreactant ECL.
1.3.1 ECL annihilation
The first reported ECL pathway concerned the generation of the excited state by annihilation reaction between an oxidized and a reduced species, of the same molecule or of two different species. The general mechanisms can be represented by the following equations (Eq. 1.10-1.15):
A + e- → A˙ ̅ (reduction at the electrode) (1.10)
D - e-→ D˙+ (oxidation at the electrode) (1.11)
A˙- + D ˙+ → D + 1A* (singlet excited state generation) (1.12)
or
A.- + D.+ → D + 3A* (triplet excited state generation) (1.13) 3A* + 3A* → 1A* + A (triplet-triplet annihilation) (1.14) 1A* → A + h (light emission) ()
Where the acceptor, A, and the donor, D, can be the same species, 1A* is the singlet excited state and 3A* is the triplet excited state. The corresponding enthalpy for the reaction can be
approximated as:14
Δ𝐻𝑎𝑛𝑛° = Δ𝐺𝑎𝑛𝑛° + 𝑇Δ𝑆 = 𝐸𝑝,𝐴+/𝐴− 𝐸𝑝,𝐴/𝐴−− 0.16 eV (1.16)
Where Δ𝐻𝑎𝑛𝑛° is the enthalpy for the annihilation (in eV), 𝐸
𝑝,𝐴+/𝐴 and 𝐸𝑝,𝐴/𝐴− are the peak
potentials for respectively the electrochemical oxidation and reduction (in V), and 0.16 eV corresponds to the entropic contribution (𝑇Δ𝑆) at 25°C (0.10 eV) with an addition of 0.057 eV, due to the difference between the reversible potential and the peak potential of each reaction.14
15
When Δ𝐻𝑎𝑛𝑛° presents a higher value than the energy necessary to populate the lowest excited state (singlet EA*, Eq.1.8) from the ground state, the system is called “energy-sufficient” and
1A* can be directly populated (Eq. 1.12, “S-route”). By contrast, when Δ𝐻
𝑎𝑛𝑛° is lower than the
singlet excited state (1A*) energy but higher than the triplet excited state (3A*) energy, the system will follow the “T-route” (or “energy-deficient” way) as reported in equations 1.13 and 1.14. Annihilation reactions permit not only the population of singlet and triplet excited states but also the direct generation of excimers and exciplexes (called “E-route”), particularly in the case of polyaromatic hydrocarbons, following the reported mechanism (Eq. 1.17-18):25 A ˙+ + A˙ ̅ → A
2* (excimer formation) (1.17)
A ˙+ + B˙ ̅→ (AB)* (exciplex formation) (1.18)
Triplet-triplet annihilation (TTA) can also lead to the generation of excimers or exciplexes (Eq. 1.19):14
3A* + 3A* → 1A
2* (TTA excimer formation) (1.19)
In the range 400-689 nm, ECL emissions are associated with a singlet excited state energy (singlet EA*, Eq. 1.8) between 3.1 and 1.8 eV. Consequently, the potential window of the
electrochemical system should be wide enough (from -2 V to about 3.3 V) to allow the production of stable cation and anion radicals. Anhydrous organic solvents represent the preferential environment for ECL via annihilation. The potential of the working electrode can be pulsed alternatively at the appropriate potentials to generate the oxidized (1.10) and the reduced (1.11) species of the luminophore. During the two potential steps, both radical species exist in the diffusion layer near the electrode and can react via annihilation (1.12). The generation of the oxidized and reduced species can occur also concomitantly by employing two different working electrodes at a distance short enough to permit the reaction between the two intermediates.15c,26 Different methods can be actuated, such as the use of a ring disk electrode15c or of interdigitated microelectrodes arrays.27 Scanning electrochemical microscopy (SECM), a generation/collection mode, has been recently applied to the investigation of ECL via annihilation.28 In last decades, the development of lithographically microfabricated nanogap devices has permitted to decrease the distance between two independently biased working
16
electrodes and to obtain an enhancement in ECL via annihilation thanks to the nanoconfinement (< 2 µm).29 Independently on the electrochemical mode applied for the generation of the two radicals, their lifetime must be long enough to allow the annihilation reaction and then ECL emission. Cyclic voltammetry represents an excellent probe to determine the best potential values for the generation of the oxidized and reduced species and to test their stability.26a,30
1.3.2 Coreactant ECL
ECL emission can occur also in one directional potential scanning at an electrode, in a solution containing an ECL luminophore and a coreactant. This latter generates, upon oxidation or reduction, an intermediate that can react with the ECL luminophore, producing excited states.1,26a,31 It is possible to distinguish two coreactant ECL pathways, “oxidative-reductive”
ECL and “reductive-oxidative” ECL. When the electrochemical oxidation of the coreactant generates a strong reducing intermediate the corresponding ECL reactions are defined as “oxidative-reductive” ECL.32 While “reductive-oxidative” ECL occurs when the
electrochemical reduction of the coreactant generates a strong oxidizing species.31,33 Typical “oxidative-reductive” coreactants are oxalate, amino-acids, TPA and NADH.14 S
2O82- and H2O2
are examples of “reductive-oxidative” coreactants. “Oxidative-reductive” ECL is considered a more usable pathway. More coreactants following this route are known and the narrow cathodic electrochemical window in aqueous solutions limits the “reductive-oxidative” ECL. The generation of ECL emission in a single potential step can be a significant advantage in several ECL studies. It allows to generate ECL emission from luminophores that present only an electrochemically reversible reduction or oxidation.1 In addition, in solvents with a narrow potential window, such as water, ECL can still occur by adding a coreactant, generating only the reduced or oxidized form of the luminophore. A good coreactant candidate should combine a high solubility in the reaction medium and good electrochemical properties (easily reduced or oxidized, in the same potential region of the luminophore). The electrochemically generated intermediate of the coreactant must be stable enough to permit the reaction with the ECL luminophore with a good reaction rate. Finally, the coreactant should not act as an ECL emission quencher or give an ECL signal itself, increasing the background of the emission. Coreactant ECL has been used in a wide range of analytical applications. ECL can be applied to the analysis of various species.1 The comprehension of coreactant ECL mechanism is
fundamental for improving coreactant ECL performances, for the design of new potential coreactant ECL systems and in the development of ECL analytical applications. The vast
17
majority of coreactant ECL and their related analytical applications are based on the ECL system involving tris(2,2’-bipyridine)ruthenium(II), [Ru(bpy)3]2+, and TPA as coreactant,
because of the excellent ECL properties, even in aqueous media and in presence of oxygen.1
Such an ECL system forms the basis of commercial ECL immunoassays and DNA analyses.34
1.3.2.1 Mechanism of the coreactant ECL model system [Ru(bpy)
3]
2+/TPA
In 1990,13b Leland and Powell reported the first study on ECL emission from the system [Ru(bpy)3]2+/TPA on a gold electrode in buffered aqueous solution. An overwhelming number
of publications followed, in order to clarify the related ECL emission mechanism.35 Several pathways are possible and the most probable one depends on the experimental conditions, in particular on the relative concentrations of [Ru(bpy)3]2+and TPA.
TPA+H ⇌ TPA + H (acid-base equilibrium) (1.20) [Ru(bpy)3]2+ → [Ru(bpy)3]3+ + e- (luminophore oxidation) (1.21)
TPA→TPA˙++e- (heterogeneous coreactant oxidation 1) (1.22)
[Ru(bpy)3]3+ + TPA → [Ru(bpy)3]2+ + TPA˙+ (homogeneous coreactant oxidation 2) (1.23)
TPA˙+ → TPA˙ + H (deprotonation) (1.24)
[Ru(bpy)3]3+ + TPA ˙→ [Ru(bpy)3]2+* + products (excited state formation 1) (1.25)
[Ru(bpy)3]2+ + TPA ˙ → [Ru(bpy)3]+ + products (1.26)
[Ru(bpy)3]++[Ru(bpy)3]3+→[Ru(bpy)3]2+* + [Ru(bpy)3]2+ (excited state formation 2) (1.27)
18
Figure 1.3 a) ECL and b) cyclic voltammogram of 1.0 nM of [Ru(bpy)3]2+ in the presence of 0.10 M of TPA with
0.1 M Tris/0.10 M of LiClO4 buffer (pH = 8) at a GC electrode (d = 3mm). Scan rate = 50 mV/s. c) As a) but with 1.0 µM [Ru(bpy)3]2+. The ECL intensity scale is given for c) and should be multiplied by 100 for a).36
By imposing a sufficiently anodic potential, the luminophore and TPA are both oxidized (Eq. 1.21-22). The acid-base equilibrium of TPA (pKa ~ 10.4) is correlated with the oxidation peak potential of the coreactant (~ 0.86 V vs NHE)35c. By decreasing the pH (no variation above pH = 11), a concomitant shift towards more positive potentials of the oxidation peak potential occurs. TPA can also be homogeneously oxidized by the electrochemically oxidized form of the luminophore (Eq. 1.23). This “catalytic route” resulted more probable at high [Ru(bpy)3]2+
concentrations.35a The route following the direct electrochemical oxidation of TPA (Eq. 1.22), becomes significant in low concentrations of [Ru(bpy)3]2+ (< µM) or at high TPA
concentrations. Two ECL waves, associated with [Ru(bpy)3]2+* emission, were experimentally
observed on both glassy carbon (GC) and Au electrodes.36 The first ECL wave occurs at a less positive potential than [Ru(bpy)3]2+ oxidation potential, while the second ECL emission is
observed at potentials where [Ru(bpy)3]2+ is electrochemically oxidized (Fig. 1.3). In Figure
1.3, ECL emission intensities are reported for the system [Ru(bpy)3]2+/TPA at concentrations
of 1 nM and 1 µM respectively. The first ECL peak at low potentials decreased with the increasing of [Ru(bpy)3]2+ concentration. No ECL signal was recorded in the absence of
19
ECL mechanism different from the second peak. SECM experiments were applied to such ECL system to clarify the predominant mechanism in this case. A modified [Ru(bpy)3]2+ complex
was immobilized on an indium tin oxide (ITO) electrode surface, as substrate. The reaction medium was composed by a buffered (pH = 8) solution 0.1 M of TPA. The ECL signal could be detected only at a very short distance between the SECM tip and the ITO surface. The experiments demonstrated that it is possible to obtain ECL emission only by direct oxidation of TPA at the electrode surface (Eq. 1.27-28).36 The reducing radical TPA˙ (~ -1.7 V vs
Ag/AgCl)37, generated from TPA oxidation, can diffuse to ITO substrate and react with the immobilized [Ru(bpy)3]2+ with the generation of the excited state. Thanks to SECM and digital
simulations, a half-life time () of about 0.2 ms was estimated for the radical cation TPA˙+. The recording of the electron spin resonance (ESR) spectrum of this latter permitted to confirm the presence of such intermediate in this alternative route. Studies on [Ru(bpy)3]2+-labeled
microbeads permitted to confirm the role of the direct oxidation of TPA and of the radical cation TPA˙+ in experimental conditions in which only a very low concentration of [Ru(bpy)
3]2+
molecules can be directly oxidized at the electrode.38 The anodic oxidation of TPA is strongly dependent on the electrode material.35a,39 At a GC electrode, TPA oxidation starts at about 0.6 V vs SCE and is characterized by a broad irreversible anodic peak. The production of surface oxides on Au and Pt electrodes limits drastically TPA oxidation, decreasing ECL intensity. Nonionic surfactants40 (i.e. Triton X-100, Nonidet P40, or Thesit) can adsorb on the surface of
the metallic electrode and increase the hydrophobicity of the surface. At surfactants concentrations below the critical micelle concentrations, ECL increases. The use of the nonionic fluorosurfactants41 allows also to retard the growth of the surface oxide layer. The fluorinated chains close to the electrode surface (Fig. 1.4) limits the access of H2O at the electrode, leading
20
Figure 1.4 Adsorption of a nonionic fluorosurfactant (FSN) at a gold electrode. The adsorption precludes the access of H2O to the electrode surface while it facilitates the oxidation of TPA.41
The addition of a small amount of halide species was also found to inhibit the formation of surface oxide on Pt and Au electrodes, with a maximum enhancement of TPA oxidation by using a bromide-containing solution at Au electrode.35a The strong dependence of ECL performances on electrode materials and on the presence of surfactants confirm the importance of the direct oxidation TPA pathway in the ECL generation.36 The ECL intensity is also strongly
related to the solution pH.13b,42 It drastically increases at pH > 5.5, with a maximum at pH =
7.4. TPA˙+ deprotonation reaction (Eq. 1.25), intermediates stability as well as the reduced TPA
solubility at high pH values present the main reasons of this behavior. At pH > 9, [Ru(bpy)3]3+
can produce ECL emission also by reaction with the hydroxide ions, generating an ECL background and decreasing the selectivity of the system in analytical applications.14 Finally, O2
influences the ECL intensity in the coreactant ECL system [Ru(bpy)3]2+/TPA.43 At high [TPA],
oxygen molecules are completely reduced by the strong amount of reducing intermediate radicals, and no quenching effect occurs. By contrast, at low [TPA] the amount of reducing intermediated radicals generated by TPA oxidation is relatively low. Therefore, O2 can act as
interceptor, reacting with such intermediates before these latter meet [Ru(bpy)3]2+ molecules.
Consequently, in those experimental conditions oxygen results as an ECL quencher, in particular of the low-potential route (Eq. 1.27-28), where only TPA is directly oxidized at the electrode.
21
1.4 ECL luminophores
ECL luminophores can be separated in three categories: inorganic systems, in particular organometallic complexes; organic systems and nanomaterials (semiconductor nanoparticles, carbon dots, etc.).
1.4.1 Inorganic systems
The complex [Ru(bpy)3]2+ (Fig. 1.5, a) was the first studied and still the most utilized. Indeed,
the unique combination of chemical stability, redox properties, excited state reactivity, luminescence emission and excited state lifetime has permitted the intensive use of this complex for fundamental studies as well as for several applications over the years.1,14,26a,44 Its solubility extends from water to a variety of organic solvents and can undergo reversible one-electron transfer reactions at easily achievable potentials (Fig. 1.5, b).
Figure 1.5 a) Chemical structure of [Ru(bpy)3]2+;1 b) scheme of the complex in different electronic states.36
The structure is composed by a Ru(II) atom surrounded by coordination bonding with three bidentate polypyridine ligands (bpy). Ru(II) presents a d6 configuration and its polypyridine ligands possess -donor orbitals, localized on the nitrogen atoms and donor and * acceptor orbitals, delocalized on the aromatic rings. The promotion of an electron from a M metal orbital
to the L* ligand orbitals leads to a metal-to-ligand charge transfer (MLCT) excited states. The
![Figure 1.5 a) Chemical structure of [Ru(bpy) 3 ] 2+ ; 1 b) scheme of the complex in different electronic states](https://thumb-eu.123doks.com/thumbv2/123doknet/14669125.741384/46.892.128.808.505.867/figure-chemical-structure-scheme-complex-different-electronic-states.webp)
![Figure 1.15 Chemical structures of a) the BODIPY core 65 and b) 2,8-bis(4-isopropylphenyl)-difuro[2,3-b][3,2-g]- 2,8-bis(4-isopropylphenyl)-difuro[2,3-b][3,2-g]-5,5-difluoro-5-bora-3a,4a-diaza-s-indacene](https://thumb-eu.123doks.com/thumbv2/123doknet/14669125.741384/55.892.112.802.117.292/figure-chemical-structures-bodipy-isopropylphenyl-isopropylphenyl-difluoro-indacene.webp)