HAL Id: inria-00161254
https://hal.inria.fr/inria-00161254v3
Submitted on 11 Jul 2007HAL is a multi-disciplinary open access archive for the deposit and dissemination of sci-entific research documents, whether they are
pub-L’archive ouverte pluridisciplinaire HAL, est destinée au dépôt et à la diffusion de documents scientifiques de niveau recherche, publiés ou non,
Protocols Comparison in very High Speed Networks
Romaric Guillier, Ludovic Hablot, Pascale Vicat-Blanc Primet
To cite this version:
Romaric Guillier, Ludovic Hablot, Pascale Vicat-Blanc Primet. Towards a User-Oriented Benchmark for Transport Protocols Comparison in very High Speed Networks. [Research Report] RR-6244, IN-RIA. 2007, pp.39. �inria-00161254v3�
a p p o r t
d e r e c h e r c h e
3 9 9 IS R N IN R IA /R R --6 2 4 4 --F R + E N G Thème NUMTowards a User-Oriented Benchmark for Transport
Protocols Comparison in very High Speed Networks
Romaric Guillier — Ludovic Hablot — Pascale Vicat-Blanc Primet
N° 6244
Comparison in very High Speed Networks
Romaric Guillier , Ludovic Hablot , Pascale Vicat-Blanc Primet
Thème NUM — Systèmes numériques Projet RESO
Rapport de recherche n° 6244 — July 2007 — 36 pages
Abstract: Standard TCP faces some performance limitations in very high speed wide area
networks, mainly due to a long end-to-end feedback loop and a conservative behaviour with respect to congestion. Many TCP variants have been proposed to overcome these limita-tions. However, TCP is a complex protocol with many user-configurable parameters and a range of different implementations. It is then important to define measurement methods so that the transport services and protocols can evolve guided by scientific principles and com-pared quantitatively. The goal of this report is to present some steps towards a user-oriented benchmark, called ITB, for high speed transport protocols comparison. We first present and analyse some results reported in the literature. From this study we identify classes of representative applications and useful metrics. We then isolate infrastructure parameters and traffic factors which influence the protocol behaviour. This enable us to define scenario capturing and synthesising comprehensive and useful properties. We finally illustrate this proposal by preliminary results obtained on our experimental environment, Grid’5000, we have built and are using for contributing in this benchmark design.
Key-words: Protocol Benchmark, TCP, Performance evaluation, High Speed transport, High Speed networks
This text is also available as a research report of the Laboratoire de l’Informatique du Parallélisme
Comparaison de Protocoles de Transport dans les Réseaux Très
Haut Débit
Résumé : La version “standard” de TCP est confrontée à un certain nombre de limita-tions de performance dans les réseaux à trés haut débit qui sont principalement causées par une boucle de rétroaction de bout en bout trop longue et un comportement très prudent vis-à-vis de la congestion. Un grand nombre de variantes de TCP ont été proposé pour tenter de surpasser ces limitations. Cependant TCP est un protocole complexe comportant beaucoup de paramêtres définissables par l’utilisateur et un éventail d’implémentations dif-férentes. Il est alors important de définir des méthodes de mesure afin que les services et les protocoles de transport puissent évoluer selon des principes scientifiques et être comparés quantitativement. Le but de ce rapport est de présenter une démarche vers la définition d’un banc d’essai orienté utilisateur, appelé ITB, pour la comparaison de protocoles de trans-ports dans les réseaux à haut débit. Nous commençons par présenter et analyser quelques résultats présent dans la littérature. A partir de cette étude, nous identifions des classes représentatives d’applications et des métriques utiles. Nous isolons ensuite les paramêtres infrastructurels et les facteurs de trafic qui ont une influence sur le comportement des pro-tocoles. Ceci nous permet de définir des scénarios permettant de capturer et de synthétiser des propriétés utiles et complètes. Finalement, nous présentons des exemples de résultats obtenus dans l’environment expérimental Grid’5000 illustrant notre démarche.
Mots-clés : Banc d’essai de protocoles, TCP, évaluation de performances, transport
Contents
1 Introduction 5
2 Related work 6
2.1 Transport protocols for high speed networks . . . 6
2.2 Evaluation frameworks . . . 8
2.2.1 Evaluations on Real Experimental Networks . . . 8
2.2.2 Evaluations on Emulated Networks . . . 9
2.2.3 Evaluations with NS2 simulator . . . 11
3 Definition and goals of a Transport Benchmark suite 12 3.1 What is a benchmark? . . . 12
3.2 Example of the NPB and its usage . . . 12
3.3 Guidelines for transport protocol benchmarking . . . 13
4 ITB: Inria Transport Benchmark proposal 13 4.1 Representative applications selection . . . 13
4.2 Metrics . . . 14 4.2.1 Metrics types . . . 14 4.2.2 Throughput . . . 15 4.2.3 Fairness . . . 16 4.2.4 Efficiency . . . 16 4.3 System parameters . . . 16 4.3.1 Topology . . . 16 4.3.2 Capacities . . . 17 4.4 Workload parameters . . . 17 4.5 Benchmark . . . 18 4.5.1 WM application characteristics . . . 19 4.5.2 PP application characteristics . . . 19 4.5.3 BU application characteristics . . . 19 4.5.4 PA application characteristics . . . 20
4.6 ITB classes definition . . . 20
5 Real experiments 23 5.1 Topology example . . . 23
5.2 TU application . . . 24
5.4 PA application . . . 25
5.5 ITB parameters . . . 25
5.5.1 Problem size: RTT parameter . . . 25
5.5.2 Workload parameters . . . 29
5.6 Metrics consideration example . . . 32
6 Conclusion 32
1
Introduction
Today, most data transfer applications and about 90% of the Internet traffic use the TCP protocol. TCP has shown a great scalability in number of users, but not in link capacity. The TCP performance can be very low and unstable in data-center applications, grid com-puting applications, interactive communications within high speed long distance networks infrastructures like fibber to home (FTTH) or lambda grids environments. The conservative behaviour of TCP with respect to congestion in IP networks is at the heart of the current performance issues faced by the high-performance networking community. Several theo-retical and experimental analysis have shown that the dynamics of the traditional feedback based approach is too slow in very high speed networks that may lose packets. Conse-quently network resource utilisation is not optimal and the application performance is poor and may be disappointing. Many high-end computing applications wish to transfer large volumes of data over wide area networks and require high data rates in order to do so. How-ever, these applications are rarely able to take full advantage of the high-capacity (2.5 Gbps, 10 Gbps and upwards) networks installed today. Data from Internet2 show that 90% of the bulk TCP flows (defined as transfers of at least 10 MB of data) use less than 5 Mbps, and that 99% use less than 20 Mbps out of the possible 622 Mbps provision. There are many reasons for such poor performance. Many of the problems are directly related to the end system, to the processor and bus speed, and to the NIC with its associated driver. TCP configuration (e.g. small buffer space) has also a significant impact. But when these prob-lems are fixed, the congestion control algorithm is one of the key component which has to be modified to alleviate the performance problem in high speed long distance networks environments. Congestion control is the most important and complex part of a transport protocol in packet switch shared network. TCP provides a fully distributed congestion con-trol protocol which statistically share available bandwidth among flows fairly. TCP was designed first and foremost to be robust and when congestion is detected, TCP solves the problem but at the expense of performance. For example, for a standard TCP connection with 1500-byte packets and a 100 ms round-trip time, achieving a steady-state throughput of 10 Gbps would require an average congestion window of 83,333 segments, and a packet drop rate of at most one congestion event every 5,000,000,000 packets (or equivalently, at most one congestion event every 1 2/3 hours).
To solve this problem several protocols enhancements have been proposed [WHVBPa05, SL04, XHR04]. All these protocols are not equivalent and not suited for all environments. Some of the protocols targeting high speed Internet, attempt to improve TCP response func-tion while trying to retain maximum backwards compatibility with legacy implementafunc-tions. Others focus on different target environments, for example dedicated optical networks. They are less conservative and they can be implemented in user space and over UDP.
Since a couple of years, the evaluation and comparison of these protocols receive an increasing amount of interest. However, TCP and other alternatives are complex protocols with many user-configurable parameters and a range of different implementations. Sev-eral aspects can be studied and various testing methods exist. The research community1 recognise it is important to deploy measurement methods so that the transport services and protocols can evolve guided by scientific principles. Researchers and developers need agreed-upon metrics - a common language for communicating results, so that alternative implementations can be compared quantitatively. Users of these variants need performance parameters that describe protocol capabilities so that they can develop and tune their ap-plications. Protocol designers need examples of how users will exercise their service to improve the design. The goal of this report is then to contribute to this effort and present some steps towards a user-oriented benchmark design for high speed transport protocols comparison.
The rest of the report is organised as follows. Related works and ongoing efforts are reviewed in Section 2. Section 3 defines the notion of benchmark and introduces a few ex-amples of such tools.Section 4 introduces the metrics, parameters and measurement meth-ods constituting our benchmark proposition for transport protocols. Section 5 illustrates this proposal with preliminary results obtained on our experimental environment, Grid’5000, we have built and are using for contributing in this benchmark design. Finally, we conclude in Section 6 and propose some perspectives for protocol and network service enhancement.
2
Related work
High Speed transport protocol design and evaluation is a hot research topic [VBTK06]. We first overview and classify proposed alternatives to TCP and then survey several efforts towards a systematic evaluation of these proposals.
2.1 Transport protocols for high speed networks
The recent alternatives to TCP, dedicated to high speed Internet, aim at solving the problem of the poor response function of TCP in large bandwidth-delay product networks by mod-ifying the parameters, α for the increase and β for the decrease, of the Additive Increase Multiplicative Decrease (AIMD) algorithm that is used during the congestion avoidance phase of TCP. For example HighSpeed TCP [Flo03] and Scalable TCP [Kel03] increase the aggressiveness in high-performance contexts while trying to stay fair to standard TCP flows in legacy contexts. Table 2 summarises the AIMD values that are used by different
1
TCP variant c d
TCP Reno 1.22 0.5
BIC 15.5 0.5
HighSpeed TCP 0.12 0.835
Scalable 0.08 1.0
Table 1: TCP variants’ response function parameters
TCP variant α β
TCP Reno 1 12
BIC 1 or bin.search 18
CUBIC cub(cwnd, history) 15
HighSpeed TCP inc(cwnd) decr(cwnd)
Hamilton TCP f(lastloss) 1 −RT TRT Tminmax
Scalable TCP 0.01 ∗ cwnd 18
Table 2: TCP variants’ AIMD constants
TCP variants. In [PFTK98], Padhye et al. present a simple TCP model to express the throughput as a function of the RTT, segment size, AIMD constants and loss probability:
M SS RT T ∗ q 2p 3 + RT O ∗ 3 q 3p 8p(1 + 32p2) (1)
that can be reduced to
R = M SS RT T
r 3
2p (2)
if we assume that the loss rate is small (typically the case in the optical networks that forms the backbone of most grids/data centers). The same kind of approach has been made for the new TCP variants [Xu07] and similar expressions exist. Table 1 provides an approximate value of the c and d parameters considering that all the formula are in the form
R= M SS RT T
c
pd (3)
.
H-TCP is supposed [SL04] to have the same response function as HighSpeed TCP. CUBIC is not included in the Table 1 as its response function doesn’t fit in the formula. By
choice of the AIMD constants, it has the same response function as TCP Reno for a small congestion epoch/BDP value to ensure its fairness with respect to this protocol. These response functions provide an insight of the relative performance of each TCP variants for a given BDP value, but this model doesn’t capture a number of characteristics of real networks like reverse traffic or multiplexing. Many of these TCP variants are available in all recent Linux kernel: HighSpeed TCP [Flo03], Scalable TCP [Kel03], Hamilton-TCP [SL04], BIC [XHR04], CUBIC [RX05] and they can be used by everyone.
TCP Vegas [BOP94] and FAST-TCP [DXWH07] use other congestion information available (round-trip time variations, Explicit Congestion Notification, etc) to regulate through-put at the sender end and thus finely control buffer filling in routers, managing IP congestion optimally. XCP goes further from today’s standards, proposing a new cooperative conges-tion control scheme featuring a precise congesconges-tion window indicaconges-tion going from routers to end hosts.
UDT, a UDP-based Data Transfer protocol [GG07] address the problem of transferring large volumetric datasets over high bandwidth-delay product optical networks. Like some TCP variants such as [XHR04], UDT employs a new window-based congestion control algorithm targeting at uncontrolled shared networks.
2.2 Evaluation frameworks
Since a couple of years several teams aim at developing methodologies and tools provid-ing comprehensive standards-compliance testprovid-ing of TCP implementations. In this section, we present initiatives focusing on TCP variant evaluation. Various testing methods ex-ist to evaluate transport protocol performance: real Internet, real experimental networks, emulated networks, simulation. Each one has its pitfalls. A mix of several methods is highly required to produce convincing results [All99]. To our knowledge, the real Inter-net , through the PlaInter-netlab testbed for example, has not been employed to evaluate ex-tensively the new TCP variants. Several methodologies and results have been proposed by [LLS06, Flo06, HLRX06] to identify characteristics and describe which aspect of eval-uation scenario determine these characteristics and how they can affect the results of the experiments.
The next sections compare related works according to the type of method they have adopted.
2.2.1 Evaluations on Real Experimental Networks
Few real experiments have been ran [CAK+05, LLS06] to analyse the behaviour of a range of new protocols in high speed Internet context. Other recent work focus on shared high
speed networks dedicated to high performance distributed applications [GHK+07, GSP07, GHK+06]. The real experiment method gives a real insight of the protocol behaviour in very high speed environment (e.g. 10 Gbps), explores the interactions with the hardware in-frastructure and generally helps to debug the global hardware and software communication chain.
Wan-In-Lab Wan-In-Lab [GSLL07] is a testbed of the California Institute of technology. It is built around a 2400km optic fibber cable and arrays of optical switches to construct networks with variable length and RTT. It is accessible to users through a web interface . This interface allows users to upload experimental kernels, instrumented with the Web100 tools, and to run a set of predefined tests. The results of these tests are then processed and placed on the web in both graphical and numerical form. Protocols are tested for RTT fairness, convergence speed both with and without existing large flows, interaction with short flows, and fairness between flows traversing different numbers of hops.
They are considering a range of experiments combining a topology and some network-ing conditions to study interestnetwork-ing cases2. The main interest of this test bed is the possibility to perform real experiments using real links (1 to 10 Gbps speed) and optical switches and to have access to a huge range of RTTs (from 0 to 180 ms with 2 ms increments) by config-uring the optical switches.
Grid5000 Grid’5000 project [BCC+06], is an experimental grid platform gathering 2500 processors over nine geographically distributed sites in France. The network infrastructure is an interconnection of LANs (i.e. grid sites) and an 10 Gbps optical virtual private net-work (VPN). A simplified topology is shown in Figure 1. The particularity of this testbed is to provide researchers with a fully reconfigurability feature to dynamically deploy any OS image or TCP stack on any end host of the testbed and with a fully dedicated optical network.
This testbed has been used for experimenting different TCP stacks and several types of workload corresponding to realistic grid computing and data-center applications [GHK+07, GSP07]. Internet-like traffic can also be injected in this testbed.
2.2.2 Evaluations on Emulated Networks
Deployment of real networks is costly and experiments can be time consuming. Moreover, such testbeds hardly provide range of latencies to fully explore protocol behaviour. For
2
Nancy Grenoble Rennes Lille Sophia Toulouse 10 GbE Links Orsay Bordeaux 1 GbE Links Lyon
Figure 1: Grid’5000 backbone
these reasons, several teams adopt emulation method by using software or hardware network emulators.
Hamilton University framework With their latest experiments on TCP [LLS06], Dough Leith et al. present an experimental test-bed, based around the Dummynet [Riz97] network emulator. The goal is to study the performance of various TCP variants and to propose of a series of benchmark tests easily reproducible. The topology used is a classical dumb-bell with a Dummynet router in the middle to emulate latency and to set queue size and bottleneck speed
A set of scripts3, along with the results of a large quantity of experiments with graphs are made available. They are considering a wide range of parameters including: queue size, bottleneck size, RTT (16,22,42,82,162 ms), asymmetric RTT, TCP variants and number of web sessions. The available tests were done with two flows and a max bottleneck size of 250 Mbps.
North Carolina State University framework For the experiments [HLRX06] and val-idation of their TCP variants4, Injong Rhee et al. use a testbed also based on Dummynet.
3
working with TCP-Linux [WC06], a NS-2 patch to use GNU/Linux TCP congestion control algorithm modules to perform experiments
4
Two Dummynet routers are used, one to manage the AQM and the bandwidth limitation, the second to add delay, forming a dumbbell topology. The choice of this topology is motivated by the fact that even a more complicated topology like a parking lot fails to capture the realism of production networks. The bottleneck is fixed to 400 Mbps and the RTT values used are 16,64,162 and 324 ms.
Two kinds of background traffic may be injected: lived and long lived. The short-lived traffic is generated with a custom version of the SURGE [BC98] web traffic generator following 5 different kind of traffic distribution. The long-lived traffic is generated using iperf. The amount of background traffic is set to be about 70 Mbps (less than 20% of the bottleneck capacity). The basic scenario consists in monitoring the interactions of two flows when they are interacting with various levels of background traffic.
AIST-INRIA framework The AIST and INRIA teams use hardware emulators combined with network virtualisation software eWAN to evaluate protocols under different latency and topology conditions [PTK+06]. AIST-GtrcNET-10 is a hardware emulator that allows latency emulation up to 858 ms without losses, rate limitation and precise bandwidth mea-surements at 10 Gbps wire speed. GtrcNET-10p3 is a fully programmable network testbed, which is a 10 Gbps successor of a well-established network testbed, GtrcNET-1.
2.2.3 Evaluations with NS2 simulator
TMRG NS-2 framework In the IRTF draft [NS207], Wei and Floyd propose a frame-work of benchmarking TCP variants based on the NS2 netframe-work emulator. It defines topolo-gies, traffic charges and metrics that could be used to evaluate the performance of TCP stacks.
Currently, three topologies are considered: dumbbell (one bottleneck), parking-lot (mul-tiple bottleneck) with cross traffic and a “simple network” topology with transit and stub domains. Four kind of traffic models are proposed: FTP traffic (long-lived flows), Web traffic (short-lived flows), video streaming traffic (CBR traffic over UDP) and voice traffic (CBR or ON/OFF flows). Metrics defined in the TRMG’s metrics draft [Flo07] are con-sidered: throughput, queueing delay, jitter, loss rate, response time, fairness, convergence and robustness. Each kind of metrics is adapted to the traffic model it is currently trying to measure. As they are describing a framework, they don’t provide explicit scenarii that might be interesting to run.
Politecnico di Bari studies Mascolo in [MV06] is using NS-2 simulations to observe the impact of reverse traffic on the new TCP congestion control algorithms. The testbed is
based on a dumbbell topology with at most 6 different sources/destinations. The bottleneck size is 250 Mbps and is also shared by two networks transmitting web traffic. He is mainly focusing on the profile of the workloads that are applied to the system (on/off reverse traffic, reverse traffic + web traffic, reverse traffic + web traffic + different RTTs). He is using the following RTTs values: 40,80 and 160 ms. The metrics used to analyse the results are mainly link utilisation, goodput, congestion window size and timeouts events.
This short overview shows that software testbeds (simulators or emulators) enable com-plex topologies, large number of flows experiments but the bottleneck capacity is limited to 400 Mbps and the latencies to 400 ms. Hardware-based testbeds give researchers access to 10 Gbps and up to 800 ms latencies but present some limitation in topologies complexity.
3
Definition and goals of a Transport Benchmark suite
3.1 What is a benchmark?
A benchmark is a program or a set of programs, which calculate the relative performance of a machine or an architecture (hardware), or another program (software). Each benchmark may either focus on quantity (execution speed, amount of data computed, etc. ) or on quality (robustness, security, etc. ). Benchmark can be executed at two different levels:
• low level or microbenchmarks: Testing the performance of one particular component or function.
• application level: Aiming at representing typical applications/workloads of a plat-form that needs evaluation. Among the existing High Perplat-formance Computing (HPC) benchmarks, the NAS Parallel Benchmark (NPB) [FY02] is well known. This set of programs represents the typical applications classes executed on clusters.
3.2 Example of the NPB and its usage
In HPC, the NPB [FY02] is a commonly used benchmark. The NPB is a group of eight programs (BT, CG, EP, FT, IS, LU, MG and SP) that gives a good panel of the different parallel applications that could be executed on a cluster or a grid. The NPB have been designed to compare performances of parallel architectures (clusters and grids), and are now also used to evaluate MPI implementations. Their results are well-known and accepted by the parallel computation community, giving a good overview of the tested architecture. The NBP tests both computation and communication.
The NPB uses several classes (S, W, A, B, C, D) to represent the size of the problem, us-ing different size of input data arrays. They have different kind of communication schemes
representing typical parallel applications. The NPB gives the global time of computation and verify data computed.
3.3 Guidelines for transport protocol benchmarking
To compare different solutions for evaluating the performance of any system, like our end to end transport service in high speed networks, several aspects have to be clearly defined, as advised in [Jai91]. First, the boundaries of the system to be evaluated and the services provided by this system have to be clarified. To compare the performance, criteria or met-rics have to be selected. System and workload parameters that affect performance have to be listed. Then, within this list of parameters, parameters or factors that will vary during the experiment have to be selected. Finally, the workload, list of requests, has to be de-fined. This will consist in scripts to be executed on the system. The workload has to be representative of the real system usage.
In the case of transport protocol, representative applications (or scenarii) have to be used to capture the needs of important classes of applications (or scenarii). Applications that are part of a benchmark should be:
• easy to use: no tuning or modification of application needed • representative of users applications
• portable: usable on a large variety of machines or environments
• results reproducible: running the same experiment several times will yield the similar results each time
• well-defined to have a real support for design and development.
4
ITB: Inria Transport Benchmark proposal
In this section, the definition of representative applications, metrics, system and workload parameters needed to constitute our ITB transport protocol benchmark proposal are pro-vided.
4.1 Representative applications selection
The service offered by the system to be evaluated is the transport of byte flows from a source end node to a corresponding process on a sink end node. A flow in the Internet is
a loosely defined object representing a stream of packets having some criteria in common (IP addresses, port numbers,...). But end users are interested in the transfer of a particular message, file or document. The document might be a Web page, an in-line object, a data file or an MP3 track. The object to transfer is characterised by its starting time and its size in bits. The selection of representative applications and workloads has to satisfy: a) it should be representative of a given universe of real workloads; b) it should yield to the same distribution of the utilisation of system resources as real workloads. We will then consider that the high speed transport services we are examining target Internet-like or Data Center-like environments. Internet measurements of the size of documents such as Web pages and FTP files show that their distribution has a heavy tail. A typical Internet flows distribution has a majority of very small flows most of the traffic in volume is contained in large flows.
In data center-like environments, bulk data transfers for inputs and outputs staging of high performance distributed applications constitutes the main part of traffic volume. But the user requires also to transfer very short messages for inter process communication. The real distribution of these elephant and mice is unknown for the moment. Short TCP flows are often limited by slow-start and their performance is determined by the RTT and the presence of random losses.
In our ITB benchmark, we propose a micro-benchmark (TU) and four representative applications (WM, PP, BU, PA):
• TU : Tuning application: a full speed, simple basic unicast and unidirectional transfer for benchmarking the whole communication chain from one source to one sink. • WM: Web surfing applications: a mix of big and small transfers in every directions
with some delay constrains (interactive communication) • PP: Peer to peer applications: big transfers in every directions.
• BU: Bulk data transfer applications: unidirectional and big transfers like in data cen-ters or grid context.
• PA: Distributed parallel applications: interprocess communication messages (MPI), typically bidirectional and small messages transfers
4.2 Metrics
4.2.1 Metrics types
To analyse all the data acquired, several metrics can be used to synthetically characterise the behaviour of the transport system. The metrics identified by the IRTF TMRG group [Flo07]
are: fairness, throughput, delay, goodput distribution, variance of goodput, utilisation, ef-ficiency, transfer time. For each of them, either network-based, flow-based or user-based interpretation can be considered depending on the context of the study. This would lead for instance to study the goodput (or the completion time) when considering the impact of a TCP variant on a file transfer or the throughput metric from a network-provider point of view. An other important set of metrics concerns the fairness. It characterises the way the network resources are shared. Finally, the network provider is interested in efficiency which can be expressed as the ratio of the used bandwidth over the provided capacity.
The next sections discuss these metrics.
4.2.2 Throughput
Throughput metric is the most relevant metric for characterizing a service providing end-to-end communication between two or more hosts. Throughput can be measured as a router-based metric of aggregate link utilisation, as a flow-router-based metric of per-connection transfer times, and as user-based metrics of utility functions or user wait times. Throughput is distinguished from goodput, where throughput is the link utilisation or flow rate in bytes per second, and goodput, also measured in bytes per second, is the subset of throughput consisting of useful traffic.
mean goodput: gi= T1iPTt=0i gi(t)
aggregate goodput: G(t) =PN
i=1gi(t)
standard deviation of goodput:
σi = v u u t1 Ti Ti X t=0 (gi(t) − gi)2 goodput distribution: {pi,k = p( k 100∗ Ca≤ gi(t) < k+ 1 100 ∗ Ca)|k ∈ [[0; 100[[} Max completion time: Tmax = max(Ti)
Mean completion time: T = N 1
f orward
PNf orward
i=1 Ti
Standard deviation of completion time σTi = v u u t 1 Nf orward Nf orward X n=1 (Ti− T )2
where giis the goodput, Tithe completion time of the ithNf orward file transfer.
In ITB, we select the completion time metric which is easy to interpret from a user perspective.
4.2.3 Fairness
There are two kinds of fairness: inter-protocol fairness and intra-protocol fairness. The former is the fairness when the protocol competes with TCP connections. The latter is the fairness among the connections using the protocol. For fairness, the Jain index [Jai91] can be used: J = (PNi=1gi)2
N(PN
i=1gi2)
The term inter-protocol fairness is related to “TCP-friendliness” or “TCP-compatibility”. It means that a flow behaves under congestion like a flow produced by a conformant TCP. A TCP-compatible flow is responsive to congestion notification, and in steady-state uses no more bandwidth than a conformant TCP running under comparable conditions (drop rate, RTT, MTU, etc. ).
In ITB, for each application and each class, the completion time of a TCP workload will be measured to evaluate the fairness.
4.2.4 Efficiency
To evaluate the efficiency of different protocols on an infrastructure, one can use the follow-ing metrics: the aggregate throughput X(t) = PN
i=1xi(t) and the efficiency E(t) = XG(t)(t).
Queueing delay can also be an useful metric [WCL05].
4.3 System parameters
System parameters are determined by the topology and hardware used for the evaluation.
4.3.1 Topology
For ITB, we identify a simple system with a fix topology: as a set of end nodes intercon-nected to a bottleneck link and composing a classical dumbbell topology. The argument are
as follows. In [HLRX06], Rhee states that the dumbbell is a good topology to perform ex-periments as it is impossible to reproduce the complexity of a topology of the scales of the Internet and that we can reproduce what is happening in a router of the core of the Internet by choosing appropriate background traffic loads. In the context of the computational grids and data centers, a dumbbell is also a good local topology. The aggregation and congestion of the flows is very likely to occur in the switches or routers at the border of one given cluster/site.
The system is also determined by the RTT. For example, a RTT of 1 ms represents the local area network scale, 10-20 ms a metropolitan/national scale and 200 ms a transconti-nental scale.
4.3.2 Capacities
The factor K = CC
a, the aggregation level is an important parameter to consider. It is the
ratio between the bottleneck capacity C and the access link nominal capacity Ca. In DSL
context and more generally in the Internet, it is common to have K ranging over 1000, while in the data-center context, K is around 1 or 10.
Another limitation due to hardware is the size of bottleneck link buffer. This parameter is currently subject of lot of discussions. Some recent results have shown that in links where the aggregation level is high (e.g. in the core routers of the Internet) a small buffer size may suffice (about√K packets). However, when K is small, setting the buffer size to
a value close to the bandwidth-delay product might be still necessary. In real networks, this parameter is very difficult to measure and to configure.
The end nodes’ hardware that is used to perform the tests need also to be taken into account. Some of our previous experiments [GHK+07] were seriously perturbed by a fault in the Base Board Management controller firmware of IBM e-server 325 nodes. Such prob-lems should be identified using a calibration application like the TU application proposed within the ITB before launching further tests on a larger scale.
4.4 Workload parameters
Multiplexing factor: M , number of contributing sources
Parallel streams: Ns, number of streams used on each source
Congestion level: Cg = M ∗CC a, ratio between Nf nodes’ nominal capacity and the
Reverse traffic level: R, ratio between Nrnodes’ nominal capacity and the bottleneck
ca-pacity
Background traffic: B, type of background traffic (CBR, VBR) and shape (Poisson, Pareto,
Weibull,etc. )
In the Internet, the K factor is very high: the endpoints’ access rates are generally much smaller (2 Mbps for DSL lines) than the backbone link’s capacity (2.5 Gbps for an OC48 link). It has been shown that in such conditions, when the load is not too high and the degree of the multiplexing in the bottleneck link is high, formula-based and history-based TCP throughput predictors give correct predictions. But for high-end applications, the bandwidth demand of a single endpoint (1 Gbps, say) is comparable to the capacity of bottleneck link (K is equal to 1 or 10). In such environment, high congestion level may be not rare and a transient burst of load on the forward or on the reverse path may cause active transfers to fail or to be abnormally long. So congestion level Cgis a combination of the K
factor and the number of contributing nodes.
4.5 Benchmark
To define our user-oriented benchmark we make the following assumptions.The users are interested in moving data volumes from sets of end points to other sets. The set is a singleton in a point to point communication.
The system to be evaluated is a transport service offered by a transport protocol and executed on a complex network infrastructure. This infrastructure is defined by its topology, link latencies and rates. The user running this benchmark wants to compare the performance of several transport services. The best service will offer the minimum completion time of the given transfer workload. But the user may also be interested in evaluating the fairness and the predictability of these services. Indeed, prediction of large transfer throughput is becoming an important application: it can be used in path selection for overlay and multi-homed networks, dynamic server selection and peer-to-peer parallel downloads. In ITB, the predictability will be measured by the variance in completion time. By evaluating the fairness, the user will know if a service has a selfish or a cooperative behaviour. In ITB, the fairness is captured by measuring the completion time of TCP traffic.
To define the workload we have to consider that the aggregated traffic on a link is gener-ally characterised by the a) distribution of per-packet round-trip time, b) flow sizes, c) packet sizes, d) ratio between forward-path and reverse-path traffic, e) distribution of peak flow rates, f) distribution of transport protocols [Flo06]. Flow start time or flow inter-arrivals have also to be taken into account. Here we consider that the distribution of per-packet
round-trip time is an infrastructure parameter. It is an important parameter as it contributes to the ITB classes definition (problem size).
The traffic injected in the system is a composition of useful traffic (the forward and reverse traffic part which is evaluated) and the adverse traffic (the one which is supposed to perturb the protocol: forward and reverse background traffic). Each type of application is characterised by a given mix of useful traffic. The adverse traffic is synthesised in the ITB classes.
4.5.1 WM application characteristics
1. File sizes are exponentially distributed. 2. Packet sizes are also exponentially distributed.
3. The ratio between forward-path and reverse-path traffic is 0.8, which corresponds to the asymmetry of web traffic.
The distribution of per-packet round-trip time is exponentially distributed.
4.5.2 PP application characteristics
1. File sizes are heavy tailed.
2. Packet sizes are mostly constant, with a large proportion of packets having the maxi-mum size.
3. The ratio between forward-path and reverse-path traffic is 0.5, which corresponds to the P2P behaviour.
In PP, the distribution of per-packet round-trip time is Poisson. Nodes are randomly located in the network.
4.5.3 BU application characteristics
1. The traffic profile is highly uniform. File sizes are not exponentially distributed. For example, in Data Grid like LCG (for LHC) file size and data distribution are defined by the sampling rate of data acquisition.
2. Packet sizes are mostly constant, with a large proportion of packets having the maxi-mum size (1,5KB).
3. The ratio between forward-path and reverse-path traffic depends on the location of the storage elements within the global grid. Previous analysis indicate that considering three ratio of reverse traffic is sufficient in this BU application.
In BU, the distribution of per-packet round-trip time is multi-modal. Nodes are gener-ally clustered, consequently, several modes may appear (N ∗(N −1)2 modes for N sites), each mode of the distribution representing the set of given datacenter to datacenter connections. and the K factor is generally small (1 or 10).
4.5.4 PA application characteristics
1. File sizes are not exponentially distributed. The messages are small.
2. Packet sizes are mostly constant, with a large proportion of packets having the maxi-mum size.
3. The ratio between forward-path and reverse-path traffic is 0.5, which corresponds to a cluster to cluster behaviour.
Here the distribution of per-packet round-trip time is multi-modal. Nodes are generally clustered. MPI is the standard communication library used to write parallel applications. GridMPI5implementation has been designed to optimise long-distance communications in
MPI applications. One of the most critical part of these applications is the dense exchange of small messages between an process composing the parallel application. In ITB, the PA application run a MPI ping-pong to send 200 messages of 1 MB between two nodes on two different sites. This application explore the dynamics and the slow-start effect of the evaluated protocol.
4.6 ITB classes definition
RTT range, K factor and Congestion factor (forward and reverse) contribute to the classes definition. As they are components of the delay-bandwidth product, they are representative of the problem size for high speed transport services evaluation. The classes materialise respectively:
• A : Low loaded Metropolitan area Internet environment • B : Low loaded Metropolitan area DataCenter environment 5
Class K RTT (ms) Cg R A 1000 20 0.8 0 B 1 or 10 20 0.8 0 C 1000 200 0.8 0 D 1 or 10 200 0.8 0 E 1000 20 2.0 0.8 F 1 or 10 20 2.0 0.8 G 1000 200 2.0 0.8 H 1 or 10 200 2.0 0.8 I 1000 20 1.0 1.5 J 1 or 10 20 1.0 1.5 K 1000 200 1.0 1.5 L 1 or 10 200 1.0 1.5
Table 3: ITB Classes summary table
• C : Low loaded Transcontinental Internet environment • D : Low loaded Transcontinental Datacenter environment
• E : Highly congested (forward) Metropolitan area Internet environment • F : Highly congested Metropolitan area DataCenter environment • G : Highly congested Transcontinental Internet environment • H : Highly congested Transcontinental Datacenter environment • I : Highly congested (reverse) Metropolitan area Internet environment • J : Highly congested (reverse) Metropolitan area DataCenter environment • K : Highly congested (reverse)Transcontinental Internet environment • L : Highly congested (reverse) Transcontinental Datacenter environment
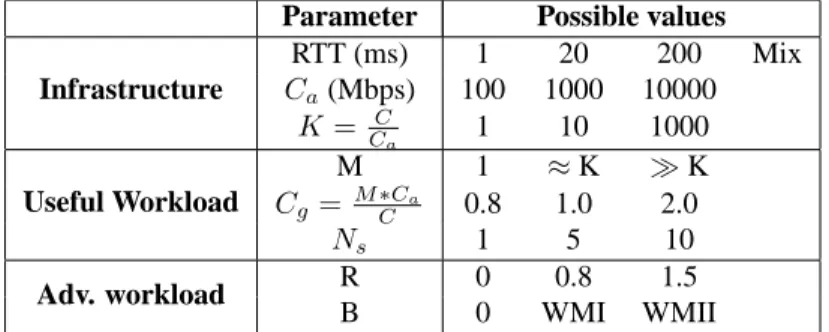
Table 4 tries to strike a comparison between the NPB presented in Section 3.2 and the ITB. Table 5 presents the different possible values that the infrastructure, system and work-load parameters could take. Table 3 summarizes the classes and the associated values of the K, RTT, Cg and R parameters that are used for the ITB.
NPB ITB Problem
type
NPB application: ITB application: BT, CG, EP, FT, TU, WM, BU, IS, LU, MG, SP PP, PA
Problem size
NPB classes: ITB classes: S, W, A, B, C, D 12 combinations of
RTT, K, Cgand R parameters
Result Execution time Completion time
Table 4: Parameters comparison of NPB and ITB
Parameter Possible values
Infrastructure RTT (ms) 1 20 200 Mix Ca(Mbps) 100 1000 10000 K= C Ca 1 10 1000 Useful Workload M 1 ≈ K ≫ K Cg= M ∗CC a 0.8 1.0 2.0 Ns 1 5 10 Adv. workload R 0 0.8 1.5 B 0 WMI WMII
Switch PC PC Side A Side B Switch Cai i Bottleneck RTT C
Figure 2: Experiment topology
5
Real experiments
This section presents and analyses a series of real experiments ran in our Grid’5000 testbed illustrating different points of ITB.
5.1 Topology example
Figure 2 presents a typical topology used for the benchmark experiments. It is a classical dumbbell with a single bottleneck of capacity C, with N pairs of nodes that are able to send at Caon each side. N is subdivided into three parts, according to the function assigned to
the nodes. One flow by nodes’ pair is used to perform a file transfer. Nfrefers to the number
of flows on the forward path (A→ B), Nrthe number of flows on the reverse path (B→ B)
and Nbthe number of nodes’ pairs sending background traffic (and N = Nf+ Nr+ Nb).
Two similar experimental systems, composed of a classical dumbbell topology with twelve 1 Gbps source workstations connected to a 10 Gbps bottleneck link and twelve sink workstations on the other side have been used. In the first testbed, the backbone of the Grid’5000 platform is composed of a private 10 Gbps Ethernet over DWDM dumbbell with a bottleneck at 10 Gbps between Rennes and Nancy hubs (see Figure 1). The average RTT is 11.5ms that gives a bandwidth-delay product of 13.71 MBytes.
In the second testbed, the local Ethernet network of the AIST-SuperCluster is used and the GtrcNET-10 equipment is emulating a large range of latencies.
The workload has been generated by using the iperf tool, GNU/Linux kernel version 2.6.16 with Web100 patch and Cubic patch. We design and configure our experimen-tal testbeds to have a direct access to the following parameter measurements during
ex-Source Rennes Toulouse D es ti n at io n Before Rennes 26.3 Toulouse 44.3 After Rennes 651 Toulouse 923
Table 6: Improvement of the iperf goodput (Mbps) after properly setting the TCP buffers
periments: a) goodput using iperf on the receiver side, b) aggregated throughput via the GtrcNET-10 equipment and c) TCP kernel variables with the web100 patch. We took great care of fine measurement precision: 0.5 s for iperf, 20 ms for the AIST-GtrcNET-10 and web100.
5.2 TU application
The TU application enable the ITB user to identify and properly adjust all the configuration parameters from the txqueuelen to the TCP buffer sizes to get the best performance in GNU/Linux out of its hardware infrastructure. Table 6 presents the results6obtained on TU test with a single pair of nodes by measuring with iperf7the average goodput achieved in a 300 s test. The results are given before and after setting the TCP buffers to the appropriate value. We observed a 95 % improvement of the average goodput just by adjusting this single parameter.
5.3 BU application
The BU application consists in simultaneous unidirectional large file transfers (typically 30 GB), reproducing the traffic that might occur between a site producing data (e.g. LHC, Geneva) and a site responsible for the computation (e.g. FermiLab, Chicago).
Within the benchmark design, the interval between each flow’s start is of importance as flows may interact during their slow start phase. Figure 3 illustrates the worst case: starting all flows simultaneously (within the same second) has the worst impact on the completion time of the flows and the best case: starting every flow outside the slow start phase of the others. The upper Figure 3(a) exhibits a set of flows experiencing drops during their slow 6due to space reason, we only provide the results for a couple of Grid5000 sites, the full results can be found
in [GHPS06]
7
start phase. These were unable to obtain a correct share during the rest of the experiment. Other grabbed a large portion of the bandwidth and completed in a short time (300 s). Even though the mean completion time in the worst case is better in Figure 3(b) (409 s vs 425 s), it has a much larger standard deviation (83 vs 28) than in the best case. We note that this parameter is especially important for the less aggressive TCP variants as they require a longer time to recover from these losses.
5.4 PA application
Here, the PA application was used on two sites separated by 11.6 ms of RTT. Figure 4 rep-resents the goodput for each of the 200 messages as function of time. On this figure, we can see the impact of TCP behaviour (slowstart and congestion avoidance) on the MPI imple-mentation. The slowstart and the congestion avoidance occur on each node. The transfer of 200 messages takes 7.2 s. Due to the impact of slowstart and congestion avoidance mecha-nisms on GridMPI, the maximum bandwidth is only reached after 5 s.
5.5 ITB parameters
This section provides a few examples of results obtained through our experiments to justify some of the values for the parameters presented in Table 5 and integrated within the ITB class definitions.
5.5.1 Problem size: RTT parameter
Figure 5 shows the impact of the RTT on the mean goodput achieved for several TCP vari-ants. Figure 6 presents the impact of the same parameter on the fairness. Both experiments were performed in the AIST-GtrcNET-10 testbed. The figures on the left side correspond to the case when only five flows are emitting, while the ones on the right are the case with twelve flows, that is to say without and with congestion. The flows are all under the same latency condition.
In both figures, we can identify three ranges of RTTs: low (0 to 20 ms) where all TCP variants behave the same and yield excellent performance, medium (20 ms to 100 ms) where we start to observe differences between TCP variants and high (above 100 ms) where the performance starts to degrade rapidly. Choosing one value in the first and one in the third range is enough to capture the behaviour of TCP variants and differentiate the classes.
In another experiment, we were gradually adding a flow every fixed period of time (200 s) till we reach twelve nodes to see the behaviour of TCP as we are slowly increasing the congestion level.
0 200 400 600 800 1000 1200 0 100 200 300 400 500 600 Goodput (Mbps) T (s) 17 Individual bic flows
(a) All flows starting at second 0
0 200 400 600 800 1000 1200 0 100 200 300 400 500 600 Goodput (Mbps) T (s) 17 Individual bic flows
(b) Each flow starts with a 4 s delay
0 100 200 300 400 500 600 0 1 2 3 4 5 6 7 8 MPI Bandwith (Mbps) Time (s) GridMPI on TCP
Figure 4: Impact of the TCP behaviour on the MPI traffic
0 200 400 600 800 1000 0 50 100 150 200 Mean of Goodputs (Mbps) RTT (ms) reno bic cubic highspeed htcp scalable
(a) 5 active nodes
0 200 400 600 800 1000 0 50 100 150 200 Mean of Goodputs (Mbps) RTT (ms) reno bic cubic highspeed htcp scalable (b) 12 active nodes
Figure 5: Mean goodput for TCP variants when 5 or 12 flows are active in AIST-GtrcNET-10
0.75 0.8 0.85 0.9 0.95 1 0 50 100 150 200 Fairness RTT (ms) reno bic cubic highspeed htcp scalable
(a) 5 active nodes
0.75 0.8 0.85 0.9 0.95 1 0 50 100 150 200 Fairness RTT (ms) reno bic cubic highspeed htcp scalable (b) 12 active nodes
0 2000 4000 6000 8000 10000 12000 0 2000 4000 6000 8000 10000 12000 14000 16000 18000 Throughput (Mbps) Time (s) Throughput (a) 11.5 ms RTT 0 2000 4000 6000 8000 10000 12000 0 2000 4000 6000 8000 10000 12000 14000 16000 18000 Throughput (Mbps) Time (s) Throughput (b) 100 ms RTT
Figure 7: Reno, BIC, CUBIC, HighSpeed, H-TCP and Scalable with various RTT in AIST-GtrcNET-10
Figure 7 represents the throughput measured with the GtrcNET-10 equipment after the 10 Gbps bottleneck link during this experiment for 11 and 100 ms RTT. From left to right, we present Reno, BIC, CUBIC, HighSpeed, H-TCP and Scalable TCP variants.
In our case, we can notice that the steps due to the addition of another flow get sloppier when we increase the latency, pointing out the effect of RTT on bandwidth utilisation. The effect is particularly noticeable on Reno (first column) and CUBIC8(third column) as these protocols aren’t able to fill the link. The deficiency observed for Reno is the well-known fact that Reno congestion control method isn’t adapted to networks with high BDP product due to the slow evolution of the congestion windows in this condition.
5.5.2 Workload parameters
Congestion level Figure 8 compares the impact of the congestion level parameter (Cg) on
the transfer time for several TCP variants. We note that there is a linear behaviour of most 8
200 250 300 350 400 450 500 550 600 0.7 0.9 1.1 1.3 1.5 1.7 1.9 2.1
Mean completion time
Congestion level Ideal TCP Reno no reverse Bic no reverse Cubic no reverse Highspeed no reverse Htcp no reverse Scalable no reverse
Figure 8: Impact of congestion level on the mean completion time on TCP variants, 19.8 ms RTT
TCP variants with respect to the congestion level. This behaviour can be captured with just a few experiments and has been selected as a component of ITB classes definition. In our benchmark we propose two congestion levels: 0.8 for non-congested classes and 2.0. for highly congested ones.
Reverse traffic level Figure 9 presents the impact of the reverse traffic level parameter (R) on the transfer time for several TCP variants under different congestion levels.
It is not necessary to run this kind of experiments for every value of the reverse traffic congestion level, as behaviour is only affected by the fact that the reverse path is congested or not. The benchmark propose to test only three cases: no reverse traffic, non-congesting reverse traffic and congesting reverse traffic. It corresponds to the 0, 0.8 and 1.5 values in Table 5. This is enough to characterise the behaviour of a TCP variant with respect to the reverse traffic level.
200 250 300 350 400 450 500 550 600 0.7 0.9 1.1 1.3 1.5 1.7 1.9 2.1
Mean completion time
Congestion level Cubic no reverse Cubic 0.7 reverse traffic level Cubic 0.9 reverse traffic level Cubic 1.1 reverse traffic level Cubic symetric reverse
Figure 9: Impact of reverse traffic level on mean completion time for CUBIC, 19.8 ms RTT
200 300 400 500 600 700 0.9 1.1 1.3 1.5 1.7 1.9 2.1 0 0.1 0.2 0.3 0.4 0.5 Congestion factor Completion time (s) Density CUBIC Scalable
Figure 10: Comparison of completion time distribution for CUBIC and Scalable, 19.8 ms RTT
5.6 Metrics consideration example
The choice of adequate metrics is of importance as presented in Section 4.2.1. If only the mean completion time, as in Figure 8, is considered, some aspects of TCP variants’ be-haviour may be eluded. For instance, Figure 10 presents a comparison of the completion time distribution for CUBIC and Scalable TCP. Here we can see that even though Scal-able does have a good mean completion time, it also displays a larger variability (294 s vs 114 s for the 2.1 congestion level case) than CUBIC. If the user is mostly interested in predictability, the completion time variability has to be computed.
6
Conclusion
We have presented guidelines for defining a benchmark suite for high speed transport ser-vices and protocol evaluation. We propose to capture the useful results by using the transfer time metric that helps to characterise transport solutions in various system and workload conditions. We design the ITB (Inria Transport Benchmark) which aims at covering a large scenario space with sufficient simplicity, completeness and minimal redundancy. This tool is composed of a set of scripts which can be easily reproduced in several kind of testbeds: real networks, emulated networks or simulators. This benchmark comprises 5 representa-tive applications and 12 classes. We have discussed the ITB applications and ITB classes choices. We have provided a set of experimental measurements that justify our choices and give a first insight of the power of our benchmark. In the future, we plan to pursue our experiments to refine, simplify and optimise our scripts. We will explore a range of new transport solutions. Then we will make the ITB publicly available so it can be strengthened and adopted by a larger community.
7
Acknowledgement
This work has been funded by the French ministry of Education and Research, INRIA, and CNRS, via ACI GRID’s Grid’5000 project , ANR HIPCAL grant, the ANR IGTMD grant, IST EC-GIN project, INRIA GridNet-FJ grant, NEGST CNRS-JSP project.
References
[All99] Aaron Falk Mark Allman. On the effective evaluation of TCP. ACM Com-puter Communication Review, 5(29), 1999.
[BC98] Paul Barford and Mark Crovella. Generating representative web workloads for network and server performance evaluation. In SIGMETRICS ’98/PER-FORMANCE ’98: Proceedings of the 1998 ACM SIGMETRICS joint in-ternational conference on Measurement and modeling of computer systems, pages 151–160, New York, NY, USA, 1998. ACM Press.
[BCC+06] Raphaël Bolze, Franck Cappello, Eddy Caron, Michel Daydé , Fred-eric Desprez, Emmanuel Jeannot, Yvon Jégou, Stéphane Lanteri, Julien Leduc, Noredine Melab, Guillaume Mornet, Raymond Namyst, Pascale Primet, Benjamin Quetier, Olivier Richard, El-Ghazali Talbi, and Touché Irena. Grid’5000: a large scale and highly reconfigurable experimental grid testbed. International Journal of High Performance Computing Applica-tions, 20(4):481–494, November 2006.
[BOP94] L. Brakmo, S. O’Malley, , and L. Peterson. Tcp vegas: New techniques for congestion detection and avoidance. August 1994.
[CAK+05] R. Les Cottrell, Saad Ansari, Parakram Khandpur, Ruchi Gupta, Richard Hughes-Jones, Michael Chen, Larry McIntosh, and Frank Leers. Character-ization and evaluation of tcp and udp-based transport on real networks. In PFLDnet’05, Lyon, FRANCE, Feb. 2005.
[DXWH07] S. H. Low D. X. Wei, C. Jin and S. Hegde. Fast tcp: motivation, architecture, algorithms, performance. In IEEE/ACM Transactions on Networking, 2007. to appear.
[Flo03] Sally Floyd. Highspeed tcp for large congestion windows. In RFC 3649, December 2003.
[Flo06] Tools for the evaluation of simulation and testbed scenarios. In Sally Floyd and E Kohler, editors, http://www.ietf.org/irtf/draft-irtf-tmrg-tools-03.txt, Decembre 2006.
[Flo07] Metrics for the evaluation of congestion control mechanisms. In Sally Floyd, editor, http://www.ietf.org/internet-drafts/draft-irtf-tmrg-metrics-09.txt, April 2007.
[FY02] Ahmad Faraj and Xin Yuan. Communication Characteristics in the NAS Parallel Benchmarks. In IASTED PDCS, pages 724–729, 2002.
[GG07] Yunhong Gu and Robert L. Grossman. UDT: UDP-based data transfer
for high-speed wide area networks. Comput. Networks, 51(7):1777–1799, 2007.
[GHK+06] Romaric Guillier, Ludovic Hablot, Yuetsu Kodama, Tomohiro Kudoh, Fu-mihiro Okazaki, Pascale Primet, Sebastien Soudan, and Ryousei Takano. A study of large flow interactions in high-speed shared networks with grid5000 and gtrcnet-10 instruments. Research Report 6034, INRIA, 11 2006. [GHK+07] Romaric Guillier, Ludovic Hablot, Yuetsu Kodama, Tomohiro Kudoh,
Fu-mihiro Okazaki, Ryousei Takano, Pascale Primet, and Sebastien Soudan. A study of large flow interactions in high-speed shared networks with grid5000 and gtrcnet-1. In PFLDnet 2007, February 2007.
[GHPS06] Romaric Guillier, Ludovic Hablot, Pascale Primet, and Sebastien Soudan. Evaluation des liens 10 gbe de grid’5000. Research Report 6047, INRIA, 12 2006.
[GSLL07] Ao Tang George S. Lee, Lachlan L. H. Andrew and Steven H. Low. Wan-in-lab: Motivation, deployment and experiments. In Protocols for Fast, Long Destance Networks (PFLDnet), pages 85–90, Feb. 2007.
[GSP07] Romaric Guillier, Sebastien Soudan, and Pascale Primet. Tcp variants and transfer time predictability in very high speed networks. In Infocom 2007 High Speed Networks Workshop, May 2007.
[HLRX06] Sangtae Ha, Long Le, Injong Rhee, and Lisong Xu. A step toward realis-tic performance evaluation of high-speed tcp variants. Elsevier Computer Networks (COMNET) Journal, Special issue on "Hot topics in transport protocols for very fast and very long distance networks", 2006.
[Jai91] R. Jain. The Art of Computer Systems Performance Analysis: Techniques for Experimental Design, Measurement, Simulation, and Modeling. Wiley-Interscience, April 1991.
[Kel03] Tom Kelly. Scalable tcp: improving performance in highspeed wide area networks. SIGCOMM Comput. Commun. Rev., 33(2):83–91, 2003.
[LLS06] Yee-Ting Li, Douglas Leith, and Robert N. Shorten. Experimental evalua-tion of tcp protocols for high-speed networks. In Transacevalua-tions on Network-ing, to appear 2006.
[MV06] Saverio Mascolo and Francesco Vacirca. The effect of reverse traffic on the performance of new tcp congestion control algorithm. In PFLDnet 2006, February 2006.
[NS207] An ns2 tcp evaluation tool suite. In G. Wang and Y. Xia, editors,
http://www.icir.org/tmrg/draft-irtf-tmrg-ns2-tcp-tool-00.txt, April 2007. [PFTK98] J. Padhye, V. Firoiu, D. Towsley, and J. Kurose. Modeling tcp throughput:
A simple model and its empirical validation. In ACM SIGCOMM ’98, 1998. [PTK+06] Pascale Vicat-Blanc Primet, R. Takano, Y. Kodama, T. Kudoh, Olivier Glück, and C. Otal. Large Scale Gigabit Emulated Testbed for Grid Trans-port Evaluation. In Proceedings of The Fourth International Workshop on Protocols for Fast Long-Distance Networks, PFLDnet’2006, Nara, Japan, February 2006.
[Riz97] Luigi Rizzo. Dummynet: a simple approach to the evaluation of network protocols. SIGCOMM Comput. Commun. Rev., 27(1):31–41, 1997.
[RX05] Injong Rhee and Lisong Xu. Cubic: A new tcp-friendly high-speed tcp
variant. In PFLDnet 2005, February 2005.
[SL04] R.N. Shorten and Doug Leith. H-TCP: TCP for high-speed and
long-distance networks. In PFLDnet’04, Argonne, Illinois USA, feb. 2004. [VBTK06] Pascale Vicat-Blanc, Joe Touch, and Kasuchi Kobayashi, editors. Special
is-sue on "Hot topics in transport protocols for very fast and very long distance networks". Elsevier Computer Networks (COMNET) Journal, 2006. [WC06] David X. Wei and Pei Cao. Ns-2 tcp-linux: an ns-2 tcp implementation with
congestion control algorithms from linux. In WNS2 ’06: Proceeding from the 2006 workshop on ns-2: the IP network simulator, page 9, New York, NY, USA, 2006. ACM Press.
[WCL05] David Wei, Pei Cao, and Steven Low. Time for a tcp benchmark suite ? Technical report, Caltech, 2005.
[WHVBPa05] Michael Weltz, Eric He, Pascale Vicat-Blanc Primet, and al. Survey of protocols other than tcp. Technical report, Open Grid Forum, April 2005. GFD 37.
[XHR04] Lisong Xu, Khaled Harfoush, and Injong Rhee. Binary increase congestion control for fast long-distance networks. In INFOCOM, 2004.
[Xu07] Lisong Xu. Extending equation-based congestion control to high-speed and long-distance networks. Comput. Networks, 51(7):1847–1859, 2007.
Unité de recherche INRIA Futurs : Parc Club Orsay Université - ZAC des Vignes 4, rue Jacques Monod - 91893 ORSAY Cedex (France)
Unité de recherche INRIA Lorraine : LORIA, Technopôle de Nancy-Brabois - Campus scientifique 615, rue du Jardin Botanique - BP 101 - 54602 Villers-lès-Nancy Cedex (France)
Unité de recherche INRIA Rennes : IRISA, Campus universitaire de Beaulieu - 35042 Rennes Cedex (France) Unité de recherche INRIA Rocquencourt : Domaine de Voluceau - Rocquencourt - BP 105 - 78153 Le Chesnay Cedex (France)