HAL Id: tel-01277134
https://tel.archives-ouvertes.fr/tel-01277134
Submitted on 22 Feb 2016HAL is a multi-disciplinary open access archive for the deposit and dissemination of sci-entific research documents, whether they are pub-lished or not. The documents may come from teaching and research institutions in France or abroad, or from public or private research centers.
L’archive ouverte pluridisciplinaire HAL, est destinée au dépôt et à la diffusion de documents scientifiques de niveau recherche, publiés ou non, émanant des établissements d’enseignement et de recherche français ou étrangers, des laboratoires publics ou privés.
Characterization of heat and mechanical damage in the
mortar by nonlinear acoustic waves
Ismail Yousfi
To cite this version:
Ismail Yousfi. Characterization of heat and mechanical damage in the mortar by nonlinear acoustic waves. Civil Engineering. Ecole Centrale de Lille; Université de Sherbrooke (Québec, Canada), 2015. English. �NNT : 2015ECLI0009�. �tel-01277134�
N°d’ordre : 259
ECOLE CENTRALE DE LILLE THESE
Présentée en vue d’obtenir le grade de
DOCTEUR
En
Spécialité : Génie Civil
Par
Ismail YOUSFI
DOCTORAT DELIVRE PAR L’ECOLE CENTRALE DE LILLE
DOCTORAT DELIVRE SIMULTANEMENT PAR L’ECOLE CENTRALE DE LILLE ET (UNIVERSITE DE SHERBROOKE) DANS LE CADRE D’UNE COTUTELLE INTERNATIONALE
DE THESE
Titre de la thèse :
Caractérisation de l’endommagement thermique et mécanique dans le mortier par les ondes acoustiques non linéaires
Characterization of heat and mechanical damage in the mortar by the nonlinear acoustic waves
Soutenue le 29 Mai 2015 devant le jury d’examen
Pr Anand PUPPALA University of Texas at Arlington (USA) Président du Jury Pr Patrice RIVARD Université de Sherbrooke (Canada) Rapporteur Pr Jean-Paul BALAYSSAC Université Paul Sabatier (France) Rapporteur Pr Denis DAMIDOT Ecole des Mines de Douai (France) Examinateur
Pr Richard GAGNE Université de Sherbrooke (Canada) Co-directeur de Thèse Pr Zoubeir LAFHAJ Ecole Centrale de Lille (France) Directeur de Thèse
Thèse préparée dans le Laboratoire de Mécanique de Lille, UMR, CNRS 8107
Ecole Doctorale SPI 072 (Lille I, Lille III, Artois, ULCO, UVHC, EC Lille)
Acknowledgements
The research project reported in this thesis was a part of a cooperation between l’Ecole Cenrale de Lille (France) and l’Université de Sherbrooke (Canada) . I would like to express my sincere gratitude to my supervisors Professor Zoubeir LAFHAJ and Professor Richard GAGNE , who gave me the chance to work within this collaboration on this interesting project.
I extend my warmest thanks to Mr. Zoubeir LAFHAJ, professor at Ecole Centrale de Lille, and to Mr. Richard GAGNE, professor at Université de Sherbrooke, for their great contributions to the successful completion of this work. Their valuable guidance, inspiring discussions, great patience and confidence helped to complete the project in good conditions.
I would like to record my debt of gratitude to Mr. Patrice RIVARD, Professor of Civil Engineering at the Université de Sherbrooke, for offering me the opportunity to work in his laboratory (Groupe de Recherche en Auscultation et en Instrumentation de Sherbrooke ) . I would also like to express my gratitude to Mr. Serge KODJO for his help and inspiring discussions. The discussions I had with him were always very interesting and very fruitful.
I would like to thank Professors, Anand PUPPALA, Patrice RIVARD, Jean-Paul BALAYSSAC, Denis DAMIDOT for giving me the honor to accept being part of my thesis jury.
I would like to thank the whole team and the staff of the Ecole Centrale de Lille and Université de Sherbrooke for their cooperation and support.
My very heartfelt thanks go to my friends in France and Canada who shared a lot of laughter, debates, ideas, above all, proved their support and understanding.
Last, I owe much to my parents, brothers and sisters for their long-distance encouragement and support.
Abstract
The objective of this work is the characterization of heat and mechanical damage in the mortar by the nonlinear acoustic waves. The correlation between non-linear/linear acoustic parameters and damage in mortar is studied based on experiments and modelling.
Experimental measurements of non-linear acoustic parameters as a function of temperature and crack size were performed on mortar.
The velocities showed a decrease when increasing the degradation and the non-linear parameters showed an increase when increasing the damage.
For the heat damage, cylindrical specimens were prepared and were characterized by studying the porosity and saturation. Then, the temperature controls the degradation. Indeed, the linear acoustic (UPV) and non-linear acoustic (Higher harmonic generation) were applied to characterize the damage. The linear acoustic tests have shown that the longitudinal, transverse velocities and modulus of Young of the mortar decreases in function of the temperature. The non-linear acoustic tests have shown that beta increases in function of the temperature.
For the mechanical damage and the self-healing, an annular specimens were prepared and cracked by controlling the size of each crack. Then the self-healing phenomenon was characterized by the permeability and the acoustic tests. Indeed, the permeability tests have shown that the airflow and the crack size decreases quickly in the first month then slowly for the rest of the self-healing process. On the other hand, the non-linear acoustic tests shown that the alpha and beta decreases according to the self healing process which means that the nonlinear parameters are good indicators to characterize the self-healing. Moreover, the analysis of the experimental results indicates that the frequency resonant technique is more efficient to characterize the defects in the mortar than the higher harmonic generation.
From the experimental tests and to get a general result independent for our case study, the nonlinear parameters were related to a damage index. A polynomial correlations of a 2nd degree was established between the nonlinear parameters and the index damage.
A numerical model based on the finite element volume was proposed to establish a correlation between the crack size and the airflow. The numerical results were compared with the results of the permeability tests and shown a good agreement.
The findings of this work should be most appropriate as a foundation for the study of the self healing by the nonlinear acoustic waves.
Keywords: nonlinear acoustic, self-healing, mortar, heat damage, mechanical damage, linear acoustic, porosity, resonant frequency, higher harmonic generation.
Résumé
L'objectif de ce travail est la caractérisation de l’endommagement thermique et mécanique dans le mortier par les ondes acoustiques non linéaires. La corrélation entre les paramètres acoustiques linéaires et non-linéaires étudiée est basée sur les essais expérimentaux et la modélisation.
Des mesures expérimentales des paramètres acoustiques non linéaires en fonction de la taille de la fissure et la température ont été effectuées sur mortier.
Les vitesses ont montré une diminution et les paramètres non-linéaires ont montré une augmentation en augmentant le dégrée de fissuration.
Pour l’endommagement thermique, des éprouvettes cylindriques ont été préparées et ont été caractérisées par l'étude de la porosité et la saturation. Ensuite, la température contrôle la dégradation.
En effet, l'acoustique linéaire (UPV) et l’acoustique non linéaire (génération d'harmoniques) ont été appliqués afin de quantifier l’endommagement. Les essais acoustiques linéaires ont prouvé que les vitesses transversales, longitudinales et le module d'Young du mortier diminue en fonction de la température. Les essais acoustiques non linéaires ont montré l'augmentation du bêta fonction de la température.
Pour l’endommagement mécaniques et l'auto-cicatrisation, des anneaux de mortier ont été préparés et fissurés en contrôlant la taille de chaque fissure. Ensuite, le phénomène d'auto-cicatrisation est suivi par la perméabilité et les essais acoustiques. Les essais de perméabilité ont montré que le débit d'air et la taille de la fissure diminue rapidement au cours du premier mois, puis lentement durant le reste du processus d'auto-cicatrisation. D'autre part, les tests acoustiques non linéaires ont montré que « alpha » et « bêta » diminuent durant le processus de l’auto-cicatrisation qui signifie que les paramètres non linéaires sont un bon indicateur pour caractériser ce phénomène.
En outre, l'analyse des résultats expérimentaux indique que la technique de résonance de fréquence est plus efficace pour caractériser les défauts dans le mortier de la génération d'harmoniques plus élevés.
A partir des essais expérimentaux et dans le but d'obtenir un résultat plus général indépendant de notre cas d’étude, les paramètres non linéaires ont été liés à un index d’endommagement. Une corrélation polynomiale de 2ème degré a été établie entre les paramètres non linéaires et l’index d’endommagement.
Un modèle numérique basé sur la méthode des volumes finis a été proposé afin d'établir une corrélation entre la taille de la fissure et le flux d'air. Les résultats numériques ont été comparés avec les résultats des tests de perméabilité et montré un bon accord.
Les résultats de ce travail représentent un bon départ pour étudier le phénomène de l'auto-cicatrisation par les ondes acoustiques non linéaires.
Mots clés: acoustique non linéaire, auto-cicatrisation, mortier, endommagement thermique, endommagement mécanique, acoustique linéaire, porosité, fréquence de résonance, génération d’harmoniques.
Summary
General Introduction ... 17
Chapter 1: Performance approach and durability of cement-based materials ... 20
Introduction ... 21
1. Course of the performance-approach ... 22
2. Indicators of the durability ... 23
3. Classes and limit values for indicators of durability ... 26
Conclusion ... 28
Chapter 2: Healing and self-healing of cement based materials: Definition, process ………... and advantages ... 29
Introduction ... 30
1. Definition of healing ... 30
2. Phenomena involved in the healing process ... 32
3. Study of healing: different approaches ... 34
4. Parameters affecting the healing process ... 36
5. The kinetics of healing of inactive cracks ... 42
6. The healing effect on the mechanical behavior ... 43
7. The benefits of self-healing ... 44
7.1. Gain of mechanical properties after being subjected to freeze-thaw ... 44
7.2. Gain of mechanical properties after damage by bending ... 45
7.3. Gain of mechanical properties after damage in traction ... 46
7.4. Gain of mechanical properties after damage in compression ... 48
Conclusion ... 49
Chapter 3: The different techniques of the Non Destructive Testing (NDT) ... 50
Introduction ... 51
1. Magnetic Control ... 51
2. X-ray tomography... 52
3. Infrared thermography ... 53
4. Ultrasonic and Acoustic emission ... 54
5. Criterias for choosing a NDT method ... 56
Conclusion ... 58 Chapter 4: Comparison between the linear and the nonlinear acoustic & the different ………
techniques used in the nonlinear acoustic waves ... 59
Introduction ... 60
1. Linear acoustic ... 60
2. The difference of the response between the linear and nonlinear acoustic wave ... 61
3. The different techniques using in the nonlinear acoustic waves ... 63
3.1. Mixed Frequency Response... 63
3.2. Higher Harmonic Generation ... 66
3.3. Shift of Resonance Frequency ... 69
4. Evaluation of damage in cement based materials by non linear acoustic ... 71
4.1. Mechanical damage... 72
4.2. Thermal damage ... 76
Conclusion ... 77
Chapter 5: Definition of the project ... 78
1. Context of the study ... 79
2. Problematic ... 80
3. Objectives... 81
Chapter 6: Heat damage: Protocol, results and discussion... 83
Introduction ... 84
1. Experimental procedure ... 81
1.1. Mortar sample preparation and generation of heat treatment ... 84
1.2. Porosity and density ... 86
2. Linear acoustic ... 87
2.1. Experimental device ... 87
2.2. Effect of saturation ... 89
2.3. Effect of heat damage... 92
3. Nonlinear acoustic ... 93
3.1. Experimental device ... 93
3.2. Effect of saturation ... 95
3.3. Effect of heat damage... 97
Conclusion ... 98
Chapter 7: Self-Healing: Protocol, results and discussion ... 99
Introduction ... 100
2. Airflow and permeability tests ... 104
3. Results: Self-healing effect ... 107
3.1. The evolution of the airflow ... 108
3.2. The evolution of the crack size ... 110
4. Linear acoustic waves ... 111
4.1. Effect of self healing on longitudinal velocity ... 115
5. Nonlinear acoustic waves ... 118
5.1. Choice of resonance frequency ... 118
5.2. Evolution of non-linear parameter “Alpha” for 12 KHZ ... 122
5.3. Effect of airflow on Alpha ... 124
6. Correlation between non-linear parameter and airflow ... 127
6.1. Correlation: Alpha 12 KHz and airflow ... 127
6.2. Correlation: Beta 12 KHz and airflow ... 129
6.3. Correlation Alpha 15 KHz and airflow ... 131
6.4. Correlation Beta 15 KHz and airflow ... 132
7. Correlation between non-linear parameter and damage index ... 134
7.1. Correlation Alpha 12 KHz and damage index ... 135
7.2. Correlation Beta 12 KHz and damage index ... 136
7.3. Correlation Alpha 15 KHz and damage index ... 137
7.4. Correlation Beta 15 KHz and damage index ... 138
Conclusion ... 140
Chapter 8: Numerical modelling ... 141
Introduction ... 142
1. Problem ... 142
2. Equations and model ... 143
3. Results ... 147
3.1. Convergence of the solution ... 147
3.2. Pressure ... 148
3.3. Vertical velocity ... 148
3.4. Horizontal velocity ... 150
4. Comparison between numerical and experimental airflows ... 153
Conclusion ... 155
Figures
Fig. 1: Confederation Bridge (1997) ... 21
Fig. 2: Bridge Rion-Antirion, 2004. (Photo: J. Hartley) ... 22
Fig. 3 : Porosity water ... 24
Fig. 4: Measuring coefficient of chloride diffusion ... 24
Fig. 5: Accelerated carbonation test ... 25
Fig. 6: Micro cracks before (a) and after (b) the self-healing (Yang et al., 2009) ... 31
Fig. 7: Phenomena causing the decreasing in the flow of water in cement materials... 33
Fig. 8: Evolution of the relative flow vs. time for crack openings w = 0.05 mm, 0.1 mm and 0.15 (Reinhardt & Jooss, 2003) ... 37
Fig. 9: Evolution of the opening of cracks of concrete vs. time (Argouges & Gagne,2009) ... 38
Fig. 10: Time required for full healing cracks according to their opening two hydraulic gradients (Nanayakkara, 2003)... 39
Fig. 11: Mechanical behavior of specimens at reloading after storage in air or water for 20 weeks (Granger et al., 2007) ... 46
Fig. 12: Mechanical behavior of specimens at reloading, after different durations of storage in water (after a Granger et al. (2007)) ... 46
Fig. 13: Principe of the magnetic control. (Bray & McBride, 1992) ... 51
Fig. 14: Test of the magnetic control ... 52
Fig. 15: Test of the X-ray ... 53
Fig. 16: Test Procedure of X-ray ... 53
Fig. 17:Principe of Infrared thermography ... 54
Fig. 18: Defect seen by Infrared tomography ... 54
Fig. 19: Test of transmission and reflection of a wave ... 55
Fig. 20: The different percentages of the utilization of each NDT techniques (Shull, 2002) ... 58
Fig. 21: Longitudinal wave ... 60
Fig. 22: Shear wave ... 61
Fig. 23: The linear acoustic response ... 63
Fig. 24: The nonlinear acoustic response ... 63
Fig. 25: Sample with flaw: a - closed by vibration compression, b –open under dilation (Sutin, 2005) ... 64
Fig. 26: Amplitude modulation of probe signal: (a) vibration, (b) ultrasonic signal (Sutin, 2005) . 64 Fig. 27: Illustration of the nonlinear acoustic vibro-modulation effect ... 65
Fig. 28: Response in the case of linear acoustic ... 65
Fig. 29: Response in the case of nonlinear acoustic ... 65
Fig. 30: Distortion in the waveform during propagation by the nonlinear elasticity and higher harmonic generation power of fundamental ... 67
Fig. 31: 2nd harmonic generation in the quadratic nonlinear system... 67
Fig. 32: Nonlinear relationship between stress and strain ... 68
Fig. 33: A result of NRUS : healthy material ... 70
Fig. 35: Relative changes of the linear and nonlinear characteristics derived from SIMONRAS
analysis of an RC beam as function of damage due to consecutive loading steps ... 73
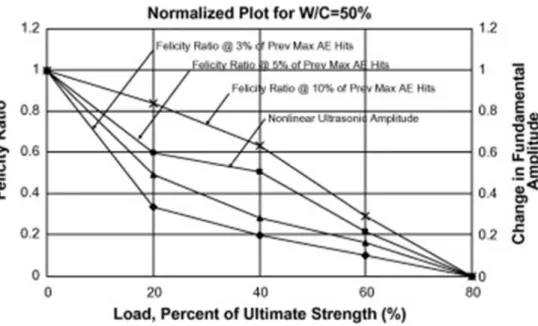
Fig. 36: Acoustic emission parameter and nonlinear acoustic parameter vs. the applied load (w/c = 50%) (Shaha and Ribakov (2010)) ... 74
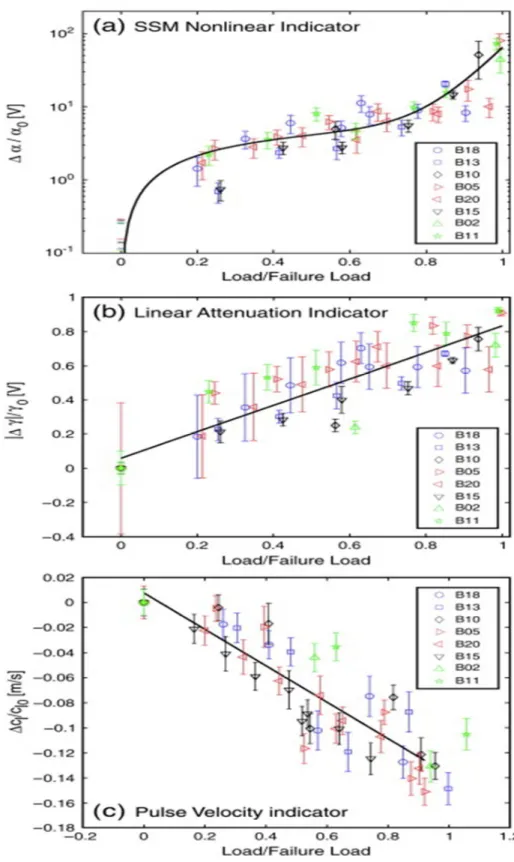
Fig. 37: Superposition of results from different specimens. (a) The variation of α for different specimens leads to the definition of a curve that describes the different stages of damage evolution. (b) and (c) point out that linear indicators show a linear evolution of damage ( Antonaci et al (2010)) ... 75
Fig. 38: Total results of the hysteretic nonlinearity parameter according to the ... 76
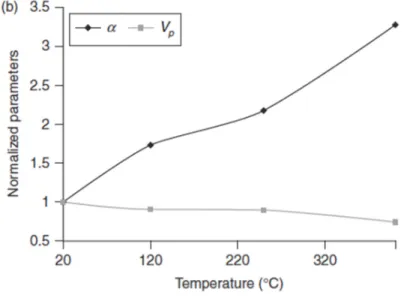
Fig. 39: Relative variation of the nonlinear parameter and velocity of pressure waves as a function of the damage temperature (Meo et al. (2014)) ... 77
Fig. 40: Samples of mortar ... 85
Fig. 41: Time evolution of temperature during heat treatment. ... 85
Fig. 42: Loss of mass Fig. 43: Porosity vs. W/C ... 86
Fig. 44: Density vs. Porosity ... 87
Fig. 45: Experimental device of linear acoustic ... 88
Fig. 46: Determination the time of flight ... 88
Fig. 47: The variation of the velocity for dry and saturated cases according to porosity ... 89
Fig. 48: Modulus of Young vs. Porosity ... 90
Fig. 49: Modulus of Young vs. Temperature ... 92
Fig. 50: Experimental device of the nonlinear acoustic waves ... 94
Fig. 51: Principle of the High Harmonic Generation technique ... 94
Fig. 52: Example of determination of nonlinear parameter beta ... 95
Fig. 53: Evolution of the Non-Linear Parameter β with porosity for dry and saturated specimens 96 Fig. 54: Evolution of the Non-Linear Parameter β with Temperature (linear trend) ... 97
Fig. 55 : Evolution of the Non-Linear Parameter β with Temperature (exponential trend) ... 97
Fig. 56 : An example of a specimen ... 101
Fig. 57: A mold to make a specimen ... 101
Fig. 58: Experimental process ... 102
Fig. 59: Specimen with the expansive core ... 103
Fig. 60: Crack created by the expansive core ... 104
Fig. 61: A cell of air permeability ... 105
Fig. 62: Initial crack taken by a video microscope (in the order of 100 µm) ... 106
Fig. 63: Initial crack size Vs. Airflow ... 107
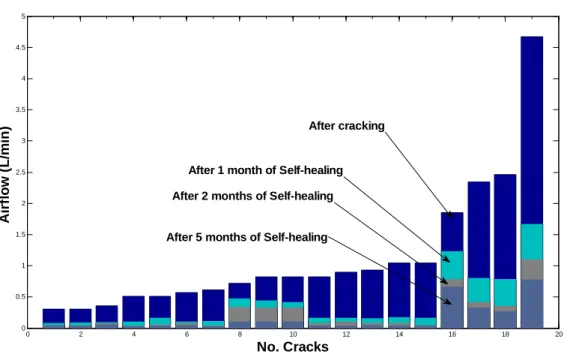
Fig. 64: The evolution of the airflow before and after self-healing in humid chamber for all the cracks ... 108
Fig. 65: The variation of the airflow for different cracks Vs. Time ... 108
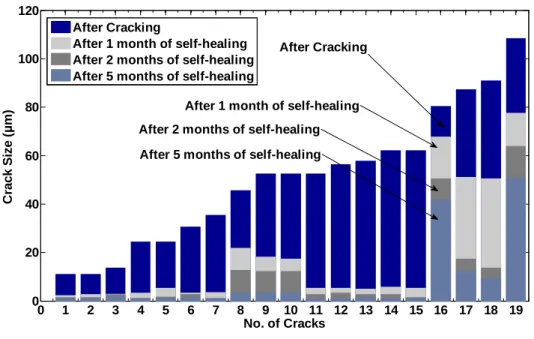
Fig. 66: The evolution of the size of crack before and after self-healing in humid chamber ... 110
Fig. 67: The variation of the crack size for different cracks Vs. Time ... 111
Fig. 68: The crack is placed between the two transducers ... 112
Fig. 69:Example of velocity measurement ... 112
Fig. 71: The variation of the velocity vs. time for the sample N° 1 ... 115
Fig. 72: The variation of the velocity vs. time for the sample N° 2 ... 116
Fig. 73: The variation of the velocity vs. time for the sample N° 3 ... 116
Fig. 74: The variation of the velocity vs. time for the sample N° 4 ... 117
Fig. 75: The variation of the velocity vs. time for the sample N° 5 ... 117
Fig. 76:The variation of the velocity vs. time for the sample N° 6 ... 118
Fig. 77:definition of the domain of the resolution ... 119
Fig. 78:Triangular Mesh ... 119
Fig. 79:Frequency of resonance 12 KHz ... 120
Fig. 80:Frequency of resonance 15 KHz ... 120
Fig. 81: Shift resonance of a sound sample ... 121
Fig. 82: Shift resonance before and after self-healing for a cracked sample... 121
Fig. 83: The variation of the alpha vs. time for the sample N° 1 ... 122
Fig. 84: The variation of the alpha vs. time for the sample N° 2 ... 122
Fig. 85: The variation of the alpha vs. time for the sample N° 3 ... 123
Fig. 86: The variation of the alpha vs. time for the sample N° 4 ... 123
Fig. 87: The variation of the alpha vs. time for the sample N° 6 ... 124
Fig. 88: The variation of the alpha vs. airflow for the sample N° 1 ... 125
Fig. 89: The variation of the alpha vs. airflow for the sample N° 2 ... 125
Fig. 90: The variation of the alpha vs. airflow for the sample N° 3 ... 126
Fig. 91: The variation of the alpha vs. airflow for the sample N° 4 ... 126
Fig. 92: The variation of the alpha 12 vs. airflow with an exponential approximation ... 128
Fig. 93: The variation of the alpha 12 vs. airflow with a polynomial approximation ... 128
Fig. 94: The variation of the beta 12 vs. airflow ... 130
Fig. 95: The variation of the beta 12 vs. airflow ... 130
Fig. 96: The variation of the alpha 15 vs. airflow ... 131
Fig. 97: The variation of the alpha 15 vs. airflow ... 132
Fig. 98: The variation of the beta 15 vs. airflow with a linear approximation ... 133
Fig. 99: The variation of the beta 15 vs. airflow with a polynomial approximation ... 133
Fig. 100: Mean radius of the annular specimen ... 134
Fig. 101: Alpha 12 Vs. Damage Index ... 135
Fig. 102: Beta 12 Vs. Damage Index ... 136
Fig. 103: Alpha 15 Vs. Damage Index ... 137
Fig. 104: Beta 15 Vs. Damage Index ... 138
Fig. 105: Schema of the crack ... 142
Fig. 106: Domain of the resolution ... 143
Fig. 107: Boundary conditions ... 143
Fig. 108: Meshing of domain of resolution ... 145
Fig. 109: The convergence of the solution in time ... 147
Fig. 110: The convergence of the solution in time (Logarithmic scale) ... 147
Fig. 111: Variation of the pressure in the crack ... 148
Fig. 113: Convergence of the V-velocity in the crack (40 nodes) ... 149
Fig. 114: Convergence of the V-velocity in the crack (10 nodes) ... 150
Fig. 115: Convergence of the U-velocity in the crack (10 nodes) ... 151
Fig. 116: Convergence of the U-velocity in the crack (40 nodes) ... 151
Fig. 117: Convergence of the V-velocity in the crack (10 nodes) ... 152
Fig. 118:Curve 3D of velocities (U and V) and velocity field in the crack before the flow establishment ... 152
Fig. 119: The establishment of the flow in the crack in time ... 153
Tables
Tab 1: Summary of classes and limit values (indicative) for indicators of durability……….. General (G) or Substitution (S): porosity, electrical resistivity, coefficient of……….. diffusion and permeability (Baroghel-Bouny v.,2004). ... 27 Tab 2: Most important studying of the healing for different values of opening cracks ... 37 Tab 3: Summary of techniques of NDT: Costs, advantages & drawbacks………. (Kouzoubachian C. ,2006 ) ... 57 Tab 4: Correlation between porosity and linear acoustic parameters ... 91 Tab 5: Number of cracks on each sample ... 114
General Introduction
In the areas of advanced industrial (nuclear, aerospace etc...), assessing the damage of the materials is the key to control the durability and reliability of materials in service. In this perspective, it is necessary not only to quantify the damage but also to identify the different responsible mechanisms. It is therefore essential to characterize the material and identify the most sensitive indicators of the damage presence to prevent their ruin and use them optimally. In order to resolve this problem, the acoustic methods seem to be interesting because of their non-destructive aspect and their sensitivity to damage. Thus, the ultrasonic linear acoustic methods have often shown their ability to characterize the damage through changes in velocity and attenuation of ultrasonic waves. However, several experiments have shown that linear acoustic methods are not sensitive enough to detect and localize the damage. Often, the first damage mechanisms are the precursors of final fracture, thus they are therefore very important to be identified. Faced with such difficulty, the nonlinear acoustic methods offer an important alternative that can detect and potentially characterize the weak or damage early, even localized or diffuse. Thus in recent years, nonlinear acoustics is becoming more like very promising new way in non-destructive evaluation and control of structural materials. Indeed, even if nonlinearities can be pertinent in heterogeneous materials such as rocks and cement-based materials, they increase significantly in presence of damage. Many potential applications exist in nonlinear acoustics for the characterization of both macroscopic localized cracks and diffuse damage assessment due to the presence of micro-cracks. In the latter case, because of their high sensitivity, nonlinear acoustic methods are particularly effective especially in the detection and characterization of early damage. The most known techniques in nonlinear acoustic are nonlinear elastic wave spectroscopy (NEWS) methods. These techniques (Shift resonance, higher harmonics generation...) are powerful, and present new tools in interrogation of damage in materials. Due to material nonlinearity, a wave can distort, creating accompanying harmonics, multiplication of waves of different frequencies, and, under resonance conditions, changes in resonance frequencies as a function of drive amplitude.
In other hand, for many concrete structures in the course of their lifetime, the assessment of durability is a key parameter needed in order to know whether safety is ensured or not. The presence of cracks, due to mechanical stresses or time dependent effects (shrinkage, creep…) is one of the major factors which can influence durability and serviceability of concrete structures in terms of resistance, permeability and transfer properties.
Self-healing of cracks is phenomenon acting positively in durability problems of cement-based materials. This process can take place only in presence of water (dissolved CO2 is
not always needed), and consists of chemical reactions of compounds exposed at the cracked surfaces. These reactions produce crystals, and the accretion of these from the opposite surfaces of a crack can re-establish the continuity of the material eventually. The essential requirement, with water, is the presence of compounds capable of further reaction. Thus, cement, hydrated or not, is the essential reactive element. There are two major assumptions regarding the reactions of healing: the hydration of unhydrated clinker available in the microstructure of hardened concrete (important for concrete with low water/cement ratio), or the precipitation of calcium carbonate CaCO3. Some studies carried
out until now highlight the self-healing phenomenon by means of water permeability tests. A diminution of the flow rate through cracked concrete is the main technique used to characterize self-healing of cracks.
The thesis is composed to 5 chapters as described below:
First chapter is contributed to a short bibliographical review about the performance approach and durability of cement based materials.
The second chapter introduces the self-healing phenomena: definition, the different techniques used to follow the self-healing process and it main advantages.
The third chapter focuses in the non-linear acoustic waves. First, the linear technique is exposed then the non-linear acoustic. Second, the main difference between both techniques is discussed. Finally, two non-linear techniques are presented: Higher Harmonic Generation and Shift resonance.
The fourth chapter is dedicated to the description of the objectives of this study with details in plus the experimental protocol adopted during this thesis.
The fifth chapter presents and evaluates the results of acoustic testing for the mortar sample before and after the heat damage. The longitudinal, shear velocities and modulus of
Young obtained by the linear acoustic wave are compared to the non-linear parameter beta measured by the higher harmonic generation. These results were discussed with the already published and correlated to the porosity, water cement ratio and temperature…
The sixth chapter is contributed to the self-healing. The evolution of the air flows and cracks size measured by the permeability tests and the non-linear acoustic parameters alpha and beta are analysed which helps to characterize the self-healing process.
The last chapter is a numerical study designed to model the permeability test done in the sixth chapter. The variation of the airflow with crack size obtained numerically is compared to the experimental results.
Chapter 1: Performance approach and
durability of cement-based materials
Introduction
Currently, in various countries, considerable research is devoted to development of new approaches to durability, to increase the lifetime of reinforced concrete structures at the lowest cost. These new approaches are based on selecting durability indicators, the definition of adequate performance-criteria on these indicators and evaluation of the life of the structure subject to predictive models.
The objective of this approach is to design concrete resistant to internal hazards (Alkali-reaction, reinforcement corrosion...) and external (sulphated environments, ocean ...) for a given lifetime.
From a practical standpoint, the predictive approach can be applied, first phase design of structures and secondly for the monitoring of existing structures (degraded or not).
The performance approach requires the use of models more or less sophisticated. It offers the engineer and the designer a complete methodology for the assessment and prediction of the durability of structures, with greater freedom and technical / economic benefits (Fig.1, Fig.2 )
Examples: 1)
• Lifetime: 100 years
• Risks:
- Reinforcement - Corrosion (chlorides) - Abrasion of concrete by ice - Freeze / thaw
2)
Fig. 2: Bridge Rion-Antirion, 2004. (Photo: J. Hartley)
• Lifetime: 120 years
• Risk: reinforcement corrosion (chlorides)
1. Course of the performance-approach
The performance-approach (Baroghel-Bouny v., 2005) proceeds in general as follows:
Defining the category of structure by determining its economic importance and strategic and particularly in selecting the requisite life;
Definition of environmental conditions including, for example the type of aggressiveness, variations in humidity, ...
Defining risk of degradation; reinforcement corrosion, alkali reaction, ...
Choice of durability indicators and characteristics of the material as a function of characteristics of structure, environment and construction details;
Selection of specifications for durability indicators based on the importance of structure, type of environment, life and required structural arrangements;
Choosing a predictive model of life where durability indicators appear as input data.
2. Indicators of the durability
The application of performance-approach in the design phase requires, first time, a census of durability indicators. These indicators are chosen in function of their importance by the durability characteristics of structure and its environment and choice of structural arrangements (coating...). They are simple but relevant parameters to quantify the phenomena and to develop predictive tools.
General indicators of durability
Durability indicators general, listed below, are the first order parameters to assessing and predicting durability. They are essential to prevent the corrosion and alkali reaction. The number of these parameters is very small and they are complementary and are not routinely required to each case study.
These indicators are:
- Porosity accessible to water (NT BUILD 443, 1995) (Fig.3)
- Diffusion coefficient (effective or actual) of chloride ions (NT BUILD 443, 1998; NT BUILD 492, 1999) (Fig.4)
- Permeability to liquid water and gas (AFPC-AFREM ,1998; NF EN
- Content of portlandite (Ca (OH) 2) (Baroghel-Bouny v.,2004)
- Carbonation test (Fig.5)
Fig. 3 : Porosity water
Fig. 5: Accelerated carbonation test
Indicators of the substitution
The general indicators can be substituted by agreement of the contracting authority, by parameters that are easier to identify more specific problems or more adapted to the models used. These parameters are as follows:
* Porosity accessible to mercury (Baroghel-Bouny V.2004)
* Electrical resistivity (Baroghel-Bouny V..,2004) * Quantity of electricity (Baroghel-Bouny V.,2004)
* Diffusion coefficient of CO2 or O2 (Baroghel-Bouny V.,2004)
* Capillary absorption coefficient (AFPC-AFREM,1998)
Additional parameters:
The additional parameters previously defined indicators are required when the predictive model uses as input data or to assist in the interpretation of durability. The choice of these parameters is often subjected to prior to the probation of the owner.
Among these indicators:
- Characteristics of the porous structure, - Degree of hydration of cement,
- Nature’s hydrates, - Content of C-S-H, - Rate of water saturation,
- Isotherms of adsorption-desorption of water vapor . - Diffusion coefficient of water vapor,
- Heat of hydration, - Tensile Strength.
3. Classes and limit values for indicators of durability
Durability indicators (General and Substitution) used primarily for definition of classes depending on the potential durability of the level "very low" to rated "very high".
These classes will be used for a qualitative or quantitative Durability "potential" in terms of the material. The limits associated with indicators (Tab.1) are relative to measurements made in laboratories, according methods described in the standards guides (design of concrete for a given lifetime of works) applied on specimens or molded concrete cores stored in laboratories.
Performance evaluation of a given concrete can be achieved by comparing values of durability indicators that have been obtained for the formula to be considered corresponding classes offered (Table 1). This table is a simple tool that can be used by the designer to select the concrete on the basis of predefined criteria, and / or to optimize the formulation or to control the quality of the material.
Tab 1: Summary of classes and limit values (indicative) for indicators of durability General (G) or Substitution (S): porosity, electrical resistivity, coefficient of
diffusion and permeability (Baroghel-Bouny V.,2004). Classes and limit values
Potential durability Very
hight Hight Medium Low Very low
G Porosity accessible to water
(%) > 16 14 to 16 12 to 14 9 to 12 6 to 9 S Porosity measured by mercury intrusion (%) > 16 13 to 16 9 to 13 6 to 9 3 to 6 S Electrical resistivity (Ohm.m) < 50 50 to 100 100 to 250 250 to 1000 > 1000 G Effective diffusion coefficient of chlorides (10-12 m2) > 8 2 to 8 1 to 2 0.1 to 1 < 0.1 G Effective diffusion coefficient chlorides(10-12 m2) > 50 10 to 50 5 to 10 1 to 5 < 1 G Effective permeability to gases (10-18 m2) > 1000 300 to 1000 100 to 300 10 to 100 < 10
G Liquid water permeability
(10-18 m2) > 10 1 to 10 0,1 to 1
0,01 to
0,1 < 0,01
High durability potential Medium durability potential
Low durability potential Very low durability potential very high potential
Conclusion
The performance approach is now an indispensable tool. It allows you to specify the design phase, especially for large projects, performance-very relevant criteria and objectives for sustainability. The identification of sustainability indicators requires the completion of studies relatively long because of the importance of the duration of the tests recommended. These indicators must be taken into account before constructing. The application of this approach will provide performance-formulas regional references taking into account the sustainability indicators. These are determined by the characteristics of local materials, the rate of aggressive medium and the required lifetime.
Chapter 2: Healing and self-healing of
cement based materials: Definition,
Introduction
The aging of infrastructure generates significant investment because of the so large number of structures damaged and very high costs of repair. Indeed, there is an explosion in the budget to repair these structures in order to ensure the reclamation and maintenance of its quality. The life of a cement-based structure is very often linked to the ability of the cement-based materials to prevent the penetration of aggressive agents in the porous network. The ability of strength cement based materials was the intrusion of these agents is characterized by physical quantities: the permeability, porosity...
Cracking is a key parameter for durability of cement structures. But the coupling between cracking and the durability is complex, because the cracks can be evolutive. Their location and geometry (crack opening) may vary as a result of internal stresses (alkali-aggregate reaction, freeze-thaw) or external (mechanical loads, thermal cycling). The self-healing mechanisms may also contribute to changing the geometrical properties of cracks (length, breadth and openness) and consequently the transport mechanisms in the cracking plane. Approaches to take account of cracking on the kinetics of degradation of cement structures and the prediction of it life span are still relatively poorly developed. This lack of reliable and efficient tools stems in particular from poor understanding of the mechanisms and kinetics of self- healing cracks in the cement matrices.
1. Definition of healing
The term healing is often associated with medical field to designate "the spontaneous repair of body tissue affected by a lesion." This term has been extended to the field of cement based materials designer for healing / repair of cracks on the structures presented. The phenomena involved in this process can be of different natures. Some consequences are inherent properties of the material: water in the presence of chemical or physical reactions take place within cracks and reseal can (partially or wholly) the latter. Cracks can also be healed / fixed per injection of different sealers.
are very similar and the reader can sometimes mix between different concepts. Indeed, different authors sometimes use a same word to designate and separate phenomena, a same phenomenon is sometimes designated by different words. It is then interesting to take stock of the vocabulary used in the literature in order to have clear ideas on the terms to be used according to the studied phenomenon. This helps to avoid a misinterpretation of the data of the literature.
A distinction is first made between the autogenous healing and healing / repair provoked by human. These two categories are then redivided into two. Autogenous healing includes the natural healing and self-healing (Fig.6).
Despite these differences, autogenous healing is associated with the capacity of cement based materials, once produced, has partially or wholly reseal cracks, in the presence of water thanks to chemical and physical phenomena within the crack.
Neville (2002) defines the phenomenon as autogenous healing to restore the continuity of the two lips of a crack without external intervention to the material.
2. Phenomena involved in the healing process
For many years, information about the phenomenon of healing was limited. The first description of healing back to the French Academy of Sciences in 1836 (Clear, 1985; Hearn, 1998). Subsequently, many researchers have studied the phenomenon of healing and have confirmed its existence in the presence of water in a crack, the latter is able to close in part or in whole.
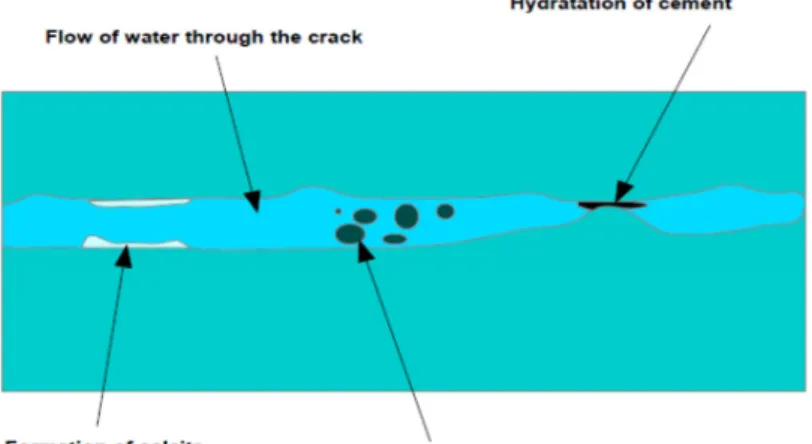
However, as mentioned by Neville (2002) and Hearn (1998), the literature has not always been unanimous in regard to phenomena at the origin of healing of cracks. Several phenomena involved in the healing process are mentioned in the literature. Some studies conclude that a single phenomenon is a cause of healing, while others think it is couples of different effects physico-chemical phenomena. The main phenomena that could potentially be at the origin of healing were already largely identified in 30 years (Turner, 1937) and are deferred in almost all introductions articles on this topic. The following phenomena can then take place (Fig.7):
• The formation of calcium carbonate (CaCO3) and, more specifically of calcite in the
crack (Clear, 1985; Edvardsen, 1999, Homma et al., 2009; Lauer & Slate, 1956; Li & Yang, 2007; Loving , 1936; Nanayakkara, 2003);
• Continuous hydration of cement (anhydrous cement) in the flow path (lips of the crack to crack the case of concretes) (Li & Li, 2011; Schlangen et al., 2006; Zhong Yao & , 2007);
• Blocking the flow of water due to the presence of impurities in it or particles of concrete that have "Spare parts" of the lips of the crack and blocking the passage of water.
Fig. 7: Phenomena causing the decreasing in the flow of water in cement materials
Hearn (1998) draws the reader's attention to phenomena that could be construed as causes of healing but, in reality, are not. She calls this a false healing since it is then reversible phenomena. An example is the lack of saturation of the specimen in testing permeability to water. In this case, the presence of air in the concrete matrix or swelling of the cement paste when water penetrates into the concrete, can cause a decrease in permeability over time. This can then be the consequence of poor saturation and not necessarily due to healing. In tests of permeability, a measure of the flow as input and output, or the evolution of the weight of the specimen can check the good condition of saturation of the test specimen and thus avoid a misinterpretation of results.
When there is formation of calcite, white marks are often visible at the cracks. In 1936, the carbonation reaction (formation of CaCO3) seems to cause full healing of cracks presented in
numerous aqueducts (Loving, 1936). These cracks could go up to the surface openings of 1.5 mm and had been observed 5 years earlier, in 1931, shortly after the construction of aqueducts. Lauer and Slate (1956) confirm the importance of this reaction in the healing mechanism with the help of chemical and petrographic analyzes and has the help of microscopic observations of compounds forms (size, arrangement, distribution, crystal orientation). Subsequently, the formation of calcium carbonate on the lips of the crack is the
phenomenon that attracts the most attention because it is often regarded as the predominant phenomenon in self- healing (Hearn, 1998; Li & Yang, 2007; Neville, 2002). Edvardsen (1999) estimates that just consider this reaction as the cause of healing, other phenomena that have no or very little influence.
As mentioned previously, some studies conclude that hydration is the only explanation for the healing of concrete, while excluding the healing by the formation of CaCO3. In the beginning
of research on self- healing, continuous hydration has often been regarded as the main phenomenon involved (Igarashi et al., 2009). Nevertheless, an analysis of the results of these studies allows us to see that they focus on concretes tested at a young age, that is to say cracks in the early days and "subject" of a healing. Thus the phenomenon of continuous hydration is essentially a phenomenon that has its importance for concretes at very young age and would therefore have much less importance for concretes walls (Hearn, 1998; Neville, 2002).
3. Study of healing: different approaches
In the literature, techniques and different approaches are used to discuss and study the healing. Given that this phenomenon has a particular interest in the cracked structures that would present a problems of sustainability and loss of bearing capacity of their damage. Most studies on self- healing include the creation of cracks. These last are generally induced tensile tests (Edvardsen, 1999, Homma et al., 2009; Hosoda et al., 2009; Lauer & Slate, 1956; Nanayakkara, 2003; Jooss & Reinhardt, 2003; Ying -Zi et al., 2005), and bending tests (Granger et al., 2007; Schlangen, et al., 2006) or sometimes even through compression tests (Yao & Zhong, 2007), although this is much less frequent. For other studies, cracking results from freeze-thaw cycles (Jacobsen et al., 1996, Jacobsen et al., 1995, Jacobsen & Sellevold, 1996; Sukhotskaya et al., 1983).
Following a cracking, the specimens are sometimes put in moist curing (often an immersion in water) and then refills to evaluate the mechanical advantages that could make healing products forms. Such studies compare the difference in terms of strength, stiffness, dynamic modulus of elasticity, damage, etc.., before and after healing. These studies were then used primarily permeability tests and sometimes a test penetration of chloride ions. In the case of permeability tests, the decrease in the coefficient of permeability over time indicates the potential for healing. From the tests of permeability, it is sometimes possible to determine the
evolution of the crack opening equivalent in time, that is to say, to estimate the volume of the crack filled with healing products. The studies described above (mechanical approach or sustainability) are often accompanied by microscopic observations of different characterization techniques of materials, and chemical analysis to identify the nature and geometrical characteristics of the compounds form during the process healing.
The main techniques used in literature to study self-healing are:
Continuous tests of permeability to water, with a continuous flow under a pressure gradient, during which healing takes place (Clear, 1985; Edvardsen, 1999; Hosoda, et al., 2009; Li & Yang, 2007; Nanayakkara, 2003) ;
Immersion of specimens in water and testing water permeability (Homma et al., 2009; Hosoda, et al., 2009, Yang et al., 2009) or measuring air permeability (Argouges & Gagné , 2009; Ismail ,2006);
Testing of penetration of chloride ions (Li & Yang, 2007);
Mechanical tests (Granger, et al., 2007; Homma et al., 2009; Jacobsen, et al., 1996, Jacobsen & Sellevold, 1996; Lauer & Slate, 1956; Li & Li, 2011; Sukhotskaya, et al., 1983, Yang et al., 2009; Zhong & Yao, 2007);
Chemical analysis of water (Clear, 1985; Edvardsen, 1999);
Analysis by X-ray diffraction (Clear, 1985; Edvardsen, 1999, Ismail 2006; Jacobsen, et al., 1995; VC Li & Yang, 2007) and analyzed by Raman spectroscopy (Homma et al., 2009);
Optical microscopy (Clear, 1985; Edvardsen, 1999; Hosoda, et al., 2009; Lauer & Slate, 1956) or digital microscopy (Homma et al., 2009);
Chemical and petrographic analysis of compounds forms on the lips of the cracks (Lauer & Slate, 1956);
Scanning electron microscopy (SEM) conventional or variable pressure (Ahn & Kishi, 2010; Edvardsen, 1999; Homma et al., 2009; Kishi et al., 2007; Li & Yang, 2007);
Visual observation of the white precipitate at the cracks (Argouges & Gagne, 2009; Clear, 1985);
Analysis of acoustic emission (Granger et al., 2007) whose technique "Ultrasonic Pulse Velocity, UPV" (Jacobsen & Sellevold, 1996; Zhong Yao, 2007);
Analysis of the frequencies of resonances (Li & Yang, 2007); Technique of time reversal mirrors (Granger et al., 2008).
This first section aimed to define what is healing, more particularly autogenous healing. The main phenomena involved in this process have been described and the different approaches taken in the literature to study the phenomenon have been enumerated. It is now interesting to understand under what conditions it occurs and is favoured. A good understanding of the physicochemical processes (and parameters influencing them) which caused healing is necessary to know when this phenomenon occurs in the structures. A good understanding of the phenomenon may also permit the development of cement based materials with better healing ability. The following section aims to describe the main parameters that influence the ability to heal cracks.
4. Parameters affecting the healing process
• Influence of crack opening and its length
The healing potential of a crack is strongly linked to its opening. Several studies have studied the influence of crack opening on the ability of healing (Argouges & Gagne, 2009; Clear, 1985; Edvardsen, 1999; Hosoda, et al., 2009, Ismail 2006; Nanayakkara, 2003; Yang et al., 2009, Yi et al., 2011). These studies focus on the openings of cracks less than 0.4 mm (surface). Table 1 shows the crack openings studied in the various references listed above.
Tab 2: Most important studying of the healing for different values of opening cracks
By studying the ability of healing with the permeability tests, several studies (Argouges & Gagne, 2009; Clear , 1985; Reinhardt & Jooss, 2003) conclude that the healing is faster for the small initial opening crack than the big one.. Fig.8 illustrates this result.
Fig. 8: Evolution of the relative flow vs. time for crack openings w = 0.05 mm, 0.1 mm and 0.15 (Reinhardt & Jooss, 2003)
This figure, which represents the evolution of the relative flow (% of initial flow) over time for crack openings of 0.05, 0.1 and 0.15 mm (Reinhardt & Jooss, 2003), shows that the relative flow rate decreases more quickly to the crack opening of 0.05 mm than for 0.1 and 0.15 mm. Argouges and Gagne (2009) obtained the same type of result: the
Year Authors Opening of cracks
2003 Reinhardt & Jooss 0.05, 0.1 and 0.15 mm 2009 Argouges & Gagné 0.05, 0.1 and 0.22 mm 1985 Clear 0.1, 0.15, 0.2 and 0.3 mm 1995 Ramm & Biscoping, 0.2, 0.3 and 0.4 mm 2009 Hosoda, et al. 0.1, 0.2 and 0.4 mm 1999 Edvardsen 0.1, 0.2 and 0.3 mm 2003 Nanayakkara 0.1, 0.15, 0.2 and 0.25 mm 2009 Yang. et al. 0 to 0.3 mm
2006 Ismail 0.078, 0.092 and 0.117 mm 2011 Yi. et al. 0.03, 0.05 and 0.1 mm
crack is more refined when the flow decreases with time, especially in the first month of storage.
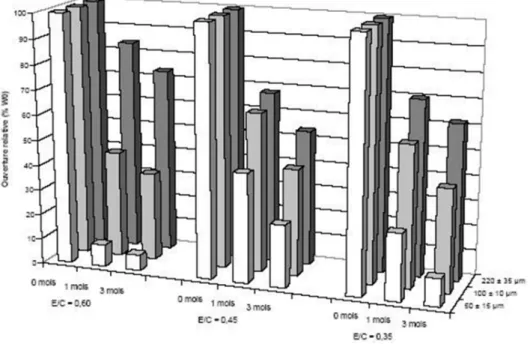
Fig. 9: Evolution of the opening of cracks of concrete vs. time (Argouges & Gagne,2009)
It is interesting to note that Fig.8 and Fig.9 represent the evolution of relative values. These values give information about the importance of the effects of healing, but not really on the mechanisms involved in the healing process. We must remain cautious in interpreting the results. Saying that a thinner crack heals faster does not necessarily mean that the healing process is different depending on the crack opening and crack a finer would have more potential to form products of healing. Indeed, after Argouges and Gagne (2009), the rate of product formation of healing forms on the lips of the cracks conserved one month has a relative humidity of 100% does not significantly change depending on the opening of crack. A same thickness of healing products has more impact in terms of gain durability, if the opening of initial crack is smaller, because the proportion of products filled with crack healing is more important.
Although several studies show that the effect of healing is faster in thinner crack, the literature is not entirely unanimous. Nanayakkara (2003) showed, by studying cracks with openings on the surface of the specimen between 0.1 and 0.25 mm and by deducting the
corresponding equivalent crack openings (deduced from the law of Poiseuille flow through a crack), there is a crack opening for which the optimal time needed to completely heal the crack is minimal (Fig.10). It would be longer to heal the crack to an opening smaller and larger than the optimum aperture. Nanayakkara (2003) explains this phenomenon by the fact that for a crack opening too low, the water flow is low and is thus longer react to calcium ions (Ca2+) from the cement paste to form of calcite (CaCO3).
Fig. 10: Time required for full healing cracks according to their opening two hydraulic gradients (Nanayakkara, 2003)
On the other hand, when the crack opening is larger than the optimum aperture, the water flow in this case may be too high and, although a larger amount of CaCO3 can potentially be
formed, some of these new compounds are probably washing. Ismail (2006) indicates that for a crack opening of 78 µm, healing is slower than for a crack open more than 117 µm after 1 month of storage in a humid chamber. This result then joined in part the idea of Nanayakkara (2003): the finer the crack does not always heal faster. Ismail (2006) combines this result has a lower capacity of penetration of water in the crack finer and more precisely the lack of intake of carbon dioxide (CO2) dissolved while limiting the formation of calcite in the first
months of storage in humid conditions. This explanation also supports the hypothesis Nanayakkara (2003). Due to lack of supply of CO2, it takes longer to react Ca2+ ions to form
calcite.
discussed. Other studies have instead focused on the question of the influence of crack opening on the recovery properties of mechanical properties and damage by following the phenomenon of healing. Then, different testing techniques have been used. Yang (2009) studied the recovery properties of the resonance frequency of healed specimens as a function of crack opening. The test parameters of this study are different than in the previously cited studies. While, they focused mainly on ordinary concretes or mortars, Yang (2009) studied a fiber mortar containing PVA fibers. This material has the peculiarity of having a very ductile behavior in tension and a multi-micro cracking (very fine cracks up to reach break) while having a percentage of fiber length 6 mm less than 2% by volume. Moreover, rather than being canned in water continuously, this time specimens cracks are subjected to cycles of wetting-drying. The resonance frequencies obtained on specimens healed are compared to those obtained on a same specimen without healed cracks. The results indicate that for a crack width (w) less than 50 µm, a total recovery properties of the resonance frequency is possible. It therefore becomes identical to that of the specimen before cracking. Their recovery becomes less and less important when w evolves between 50 and 150 µm. These results are strongly linked to those obtained on the influence of crack opening on the durability of concrete gain brings the healing. Indeed, Yang (2009) validates the above conclusions by permeability tests that show a marked decrease of the permeability for w = 50 µm. For w = 150 µm, there is no difference in permeability between specimens that underwent 10 cycles of wetting drying and those who have not healed.
Schlangen et al. (2006), for their part, observed the influence of crack opening on the recovery of mechanical strength due to the healing. The parameters studied are the characteristics of cracks (Ex: length, roughness, etc..) Associated with different crack openings before healing. These cracks are created at young age by three-point bending until it reaches a certain openness. Subsequently, the crack lips are held together. Compressive stress is to keep the lips initiates cracks in contact during the healing process. The compressive loading was done in order to reproduce loading cases that may occur on the concrete at early age in dams for example. For this type of loading (bending), the crack size is more higher
than in the previously tests. Despite a certain dispersion of results, it seems there is no significant influence of the crack opening on the recovery properties of resistance to bending. Some authors studied the influence of hydraulic gradient on the critical crack opening can heal completely (Edvardsen, 1999; Nanayakkara, 2003).
Influence of humidity
Healing can take place only in the presence of water since it is mainly the result of chemical reactions between water and certain compounds of concrete exposed close to the crack. Water is essential. However, it may be stationary or to flow through the crack. The ideal for there to be healing of cracks is a relative humidity of 100%, which is the case in most studies on this phenomenon. When the rate of moisture decreases, the self-healing is much less pronounced (Neville, 2002). This result can be explained by the fact that if we do not have 100% humidity there is a lot less CO2 dissolved in water available for the reaction of calcite formation (Lauer & Slate, 1956; Neville, 2002 ). In addition, after Lauer and Slate (1956), Ca(OH)2 can react
with dissolved CO2 in water can migrate more easily if the water is in sufficient quantity.
These authors also studied the difference in self-healing (in reality the recovery of tensile strength caused by healing) depending on whether the specimen was undergoing a wet cure (immersion in water: 100% humidity) or if it was left in an environment with a relative humidity of 95%. Their conclusion is that water saturation is essential for optimal healing with mechanical gain. For a relative humidity of 95%, the specimens found at best 25% of the strength of specimens immersed in water (100% humidity). In this study, the kinetics of healing (in terms of renewed strength here) also seems different rates depending on the humidity. For an immersion in water, the evolution of renewed strength in the first 90 days is parabolic in nature, whereas for a relative humidity (RH) of 95%, this evolution is slower and seems rather linear suggesting that the healing reaction takes place over a longer period of time.
5. The kinetics of healing of inactive cracks
The kinetics of healing appears faster in the early stages and then slows thereafter (Argouges & Gagne, 2009; Clear, 1985; Edvardsen, 1999; Hosoda, et al., 2009, Ismail 2006; Lauer & Slate, 1956; Nanayakkara, 2003; Biscoping & Ramm, 1995; Jooss & Reinhardt, 2003). When specimens (concrete or mortar) cracks are stored in water, the healing appears to occur predominantly in the first three months (Argouges & Gagne, 2009, Ismail 2006; Lauer & Slate, 1956). Kinetics is faster in the first month then slowed between the 1st and 3rd month after the creation of the crack (Argouges & Gagne, 2009). In case the healing is done under flow, that is to say that pressure is applied on the specimen to initiate a flow of water through the cracks or, three months of this period is reduced to a few tens or hundreds of hours, depending on the level exerts pressure (Edvardsen, 1999; Nanayakkara, 2003; Reinhardt & Jooss, 2003). This shows that although the kinetics of healing is dependent by the test conditions (crack openings, temperature, pressure, humidity, etc.).
The kinetics of self-healing is followed through several types of tests. This can be highlighted by evaluating the decreasing in the coefficient of permeability over time, by studying the recovery properties of certain mechanical properties or by observing the amount of product forms of healing. Lauer and Slate (1956) measure the evolution in time of the mechanical properties of a specimen crack heals. In their study, the increased resistance over time is of parabolic (faster at the beginning and then slows down). Yang et al. (2009) found a variation in the kinetics of healing by studying the recovery properties of the resonance frequency for specimens that have healed under wetting-drying cycles. Homma et al. (2009), whether by studying mortars with polythene fiber, steel or a mix of both (hybrid fibers), found that the thickness of the product (formed by healing) is more important in the early days and then slows by on. This result has been validated subsequently by tests of permeability.
This healing kinetics may be explained by the phenomena involved in the healing process. In the case of concretes at very young age, the healing would be associated primarily to a continuous hydration of anhydrous cement (Neville, 2002; Schlangen, et al., 2006; Zhong & Yao, 2007) and the kinetics of healing could then be explained by the nature of the hydration process of the early days of concrete. After 28 days, most researchers agree that the formation of calcium carbonate is the main cause of self-healing of mature concretes (Yang et al., 2009). However, once the nucleation of calcite, it is possible to distinguish two phases of growth
(Edvardsen, 1999). The first is controlled on the surface, while the second results from a phenomenon of diffusion of Ca2+ ions through the concrete and the calcite layer already
formed.
The first phase of growth occurs while there is a sufficient amount of Ca2+ ions on the
surface. Growth of calcite then occurs rapidly. Once these Ca2+ ions are no longer available
directly on the surface of the crack, they diffuse through the concrete thanks to this concentration gradient between the surface and the crack inside the concrete. During this growth phase, the time required for ions to diffuse through the concrete and already formed the layer of calcite is often longer than the time necessary for these same ions to be absorbed by the layers through which it passes. Therefore, in this phase, the growth rate depends on the diffusion rate and thus the microstructure of concrete. These phenomena may therefore explain the growth kinetics decreasing healing observed in the literature.
6. The healing effect on the mechanical behavior
It has been shown previously that healing causes a decrease in permeability and that this phenomenon has an interest in sustainability. Another aspect of healing is to see if this phenomenon may provide an advantage in terms of mechanics, restoring the strength or gain of rigidity. Several studies have examined to understand the effect of healing on the mechanical behavior of concretes. Mechanical tests (tensile, bending and compression) and non-destructive testing (acoustic techniques) were performed to evaluate the mechanical behavior of the damaged specimens and the evolution of the healed cracks. The acoustic emission tests have enabled to characterize the micro-cracks in a cracked specimens before and after healing (Granger et al., 2007). These approaches give a better understanding about the cracking of a healed crack. This damage starts with a shattered healing products. Subsequently the pre-existing crack continues to spread (Granger et al., 2006). Li and Yang (2007) also noticed that, if an uniaxial tension is applied to a healed specimens, cracking takes place generally in the healed cracks. This is explained by the low resistance of healing products compared to products of hydration (Li & Yang, 2007). The observation of surface
cracks of lips healed and unhealed shows that the non-healing concrete presents a dense structure compared to that of crystal forms during healing (Granger et al., 2007; Granger et al., 2008; Jacobsen, et al., 1995). These come in the form of clusters less dense and therefore have different mechanical properties of the material before cracking. This would explain that when reloading a healed specimen, the damage take has first place in the healed zones.
Later in this section, we summarize the main results obtained in terms of mechanical effects has caused by healing, depending on the type of initial damage and mechanical properties tested.
7. The benefits of self-healing
7.1. Gain of mechanical properties after being subjected to freeze-thaw
Jacobsen and Sellevold (1996) have noted a small increase in compression resistance of 4 to 5% on specimens of ordinary concrete healed after three months of storage in water due to damage by freeze thawing. During these cycles, the specimens had lost 22 to 29% of their initial compressive strength. In another study in which the identical specimens were preserved in three months in saturated lime water after having undergone various cycles of freezing-thawing, the specimens underwent 31 cycles with a recovery properties were present in 10% of the compressive strength whereas specimens that have undergone more cycles (61 and 95 cycles) did not show gain resistance (Jacobsen et al., 1996). Parallel to these tests, analysis of acoustic tests conducted on identical specimens showed that the resonance frequency (dynamic modulus of elasticity) have found, after healing, 85 to 98% of their initial value. Healing would have absorbed much of the damage to freeze thaw, but this phenomenon don’t recover the compression strength. Observation of cracks showed that they were only partially filled by the healing products, which can explain the small increase in compression strength after healing (Jacobsen et al., 1995). The positive effect of healing, after a freeze-thaw damage, has also been highlighted by Sukhotskaya et al. (1983). They have found that, proceeding with a regular periods of immersions water at certain times during the freeze-thaw