HAL Id: inria-00462526
https://hal.inria.fr/inria-00462526
Submitted on 10 Mar 2010
HAL is a multi-disciplinary open access
archive for the deposit and dissemination of sci-entific research documents, whether they are pub-lished or not. The documents may come from teaching and research institutions in France or abroad, or from public or private research centers.
L’archive ouverte pluridisciplinaire HAL, est destinée au dépôt et à la diffusion de documents scientifiques de niveau recherche, publiés ou non, émanant des établissements d’enseignement et de recherche français ou étrangers, des laboratoires publics ou privés.
Environment
Yves Caniou, Ghislain Charrier, Frédéric Desprez
To cite this version:
Yves Caniou, Ghislain Charrier, Frédéric Desprez. Analysis of Tasks Reallocation in a Dedicated Grid Environment. [Research Report] RR-7226, INRIA. 2010. �inria-00462526�
a p p o r t
d e r e c h e r c h e
0 2 4 9 -6 3 9 9 IS R N IN R IA /R R --7 2 2 6 --F R + E N G Domaine 3Analysis of Tasks Reallocation in a Dedicated Grid
Environment
Yves Caniou — Ghislain Charrier — Frédéric Desprez
N° 7226
March 2010Centre de recherche INRIA Grenoble – Rhône-Alpes Yves Caniou, Ghislain Charrier, Fr´ed´eric Desprez
Domaine : R´eseaux, syst`emes et services, calcul distribu´e ´
Equipe-Projet GRAAL
Rapport de recherche n° 7226 — March 2010 — 28 pages
Abstract: In this paper, we study the impact of tasks reallocation onto a grid platform. More precisely, we target a multi-cluster environment where clusters can be homogeneous or heterogeneous, and use different policies for their local resources management.
In this context, we propose a reallocation mechanism that migrates jobs in waiting state from one cluster to another one. We perform simulations using real traces of jobs to study the benefit of reallocation. We compare two different algorithms providing the reallocation mechanism, each with several heuristics to schedule jobs.
Results show that in some cases it is possible to obtain a substantial gain on the average job response time (almost up to a factor of four). In the other cases, the reallocation mechanism is beneficial most of the time for the jobs of the users. It is thus interesting to implement a reallocation mechanism in a Grid framework.
Key-words: Reallocation, batch schedulers, metascheduler, computation grids
This text is also available as a research report of the Laboratoire de l’Informatique du Parall´elisme http://www.ens-lyon.fr/LIP.
R´esum´e : Dans ce rapport, nous ´etudions l’impact de la r´eallocation de tˆaches dans un environnement de grille. Plus pr´ecis´ement, la plate-forme cible qui nous int´eresse est un environnement multi-grappes o`u les grappes peuvent ˆetre homog`enes ou h´et´erog`enes et utilisent diff´erentes politiques d’ordonnancement local.
Dans ce contexte, nous proposons un m´ecanisme de r´eallocation qui mi-gre des tˆaches qui n’ont pas encore commenc´e leur ex´ecution, d’une grappe `
a une autre. Nous r´ealisons des simulations utilisant des traces provenant de plates-formes r´eelles pour ´etudier l’impact de la r´eallocation. Nous com-parons deux algorithmes de r´eallocation, chacun utilisant diff´erentes heuris-tiques pour s´electionner l’ordre dans lequel ordonnancer les tˆaches.
Les r´esultats montrent que dans certains cas il est possible d’avoir un gain important sur le temps moyen de r´eponse des tˆaches (allant jusqu’`a presque un facteur quatre). Dans la majorit´e des autres cas, la r´eallocation apporte un b´en´efice pour les tˆaches des utilisateurs. Il est donc int´eressant d’implanter un tel m´ecanisme dans un intergiciel de grille.
Mots-cl´es : R´eallocation, batch schedulers, m´etaordonnanceur, grilles de calcul
1
Introduction
In order to meet the evergrowing needs in computing capabilities of scientists of all horizons, new computing paradigms have been explored. Supercom-puters were developed to perform massive parallel computations but their cost (acquisition and maintenance) is still prohibitive. Another approach was developed later and was called the Grid. The Grid is the aggregation of heterogeneous computing resources connected through high speed wide area networks. Computing resources can be sequential or parallel architectures (clusters of workstations or parallel machines), the later being generally managed by a local resources manager, also called batch scheduler. In such a case, the submission of a job necessitates a number of processors and a walltime. The walltime is the expected execution time for this job. Usually, it is given by the user or computed using data mining techniques.
In most local resources management systems, when the walltime is reached, the job is killed, so users tend to over-evaluate the walltime to be sure that their job finishes its execution. Furthermore, in [23] authors show that resources management systems are not able to put up with burst of submissions. A paper by Beltr´an and Guzm´an [2] presents the impact of the workload variability on the local resources management system and show that the variability leads to bad scheduling decisions.
In this paper, we place ourselves in a multi-cluster Grid connected through a high bandwidth network. We propose a reallocation mechanism that should better take into account the errors on walltime and the load bursts in the local resource management systems by moving waiting jobs from one cluster to another. The mechanism we propose is at the middle-ware level and thus it can be used to connect different clusters together while each cluster keeps its local scheduling or resource allocation policies. Each job submitted onto the platform will be executed on a cluster chosen by the middleware without intervention from the person submitting the job.
We propose two reallocations algorithms using six different heuristics each. We evaluate them by comparing them on different metrics to an exe-cution where reallocation is not performed. Preliminary work was proposed in [4] and we extend this work in several directions. We evaluate different algorithms to implement the reallocation mechanism, different heuristics to select the jobs, the automatic adjustment of the walltime to the speed of the cluster, and several other optimizations.
The remainder of the paper is as follows. In Section 2, we present the architecture we chose to implement reallocation algorithms and mechanisms. We also detail the different (re)scheduling heuristics used and compared in this work. Then we explain the experimental framework in Section3, giving information on the simulator that we developed, on the platforms simulated with real-world traces, scenarios of experiments that were conducted as well
as the metrics on which results are compared in Section 4. In Section5 we present related work and we conclude in Section6.
2
Tasks Reallocation
In this section, we describe the proposed tasks reallocation mechanism. First, we present the architecture (Section 2.1) of the components of the system. Then we present the different algorithms used for the tasks reallo-cation (Section2.2).
2.1 Architecture of the Solution
The architecture that we propose in order to manage task reallocation, is close to the GridRPC standard from the Open Grid Forum. Thus it can be implemented in GridRPC compliant middleware such as Diet [7] and Ninf [20].
The architecture relies on three main components: servers which are deployed on computing resources, an agent (or a set of distributed agents), and clients that send computing requests. Servers and their services are registered to the agent. When a user performs a request, the client contacts the agent which can perform some meta-scheduling in order to determine the best server according to a given metric. Usually, the server able to finish the job the earliest is chosen. In such a case, transfers with the agent are required to communicate information concerning the service and monitoring and/or prediction information. Then the identity of the chosen server is sent back to the client that submits its request. Eventually some data transfers are also performed. Finally, the server returns the results to the client if needed.
Because such a middleware is deployed on existing resources and has limited possibilities of action on the local resources managers, we developed a mechanism that only uses simple queries such as submission, cancellation, and estimation of the completion time.
The server deployed onto the frontal of the parallel resource is in charge of the interactions with the resource manager. It also computes each estimation of the walltime hence depending on cluster characteristics (in our work, we focus on processor speed, but better models involving application detailed modeling with communications information with regard to the architecture, bandwidth, and latency of the parallel resource can be used).
The agent (meta-scheduler) has to assign to a computing resource any incoming job sent by the client. Different scheduling algorithms can be de-ployed. The two simplest are Random (choose a resource randomly) and
Round Robin (each cluster is selected one after the other). Such mapping
heuristics are sometimes available because monitoring may not be imple-mented or available on some servers. A Grid middleware may also use other
online algorithms such as Minimum Completion Time (MCT) if some
mon-itoring and performance prediction are available (see [17] for a taxonomy of online and offline heuristics). In this study, we consider that the meta-scheduler uses a MCT policy.
2.2 Algorithms
This section presents two versions of the reallocation algorithm (Sec-tion 2.2.1) and the heuristics used in the algorithm to select jobs (Sec-tion2.2.2).
In the first version, the algorithm gets a copy of the list of jobs stored in the waiting queues of the local resources management systems on the different clusters and will try to reallocate the jobs. The second version of the algorithm cancels all the waiting jobs in all the queues and resubmits jobs in a new order.
2.2.1 Reallocation Algorithms
Algorithm1 describes the reallocation algorithm in its first version. The algorithm works as follows: it gets all jobs in the waiting queues of all clusters; it selects a job with the implemented scheduling heuristic; if it is possible to submit the job somewhere else with a better estimated completion time (ECT) of at least a minute, it cancels the job at its current location and submits it on the other cluster; finally, it starts again on the remaining jobs.
Algorithm 1 Reallocation algorithm. l⇐ waiting jobs on all clusters while l 6= ∅ do
Choose j ∈ l according to a scheduling heuristic if j.newECT + 60 < j.currentECT then
Cancel j on its current cluster Submit j to the new cluster end if
l= l \ {j} end while
To have a better idea of what is done, consider an example of two batch systems with different loads (see Figure1). At time t, task f finishes before its walltime, thus releasing resources. Task j is then scheduled earlier by the local batch scheduler. When a reallocation is triggered by the meta-scheduler at t1, it reallocates tasks h and i to the second batch system because their expected completion time is better there. To reallocate the tasks, h and i are sequentially canceled on the first batch and then submitted to the second. In this example, the two clusters are homogeneous so the tasks have the same
execution time on both clusters. In an heterogeneous context, the length of the tasks would change between the clusters. A task starting earlier on a cluster does not implies that it will also finish earlier.
c
b
a
d
e
f
j
h
i
a
d
e
t
Processors
c
b
f
j
Before reallocation
After reallocation
i
h
g
g
Processors
Cluster 1
Cluster 2
t
1time
time
time
time
Figure 1: Example of reallocation between two clusters.
Algorithm 2 is a reallocation algorithm with cancellation. It starts by canceling all jobs in the waiting queues of all clusters. Then it selects a job according to a scheduling heuristic. Finally it submits the job to the cluster giving the best estimated completion time before and starts again on each of the remaining jobs.
Algorithm 2 Reallocation algorithm with cancellation. l⇐ waiting jobs on all clusters
Cancel each job in l while l 6= ∅ do
Choose j ∈ l using a heuristic
Submit j to the cluster according to a scheduling heuristic l= l \ {j}
end while
The reallocation event in both versions of the algorithm is triggered periodically. In the experiments presented in this paper, the frequency of reallocations is set to one hour. It is rare enough not to constantly send requests to the local resources managers to obtain updates, and is often enough to improve performances (see section4.1and 4.2).
2.2.2 Scheduling Heuristics
To choose the job that will be selected for reallocation, several heuristics are used: one online heuristic and five offline heuristics. The online heuristic [21] takes jobs, one after another, while the offline heuristics are executed on a set of jobs. Offline heuristics are supposed to give better results, but their time complexity is bigger. The heuristics we compare are the following: MCT Online algorithm. Assigns a task to the cluster that gives the
mini-mum expected completion time. MCT takes jobs sequentially in their submission order.
MinMin/MaxMin Offline algorithms. Ask the expected completion time of all tasks and selects the one with the minimum/maximum value. These heuristics try to give priority to respectively small/large tasks. MaxGain Offline algorithm. It gets the minimum expected completion time of each task. Then it computes the gain of moving each task. The gain is the time in seconds that the task would gain if it is reallocated (Gain = CurrentECT − N ewECT ). The task with the highest gain is selected and the heuristic starts again on the remaining tasks. MaxRelGain Offline algorithm. Same as MaxGain, but divides the gain
by the number of processors of each task, thus preferring small tasks, except if a large task has a very large gain.
Sufferage Offline algorithm. It gets the two best estimated completion times for each task, computes the sufferage value as the difference between the two best estimated completion times and selects the task with the maximum sufferage value.
Concerning the execution time for each heuristic during the rescheduling event, MCT is the fastest. It takes the jobs in their arrival order without concern of the other jobs and it is executed n times, with n the number of waiting jobs, so its complexity is O(n). The offline heuristics on the other hand need to have information of all the jobs each time, so the execution time is O(n2).
3
Experimental framework
In this section we depict the experimental framework by presenting the ar-chitecture of the simulator we used to run our experiments (Section 3.1), the simulated platforms (Section 3.2), the jobs injected on those platforms (Section3.3) and the metrics used to compare the heuristics (Section 3.4).
3.1 Simulator
In order to simulate task reallocation in a distributed environment composed of several clusters, we use Simgrid [8], a distributed environment simulator, and Simbatch, a batch systems and parallel tasks simulator.
Simbatch [5] is a C API developed to facilitate the conception and evaluation of local resources management systems algorithms [10]. It is built on top of the Simgrid library, which provides simple network description models as well as host descriptions and is able to take into account link contentions and latencies. Simbatch can simulate the main algorithms used in batch schedulers such as First Come First Served (FCFS) and
Conservative Back-Filling (CBF). FCFS [22] gives the user the earliest slot at the end of the job queue. This algorithm is available as default policy in most batch systems such as PBS [1], Sun Grid Engine [12], Maui [14]. CBF [16] works almost like FCFS, but instead of choosing the slot at the end of the job queue, if it can find a slot earlier in the queue (back-filling) without delaying other jobs (Conservative), this slot is returned to the user. This scheduling algorithm is available in batch systems such as Maui, Loadleveler [15], and OAR [6] among others.
The simulator is divided in three main components:
The server part is running on the frontal of a cluster and interacts with the batch system. It is able to submit jobs, cancel a waiting job, return an estimation of the completion time of a job (already submitted to the batch system or not) and return the list of jobs in the waiting state.
The meta-scheduler part matches incoming jobs to a server according to a scheduling heuristic and periodically reallocates jobs in waiting time on the platform using one of the reallocation algorithms described in Section2.2.1.
The client part sends jobs to the meta-scheduler. Jobs sent by the client are parallel rigid jobs with a number of processors fixed in advance.
3.2 Platforms
We consider two platforms with different numbers of cores distributed on three sites. Each platform is used in an homogeneous case (all clusters are similar in processor speed, but not in number of processors) and in an heterogeneous case (clusters differs in terms of CPU speed and number of processors).
The first platform corresponds to the simulation of three clusters of Grid’5000[3]. The three clusters are Bordeaux, Lyon, and Toulouse. Bor-deaux is composed of 640 cores and is the slowest cluster (if clusters are
Month/Site Bordeaux Lyon Toulouse Total January 13084 583 488 14155 February 5822 2695 1123 9640 March 11673 8315 949 20937 April 33250 1330 1461 36041 May 6765 2179 1573 10517 June 4094 3540 1548 9182
Table 1: Number of jobs per month and in total for each site trace.
heterogeneous). Lyon has 270 cores and is 20% faster than Bordeaux (in the heterogeneous case). Finally, Toulouse has 434 cores and is 40% faster than Bordeaux (still in the heterogeneous case).
The second platform corresponds to experiments mixing the trace of Bor-deaux from Grid’5000 and two traces from the Parallel Workload Archive1.
The three clusters are Bordeaux, CTC, and SDSC. Bordeaux has 640 cores and is the slowest cluster. CTC has 430 cores and is 20% faster than Bor-deaux. Finally, SDSC has 128 cores and is 40% faster than BorBor-deaux.
3.3 Scenarios
We consider seven scenarios among which six scenarios use the traces of tasks submission on a one month long period, and taken from the Grid’5000 platform. Traces contain the jobs of the first six months of 2008. Table 1
gives the number of jobs per month on each cluster. The seventh scenario is a six month long simulation using two traces from the parallel workload archive (CTC and SDSC) and the trace of Bordeaux on Grid’5000. The trace from Bordeaux contains 74647 jobs. The trace from CTC has 42873 jobs. The trace from SDSC contains 15615 jobs. Thus, the total number of jobs of the seventh scenario is 133135.
In our simulations, we consider that all jobs are submissions. Traces from Grid’5000 include advance reservations but we consider them as nor-mal submissions. It should not change the results because we compare sim-ulations with other simsim-ulations. Furthermore, note that we add a meta-scheduler to map the jobs onto clusters at submission time, as if a grid middleware is used. In reality, users submit where they want (usually they submit to the site closest to them).
The traces taken from the Parallel Workload Archive were taken in their standard original format, i.e., they also contain “bad” jobs [11]: Since we want to reproduce the execution of jobs on a cluster, we need to keep all the “bad” jobs removed in the clean version of the logs because these jobs would
have been submitted in reality.
3.4 Evaluation metrics
In order to evaluate the reallocation algorithm and the behavior of the scheduling heuristics, we use different metrics. The first type of metrics is system centered metrics. The second type is user centered metrics.
System metrics
Jobs impacted by reallocation: The percentage of jobs whose completion time is changed compared to an execution without reallocations. Only the jobs whose completion time changes are interesting in our study. Note that we use a time reference in this study to order performance of heuristics, but results on this metric are not transitive.
Number of reallocations: Number of times jobs were moved. A job can be counted several times if it was migrated several times. A small value is better because it means that there will be less transfers.
User metrics
Jobs finishing earlier: Percentage of jobs that finished earlier with reallocation than without. This percentage is taken only from the jobs whose completion time changed with reallocation. A value higher that 50% means that there were more jobs early than late. Gain on average job response time: Gain on average response time of the jobs compared to the scenario without reallocation. The response time corresponds to the time spent in the system from the submission to the completion [9]. The gain is computed only for the jobs whose completion time changed. This is the most important value for users because they generally want their jobs to finish as soon as possible.
Figure2illustrates why there are jobs delayed and others finishing earlier onto a platform composed of two clusters. At time 0 a reallocation event is triggered. A task is reallocated from cluster 1 to cluster 2. Thus, some tasks of cluster 2 are advanced in the schedule. On cluster 1, the task is back-filled. However, assume the task finishing at time 6 finishes at time 2 because the walltime was wrongly defined (see the task with the dashed line). Thus, because of the newly inserted task, the large task on cluster 1 is delayed (and all the tasks after if there are some).
With FCFS, reallocation can also cause delay: if a job is sent to a cluster, all the jobs submitted after may be delayed. Inversely, the job that was reallocated to another cluster now leaves some free space and it may be used by other jobs to diminish their completion time.
00000000 00000000 00000000 11111111 11111111 11111111 00 00 00 00 00 00 11 11 11 11 11 11 000000 000000 000000 111111 111111 111111 000 000 111 111 0000 0000 0000 0000 0000 1111 1111 1111 1111 1111 00000 00000 00000 11111 11111 11111 000 000 000 111 111 111 000000 111111 00 00 00 00 11 11 11 11 000 000 000 111 111 111
Processors
Time
0
2
4
6
8
Processors
Figure 2: Side effects of a reallocation.
4
Results
In this section, we study the two versions of the reallocation algorithm onto several scenarios: homogeneous or heterogeneous platforms; using FCFS or CBF as local resource manager; using different sets of jobs traces; meta-heuristic implemented as a reallocation scheduling policy. For a single exper-iment, each cluster uses the same batch algorithm. Thus, we have performed a total of 364 experiments among which 28 experiments without realloca-tion (one for each job trace, heterogeneity and batch algorithm) as reference experiments, against which we compare our solutions.
First, we evaluate the reallocation algorithm without canceling the jobs in Section 4.1 and then, in Section 4.2, we present the results on the algo-rithm with cancellation. Finally, we compare our results two versions in the algorithm in Section 4.3.
4.1 Results without Cancellation
This section presents the results obtained for the different metrics for the reallocation without cancellation of jobs (see Algorithm1). The reallocation algorithm was triggered every hour starting one hour after the first job submission.
Table2shows the percentage of jobs whose completion time changed on homogeneous platforms when reallocation was performed. The percentage is quite low because quite a large amount of jobs are able to start execution as soon as they are submitted. This percentage is higher on platforms using FCFS. Indeed, jobs are not back-filled, thus waiting queues are longer, and thus more jobs can be delayed and reallocated. The percentage of jobs impacted when reallocation is performed mainly depends on the submissions. If the platform is quite empty, submitted jobs will start execution as soon
Batch Heuristic jan feb mar apr may jun pwa-g5k AVG FCFS Mct 3.75 13.49 21.95 36.58 23.81 24.87 17.07 20.22 MinMin 3.76 12.87 21.55 35.80 24.09 28.08 16.78 20.42 MaxMin 3.89 13.13 21.75 36.17 24.21 26.91 17.19 20.46 MaxGain 3.59 13.32 16.99 35.55 24.13 27.75 16.97 19.76 MaxRelGain 3.30 13.24 17.66 36.36 24.19 26.90 16.82 19.78 Sufferage 3.69 13.16 21.92 36.10 22.80 26.71 17.02 20.20 CBF Mct 3.55 11.15 17.65 22.90 16.75 18.23 11.16 14.48 MinMin 3.54 11.31 17.67 21.37 16.42 17.84 11.22 14.20 MaxMin 3.75 11.51 17.72 22.54 16.00 19.38 11.15 14.58 MaxGain 3.40 11.21 14.26 20.64 16.30 17.71 11.25 13.54 MaxRelGain 3.10 11.29 14.35 22.36 16.53 17.16 11.11 13.70 Sufferage 3.55 11.36 17.70 23.19 16.83 18.25 11.10 14.57
Table 2: Percentage of jobs that have their completion time changed when reallocation is performed on homogeneous platforms.
Batch Heuristic jan feb mar apr may jun pwa-g5k AVG
FCFS Mct 10.46 11.54 19.68 16.98 16.16 22.54 29.23 18.08 MinMin 10.24 11.37 19.72 18.22 15.69 21.99 29.67 18.13 MaxMin 10.08 11.38 19.64 16.92 15.42 24.08 27.96 17.93 MaxGain 10.41 11.42 19.80 18.25 16.64 24.20 29.98 18.67 MaxRelGain 10.42 11.41 19.76 18.52 16.62 22.03 30.40 18.45 Sufferage 10.12 11.61 19.66 18.38 15.83 23.89 29.28 18.40 CBF Mct 8.55 3.68 20.40 13.52 17.27 19.98 28.52 15.99 MinMin 8.36 3.55 20.46 12.79 17.12 20.01 29.34 15.95 MaxMin 8.10 3.38 20.61 13.91 17.05 21.93 28.08 16.15 MaxGain 8.46 3.41 20.70 13.77 18.50 22.59 29.04 16.64 MaxRelGain 8.46 3.55 20.69 14.03 18.30 22.04 29.08 16.59 Sufferage 8.11 3.59 20.58 12.84 17.51 19.84 28.64 15.87
Table 3: Percentage of jobs that have their completion time changed when reallocation is performed on heterogeneous platforms.
as they are submitted so reallocation will not take them into account. On the other hand, when the platform is very loaded, most jobs will not have the opportunity to be reallocated because it would not be possible for them to finish earlier, thus reallocation will also not take them into account.
Table3shows the percentage of jobs whose completion time changed on heterogeneous platforms when reallocation was performed. In the heteroge-neous case, there are sometimes more jobs whose completion time changed with CBF than with FCFS. This percentage is still quite low because it depends partly on the submissions of the jobs. During low load, jobs start execution as soon as they are submitted. When the platform is very loaded, waiting queues are long and jobs have less chance to be reallocated because they would be submitted at the end of other queues.
Batch Heuristic jan feb mar apr may jun pwa-g5k FCFS Mct 237 132 782 3007 498 512 3734 MinMin 238 89 830 4882 687 612 4574 MaxMin 213 87 420 2599 423 430 3482 MaxGain 224 89 598 3393 666 541 3775 MaxRelGain 239 86 948 3300 714 613 4489 Sufferage 233 85 617 3052 504 498 3732 CBF Mct 197 43 432 937 299 527 1601 MinMin 199 47 433 774 363 422 1738 MaxMin 193 60 440 631 294 451 1575 MaxGain 199 54 382 779 326 364 1733 MaxRelGain 209 51 416 878 340 383 1726 Sufferage 192 45 433 798 307 464 1595
Table 4: Number of reallocations on homogeneous platforms.
Batch Heuristic jan feb mar apr may jun pwa-g5k
FCFS Mct 195 18 294 1011 234 293 2026 MinMin 150 23 272 1171 441 315 2927 MaxMin 150 14 271 702 213 242 1929 MaxGain 140 20 224 934 367 222 2224 MaxRelGain 139 23 283 1072 678 274 2521 Sufferage 148 25 237 957 383 278 2098 CBF Mct 194 8 47 266 235 191 1180 MinMin 148 7 52 298 177 210 1335 MaxMin 148 3 46 246 233 216 1217 MaxGain 151 3 64 304 228 208 1281 MaxRelGain 150 8 77 271 199 238 1375 Sufferage 147 8 57 199 200 238 1150
Table 5: Number of reallocations on heterogeneous platforms.
Tables 4 and 5 show the number of reallocations per experiment on homogeneous and heterogeneous platforms respectively. Note that a same job can be reallocated several times. In all cases, the number of reallocation is small relative to the number of tasks of each experiment. On average, the number of reallocations corresponds to 2.3% and the maximum value is 13.5%. The small number of reallocation implies that there would not be too many reallocations of jobs between clusters thus not overloading the network.
Tables 6 and 7show the percentage of jobs finishing earlier with reallo-cation than without realloreallo-cation. This percentage only takes into account the jobs whose completion times changed (cf. Tables2and3). Thus, a value higher than 50 means that there are more than half of the jobs that finish earlier with reallocation than without.
Table 6 shows the percentage of jobs finishing earlier with reallocation than without on homogeneous platforms. In most cases there are more jobs finishing earlier than later. The different heuristics behave differently
Batch Heuristic jan feb mar apr may jun pwa-g5k AVG FCFS Mct 83.80 51.23 62.60 46.67 46.57 60.03 58.13 58.43 MinMin 82.52 61.69 64.16 50.47 51.60 49.50 60.30 60.03 MaxMin 84.03 60.79 55.51 46.80 45.94 53.50 57.70 57.75 MaxGain 82.48 71.81 44.25 45.38 42.24 47.45 58.55 56.02 MaxRelGain 81.80 73.12 57.52 46.23 46.11 54.09 58.98 59.69 Sufferage 82.18 62.30 54.23 42.98 48.29 51.37 59.85 57.31 CBF Mct 76.10 72.74 68.04 52.26 52.89 59.44 48.83 61.47 MinMin 75.10 55.32 68.18 55.19 57.50 68.19 47.58 61.01 MaxMin 76.79 72.52 63.75 56.48 58.88 54.13 49.76 61.76 MaxGain 74.43 55.69 62.49 50.21 57.88 58.86 47.36 58.13 MaxRelGain 72.67 56.34 60.35 49.34 58.63 60.60 48.80 58.10 Sufferage 74.90 71.69 68.20 43.12 61.69 61.69 48.00 61.33
Table 6: Percentage of jobs finishing earlier when reallocation is performed on homogeneous platforms.
depending on the trace. For example, MinMin is the only heuristic that gives more jobs early in April with FCFS but is one of the two heuristics that have more jobs late in June. On average, MinMin gives the bests results for FCFS by a few percents. On CBF platforms, heuristics based on the gain are usually less good than the other heuristics. The other heuristics give similar results on average. MinMin differentiates itself from the other with worse results in February, but better results in June.
Table 7 shows the percentage of jobs finishing earlier with reallocation than without on heterogeneous platforms. In this case, MinMin is the best on average in both FCFS and CBF platforms, and except in the case (homo-geneous/apr) where all reallocation policies give worst results on this metric, reallocation with the MinMin heuristic always improves the final schedule. There are more cases where there are more jobs late than early with CBF than with FCFS. We can see the impact of the batch algorithm on the re-allocation results. Indeed, on FCFS platforms, all results are negative for April while they are all positive with CBF. We can see the opposite behavior in February or May.
The relative average response time is compared with no reallocation for the jobs whose completion time changed. A value of 0.85 means that the reallocation provided a gain of 15% on the average response time of the jobs. A value higher than 1 means that the average response time is bigger than without reallocation.
Table 8 shows the relative average response time of the heuristics on homogeneous platforms. In the FCFS setup, MinMin gives the best results. It is the only heuristic than never has a higher average response time than the experiments without reallocation, with a peak performance of 23% for (FCFS/jan), achieving to beat MaxGain and MaxRelGain which are a priori specifically designed for this metric. With CBF, the difference between
Batch Heuristic jan feb mar apr may jun pwa-g5k AVG FCFS Mct 62.16 65.86 60.96 42.94 54.33 59.13 52.44 56.83 MinMin 61.24 63.50 60.60 47.37 62.73 59.58 51.38 58.06 MaxMin 61.11 65.72 61.10 41.73 51.17 57.53 52.87 55.89 MaxGain 59.09 65.58 61.46 38.74 59.60 60.17 49.03 56.24 MaxRelGain 59.12 62.00 61.24 43.84 59.73 66.49 52.06 57.78 Sufferage 61.27 61.22 61.47 42.50 58.44 53.58 49.43 55.42 CBF Mct 63.47 47.89 50.29 56.37 49.04 54.96 55.40 53.92 MinMin 62.42 61.11 50.40 59.34 50.28 55.77 53.62 56.13 MaxMin 62.95 48.16 50.06 57.38 49.50 51.07 54.24 53.34 MaxGain 60.15 48.33 49.76 61.97 51.08 48.51 53.85 53.38 MaxRelGain 60.07 46.20 49.77 62.86 48.86 51.04 53.61 53.20 Sufferage 63.15 46.82 49.86 59.52 48.32 57.77 54.68 54.30
Table 7: Percentage of jobs finishing earlier when reallocation is performed on heterogeneous platforms.
Batch Heuristic jan feb mar apr may jun pwa-g5k AVG
FCFS Mct 0.82 1.07 1.08 1.25 0.92 0.97 0.81 0.99 MinMin 0.77 0.97 0.99 0.98 0.88 1.00 0.75 0.90 MaxMin 0.83 0.97 1.05 1.10 0.92 0.98 0.80 0.95 MaxGain 0.75 1.00 1.00 1.26 0.97 1.00 0.75 0.96 MaxRelGain 0.73 0.98 1.02 1.22 0.93 0.97 0.74 0.94 Sufferage 0.81 0.96 1.05 1.34 0.91 1.00 0.76 0.98 CBF Mct 0.80 1.00 1.05 0.94 0.89 0.94 0.99 0.94 MinMin 0.80 0.99 1.04 0.85 0.86 0.93 1.02 0.93 MaxMin 0.80 1.00 1.03 0.93 0.84 0.94 1.00 0.94 MaxGain 0.77 1.00 1.01 1.01 0.89 0.95 0.99 0.95 MaxRelGain 0.75 1.00 1.04 1.09 0.88 0.95 0.97 0.95 Sufferage 0.80 1.01 1.02 1.03 0.83 0.95 1.03 0.95
Table 8: Relative average response time on homogeneous platforms.
heuristics is smaller but MinMin still have the best average on the seven experiments by one percent. MCT is the second best in average for CBF platforms, while it was the worst with FCFS.
Table9shows the relative average response time of the heuristics on het-erogeneous platforms. Here, MCT has the best average in both the FCFS and CBF setups. These good results come from one experiment (January) where in both cases MCT improves a lot the average response time while other heuristics give less satisfactory results. Without this experiment, MCT would give results close to the other heuristics on average. On FCFS plat-forms, MinMin and MaxRelGain perform well and are better than the other heuristics on average, excluding MCT. On CBF platforms, all heuristics are close and none has a big advantage on the others. Still, MCT has a 3% advantage on the second best and can improve the relative average response time by 12% on average.
Batch Heuristic jan feb mar apr may jun pwa-g5k AVG FCFS Mct 0.65 1.08 0.74 0.98 0.97 0.94 0.92 0.90 MinMin 0.98 1.17 0.77 0.93 0.86 0.93 0.92 0.94 MaxMin 0.99 1.11 0.73 1.20 1.00 0.94 0.95 0.99 MaxGain 0.93 1.10 0.73 1.30 0.93 0.93 0.94 0.98 MaxRelGain 0.93 1.15 0.75 0.97 0.91 0.89 0.92 0.93 Sufferage 0.98 1.19 0.74 1.11 0.94 0.97 0.96 0.98 CBF Mct 0.66 0.94 0.71 0.85 1.11 0.94 0.96 0.88 MinMin 1.00 0.94 0.71 0.83 1.06 0.96 0.95 0.92 MaxMin 1.00 0.88 0.72 0.91 1.05 0.96 0.96 0.93 MaxGain 1.00 0.88 0.72 0.83 1.03 0.97 0.96 0.91 MaxRelGain 1.00 0.95 0.72 0.90 1.06 0.95 0.96 0.93 Sufferage 1.00 0.95 0.72 0.85 1.05 0.91 0.95 0.92
Table 9: Relative average response time on heterogeneous platforms. The previous tables (8and9) show that to diminish the average response time of jobs, the choice of the heuristic can not really be made based on the results since they are too close. Then, the heuristic of choice would be MCT because of its simplicity of implementation compared to the others. Furthermore, average results of MCT on heterogeneous platforms with CBF (which seem to be the most realistic platforms) are quite good, so this choice seems the best. It is possible to implement MinMin which usually gives better results but it will make more requests to obtain estimations of the completion time of jobs.
4.2 Results with Cancellation
This section presents the results obtained on the different metrics for the reallocation algorithm with cancellation (see Algorithm 2), thus heuristics are postfixed with “-C” in tables presenting the results. As for the previous version of the algorithm, the reallocation is triggered every hour.
Tables 10 and 11 show the percentage of jobs whose completion time changed on homogeneous and heterogeneous platforms when reallocation with cancellation is performed. The percentage depends on the trace used and usually is between 10% and 30%. On both homogeneous and heteroge-neous platforms, there are more jobs whose completion time changed with reallocation with FCFS than with CBF. CBF is able to execute the jobs faster thanks to back-filling, so the waiting queues are smaller.
Table 12 and 13 show the number of reallocations per experiment on homogeneous and heterogeneous platforms. To count the number of real-locations, we save the location of a job and if it is submitted on another cluster, we counts this as a reallocation. The number of reallocations is small compared to the number of jobs per experiment. On average, the number of reallocations corresponds to 5.8% and the maximum is 28.8%. There are more reallocations on FCFS platforms. It is for the same reason
Batch Heuristic jan feb mar apr may jun pwa-g5k AVG FCFS Mct-C 11.36 24.53 23.02 36.36 24.68 29.46 19.43 24.12 MinMin-C 11.36 13.40 22.82 31.51 24.60 29.35 19.60 21.81 MaxMin-C 11.58 17.63 22.87 35.37 26.12 29.95 20.64 23.45 MaxGain-C 11.82 14.13 23.36 32.41 24.21 29.19 19.54 22.09 MaxRelGain-C 11.83 13.75 22.90 31.83 25.84 29.68 19.42 22.18 Sufferage-C 11.37 13.07 22.95 33.76 24.91 29.45 19.36 22.12 CBF Mct-C 10.99 10.90 10.22 22.83 16.95 21.05 12.66 15.09 MinMin-C 11.00 12.77 17.50 22.35 17.76 21.28 12.63 16.47 MaxMin-C 11.18 10.91 10.29 21.96 18.14 20.92 12.32 15.10 MaxGain-C 11.23 10.87 17.49 21.60 18.87 21.04 11.21 16.04 MaxRelGain-C 11.24 11.03 17.66 21.81 18.50 20.62 11.17 16.00 Sufferage-C 11.14 10.87 10.11 23.00 17.75 21.08 12.47 15.20
Table 10: Percentage of jobs that have their completion time changed when reallocation is performed on homogeneous platforms.
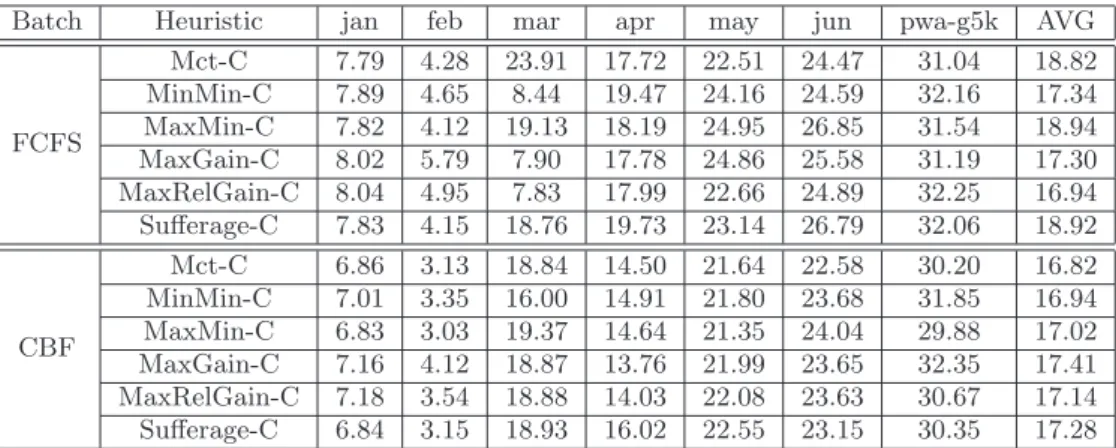
Batch Heuristic jan feb mar apr may jun pwa-g5k AVG
FCFS Mct-C 7.79 4.28 23.91 17.72 22.51 24.47 31.04 18.82 MinMin-C 7.89 4.65 8.44 19.47 24.16 24.59 32.16 17.34 MaxMin-C 7.82 4.12 19.13 18.19 24.95 26.85 31.54 18.94 MaxGain-C 8.02 5.79 7.90 17.78 24.86 25.58 31.19 17.30 MaxRelGain-C 8.04 4.95 7.83 17.99 22.66 24.89 32.25 16.94 Sufferage-C 7.83 4.15 18.76 19.73 23.14 26.79 32.06 18.92 CBF Mct-C 6.86 3.13 18.84 14.50 21.64 22.58 30.20 16.82 MinMin-C 7.01 3.35 16.00 14.91 21.80 23.68 31.85 16.94 MaxMin-C 6.83 3.03 19.37 14.64 21.35 24.04 29.88 17.02 MaxGain-C 7.16 4.12 18.87 13.76 21.99 23.65 32.35 17.41 MaxRelGain-C 7.18 3.54 18.88 14.03 22.08 23.63 30.67 17.14 Sufferage-C 6.84 3.15 18.93 16.02 22.55 23.15 30.35 17.28
Table 11: Percentage of jobs that have their completion time changed when reallocation is performed on heterogeneous platforms.
Batch Heuristic jan feb mar apr may jun pwa-g5k FCFS Mct-C 363 838 1432 6930 1573 2460 8317 MinMin-C 384 327 1411 3311 1563 2228 7791 MaxMin-C 410 1206 1466 8199 1441 2562 11821 MaxGain-C 585 365 1678 5495 1523 2653 9038 MaxRelGain-C 597 307 1476 6651 1463 2570 9881 Sufferage-C 474 362 1501 7318 1414 2542 8088 CBF Mct-C 364 149 773 2486 594 1686 3299 MinMin-C 389 186 758 2112 693 1353 2899 MaxMin-C 424 182 714 1596 619 1091 3168 MaxGain-C 581 180 835 1651 705 1298 3851 MaxRelGain-C 578 180 807 2272 834 1361 3738 Sufferage-C 413 172 568 2231 706 1174 3454
Table 12: Number of reallocations on homogeneous platforms.
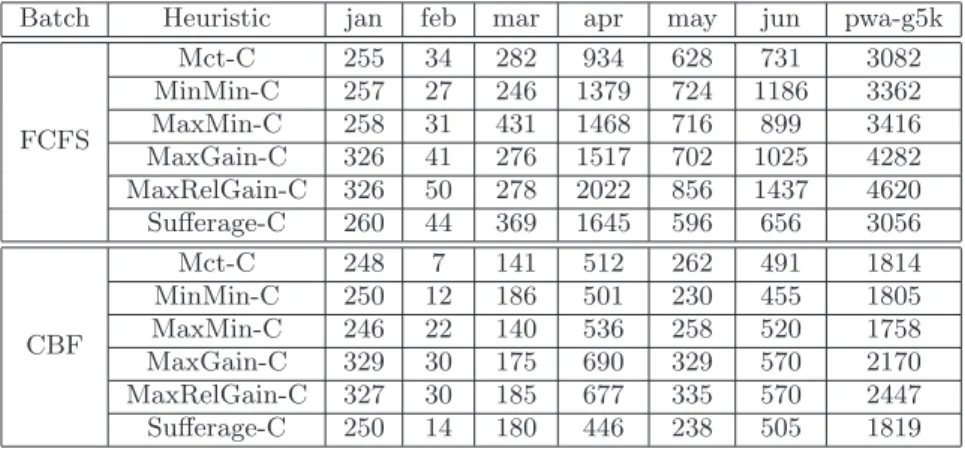
Batch Heuristic jan feb mar apr may jun pwa-g5k
FCFS Mct-C 255 34 282 934 628 731 3082 MinMin-C 257 27 246 1379 724 1186 3362 MaxMin-C 258 31 431 1468 716 899 3416 MaxGain-C 326 41 276 1517 702 1025 4282 MaxRelGain-C 326 50 278 2022 856 1437 4620 Sufferage-C 260 44 369 1645 596 656 3056 CBF Mct-C 248 7 141 512 262 491 1814 MinMin-C 250 12 186 501 230 455 1805 MaxMin-C 246 22 140 536 258 520 1758 MaxGain-C 329 30 175 690 329 570 2170 MaxRelGain-C 327 30 185 677 335 570 2447 Sufferage-C 250 14 180 446 238 505 1819
Table 13: Number of reallocations on heterogeneous platforms.
that more jobs had a different completion time with FCFS than CBF. CBF executes jobs more quickly so the waiting queues are smaller.
Table14 shows the percentage of jobs finishing earlier with reallocation than without on homogeneous platforms. The percentage of jobs finishing earlier with reallocation than without is most of the time higher than 60%. There is only one case where there are more jobs late than early, thus to the user point of view, more of his jobs finish sooner using reallocation. The results with FCFS give MinMin and MaxGains heuristics as winners. On CBF platforms, results are closer, but MinMin becomes the second worst heuristic on average.
Table15 shows the percentage of jobs finishing earlier with reallocation than without on heterogeneous platforms. There are a few cases where more jobs are late than early, but on the average all heuristics give positive results, with around 10% finishing sooner when reallocation with cancellation. MCT is the heuristic that produces the less jobs early on average. The other heuristics give results close to one another.
Batch Heuristic jan feb mar apr may jun pwa-g5k AVG FCFS Mct-C 62.40 29.73 63.51 67.30 68.22 69.65 67.46 61.18 MinMin-C 63.18 62.07 64.09 89.85 73.91 74.99 70.11 71.17 MaxMin-C 61.99 52.41 63.28 68.65 65.89 66.91 60.62 62.82 MaxGain-C 63.90 60.87 63.40 80.09 75.69 73.54 72.76 70.04 MaxRelGain-C 63.82 80.68 59.16 83.08 73.43 71.52 69.56 71.61 Sufferage-C 62.52 55.71 62.09 70.73 67.25 67.34 68.45 64.87 CBF Mct-C 61.70 74.22 66.50 51.24 67.02 67.36 52.06 62.87 MinMin-C 62.81 62.55 60.96 55.06 64.70 70.83 56.70 61.94 MaxMin-C 61.15 78.90 55.57 64.84 66.65 71.42 58.51 65.29 MaxGain-C 61.01 62.40 61.31 67.68 66.94 69.10 59.03 63.92 MaxRelGain-C 61.12 73.28 55.77 58.79 59.71 71.28 59.91 62.84 Sufferage-C 61.76 74.52 56.09 54.60 58.01 69.21 55.10 61.33
Table 14: Percentage of jobs finishing earlier when reallocation is performed on homogeneous platforms.
Batch Heuristic jan feb mar apr may jun pwa-g5k AVG
FCFS Mct-C 53.94 41.89 55.12 47.08 49.45 71.12 54.95 53.36 MinMin-C 54.12 52.68 64.84 47.15 55.18 70.95 56.47 57.34 MaxMin-C 53.97 60.45 70.68 45.52 48.78 65.60 55.27 57.18 MaxGain-C 57.13 40.25 68.62 54.84 56.89 63.37 57.78 56.98 MaxRelGain-C 57.21 42.56 69.51 52.75 57.20 69.82 56.62 57.95 Sufferage-C 54.06 47.00 71.79 50.13 60.60 67.85 54.98 58.06 CBF Mct-C 50.46 59.47 67.61 45.58 51.01 70.06 52.18 56.62 MinMin-C 50.35 64.40 63.62 55.94 60.05 71.02 53.53 59.84 MaxMin-C 50.57 68.26 66.86 49.99 49.76 65.43 55.30 58.02 MaxGain-C 52.81 66.25 67.82 52.98 54.17 69.38 54.67 59.73 MaxRelGain-C 52.66 63.64 67.79 53.22 57.06 70.12 54.32 59.83 Sufferage-C 50.72 67.66 67.71 51.94 49.54 68.94 55.87 58.91
Table 15: Percentage of jobs finishing earlier when reallocation is performed on heterogeneous platforms.
Batch Heuristic jan feb mar apr may jun pwa-g5k AVG FCFS Mct-C 0.84 1.37 0.60 0.48 0.73 0.73 0.59 0.76 MinMin-C 0.83 0.71 0.57 0.26 0.69 0.68 0.52 0.61 MaxMin-C 0.86 1.57 0.62 0.50 0.75 0.75 0.70 0.82 MaxGain-C 0.86 0.79 0.59 0.35 0.66 0.71 0.55 0.64 MaxRelGain-C 0.87 0.75 0.58 0.37 0.65 0.68 0.54 0.63 Sufferage-C 0.89 0.84 0.62 0.49 0.70 0.77 0.57 0.70 CBF Mct-C 0.88 0.88 0.85 0.91 0.77 0.82 0.90 0.86 MinMin-C 0.88 1.02 0.84 0.78 0.81 0.75 0.85 0.85 MaxMin-C 0.91 0.92 0.95 0.70 0.79 0.69 0.86 0.83 MaxGain-C 0.90 0.89 0.89 0.66 0.78 0.73 0.86 0.82 MaxRelGain-C 0.90 0.89 0.89 0.74 0.85 0.73 0.86 0.84 Sufferage-C 0.90 0.90 0.92 0.81 0.84 0.73 0.88 0.86
Table 16: Relative average response time on homogeneous platforms. Table 16 shows the relative average response time of the heuristics on homogeneous platforms. On FCFS platforms, in the best case, the average response time of the jobs can be divided by a factor of 4 (MinMin-C in April). The MinMin heuristic gives always a gain of at least 17% and is the best in all but one experiment. There are only two cases where reallocation increased the average response time: in February with MCT and MaxMin. MCT being slower is in concordance with its results from the percentage of jobs finishing early. 59% of the jobs were late, so it seems normal that the relative average response time is higher. To have a gain the jobs early should have a huge gain to compensate, which was not the case. However, MaxMin had more jobs early than late, so it means that the jobs that were delayed were delayed for a long time.
On CBF homogeneous platforms, there is only one case where the real-location worsens the average response time, but only by 2%. In the other cases, reallocation usually brings an improvement of more than 10%. All heuristics give close results with CBF with a small advantage for MaxGain. Table 17 shows the relative average response time of the heuristics on heterogeneous platforms. In all experiments, there are only two cases with an increase of the average response time. When using FCFS, MinMin gives the best results and MaxMin the worst. On CBF heterogeneous platforms, all heuristics give similar results on average, with a difference between the best and the worse of less than 2%. There is no experiment with CBF were reallocation gave worse results than the experiment without reallocation. The gain is always at least 4%.
Finally, we can conclude that MCT or MinMin should be the heuristics to implement in a middleware able to perform reallocation with cancellation. Indeed, MCT is not the best one, but it gives satisfactory results for a better time complexity. The only setup where it should not be used (given the results of the experiments) is on an homogeneous platform with FCFS batch managers. In the most realistic platform (heterogeneous and CBF) it
Batch Heuristic jan feb mar apr may jun pwa-g5k AVG FCFS Mct-C 0.56 1.04 0.63 0.52 0.93 0.81 0.84 0.76 MinMin-C 0.57 0.94 0.62 0.46 0.88 0.76 0.81 0.72 MaxMin-C 0.57 0.94 0.68 0.67 1.01 0.83 0.84 0.79 MaxGain-C 0.57 0.96 0.63 0.46 0.89 0.85 0.84 0.74 MaxRelGain-C 0.57 0.96 0.64 0.48 0.91 0.78 0.84 0.74 Sufferage-C 0.57 0.98 0.68 0.54 0.82 0.80 0.83 0.75 CBF Mct-C 0.57 0.93 0.75 0.90 0.92 0.84 0.96 0.84 MinMin-C 0.57 0.92 0.77 0.82 0.88 0.83 0.94 0.82 MaxMin-C 0.57 0.93 0.77 0.90 0.92 0.84 0.94 0.84 MaxGain-C 0.58 0.95 0.75 0.87 0.93 0.86 0.94 0.84 MaxRelGain-C 0.57 0.95 0.75 0.86 0.93 0.83 0.95 0.83 Sufferage-C 0.57 0.91 0.76 0.82 0.91 0.85 0.94 0.82
Table 17: Relative average response time on heterogeneous platforms. gives good results (all heuristics do). MinMin seems to be the best heuristic, but only by a small improvement over the other heuristics.
4.3 Comparison
In this section, we give some points of comparison between the two versions of the reallocation algorithm: without and with cancellation of the jobs in the batch waiting queues (see Algorithms 1and 2).
Concerning the percentage of jobs whose completion time changed on ho-mogeneous platforms, there are more jobs concerned with cancellation (see Tables2and10). With both batch algorithms there are almost always more jobs concerned with reallocation when there is cancellation. In some cases, January for example, there are 8% more jobs concerned when canceling. In other cases, April for example, there are less than 1% more jobs concerned. In February with CBF, there are more jobs concerned by reallocation with-out cancellation. On heterogeneous platforms with CBF, the percentage of jobs whose completion time changed with reallocation is a little higher on average with cancellation than without (see Tables3and11). This behavior is not always true, for example in January. With FCFS there are less jobs on average whose completion time changed with cancellation.
On both homogeneous and heterogeneous platforms, the number of re-allocations is higher when cancellations are involved (see Tables 4, 5, 12, and13). With cancellations, all waiting queues are reduced to the currently running jobs only and when resubmitting, most jobs can migrate. Without cancellation, the waiting queues stay full so chances for a job to be reallo-cated are smaller. Reallocating without canceling induces less migrations.
The percentage of jobs early on an homogeneous platform using FCFS is higher with cancellations (see Tables 6 and 14). When there are more jobs late than early without cancellation, adding the cancellation correct this bad behavior and the results obtained are better. However, MCT in
February gives really worse results with cancellation so cancellation can degrade performances. With CBF, the results are mostly a little better with cancellation. When there are more jobs finishing late than early, cancellation reverses the results. For example, for the six months experiments where all heuristics gave negative results we can see an improvement of nearly 10%. On the average, the cancellation always improves the results by a few percents.
On heterogeneous platforms, results (given in Tables 7 and 15) are dif-ferent than on homogeneous platforms. First, with FCFS, the results are often in favor of the reallocation without cancellation. There is only a big improvement for reallocation with canceling in June. For the 6-month ex-periment, results are a little better with cancellation, but only by a few percents. On the average, results are mixed. Sometimes the cancellation improves the number of jobs early, other times, it degrades it. With CBF, the cancellation improves the results on average. If we consider each exper-iment separately, we can see a clear improvement in the number of cases where reallocation brings a gain on the number of jobs completed earlier.
On the average, job response time on homogeneous platforms (see Ta-bles 8 and 16), cancellation brings a large improvement over the algorithm without cancellation. With FCFS without cancellation, the maximum av-erage gain is for MinMin with a gain of 10%. The maximum gain with cancellation is still MinMin but it brings an improvement of nearly 40%. The worst heuristic on the average with cancellation is MaxMin, but it is still better than the best heuristic without cancellation. There are only a few cases where the reallocation without cancellation is better, all of them in January or February. In the CBF setup, there is still the same comparison (worst with cancellation better than best without cancellation), but with less difference. On homogeneous platforms, it is clearly beneficial to cancel and resubmit the jobs.
Concerning heterogeneous platforms (see Tables 9 and 17), the average job response time is also improved with cancellation. With FCFS, there is just one case where the cancellation worsened the result (in May with MaxMin). In all the other cases it is better with cancellation. With CBF, there are several cases where cancellation worsens the average response time of the jobs by a few percents. They all occur in February, March or April. On average, cancellation improves the results between 4 and 10%.
We can conclude that in the different cases studied here, cancellation usually brings improvement over the first version of the reallocation algo-rithm. The drawback of canceling jobs and resubmitting them is that there are more reallocations, thus batch systems are issuing more requests (sub-missions as well as cancellations). Another drawback of the canceling version of the algorithm is that it can produce starvation. It is possible for a job to be canceled each time and resubmitted after new jobs. Starvation never
occurred in the simulations because there are phases of low load so waiting queues can be entirely executed.
The reallocation can be used to improve the average response time of the jobs with a small number of reallocations. Consequently, it should be considered in Grids to improve performance.
5
Related work
In [19] Sonmez et al. concentrate their study on the scheduling of parallel jobs onto several heterogeneous multi-site environment, where each site has an homogeneous cluster of processors. They use a meta-scheduler to select a cluster where to submit a job choosing the less loaded one. In order to take advantage of the different sites, the heuristic is modified to use multiple submissions on all or a subset of the sites to minimize the response time. When a task starts, it is canceled on the other site. Then, they compare different resources management algorithms and find that the conservative back-filling strategy is superior to the aggressive back-filling. In our work, we use the reallocation to try to minimize the response time while they rely on multiple submissions. Another difference is that our meta-scheduler chooses the site with the minimum expected completion time while theirs use the site with the less instantaneous load.
Netto and Buyya [18] study the rescheduling of co-allocated tasks on several sites. They use flexible advance reservations to obtain the proper synchronization between sites. The flexibility of the reservations provides the ability to change the processors mapping of the reservations (to regroup a reservation on a single site) and the start time (if all needed resources are available earlier than expected). In our work, there is no advance reservation and tasks have to be on a single site. Once a task has been submitted, the only possible action being the task cancellation in order to resubmit it on another site.
In [13], Guim and Corbal´an present a detailed study of different meta-scheduling policies. The different policies include the Less-JobWaitTime, the Less-JobsInQueue, the Less-WotkLeft and Less-SubmittedJobs. Each task uses its own scheduler to be mapped on a parallel resource. Once submitted, the task is managed by the local scheduler and is never reallocated. The local policies are Shortest Job First and FCFS. In our work, we use the same two level architecture: a global scheduler and a local one, but our global scheduler is centralized and it adapts to the current platform load and can reschedule and decide to migrate tasks. Furthermore, local policies in our work are FCFS and CBF.
In [24], each cluster sends a snapshot of its state to a central scheduler. This data exchange is done at fixed intervals. Then the central scheduler chooses jobs in round robin or fixed order and tries to back-fill jobs in queues
of other clusters. In this approach, computation done by the central sched-uler is enormous since it needs the Gantt chart of all sites and it make all the computations itself. All the clusters are homogeneous in power and size. In our work, the central scheduler just asks the local scheduler when a task would complete, but it does not perform complex computations. Our al-gorithm without canceling is close to theirs in the sense that we verify if a job can be moved to another cluster to finish earlier, but we use different heuristics to select the jobs. The study we presented in our paper also takes into account the heterogeneity between the sites.
Sonmez et al. [23] present a method to diminish the errors made during a jobs burst in a multi-cluster environment. The method used consists in submitting the same job to several clusters (from 2 to all clusters) and when a job starts, all the other copies are canceled. To select the clusters, they use different heuristics such as MCT, Load Balancing, and Fastest Processor First. This method provides good results but adds an important load to the local resources management systems. Their approach is close to ours because it is also a middleware on top of an existing architecture. They use the multiple submissions to diminish the job response time while we use the reallocation mechanism. Our technique will keep the local resources management system less loaded because each job is only in one queue, but it will need more communications. With the multiple submissions, the first job that starts will send cancellation messages to the other, so this technique is not well suited for heterogeneous platforms where a job starting later can finish earlier.
6
Conclusion and perspectives
We presented two tasks reallocation algorithms and the study of their be-havior in the context of a multi-cluster grid environment. These reallocation algorithms are designed to be used in the meta-scheduling component of a grid framework for example. They perform scheduling and rescheduling with possible reallocations (migration of tasks from one site to another one) with information gathered from local resources managements, which use FCFS or CBF local scheduling policies.
The MCT online heuristic is used to map tasks as soon as they are sub-mitted to the framework, and a reallocation event is triggered once every hour to attempt to improve the schedule. Each reallocation algorithm imple-ments a rescheduling heuristic among MCT, MinMin, MaxMin, MaxGain, MaxRelGain, and Sufferage, and we analyzed and compared results of ex-perimental simulations performed on the basis of traces of real distributed systems (taken from Grid’5000 and from the Parallel Workload Archive) on different metrics, among which the percentage of tasks finishing sooner that if not re-scheduled, and the gain obtained on the average response time.
The key difference between our reallocation algorithms is that the first one considers each task sequentially, both in rescheduling and migrating which implies also possible cancellation; the second one cancels all jobs on every sites, and runs the rescheduling heuristic.
First, the study shows that on average reallocation is beneficial on the considered metrics. Thus, such a mechanism should be embedded in a Grid framework. Second, reallocation achieves even better results when all tasks are canceled and submitted again as a whole bag of tasks. Third, from the simulation experiments involved in this study, one can expect, on average and depending on the platform (level of heterogeneity, local systems load, local resource management policy, etc.), around 5% of tasks finishing sooner with a 10% average gain on the response time compared to a system which does not implement such a mechanism.
However, the first reallocation mechanism is less complex to implement and maintain, and ensures gain, in the sens that we can be sure that every-thing will go as planned even in a non-dedicated environment: a task can be submitted to another site, the server can ensure that the ECT is as expected by the meta-scheduler with some contract checking mechanisms, and then be canceled from the originating site’s batch system. In a non-dedicated en-vironment, the second algorithm would issue the fact that other-and-direct submissions to the local resource manager can take place, and all canceled tasks would be delayed. Nonetheless, we plan as future work for SPADES2
to maintain a set of reserved resources of a site which are managed by our own batch scheduler. In this context resources are dedicated to our Grid framework and thus, this second mechanism can be fully exploited.
References
[1] Albeaus Bayucan, Robert L. Henderson, Casimir Lesiak, Bhroam Mann, Thomas Proett, and Dave Tweten. Portable batch system: Ex-ternal reference specification. Technical report, MRJ Technology Solu-tions, November 1999.
[2] Marta Beltr´an and Antonio Guzm´an. The Impact of Workload Vari-ability on Load Balancing Algorithms. Scalable Computing: Practice
and Experience, 10(2):131–146, June 2009.
[3] Rapha¨el Bolze, Franck Cappello, Eddy Caron, Michel Dayd´e, Fr´ed´eric Desprez, Emmanuel Jeannot, Yvon J´egou, St´ephane Lanteri, Julien Leduc, Noredine Melab, Guillaume Mornet, Raymond Namyst, Pas-cale Primet, Benjamin Quetier, Olivier Richard, El-Ghazali Talbi, and Touch´e Irena. Grid’5000: A Large Scale and Highly Reconfigurable
perimental Grid Testbed. International Journal of High Performance
Computing Applications, 20(4):481–494, 2006.
[4] Yves Caniou, Eddy Caron, Ghislain Charrier, and Fr´ed´eric Desprez. Meta-Scheduling and Task Reallocation in a Grid Environment. In The
Third International Conference on Advanced Engineering Computing and Applications in Sciences (ADVCOMP’09), pages 181–186, Sliema,
Malta, October 11-16 2009.
[5] Yves Caniou and Jean-S´ebastien Gay. Simbatch: An API for simulating and predicting the performance of parallel resources managed by batch systems. In Workshop on Secure, Trusted, Manageable and Controllable
Grid Services (SGS), held in conjunction with EuroPar’08, volume 5415
of LNCS, pages 217–228, 2009.
[6] Nicolas Capit, Georges Da Costa, Yiannis Georgiou, Guillaume Huard, Cyrille Martin, Gr´egory Mouni´e, Pierre Neyron, and Olivier Richard. A Batch Scheduler with High Level Components. CoRR, abs/cs/0506006:9, 2005.
[7] Eddy Caron and Fr´ed´eric Desprez. DIET: A Scalable Toolbox to Build Network Enabled Servers on the Grid. International Journal of High
Performance Computing Applications, 20(3):335–352, 2006.
[8] Henri Casanova, Arnaud Legrand, and Martin Quinson. SimGrid: a Generic Framework for Large-Scale Distributed Experiments. In 10th
IEEE International Conference on Computer Modeling and Simulation,
March 2008.
[9] Dror G. Feitelson and Larry Rudolph. Metrics and Benchmarking for Parallel Job Scheduling. In Proceedings of the Workshop on Job
Schedul-ing Strategies for Parallel ProcessSchedul-ing (IPPS/JSSPP ’98), pages 1–24,
London, UK, 1998. Springer-Verlag.
[10] Dror G. Feitelson, Larry Rudolph, and Uwe Schwiegelshohn. Parallel job scheduling - a status report. In Job Scheduling Strategies for Parallel
Processing, 2004.
[11] Dror G. Feitelson and Dan Tsafrir. Workload Sanitation for Perfor-mance Evaluation. In IEEE International Symposium on PerforPerfor-mance
Analysis of Systems and Software (ISPASS), pages 221–230, Austin,
Texas, March 2006.
[12] Wolfgang Gentzsch. Sun Grid Engine: Towards Creating a Compute Power Grid. Cluster Computing and the Grid, IEEE International
[13] Francesc Guim and Julita Corbal´an. A Job Self-scheduling Policy for HPC Infrastructures. In Job Scheduling Strategies for Parallel
Process-ing (JSSPP), 2008.
[14] David Jackson, Quinn Snell, and Mark Clement. Core Algorithms of the Maui Scheduler. In JSSPP ’01: Revised Papers from the 7th
Inter-national Workshop on Job Scheduling Strategies for Parallel Processing,
pages 87–102, London, UK, 2001. Springer-Verlag.
[15] Subramanian Kannan, Mark Roberts, Peter Mayes, Dave Brelsford, and Joseph Skovira. Workload Management with LoadLeveler. IBM Press, 2001.
[16] David A. Lifka. The ANL/IBM SP scheduling system. In In Job
Scheduling Strategies for Parallel Processing, pages 295–303.
Springer-Verlag, 1995.
[17] Muthucumaru Maheswaran, Shoukat Ali, Howard Jay Siegel, Debra Hensgen, and Richard F. Freund. Dynamic Matching and Scheduling of a Class of Independent Tasks onto Heterogeneous Computing Systems.
Journal of Parallel and Distributed Computing, 59:107–131, 1999.
[18] Marco A. S. Netto and Rajkumar Buyya. Rescheduling Co-Allocation Requests based on Flexible Advance Reservations and Processor Remapping. In 9th IEEE/ACM International Conference on Grid
Com-puting (GRID’08), pages 144–151, Tsukuba, Japon, September 2008.
[19] Gerald Sabin, Rajkumar Kettimuthu, Arun Rajan, and Ponnuswamy Sadayappan. Scheduling of Parallel Jobs in a Heterogeneous Multi-site Environment. In Job Scheduling Strategies for Parallel Processing, pages 87–104, 2003.
[20] Mitsuhisa Sato, Hidemoto Nakada, Satoshi Sekiguchi, Satoshi Mat-suoka, Umpei Nagashima, and Hiromitsu Takagi. Ninf: A Network Based Information Library for Global World-Wide Computing Infras-tructure. In HPCN Europe, pages 491–502, 1997.
[21] Uwe Schwiegelshohn, Andrai Tchernykh, and Ramin Yahyapour. On-line scheduling in grids. In Parallel and Distributed Processing, 2008.
IPDPS 2008. IEEE International Symposium on, pages 1–10, April
2008.
[22] Uwe Schwiegelshohn and Ramin Yahyapour. Analysis of first-come-first-serve parallel job scheduling. In SODA’98: Procs of the 9th
an-nual ACM-SIAM symposium on Discrete algorithms, pages 629–638,
Philadelphia, PA, USA, 1998. Society for Industrial and Applied Math-ematics.
[23] Ozan Sonmez, Nezih Yigitbasi, Alexandru Iosup, and Dick Epema. Trace-Based Evaluation of Job Runtime and Queue Wait Time Pre-dictions in Grids. In International Symposium on High Performance
Distributed Computing (HPDC’09), June 11-13 2009.
[24] Jianhui Yue. Global Backfilling Scheduling in Multiclusters. Lecture
Centre de recherche INRIA Bordeaux – Sud Ouest : Domaine Universitaire - 351, cours de la Libération - 33405 Talence Cedex Centre de recherche INRIA Lille – Nord Europe : Parc Scientifique de la Haute Borne - 40, avenue Halley - 59650 Villeneuve d’Ascq
Centre de recherche INRIA Nancy – Grand Est : LORIA, Technopôle de Nancy-Brabois - Campus scientifique 615, rue du Jardin Botanique - BP 101 - 54602 Villers-lès-Nancy Cedex
Centre de recherche INRIA Paris – Rocquencourt : Domaine de Voluceau - Rocquencourt - BP 105 - 78153 Le Chesnay Cedex Centre de recherche INRIA Rennes – Bretagne Atlantique : IRISA, Campus universitaire de Beaulieu - 35042 Rennes Cedex Centre de recherche INRIA Saclay – Île-de-France : Parc Orsay Université - ZAC des Vignes : 4, rue Jacques Monod - 91893 Orsay Cedex
Centre de recherche INRIA Sophia Antipolis – Méditerranée : 2004, route des Lucioles - BP 93 - 06902 Sophia Antipolis Cedex
Éditeur
INRIA - Domaine de Voluceau - Rocquencourt, BP 105 - 78153 Le Chesnay Cedex (France)