HAL Id: inserm-02468222
https://www.hal.inserm.fr/inserm-02468222
Submitted on 5 Feb 2020HAL is a multi-disciplinary open access archive for the deposit and dissemination of sci-entific research documents, whether they are pub-lished or not. The documents may come from teaching and research institutions in France or abroad, or from public or private research centers.
L’archive ouverte pluridisciplinaire HAL, est destinée au dépôt et à la diffusion de documents scientifiques de niveau recherche, publiés ou non, émanant des établissements d’enseignement et de recherche français ou étrangers, des laboratoires publics ou privés.
Low socioeconomic position and neighborhood
deprivation are associated with uncontrolled asthma in
elderly
Sofia Temam, Sébastien Chanoine, Annabelle Bédard, Orianne Dumas,
Margaux Sanchez, Marie-Christine Boutron-Ruault, Valérie Siroux, Stéphane
Rican, Raphaëlle Varraso, Nicole Le Moual
To cite this version:
Sofia Temam, Sébastien Chanoine, Annabelle Bédard, Orianne Dumas, Margaux Sanchez, et al.. Low socioeconomic position and neighborhood deprivation are associated with uncontrolled asthma in elderly. Respiratory Medicine: COPD Update, Elsevier, In press, 158, pp.70-77. �10.1016/j.rmed.2019.09.010�. �inserm-02468222�
TITLE:LOW SOCIOECONOMIC POSITION AND NEIGHBORHOOD DEPRIVATION ARE ASSOCIATED WITH UNCONTROLLED ASTHMA IN ELDERLY
AUTHORS
Sofia Temama,b,c, Sébastien Chanoined,e,f, Annabelle Bédarda,b, Orianne Dumasa,b, Margaux Sancheza,b, Marie-Christine Boutron-Ruaultc,g, Valérie Sirouxd,e,f, Stéphane Ricanh, Raphaëlle Varrasoa,b, Nicole Le Mouala,b
AFFILIATIONS
a. INSERM U1168, VIMA: Aging and chronic diseases. Epidemiological and public health approaches, F-94807, Villejuif, France
b. Univ. Versailles Saint-Quentin-en-Yvelines, UMR-S 1168, F-78180, Montigny le Bretonneux, France
c. Univ. of Paris-Sud, Faculty of Medicine, UMR-S 1018, F- 94276, Le Kremlin-Bicêtre, France d. IAB, Team of Environmental Epidemiology Applied to Reproduction and Respiratory Health, UGA
– INSERM U1209 – CNRS UMR 5309, F-38700, La Tronche, France e. Univ. Grenoble Alpes, F-38400, Saint-Martin-d'Hères, France
f. Pôle Pharmacie, CHU Grenoble Alpes, F-38700, La Tronche, France
g. INSERM U1018, Centre de recherche en Epidémiologie et Santé des Populations (CESP), équipe ‘Mode de vie, gènes et santé : épidémiologie intégrée trans-générationnelle’, F-94807, Villejuif, France
CORRESPONDING AUTHOR Marie-Christine Boutron-Ruault
Center for research in Epidemiology and Population Health (CESP), UMRS 1018, Health across generation team
114 rue Edouard Vaillant 94805 Villejuif, France.
Telephone number: +33(0)142116466. Fax number: +33(0)142114000.
ABSTRACT
Background While uncontrolled asthma in adults is frequent in Europe, the impact of socioeconomic position (SEP) was little investigated. We aimed to investigate the respective association of individual- and area-level SEP with uncontrolled asthma among French elderly women.
Methods Analyses were conducted in the Asthma-E3N study, among participants with current asthma (i.e., asthma attacks, treatment, or symptoms in previous year). Asthma control was evaluated using Asthma Control Test (uncontrolled: score ≤19); SEP was defined at both individual- and area-level, using educational level (low, medium, high), the French Deprivation index (tertiles defined at national level), and by merging them in a combined-SEP index. Associations between SEP and asthma control were estimated for 2,258 women by logistic regression adjusted for age. Analyses were stratified by asthma controller medication use estimated through a drug reimbursement database.
Results Women were 70 years on average and 24% had uncontrolled asthma. A low educational level (11%) was associated with an increased risk of uncontrolled asthma [odds ratio (95% confidence interval) =1.9(1.4,2.6)], especially among women not using controller medication [3.1(1.9,5.1)]. Using the combined-SEP index, the highest risk of uncontrolled asthma was observed among women with the most disadvantaged socioeconomic profile (low educational level and low-SEP neighborhood) [2.5(1.5,4.2)].
Conclusions Women with low SEP had more often uncontrolled asthma, which might be partly explained by inadequate asthma treatment. To achieve the best management of asthma for elderly patients, a specific attention should be given not only to disadvantaged population and neighborhoods, but also to disadvantaged populations in affluent neighborhoods.
Keywords: asthma control, elderly, neighborhood deprivation, socioeconomic position.
List of abbreviations: ACT, Asthma control test; GINA, Global initiative for asthma; ICS, Inhaled corticosteroids; SABA, Short-acting b2 agonists; SEP, Socioeconomic position.
INTRODUCTION
Asthma is a common chronic respiratory disease affecting more than 350 million people worldwide [1]. Asthma cannot be cured, but can be managed with controller medications for the major part of patients [2]. However, uncontrolled asthma in adults is still frequent in Europe. Several general population studies consistently reported that asthma control is not achieved for 45 to 60% of patients [3]. Poor asthma control is associated with substantial individual morbidity as well as direct and indirect economic costs [4,5].
To date, determinants of asthma control in adults, especially social determinants, have been little studied, in contrast to those investigated for asthma prevalence or incidence [6,7]. In addition, studies on the association between socioeconomic position (SEP) and asthma control in European adults reported mixed results. Some studies using only individual-SEP variables reported an association between low SEP and uncontrolled asthma defined either by GINA guidelines [8], Asthma Control Questionnaires [9], or a heavy use of short-acting beta2 agonists (SABA) [10] whereas others did not found any statistically significant association [11,12]. Mixed results could be partly explained by a heterogeneous evaluation of asthma control. In this context, the use in a same study of complementary methods to define asthma control, either from a multidimensional construct through a self-reported standardized questionnaire or a unidimensional construct based on the number of canisters of SABA as previously suggested [13], may allow clarifying associations between SEP and asthma control. In addition, it is suggested that lower SEP is associated with lower adherence to medical treatment in patients suffering from chronic diseases [14]. A lack of adherence to a controller treatment, the cornerstone of asthma maintenance therapy and a major determinant of asthma control [14], could contribute to social disparities in asthma control. For example, a Danish study showed an association between higher individual SEP, defined by income and educational level, and a higher use of inhaled corticosteroids (ICS) [15].
Regarding the association between area-level SEP and asthma control in adults, the literature is scarce as compared to the literature among children. To our knowledge, only one study, performed in United States, investigated the link between area-level SEP and asthma outcomes (including asthma severity
and quality of life). They found that area-level SEP predicted asthma quality of life but not severity after taking into account individual-SEP [16]. In the European literature, positive correlations between neighborhood deprivation and emergency calls/ visits or hospitalization for asthma attacks were reported in ecological studies suggesting that neighborhood socioeconomic characteristics could play a role in asthma control [17,18]. Both individual- and area-level SEP should therefore be considered together when studying social disparities in asthma control [19,20]. To our knowledge, there is no study evaluating associations between both individual- and area-level SEP with asthma control in adult populations.
The aim of the present study was to investigate the respective association of individual- and area-level SEP with asthma control in a French elderly population. Our study population offered the unique opportunity to test three hypotheses: i) a low individual-SEP is associated with uncontrolled asthma; ii) a regular use of ICS modifies the association; iii) living in low-SEP neighborhood is a risk factor for uncontrolled asthma.
MATERIALS AND METHODS
Population
The E3N study (étude épidémiologique auprès des femmes de la Mutuelle Générale de l’Education
Nationale [MGEN]), is a prospective cohort (1990- ) on chronic diseases, among 98,995 women
members of a French health insurance plan covering employees (and spouses) of the French national education, i.e. teachers of all grades from kindergarten to university, school employees and manual workers, aged 40-65 years at baseline and followed every two years [21]. In order to improve the respiratory characterization of women from E3N, a nested case-control study on asthma (Asthma-E3N) was performed in 2011 [22].
Asthma-E3N study included 7,100 women who reported ever asthma (defined by a positive answer to the single question “Have you ever had an asthma attack?”) at least once between 1992 and 2008 and 14,200 aged-matched “women without asthma” randomly selected (among the remaining). The
Asthma-E3N questionnaire was self-completed and returned by mail (92% response rate) [22]. In addition, for all participants, dispensed non-hospital medications were comprehensively collected from the MGEN drug reimbursement database.
Current asthma
Current asthma was defined among women with ever asthma by the presence of asthma attack, asthma treatment, or asthma-like symptoms (wheezing, woken up with a feeling of chest tightness, attack of shortness of breath at rest, attack of shortness of breath after exercise, or woken up by a shortness of breath attack) in the previous 12 months [22,23].
Asthma control
Asthma control was defined by the Asthma Control Test (ACT), a questionnaire designed and validated to measure the multidimensional nature of asthma control [24]. The questionnaire is
composed of five questions on the last 4-week period: activity limitation (“Did asthma keep you from getting as much done at work or home?”), symptom frequency (“How often have you had shortness of breath?”), sleep interference (“Did asthma symptoms wake you up at night or earlier than usual?”), use of rescue treatment (“Did you use your rescue inhaler or nebulizer medication?”), and a self-rating of control level (“How would you rate your asthma control?”), resulting in a score ranging from 5 to 25 (fully controlled). We used a binary variable with a 19-threshold to identify patients with uncontrolled asthma (≤19) [25].
In addition, we used a complementary evaluation of asthma control based on the number of SABA canisters reimbursed in the last 12 months, derived from the MGEN drug reimbursement database. We created a dichotomous variable, with a cut-off at 6 SABA canisters dispensed in a 12-month period to identify patients with uncontrolled asthma, as proposed by Schatz et al. [13].
Asthma controller medication
The number of canisters of inhaled corticosteroids (ICS, alone or combined) reimbursed in the last 12 months, also derived from the MGEN drug reimbursement database, was considered as a categorical
variable to define non-ICS users (0 canister reimbursed), irregular-ICS users (1 to 3 canister(s)) and regular-ICS users (4 or more canisters) as previously suggested [26,27].
Individual- and area-level SEP
Individual-level SEP was evaluated using women’s educational level collected in 1990, using 3 categories: low (<high school diploma), medium (high school to 2-level university), and high (≥3 level-university). Area-level SEP was evaluated using the French Deprivation index (FDep), an ecological deprivation index generated by principal component analysis from a set of 4 census-derived variables (2009 French national census): the median household income, the percentage of high school graduates in the population aged 15 years and older, the percentage of blue-collar workers in the active population and the unemployment rate [28]. We showed in a previous study that FDep was reliable to capture socioeconomic residential conditions of the E3N women [29]. FDep was calculated at IRIS level, geographical units of 2,000 inhabitants on average (hereafter referred to as neighborhood). FDep was categorized in tertiles (first tertile=lowest deprivation, e.g., high SEP; third tertile=highest
deprivation, e.g., low SEP) for whole France, and then applied to Asthma-E3N women’s previously geocoded residential addresses [30]. We created, as performed in other contexts [20,31–33] a “combined-SEP index” in nine categories from least disadvantaged socioeconomic profile (high educational level + high SEP neighborhood) to most disadvantaged socioeconomic profile (low educational level + low SEP neighborhood; Figure A1 in supplementary materials).
Covariates
Age, smoking status (never vs. ever), overweight (body mass index ≥25kg/m²), health-related quality of life assessed by the Asthma Quality of Life questionnaire (AQLQ) [34], and medical visit for asthma (at least one visit to a general practitioner or a chest specialist in the last 12 months) were recorded in 2011.
Statistical analysis
Cross-sectional associations between SEP and asthma control were evaluated by binary logistic regressions (Reference category: controlled asthma [ACT >19 or ≤6 SABA canisters]).
To test for a potential effect modification by a regular use of an asthma controller treatment, analyses were stratified by ICS use, using only ACT-defined asthma control due to low sample size for uncontrolled asthma estimated with the SABA. To test for a potential neighborhood-SEP effect, we used two approaches [20]: 1) we evaluated if the association between educational level and asthma control differed within the same neighborhood deprivation level by stratifying the association by FDep tertiles; 2) We evaluated the association between the combined-SEP index and asthma control with the least disadvantaged socioeconomic profile as the reference category. The Wald test was used as a formal test for interaction. Tests for linear trend were also computed by considering the categorical variables (i.e. individual education, area-deprivation, and ICS-use level) as continuous variables in the models. Neighborhood dependence between observations was considered using generalized estimated equations (SAS GENMOD procedure) in models including FDep. Since our main objective was to investigate the effect of individual and area-level SEP on asthma control, analyses were adjusted only for age. Indeed, smoking and BMI might be mediators rather than confounders of the investigated association and were not entered in the main model. Sensitivity analyses were performed to test the robustness of the results. The association between individual-SEP and asthma control was stratified by age (<65 vs. ≥65 years), smoking status, and overweight. Analyses were also performed among never smokers to exclude women with potential chronic obstructive pulmonary disease [35]. We run also a model adjusted for age plus smoking and BMI. In addition, we performed a multiple imputation to estimate ACT missing values and to run a sensitivity analysis on the whole population (see detailed method and Table A1 in supplementary materials) [36]. All analyses were performed using the SAS 9.4 statistical software (SAS Institute, Cary, NC).
RESULTS
Population description
Among the 6,274 women who completed the Asthma-E3N questionnaire (response rate: 88%), 3,023 women reported current asthma, among whom those with missing values on educational level or ACT,
were excluded for the main analyses (Figure 1). Women with missing data on educational level or ACT items (n=765), excluded from the main analysis, were slightly older (p=0.07) and less often overweight (p=0.003) than those included, but did not differ regarding the smoking status, educational level, or FDep (not shown).
Figure 1 Flow-chart of the study population (n=2,258)
1 Ever asthma: positive answer to “Have you ever had attacks of breathlessness with wheezing?” OR “have you ever had asthma attacks”;
2 Inconsistent: women who received an “asthmatic questionnaire” but answered no at the question “ever asthma”;
3 Current asthma: women with ever asthma and at least one of 5 symptoms in the last 12 months (wheezing, woken up with a feeling of chest tightness, attack of shortness of breath at rest, attack of shortness of breath after exercise, or woken up by a shortness of breath attack) or asthma treatment or asthma attack in the last 12 months; 4 ACT=Asthma Control Test.
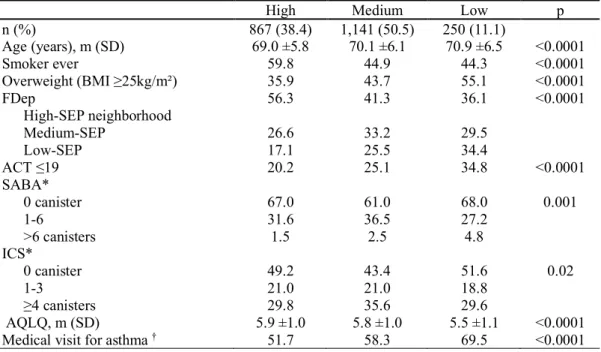
According to SEP characteristics (Table A2), women with low educational level were significantly older, less often ever smoker, and more often overweight than women with higher educational level. In addition, women with low educational level had more medical visits for asthma (i.e. at least one visit to a general practitioner or a chest specialist in the last 12 months) compared to women with higher educational level.
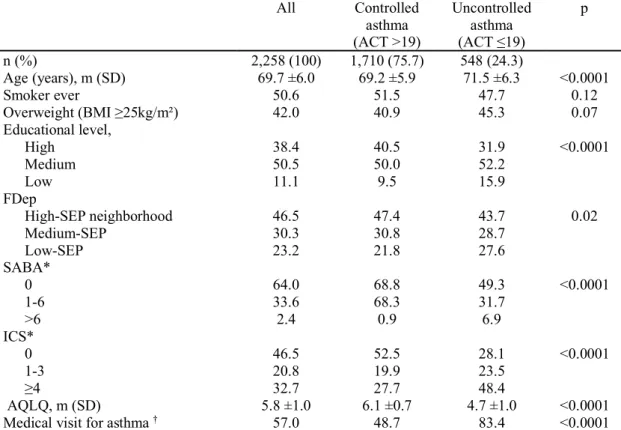
In the study population (main analyses, n=2,258), 24% had uncontrolled asthma defined by ACT and 2% had heavy use of SABA (>6 canisters) (Table 1).
All Controlled asthma (ACT >19) Uncontrolled asthma (ACT ≤19) p n (%) 2,258 (100) 1,710 (75.7) 548 (24.3) Age (years), m (SD) 69.7 ±6.0 69.2 ±5.9 71.5 ±6.3 <0.0001 Smoker ever 50.6 51.5 47.7 0.12 Overweight (BMI ≥25kg/m²) 42.0 40.9 45.3 0.07 Educational level, High 38.4 40.5 31.9 <0.0001 Medium 50.5 50.0 52.2 Low 11.1 9.5 15.9 FDep High-SEP neighborhood 46.5 47.4 43.7 0.02 Medium-SEP 30.3 30.8 28.7 Low-SEP 23.2 21.8 27.6 SABA* 0 64.0 68.8 49.3 <0.0001 1-6 33.6 68.3 31.7 >6 2.4 0.9 6.9 ICS* 0 46.5 52.5 28.1 <0.0001 1-3 20.8 19.9 23.5 ≥4 32.7 27.7 48.4 AQLQ, m (SD) 5.8 ±1.0 6.1 ±0.7 4.7 ±1.0 <0.0001
Medical visit for asthma † 57.0 48.7 83.4 <0.0001
Table 1 Characteristics of the study population, by level of asthma control (ACT-based definition) (n=2,258)
Results are in percent unless otherwise stated, m (SD): mean (standard deviation): p-value from Chi2 test for categorical variable and from student test for continuous variable;
BMI=body mass index, FDep=French Deprivation Index, ACT=Asthma Control Test, ICS=Inhaled corticosteroids, SABA=short acting beta2-agonists, AQLQ=Asthma Quality of Life Questionnaire;
* Number of canisters dispensed in the last 12 months;
† At least one medical visit for asthma (i.e. visit to a general practitioner or a chest specialist) in the last 12 months;
Missing data: smoking status n=14; BMI n=37; FDep n=21; Medical visit for asthma n=51; AQLQ n=338.
Women with uncontrolled asthma were significantly older, had a lower educational level and lived more frequently in low-SEP neighborhoods than women with controlled asthma. Regarding asthma
medications, women with uncontrolled asthma had more asthma treatment reimbursements, but about half of them had no regular-ICS treatment. They also had more frequent medical visits and a lower AQLQ score than women with controlled asthma.
Association between educational level and asthma control
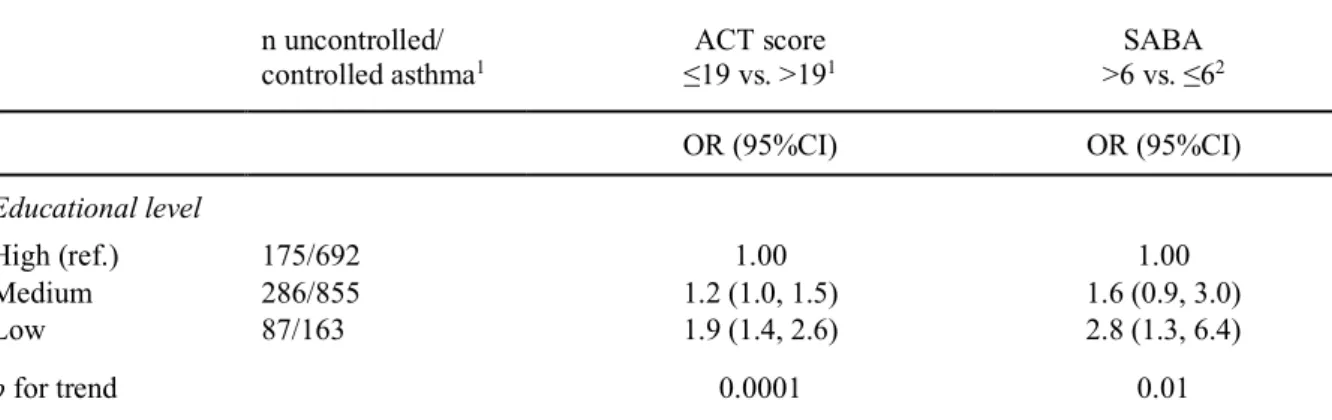
A lower educational level was associated with an increased risk of uncontrolled asthma using both ACT and SABA-based definition (Table 2).
n uncontrolled/
controlled asthma1 ≤19 vs. >19ACT score 1 >6 vs. ≤6SABA 2
OR (95%CI) OR (95%CI) Educational level High (ref.) 175/692 1.00 1.00 Medium 286/855 1.2 (1.0, 1.5) 1.6 (0.9, 3.0) Low 87/163 1.9 (1.4, 2.6) 2.8 (1.3, 6.4) p for trend 0.0001 0.01
Table 2 Age-adjusted association between educational level and asthma control (n=2,258)
Presented results are Odds ratio (95% Confidence Interval) for uncontrolled vs. controlled asthma; test for linear trend was computed by considering educational level as a continuous variable;
ACT= Asthma control test; SABA=short acting beta2-agonists;
1 ACT-based definition: uncontrolled asthma corresponds to ACT score ≤19;
2 SABA-based definition: uncontrolled asthma corresponds to more than 6 SABA canisters dispensed in a 12-month period.
The strength of the association between educational level and asthma control using the ACT-based definition differed according to ICS use (p for interaction=0.008), more specifically it decreased with the increasing use of ICS (Figure 2).
1
Figure 2 Age-adjusted association between educational level and asthma control, stratified by ICS use (n=2,258)
2
Presented results are Odds Ratio (95%Confidence Interval) for uncontrolled (Asthma Control Test ≤19) vs. controlled asthma (ACT>19); p for trend in brackets; 3
The Wald test was used as a formal test for interaction and test for linear trend was computed by considering educational level as a continuous variable; 4
ICS=Inhaled Corticosteroids 5
The strongest association was observed among non-ICS users [3.1 (1.9, 5.1), for low vs. high 6
educational level]. Among women with a regular ICS treatment (≥4 canisters/year), the odds ratio was 7
almost 2.5-fold lower than for women with no ICS treatment [1.3 (0.8, 2.2)] and the association was 8
no longer significant. 9
Association between educational level, neighborhood deprivation, and asthma control 10
The association between educational level and asthma control (ACT) stratified by FDep showed 11
similar trends within each level of neighborhood SEP with an increased risk of uncontrolled asthma 12
for women with the lowest educational level, compared to those with high educational level (Figure 13
A2). The interaction term was not statistically significant (p=0.78). Nevertheless, we observed a 14
significant association between a low educational level and asthma control for women living in high-15
SEP neighborhoods (p for trend=0.003) whereas it was no longer statistically significant among 16
women living in low-SEP neighborhoods (p for trend=0.15). 17
Lastly, using the combined-SEP index, we observed that women with a more disadvantaged 18
socioeconomic profile were more likely to have uncontrolled asthma than women with a less 19
disadvantaged socioeconomic profile (Figure 3). 20
21
Figure 3 Age-adjusted association between combined-SEP index1 and asthma control (n=2,258)
22
Presented results are Odds Ratio (95% Confidence Interval) for uncontrolled (Asthma Control Test ≤19) vs. controlled asthma (C: ACT>19); p for trend=0.008 (test for linear 23
trend was computed by considering the combined-SEP index as a continuous variable); 24
1 Combined-SEP index = educational level + French Deprivation index, reference category= least disadvantaged women (high educational level + high-SEP neighborhood; 25
see also Figure A1). 26
The trend was less clear among women in the intermediate socioeconomic profile. The highest odds 27
ratio [2.5 (1.5, 4.2)] was observed for women with the most disadvantaged socioeconomic profile (low 28
educational level and low-SEP neighborhood). 29
Sensitivity analyses 30
Analyses stratified by age, smoking status, and overweight (Figure A3) or restricted to non-smokers 31
(Table A3) showed a consistent increased risk of uncontrolled asthma with low educational level in 32
each subgroup. The model adjusted for age plus smoking and BMI showed similar results than those 33
from the main analysis (not shown). After multiple imputation, 649 additional women with 1 to 5 34
missing ACT-items (Figure 1) were included in the analyses. They reported significantly less asthma 35
symptoms and had less asthma treatment reimbursement (Table A4). Using the imputed data 36
(n=2,907), we observed similar results to those presented above, either using educational level [1.2 37
(1.1, 1.3) and 1.8 (1.6, 2.0) for medium and low educational level respectively, vs. high] or the 38
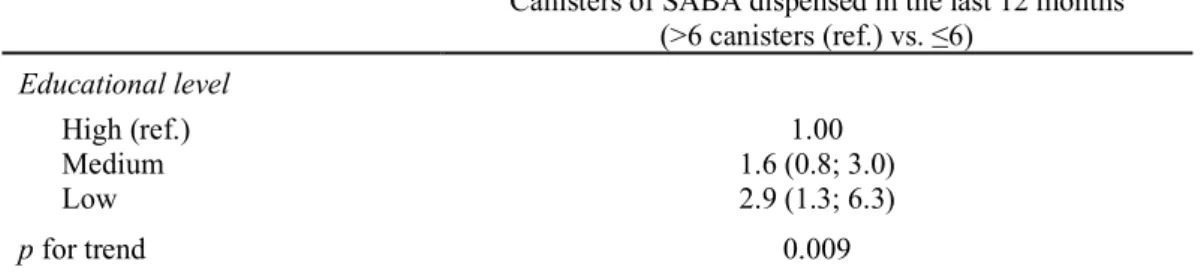
combined-SEP index (Figure A4). Associations between educational level and SABA, performed on 39
the whole population (Table A5), showed similar results as those described in Table 2. 40
DISCUSSION 41
To the best of our knowledge, this is the first study to investigate associations between SEP, defined at 42
individual- and area-level, and asthma control among an elderly population with current asthma. 43
Uncontrolled asthma, evaluated either by questionnaire or by reliever medication use, was more 44
frequent among women with medium and low educational level compared with women with high 45
educational level. A social gradient was observed for both estimates. The stratified analysis by ICS use 46
showed that the association persisted only among women with no regular ICS treatment. Furthermore, 47
individual and neighborhood SEP seemed to have independent impacts on asthma control. A higher 48
risk of uncontrolled asthma was observed among women living in low-SEP neighborhoods compared 49
to those living in high-SEP neighborhoods whatever their educational level, but also among women 50
with low educational level living in high-SEP neighborhoods. 51
Our findings of social disparities in asthma control in this elderly women population were consistent 52
with two previous studies using also individual educational level in younger populations with asthma 53
[8,9]. However, in these two studies, they found a significant association only among participants with 54
the lowest educational level. Interestingly, analysis stratified by ICS use showed that the association 55
between low-SEP and uncontrolled asthma persisted only among women with no regular ICS treatment. 56
Similarly, previous studies did not found any significant association between educational level and 57
asthma control or symptoms frequency among patients with regular asthma maintenance treatment 58
[12,37]. Such results suggest that the association between educational level and asthma control could 59
partly be explained by an inappropriate asthma treatment or a suboptimal asthma management [26]. In 60
our population, half women had no ICS reimbursement in the past 12 months but most of them had a 61
controlled asthma according to the ACT, suggesting that they had rather a mild asthma that can be 62
controlled with “as-needed SABA with no controller” according to GINA severity criteria [38]. 63
However, almost one third of the women with uncontrolled asthma had no ICS reimbursement at all, a 64
proportion relatively consistent with the literature [39] and we observed the highest social disparities for 65
asthma control for these women. It is recognized that asthma is underdiagnosed and undertreated in 66
elderly patients [40]. Older people with asthma tend to underestimate the seriousness of their disease 67
[40] and do not spontaneously report their symptoms to the general practitioners [41]. The 68
underreporting of asthma symptoms could be more frequent in elderly women with low education level, 69
potentially because of lower expectations about their health [42], which could lead to inappropriate 70
asthma treatment. Furthermore, it has been underlined that adherence to long term treatment in chronic 71
illness is unequally distributed across SEP with poorer adherence among low-SEP patients [43]. 72
Individual- and area-level SEP seem to have independent impacts on asthma control. First, when 73
stratifying analyses by FDep, we observed a significant association between a low educational level and 74
asthma control among women living in the higher SEP neighborhoods. Although interaction test was 75
not statistically significant, negative health outcomes for low-SEP persons living in high-SEP 76
neighborhoods were similarly observed in other study settings [32]. This result could reflect that 77
resources and benefices generally associated with high-SEP neighborhoods could not be used or 78
mobilized by the entire population [44]. For example, in France, in high-SEP urban neighborhoods, 79
doctors’ fees are often higher than average and not fully reimbursed by social security system, putting 80
the poorest people living in these neighborhoods out of the way. Cultural and social barriers may also 81
contribute to fostering a lower access to care. According to the relative deprivation hypothesis [20,44], 82
a large gap between some individuals’ situations and the other people living nearby could affect health 83
through psychosocial stress [45], which is a risk factor for poor asthma outcomes [46,47]. Second, when 84
using the combined-SEP index, we found that women with the most disadvantaged socioeconomic 85
profile had a two-fold higher risk of uncontrolled asthma compared with women with the least 86
disadvantaged socioeconomic profile. Besides inappropriate asthma treatment, the cumulative impact 87
of environmental hazards and social stressors (i.e. poor housing conditions, limited access to health-88
food, etc.) encountered by people who live in low-SEP neighborhoods might partly explain this result 89
[48]. 90
Our study, which is the first to investigate the role of both individual- and area-level SEP on asthma 91
control among elderly women, has some potential limitations and several strengths. Due to low sample 92
size in some strata of the combined-SEP index (9 categories), specific hypotheses were tested only for 93
individual-SEP. The individual-SEP was assessed solely with educational level; however, we believe 94
that it is the most appropriate SEP indicator in our population compared to income information for 95
example (not available) [49]. Asthma treatments in France are fully covered by public health insurance 96
when a doctor has prescribed the treatment, thus material disadvantage in access to asthma treatment 97
are unlikely to explain social disparities in asthma control observed among non-regular ICS users [44]. 98
The E3N population is not representative of the general French elderly population and has higher 99
educational level and probably healthier conditions. However, even in this specific population, we found 100
social disparities in asthma control with a marked social gradient. Regarding the asthma control 101
definition, a substantial proportion of women did not complete the ACT at all (22%) but the sensitivity 102
analysis using imputed data showed consistent results compared with those obtained with the complete-103
case analysis, although strength of the associations was slightly lower. One possible explanation is that 104
women who did not respond to the ACT had no current asthma and therefore did not feel concerned by 105
evaluating asthma control over the past 4 weeks. A misclassification between asthma and COPD may 106
occur in our elderly population [40]. However, Sanchez et al. showed that the anticholinergic use was 107
low among E3N women suggesting that number of COPD cases is low in this population [27]. Also 108
results from the sensitivity analysis restricted to women who never smoked were very similar to the 109
findings in the entire population. The robustness of the results in a large population of women with 110
current asthma is an important strength of our study. We used two different methods to assess asthma 111
control with consistent results. SABA dispensed in a 1-year period reflect asthma control over the long 112
term, whereas ACT, a multidimensional concept that encompasses at least three domains of the disease 113
(symptoms, exacerbations, and activity limitations), reflects asthma control over a short period of time 114
(few weeks) [50]. To evaluate asthma treatment (SABA and ICS), we used objective data from a 115
comprehensive drug database which reduced potential reporting or recall biases and is particularly 116
relevant in such an elderly population [51]. The relative homogeneity of E3N women in term of 117
sociodemographic characteristics is also an asset to study contextual effects. Furthermore, there was a 118
low percentage of movers in the population [30] and women had resided on average at least 20 years at 119
their last known address (not shown), which limited a potential healthy mover effect [29]. 120
In conclusion, our study suggested negative effects of both low individual- and area-level SEP on 121
asthma control that could partly be explained by an inappropriate asthma treatment, care, or access to 122
health services. To achieve the best management of asthma for elderly patients, a specific attention 123
should be given not only to disadvantaged population and neighborhoods, but also to disadvantaged 124
populations in affluent neighborhoods. 125
COMPETING INTERESTS 126
The authors declare that they have no conflicts of interest. 127
128
ACKNOWLEDGEMENTS 129
The authors are grateful for the help received from Marie Fangon, Maryvonne Niravong, Lyan Hoang 130
(Inserm, CESP, Centre for Research in Epidemiology and Population Health, UMRS 1018, Health 131
across generation team, Villejuif, France) for the implementation of the study. They are indebted to all 132
the participants for their high involvement in the E3N study, and without whom the study would not 133
have been possible. We thank Sylvie Sriharan for her contribution to the analyses. 134
FUNDING SOURCES 135
This work was supported by a grant of The Institut pour la Recherche en Santé Publique (IRESP), and 136
of the joint help of Direction Générale de la Santé (DGS), Mission recherche de la Direction de la 137
recherche, des études, de l’évaluation et des statistiques (Mire-DREES), Caisse nationale d’assurance 138
maladie des travailleurs salariés (CNAMTS), Régime Social des Indépendants (RSI) & Caisse 139
nationale de solidarité pour l’autonomie (CNSA). The E3N study is supported by the Mutuelle 140
Générale de l’Education Nationale (MGEN); the French League against Cancer (LNCC); Gustave 141
Roussy; and the French Research Agency (ANR grant, ANR-10-COHO-0006). 142
REFERENCES 144
1. Soriano JB, Abajobir AA, Abate KH, Abera SF, Agrawal A, Ahmed MB, et al. Global, regional, and national 145
deaths, prevalence, disability-adjusted life years, and years lived with disability for chronic obstructive 146
pulmonary disease and asthma, 1990–2015: a systematic analysis for the Global Burden of Disease Study 2015. 147
Lancet Respir Med. 2017;5:691–706. 148
2. Schatz M. Predictors of asthma control: what can we modify? Curr Opin Allergy Clin Immunol. 2012;12:263– 149
8. 150
3. Demoly P, Annunziata K, Gubba E, Adamek L. Repeated cross-sectional survey of patient-reported asthma 151
control in Europe in the past 5 years. Eur Respir Rev. 2012;21:66–74. 152
4. Doz M, Chouaid C, Com-Ruelle L, Calvo E, Brosa M, Robert J, et al. The association between asthma 153
control, health care costs, and quality of life in France and Spain. BMC Pulm Med. 2013;13:15. 154
5. O’Byrne PM, Pedersen S, Schatz M, Thoren A, Ekholm E, Carlsson L-G, et al. The Poorly Explored Impact 155
of Uncontrolled Asthma. Chest. 2013;143:511–23. 156
6. Patel S, Henderson J, Jeffreys M, Davey Smith G, Galobardes B. Associations between socioeconomic 157
position and asthma: findings from a historical cohort. Eur J Epidemiol. 2012;27:623–31. 158
7. Uphoff E, Cabieses B, Pinart M, Valdés M, Antó JM, Wright J. A systematic review of socioeconomic 159
position in relation to asthma and allergic diseases. Eur Respir J. 2015;46:364–74. 160
8. Kämpe M, Lisspers K, Ställberg B, Sundh J, Montgomery S, Janson C. Determinants of uncontrolled asthma 161
in a Swedish asthma population: cross-sectional observational study. Eur Clin Respir J. 2014;1:24109. 162
9. De Vries MP, van den Bemt L, Lince S, Muris JWM, Thoonen BPA, van Schayck CP. Factors associated with 163
asthma control. J Asthma. 2005;42:659–65. 164
10. Heibert Arnlind M, Wettermark B, Sjöborg B, Dahlén E, Loikas D, Wikström Jonsson E. Socioeconomic 165
status and the quality of prescribing asthma drugs in Sweden. J Asthma. 2013;50:842–9. 166
11. González Barcala FJ, de la Fuente-Cid R, Álvarez-Gil R, Tafalla M, Nuevo J, Caamaño-Isorna F. Factores 167
asociados con el control del asma en pacientes de atención primaria en España: el estudio CHAS. Arch 168
Bronconeumol. 2010;46:358–63. 169
12. Kondla A, Glaab T, Pedersini R, Lommatzsch M. Asthma control in patients treated with inhaled 170
corticosteroids and long-acting beta agonists: A population-based analysis in Germany. Respir Med. 171
2016;118:58–64. 172
13. Schatz M, Zeiger RS. Improving asthma outcomes in large populations. J Allergy Clin Immunol. 173
2011;128:273–7. 174
14. van Boven JFM, Lavorini F, Dekhuijzen PNR, Blasi F, Price DB, Viegi G. Urging Europe to put non-175
adherence to inhaled respiratory medication higher on the policy agenda: a report from the First European 176
Congress on Adherence to Therapy. Eur Respir J. 2017;49:1700076. 177
15. Davidsen JR, Søndergaard J, Hallas J, Siersted HC, Knudsen TB, Lykkegaard J, et al. Impact of 178
socioeconomic status on the use of inhaled corticosteroids in young adult asthmatics. Respir Med. 179
2011;105:683–90. 180
16. Blanc PD. Area-level socio-economic status and health status among adults with asthma and rhinitis. Eur 181
Respir J. 2006;27:85–94. 182
17. Laurent O, Filleul L, Havard S, Deguen S, Declercq C, Bard D. Asthma attacks and deprivation: gradients in 183
use of mobile emergency medical services. J Epidemiol Community Heal. 2008;62:1014–6. 184
18. Watson JP, Cowen P, Lewis RA. The relationship between asthma admission rates, routes of admission, and 185
socioeconomic deprivation. Eur Respir J. 1996;9:2087–93. 186
19. Evans-Agnew R. Asthma management: an ecosocial framework for disparity research. J Health Dispar Res 187
Pract. 2012;5:1–19. 188
20. Stafford M. Neighbourhood deprivation and health: does it affect us all equally? Int J Epidemiol. 189
2003;32:357–66. 190
21. Clavel-Chapelon F. Cohort Profile: The French E3N Cohort Study. Int J Epidemiol. 2015;44:801–9. 191
22. Bédard A, Serra I, Dumas O, Basagaña X, Clavel-Chapelon F, Le Moual N, et al. Time-Dependent 192
Associations Between Body Composition, Physical Activity, and Current Asthma in Women: A Marginal 193
Structural Modeling Analysis. Am J Epidemiol. 2017;186:21–8. 194
23. Le Moual N, Varraso R, Siroux V, Dumas O, Nadif R, Pin I, et al. Domestic use of cleaning sprays and 195
asthma activity in females. Eur Respir J. 2012;40:1381–9. 196
24. Nathan RA, Sorkness CA, Kosinski M, Schatz M, Li JT, Marcus P, et al. Development of the asthma control 197
test☆A survey for assessing asthma control. J Allergy Clin Immunol. 2004;113:59–65. 198
25. Schatz M, Sorkness CA, Li JT, Marcus P, Murray JJ, Nathan RA, et al. Asthma Control Test: Reliability, 199
validity, and responsiveness in patients not previously followed by asthma specialists. J Allergy Clin Immunol. 200
2006;117:549–56. 201
26. Suissa S. Regular use of inhaled corticosteroids and the long term prevention of hospitalisation for asthma. 202
Thorax. 2002;57:880–4. 203
27. Sanchez M, Bousquet J, Le Moual N, Jacquemin B, Clavel-Chapelon F, Humbert M, et al. Temporal asthma 204
patterns using repeated questionnaires over 13 years in a large French cohort of women. da Silva Nunes M, 205
editor. PLoS One. 2013;8:e65090. 206
28. Rey G, Jougla E, Fouillet A, Hémon D. Ecological association between a deprivation index and mortality in 207
France over the period 1997 - 2001: variations with spatial scale, degree of urbanicity, age, gender and cause of 208
death. BMC Public Health. 2009;9:33. 209
29. Temam S, Varraso R, Pornet C, Sanchez M, Affret A, Jacquemin B, et al. Ability of ecological deprivation 210
indices to measure social inequalities in a French cohort. BMC Public Health. 2017;17:956. 211
30. Jacquemin B, Siroux V, Sanchez M, Carsin A-E, Schikowski T, Adam M, et al. Ambient Air Pollution and 212
Adult Asthma Incidence in Six European Cohorts (ESCAPE). Environ Health Perspect. 2015;123:613–21. 213
31. Borrell LN, Beck JD, Heiss G. Socioeconomic Disadvantage and Periodontal Disease: The Dental 214
Atherosclerosis Risk in Communities Study. Am J Public Health. 2006;96:332–9. 215
32. Winkleby M, Cubbin C, Ahn D. Effect of Cross-Level Interaction Between Individual and Neighborhood 216
Socioeconomic Status on Adult Mortality Rates. Am J Public Health. 2006;96:2145–53. 217
33. Cho KH, Nam CM, Lee EJ, Choi Y, Yoo KB, Lee SH, et al. Effects of individual and neighborhood 218
socioeconomic status on the risk of all-cause mortality in chronic obstructive pulmonary disease: A nationwide 219
population-based cohort study, 2002-2013. Respir Med. Elsevier Ltd; 2016;114:9–17. 220
34. Juniper EF, Buist AS, Cox FM, Ferrie PJ, King DR. Validation of a Standardized Version of the Asthma 221
Quality of Life Questionnaire. Chest. 1999;115:1265–70. 222
35. Soriano JB, Davis KJ, Coleman B, Visick G, Mannino D, Pride NB. The Proportional Venn Diagram of 223
Obstructive Lung Disease*. Chest. 2003;124:474–81. 224
36. Graham JW, Olchowski AE, Gilreath TD. How many imputations are really needed? Some practical 225
clarifications of multiple imputation theory. Prev Sci. 2007;8:206–13. 226
37. Siroux V, Boudier A, Bousquet J, Bresson J-L, Cracowski J-L, Ferran J, et al. Phenotypic determinants of 227
uncontrolled asthma. J Allergy Clin Immunol. 2009;124:681–7.e3. 228
38. Reddel HK, Bateman ED, Becker A, Boulet L-P, Cruz AA, Drazen JM, et al. A summary of the new GINA 229
strategy: a roadmap to asthma control. Eur Respir J. 2015;46:622–39. 230
39. Afrite A, Allonier C, Com-Ruelle L, Le Guen N. L’asthme en France en 2006 : prévalence et contrôle des 231
symptômes. QES IRDES. 2008;138:1–8. 232
40. Gibson PG, McDonald VM, Marks GB. Asthma in older adults. Lancet. 2010;376:803–13. 233
41. Bellamy D, Harris T. Poor perceptions and expectations of asthma control: Results of the International 234
Control of Asthma Symptoms (ICAS) survey of patients and general practitioners. Prim Care Respir J. 235
2005;14:252–8. 236
42. Delpierre C, Lauwers-Cances V, Datta GD, Lang T, Berkman L. Using self-rated health for analysing social 237
inequalities in health: a risk for underestimating the gap between socioeconomic groups? J Epidemiol 238
Community Heal. 2009;63:426–32. 239
43. Tøttenborg SS, Lange P, Johnsen SP, Nielsen H, Ingebrigtsen TS, Thomsen RW. Socioeconomic inequalities 240
in adherence to inhaled maintenance medications and clinical prognosis of COPD. Respir Med. Elsevier Ltd; 241
2016;119:160–7. 242
44. Mackenbach JP. The persistence of health inequalities in modern welfare states: The explanation of a 243
paradox. Soc Sci Med. 2012;75:761–9. 244
45. Demakakos P, Biddulph JP, de Oliveira C, Tsakos G, Marmot MG. Subjective social status and mortality: 245
the English Longitudinal Study of Ageing. Eur J Epidemiol. Springer Netherlands; 2018;123456789:1–11. 246
46. Wright RJ, Rodriguez M, Cohen S. Review of psychosocial stress and asthma: an integrated biopsychosocial 247
approach. Thorax. 1998;53:1066–74. 248
47. Greaves CJ. Attack context: an important mediator of the relationship between psychological status and 249
asthma outcomes. Thorax. 2002;57:217–21. 250
48. Morello-Frosch R, Zuk M, Jerrett M, Shamasunder B, Kyle AD. Understanding The Cumulative Impacts Of 251
Inequalities In Environmental Health: Implications For Policy. Health Aff. 2011;30:879–87. 252
49. Galobardes B. Indicators of socioeconomic position (part 1). J Epidemiol Community Heal. 2006;60:7–12. 253
50. Schatz M, Zeiger RS, Vollmer WM, Mosen D, Apter AJ, Stibolt TB, et al. Validation of a β-agonist long-254
term asthma control scale derived from computerized pharmacy data. J Allergy Clin Immunol. 2006;117:995– 255
1000. 256
51. Ban G-Y, Trinh THK, Ye Y-M, Park H-S. Predictors of asthma control in elderly patients. Curr Opin Allergy 257
Clin Immunol. 2016;16:237–43. 258
APPENDIX A: SUPPLEMENTARY MATERIALS 259 260 METHODS 261 Multiple imputation: 262 263
We used the multiple imputation method to estimate asthma control among women with missing 264
values on the Asthma Control Test. The multiple imputation aims to allow for the uncertainty about 265
the missing data by creating several different plausible imputed data sets and combining results 266
obtained from each of them (1). 267
Given the rather low proportion of missing data (10.3%) in the dataset (2) and the rejection of the 268
missing completely at random assumption, we assumed a missing at random pattern of missing data 269
and performed 20 imputations using PROC MI SAS procedure (3,4). The set of variables included in 270
the imputation model is shown in Table A1 (5). 271
272
1. Sterne JAC, White IR, Carlin JB, Spratt M, Royston P, Kenward MG et al. Multiple imputation 273
for missing data in epidemiological and clinical research: potential and pitfalls. BMJ 274
2009;338:1–11. 275
2. Chanoine S, Sanchez M, Pin I, Temam S, Le Moual N, Fournier A et al. Multimorbidity-276
medications and poor asthma prognosis. Eur Respir J 2018;:1702114. 277
3. Graham JW, Olchowski AE, Gilreath TD. How many imputations are really needed? Some 278
practical clarifications of multiple imputation theory. Prev Sci 2007;8:206–213. 279
4. SAS Institute. The MIANALYZE Procedure. SAS/STAT® 92 User’s Guid 2008. 280
5. Chevret S, Seaman S, Resche-Rigon M. Multiple imputation: a mature approach to dealing 281
with missing data. Intensive Care Med 2015;41:348–350. 282
TABLES 283
- Age
- Frequency of wheezing in the past 12 months
- Woken up with a feeling of chest tightness in the past 12 months - Attack of shortness of breath (SOB) at rest in the past 12 months - Attack of SOB after exercise in the past 12 months
- Woken by attack of SOB in the past 12 months - Woken by attack of coughing in the last 12 months - Symptoms exacerbations
- Difficulty in breathing - Breathlessness (4 classes)
- Exacerbations in the last 12 months (deterioration in asthma requiring: treatment with an oral corticosteroid, or an emergency department visit or hospitalization or a change of asthma treatment)
- Asthma exacerbations >2 days in the past 12 months - Seasonal asthma exacerbations in the past 12 months - Asthma attacks in the past 3 months
- Woken up because of asthma in the past 3 months - Breath difficulty frequency in the past 3 months - Chronic obstructive pulmonary disease ever - Rhinitis ever
- Eczema ever
- Smoking (never, ex and current smokers)
- Body Mass Index (<20,[20-25[,[25-30[,≥30kg/m²) - Hospitalizations for asthma attacks in the past 12 months - Emergency visit because of asthma in the past 12 months - Medical visit for asthma in the past 12 months
- Asthma Quality of Life Questionnaire score, past 2 weeks
- Number of canisters of Short acting beta agonist dispensed in the past 12 months (claims database)
Table A1 Set of variables included in the imputation model
High Medium Low p n (%) 867 (38.4) 1,141 (50.5) 250 (11.1) Age (years), m (SD) 69.0 ±5.8 70.1 ±6.1 70.9 ±6.5 <0.0001 Smoker ever 59.8 44.9 44.3 <0.0001 Overweight (BMI ≥25kg/m²) 35.9 43.7 55.1 <0.0001 FDep 56.3 41.3 36.1 <0.0001 High-SEP neighborhood Medium-SEP 26.6 33.2 29.5 Low-SEP 17.1 25.5 34.4 ACT ≤19 20.2 25.1 34.8 <0.0001 SABA* 0 canister 67.0 61.0 68.0 0.001 1-6 31.6 36.5 27.2 >6 canisters 1.5 2.5 4.8 ICS* 0 canister 49.2 43.4 51.6 0.02 1-3 21.0 21.0 18.8 ≥4 canisters 29.8 35.6 29.6 AQLQ, m (SD) 5.9 ±1.0 5.8 ±1.0 5.5 ±1.1 <0.0001
Medical visit for asthma † 51.7 58.3 69.5 <0.0001
Table A2 Characteristics of the study population, by educational level (n=2,258)
285
Results are in percent unless otherwise stated, m (SD): mean (standard deviation); 286
BMI=body mass index, FDep=French Deprivation Index, SEP= socioeconomic position, ACT=Asthma Control 287
Test, ICS=Inhaled corticosteroids, SABA=short acting beta2-agonists, AQLQ=Asthma Quality of Life 288
Questionnaire; 289
* Number of canisters dispensed in the last 12 months; 290
† At least one medical visit for asthma in the last 12 months; 291
Missing data: smoking status n=14; BMI n=37; FDep n=21; Medical visit for asthma n=51; Asthma Quality of 292
Life Questionnaire n=338. 293
Educational level n uncontrolled
/controlled asthma High (ref.) Medium Low p for trend
All 283/826 1.00 1.23 (0.89; 1.70) 2.11 (1.36; 3.29) 0.002
Stratified by ICS reimbursed in the last 12 months (p interaction= 0.15) 0 canister of ICS 81/401 1.00 0.93 (0.52; 1.65) 3.36 (1.69; 6.68) 0.003 1-3 canister(s) 63/171 1.00 1.29 (0.65; 2.55) 1.53 (0.56; 4.15) 0.36 ≥4 canisters 139/254 1.00 1.23 (0.74; 2.03) 1.53 (0.73; 3.21) 0.25 Stratified by FDep (p interaction= 0.29) High-SEP neighborhood 126/377 1.00 1.63 (1.02; 2.64) 2.54 (1.26; 5.14) 0.005 Medium-SEP 85/257 1.00 1.00 (0.56; 1.79) 2.10 (0.93; 4.79) 0.15 Low-SEP 70/184 1.00 0.76 (0.38; 1.53) 1.35 (0.60; 3.04) 0.52
Table A3 Age-adjusted association between educational level and asthma control among never smokers (n=1,109)
294
OR (95%CI) for uncontrolled (Asthma Control Test ≤19) vs. controlled asthma (ACT>19); 295
ICS=inhaled corticosteroids, FDep = French Deprivation index (missing n=10), SEP: socioeconomic position. 296
Women with no current
asthma (n=758) Women with current asthma (n=3,023)
Full data on ACT Missing data on ACT
Controlled
asthma Uncontrolled asthma 1-4 missing ACT items 5 missing ACT-items
n (%) 758 (100.0) 1,774 (58.7) 576 (19.1) 107 (3.5) p
value† (18.7) 566 valuep † valuep ††
Age, m ±s 68.3 ±5.6 69.2 ±5.9 71.5 ±6.3 73.3 ±6.7 *** 69.7 ±5.9 NS ***
BMI, ≥25kg/m² 27.3 41.0 45.8 35.9 NS 35.4 * ***
Smoking ever 48.3 51.2 46.9 43.0 NS 52.0 NS NS
Asthma-like symptoms
Wheezing and SOB 0.0 33.1 67.5 42.5 * 18.1 *** -
SOB at rest 0.0 19.3 50.0 29.7 * 16.7 NS -
SOB after exercise 0.0 70.8 84.7 75.5 NS 81.2 *** -
Woken chest tight 0.0 33.8 67.5 42.3 NS 28.0 ** -
Woken SOB attack 0.0 14.2 44.0 20.0 NS 11.3 NS -
ICS reimbursements*
0 canister 84.0 52.4 27.8 44.9 ** 76.7 *** ***
1-3 canister(s) 9.8 19.8 23.4 10.3 11.6
≥4 canisters 6.2 27.8 31.6 44.9 11.8
SABA reimbursements*, m ±s 0.12 ±0.6 0.62 ±1.4 1.67 ±7 0.69 ±1.6 NS 0.29 ±1.1
Low educational level 8.7 9.5 15.9 9.7 NS 10.8 NS NS
Low-SEP neighborhood (FDep) 22.4 21.9 27.9 20.6 NS 19.1 NS NS
Table A4 Women characteristics according to asthma status and response to ACT
297
Results are in percent unless otherwise stated, m ±sd: mean ±standard deviation; 298
ACT=Asthma Control Test, BMI=body mass index, SOB= shortness of breath, ICS=Inhaled corticosteroids, SABA=short acting beta2-agonists, FDep=French Deprivation 299
Index, SEP: socioeconomic position; 300
* Number of canisters dispensed in the last 12 months; 301
† p value (t-test or chi2) comparing to women with controlled asthma; 302
† † p value (t-test or chi2) comparing to women with no current asthma; 303
Statistical significance: non-significant (NS) >0.05, * ≤0.05, ** ≤0.01, *** <0.0001. 304
Canisters of SABA dispensed in the last 12 months (>6 canisters (ref.) vs. ≤6) Educational level High (ref.) 1.00 Medium 1.6 (0.8; 3.0) Low 2.9 (1.3; 6.3) p for trend 0.009
Table A5 Age-adjusted association between educational level and number of canisters of SABA dispensed,
305
imputed data (n=2,907)
306
OR (95%CI), SABA= short acting beta2-agonists. 307
FIGURES 308
309
Figure A1 Percentage of women from the Asthma-E3N study with uncontrolled asthma (Asthma Control Test ≤19) by educational level and area-level SEP
310
Columns: French Deprivation Index; Lines: Educational level; Numbers on the bars correspond to: n uncontrolled asthma/n total. 311 312 123/468 27/88 49/229 80/377 27/72 37/146 32/84 81/289 Most disadvantaged SEP profile Least disadvantaged SEP profile 87/484
313
Figure A2 Age-adjusted association between educational level and asthma control, stratified by FDep (n=2,258)
314
OR (95%CI) for uncontrolled (Asthma Control Test ≤19) vs. controlled asthma (ACT>19); p for trend in brackets; 315
The Wald test was used as a formal test for interaction and test for linear trend was computed by considering educational level as a continuous variable; 316
FDep=French Deprivation index 317
318
Figure A3 Age-adjusted association between educational level and asthma control (ACT), stratified by age, smoking and overweight
319
OR (95%CI) for uncontrolled (Asthma Control Test ≤19) vs. controlled asthma (ACT>19); Overweight (body mass index ≥25kg/m²); 320
P-value for interaction: age (<65 / >=65 years old) p=0.72; smoking (never/ever smokers) p=0.69; overweight (yes/no) p=0.38. The Wald test was used as a formal test for 321
interaction. 322
324
Figure A4 Age-adjusted association between combined-SEP1 and asthma control (ACT), imputed data (n=2,907)
325
OR (95%CI) for uncontrolled (Asthma Control Test ≤19) vs. controlled asthma (ACT>19); 326
1 Combined-SEP = educational level + French Deprivation index, reference category= least disadvantaged women (high educational level + high-SEP neighborhoods; see also 327
Figure A1) 328